columbia spotted frog - united states fish and wildlife … spotted frog (rana luteiventris) 2006...
TRANSCRIPT

Columbia Spotted Frog Columbia Spotted Frog (Rana luteiventris) (Rana luteiventris)
2006 Monitoring Report 2006 Monitoring Report Dry Creek, Oregon Dry Creek, Oregon
Prepared for the Vale District, Bureau of Land Management Prepared for the Vale District, Bureau of Land Management
Janice C. Engle Janice C. Engle Sacramento Fish and Wildlife Office Sacramento Fish and Wildlife Office
US Fish and Wildlife Service US Fish and Wildlife Service 2800 Cottage Way Room 2605 2800 Cottage Way Room 2605
Sacramento, CA 95825 Sacramento, CA 95825
i

Contributing Researchers
Ray Hennekey Idaho Department of Fish and Game
1540 Warner Avenue Lewiston, ID 83501
Marisa Meyer
LaGrande Field Office US Fish and Wildlife Service
3502 Highway 30 LaGrande, OR 97850
Keith Paul
Red Bluff Field Office US Fish and Wildlife Service
10950 Tyler Road Red Bluff, CA 96080
W. Chris Funk
USGS Forest and Rangeland Ecosystem Science Center 3200 SW Jefferson Way
Corvallis, OR 97331
Laura Kessel US Fish and Wildlife Service
Idaho Fish Health Center P.O. Box 272 Orofino, ID 83544
Kenneth Lujan
US Fish and Wildlife Service Lower Columbia River Fish Health Center
201 Oklahoma Road Willard, WA 98605
ii

iii
Table of Contents I. Introduction..............................................................................................................1
II. Monitoring Results...................................................................................................6
III. Additional Studies..................................................................................................16
IV. Discussion..............................................................................................................17
V. Appendix I. Monitoring Methods .........................................................................25
VI. Appendix II. Habitat/Land Use Ratings.................................................................26
VII. Appendix III. National Fish Health Survey ..........................................................27
VIII. Appendix IV. Capture Data (2001-2006) .............................................................28

Insert Landmark Locations Map Here
iv

Introduction This report summarizes the results of the sixth year of the Dry Creek Monitoring project for Columbia spotted frogs (Rana luteiventris), with incidental observations of other herpetofauna. The protocol followed for this survey is described in Appendix I. The spring of 2006 brought high water events in the Dry Creek area that resulted in new scour, fence destruction, and flooding above the normal riparian corridor (Figure 1). The area downstream of the natural exclosure was subjected to a widespread flow of water across the historical deposition bar, flushing the small pools adjacent to the southern rock outcropping (previously occupied by spotted frogs) and eroding the bank wherever solid rock outcroppings were not found. The water returned to the most recent stream channel at low flow.
Figure 1. High water flow path from heavy spring rains.
In other stream reaches, undercut banks were turned over, new oxbow scour pools developed, and stream channels were altered (Figure 2). Evidence of high water was apparent throughout the survey transect, and the extent of habitat damage was dependent upon the resistance of the streambanks to increased water velocities.
Figure 2. Effects of high water velocities on bank stability, scour pools, and stream channel sinuosity. Streambanks that had previously been undercut were either torn away or flipped over; several new scour pools developed in overflow channels; and the stream character was changed from a meandering channel through deposition beds to a wide, shallow configuration in the BLM canyon site.
1

Where vegetation was well established (the natural exclosure) (Figure 3) or more stable (downstream of the State section – refer to Figure 15), riparian habitat loss was minimized.
Figure 3. Results of high water flow within the natural exclosure. (1) loss of emergent vegetation where water was funneled between rock outcrops on the downstream end, (2) most of the cattails, rose, and dogwood held, despite submersion in the high water event, and (3) scour at the upstream end of the canyon, where direct high water flow hit the gravel bar.
1.
2.
Flow direction
3.
2

Although aquatic habitat connectivity was uniform in the spring, by late summer, pockets of suitable wet habitat were isolated by stretches of dry streambed along the survey transect. Dry Creek was visited twice this summer; by Janice Engle, Ray Hennekey, Marissa Meyer, and Keith Paul from June 1 through June 6 to conduct the mark-recapture survey (four days to make two complete passes), measure habitat parameters, widen the survey effort upstream and downstream, and construct three exclosure fences; and then on August 10, by Janice Engle, Marisa Meyer, Keith Paul, Chris Funk, Kenneth Lujan, and Laura Kessel to determine annual recruitment success, to score habitat parameters, and to collect samples for genetic studies and fish health analyses. Three exclosures, totaling 0.047 acres, were constructed around habitat known to be essential to spotted frog persistence in the survey area (Figure 4).
1 2
3
Figure 4. Three exclosures constructed in 2006 to protect important spotted frog habitat components: (1) Campsite Oxbow, (2) Barrel Spring, (3) Skeleton Scar.
The “Campsite oxbow” has had consistent capture success over the past six years. Because of its close proximity to a livestock trail, it receives a high amount of disturbance from trampling, vegetation loss, and fecal material. By placing a fence around the oxbow pool and transplanting willows and cattails from upstream (Figure 5), the 0.017 acre site should become a more diverse
3

aquatic habitat for foraging and overwintering frogs. As of 2006, spotted frog breeding has not been documented in this oxbow, however, treefrog tadpoles have been captured there. The “Barrel spring” is a recharge area where water percolates back up to the surface in a cool, clear pool (Figure 6). This area reliably provides wet habitat connectivity when water is limited
Figure 5. Campsite oxbow exclosure in June, immediately after construction.
Figure 6. Barrel spring exclosure. The outflow from this recharge area meets the main channel approximately 100’ downstream.
4

in late summer. Metamorph captures here have been high in August of most years, and it is possible that the pool serves as an overwintering site (if interstitial spaces are large enough for frogs). By adding willows to the 0.016 acre area and protecting it from late season disturbance, we hope that it will become a better foraging and overwintering site. The “Skeleton scar” is a small, incised side channel that is usually isolated from the main creek (Figure 7). It remains approximately 18” deep throughout the year, and has been documented as a breeding site. Because of its rare connectivity to the main channel, any tadpoles that develop here are usually isolated until they metamorphose. Predation (by snakes) can be extremely high in such a concentrated pool, and additionally it is completely exposed to weather extremes and grazing impacts. The 0.014 acre exclosure fence was not completed in June because we ran out of materials; we completed the construction in August. Willows were not planted at this exclosure this year, but may be added in the future to improve the habitat for spotted frogs.
Figure 7. Skeleton scar exclosure, near the downstream end of the survey transect. Fencing was not completed until August.
Three additional studies have been coordinated with the spotted frog survey work in Dry Creek: Chytrid analysis (June 2005) and genetics (August 2006) by USGS; and fish health by the USFWS (August 2006). More information on these studies is included in the Results section of this report.
5

6
Monitoring Results
Table 1. Monitoring data.
Date Time Water temp
DO Con-duct-ivity
pH SSAR (Stream-bank soil alteration
rating)
VUBA (Vegeta-tion use
by animals)
L-P Population Estimate
Recruitment
6 Jun 01 1310 17.3C 14.65 191.5 9.2 0-25% 0-25% 74 - 4 Aug 01 1335 22.3C 16.46 246.4 9.3 26-50% 76-100% - yes 6 Jun 02 1315 22.5C * * * 26-50% 51-75% ** -
11 Aug 02 1300 21.8C *** 340 8.9 51-75% 76-100% - yes 6 Jun 03 1200 20.9C 12.6 270 9.1 51-75% 0-25% 62 - 9 Aug 03 1355 24.9C 16.3 310 8.9 51-75% 26-50% - yes 6 Jun 04 1515 22.2C 13.8 250 8.9 51-75% 51-75% 168 -
20 Aug 04 1440 26C 14.8 280 9.0 26-50% 26-50% - yes 6 Jun 05 1730 17.0C 14.4 230 8.9 0-25% 0-25% 255.2 -
11 Aug 05 1249 21.0C 15.4 260 9.1 51-75% 76-100% - yes 3 Jun 06 1330 17.0C 10.0 250 10.4 76-100% 0-25% 80 -
10 Aug 06 1302 22.0C 7.5 280 8.4 76-100% 76-100% - yes
(for description of habitat measures, see Appendix I and II. SVSR has been removed from the analysis because it is not the appropriate measure to detect changing vegetative conditions) *equipment failure **unable to calculate LP due to PIT-tag reader failure ***not recorded Standard photo point and water chemistry point is mid-way of the State transect (Figure 8a and capture locations are mapped on Figure 8b). JUNE 2006 We began our survey of the Dry Creek transect on June 1, 2005 at 1230 hrs. The weather was warm and mostly clear. Proceeding west from the state land end point, we surveyed upstream to the campsite until 1622 hrs. The fence below the campsite had been destroyed by the high water
Figure 3. Dry Creek standard photo point, June 6, 2005 and August 11, 2005.
Figure 8a. Dry Creek standard photo point, June 3, 2006 and August 10, 2006.

7
Figure 8b. Capture locations for the June 2006 survey, including areas upstream and downstream of the survey transect.
7

flow, so it was replaced in a new location - at the top of the southern hill, making the entire area between the second and third pinches a “water gap” for livestock. The depth of the water in the third pinch was a bit deeper (waist-deep instead of thigh-deep) due to scour and sorting of new sediments. Water was clear in the main channel and weedy algal mats were noticeably absent. Spotted frog tadpoles were only observed at the lower side channel breeding site. Nineteen frogs were captured, only three of which were previously PIT-tagged. We began the second pass of the lower State transect on June 2 at 1106 (after working in the early morning on the campsite oxbow exclosure fence). It was mostly cloudy, but warm; however, it became drizzly in the late afternoon. Because the frogs were no longer active (observable), we stopped the mark-recapture survey at the third pinch and worked on completing the campsite oxbow exclosure fence instead. We obtained a few willows and cattails from the second pinch – they were loose and bare-rooted from the high flows, making them easy to transplant in the silty substrate of the oxbow pool. The cattails were planted in the southeastern corner, and the willows were planted next to the boulder. This placement will leave a sunny edge along the northern bank for breeding, while still increasing habitat complexity for foraging and hibernating. Because the campsite oxbow has not been documented as a natal site, it will be very interesting to observe if spotted frogs begin breeding there due to habitat improvement. If they do not, it could be an ideal location for a translocation study once the habitat becomes established.
Turf Rolls
Figure 9. Water damage was greatest in the stream reach between the natural exclosure and the second pinch. Spotted frogs were not observed in off-channel habitat that had been occupied in previous surveys.
On June 3, we completed the Barrel spring exclosure fence and the second pass of the lower State transect by 1313. From there, we surveyed upstream to the end of the State transect. The weather started out drizzly, but became sunny and partly cloudy by early afternoon. Twelve frogs were captured, four of which were previously PIT-tagged. The high water flows resulted in some habitat changes: the large oxbow pools between the natural exclosure and second pinch were murky, mats of turf were rolled from the forces of the water (Figure 9), and the oxbow pools against the southern canyon wall were completely scoured clean – no frogs. Although the
natural exclosure also received increased water velocities – it had to accommodate the same volume of water in a much smaller floodplain since it is closely bounded by two canyon walls –
8

erosional damage was much less severe in that area (Figure 10). Most of the vegetation in the natural exclosure withstood the forces and held the deposition bar in place. The main channel only scoured at one side of the upstream end (where the initial forces were focused) and at the downstream end, where the main channel became deeper and wider.
Figure 10. Natural exclosure upstream (left) and downstream (right).
Because very few frogs were observed in this section of the survey, we continued all the way through the BLM transect (Figure 11), where only two frogs were captured along the main channel. No frogs were observed in the isolated oxbow or in the recharge area just north of the main channel. No frogs were observed at the confluence of Butte Creek. We began the second pass of the upper State transect on June 4 at 0920 hrs, and reached the BLM transect at 1125. Upon completing the survey at 1246, we split into two teams to search for frogs outside of the transect area. Figure 11. Main channel of Dry Creek – BLM transect.
Marissa and Keith surveyed upstream from the BLM transect for 0.967 miles, capturing six frogs, none of which had been PIT-tagged. Dry Creek upstream of the BLM transect had narrow stream channels with alternating shallow to deep pools (Figure 12). The lower section of transect had several areas of incised stream channel. The incised channel was typically associated with outside meander bends. Incised banks were typically four to ten feet above the ordinary high water line. Riparian habitat consisted of sedges and rushes, typical of the State land transect. Limited willow clumps (less than ten) that were small in size were present in the lower section of transect. Grazing was light, with a preference for Nebraska sedge within the riparian zone. Numerous garter and gopher snakes were observed.
9

Figure 12. Dry Creek, upstream of the BLM transect (west).
Janice and Ray hiked south to survey 0.684 miles of Butte Creek (a tributary to Dry Creek). At that point, Butte Creek no longer had surface flow (Figure 13), and was isolated from potential frog habitat upstream. Although there were several pockets of suitable-looking habitat along Butte Creek, only one spotted frog was observed and it was not PIT-tagged. Treefrog tadpoles were abundant in some shallow pools, even where the water was a cloudy-milky color. No willows or other woody vegetation were observed along this stream reach.
Fi
gure 13. Butte Creek. From upper left, clockwise: high incised banks, remnant pool in stream channel, dry ed, shallow water habitat, deep pool habitat, scour pool habitat (note color). creek b
On June 5, we continued the expanded survey 0.897 miles downstream from the State transect (Figure 14). Twenty-eight frogs were captured (none previously PIT-tagged) and a new breeding site was confirmed. The habitat downstream was much different than that observed in the survey area, possibly due to a different grazing regime – winter use only. The effects of the high water event were not as evident in the downstream habitat. The floodplain did not show signs of scour and vegetation was much more dense (Figure 15). In some areas, boulders were strewn across
10

11
Figure 14. Expanded survey area. After 5 years of PIT-tagging, we surveyed up- and downstream of the monitoring site to see if PIT-tagged individuals were moving out of the transect. Very few spotted frogs were captured upstream of the survey transect, but many more were captured downstream, where the habitat seemed more stable. However, none of the frogs captured outside of our focal area were previously PIT-tagged. We PIT-tagged all new captures to document any movement into the focal area in the future.
Figure 15. Dry Creek downstream of the survey area. Riparian habitat was not damaged by high flows in this stream reach.
the valley floor similar to that found in the State transect, but oxbow pools were not created from diverted energy. The water was clear and frogs were more abundant than anywhere else surveyed.

12
Upon completing the expanded survey, we focused our efforts on getting the exclosures as secure as possible. Because we ran out of supplies, we were unable to finish the third exclosure fence (at the Skeleton scar breeding site). Birds and nests (Figure 16) observed or heard during the spring survey included: Chukar Cowbird Meadowlark Blue-winged teal Green-winged teal
Swallow Horned lark Great horned owl Flicker
Mallard
Figure 16. Red-winged blackbird nest and Robin nest.
Figure 17. Gopher snake in stream.
Common merganser American Robin California quail Prairie falcon Turkey vulture
Dove Raven Rock dove Red-winged blackbird
Red-tailed hawk
Phoebe Nighthawk
Mammals observed in the survey area included: mule deer golden-mantled ground squirrel jackrabbit pronghorn antelope antelope ground squirrel coyote Paiute ground squirrel Snake observations (Figure 17) are listed in Table 2. Table 2. Snake observations (June survey only). Western
terrestrial garter snake
Common
garter snake
Gopher snake
Racer
Western rattle-snake
2001 * * 2 2 2 2002 14 1 1 1 0 2003 40 2 4 2 1 2004 14 0 0 1 0 2005 15 0 0 1 1 2006 58 0 5 1 0

The Lincoln-Peterson Population estimate for the State transect was calculated as follows: First pass x second pass / recaptures = 30x40/15 = 80 The gender and age distribution data for the State section is listed in Table 3. Table 3. State section population (June survey results) 2001-2006.
YEAR FEMALES MALES SUBADULTS UNCAPTURED2001 9 2 39 5 2002 9 2 20 8 2003 9 2 41 9 2004 26 10 61 14 2005 18 8 119 18 2006 22 10 25 1
AUGUST 2006 We began surveying at 0917 at the upstream BLM start point and finished at the end of the State transect at 1731. The weather was clear, clam, and warm. Despite wide wet connectivity in June, most of the BLM section was now completely dry (Figure 18). Many metamorphs (100 individuals) were observed on the BLM section just upstream from the confluence with Butte Creek. The metamorphs appeared to travel as far as wet connectivity permitted, with most of them clustered in the rocky shallows just upstream from the confluence. No adults were observed.
Figure 18. Dry Creek did not have surface water through most of the BLM transect. Many metamorphs were observed just above the confluence with Butte Creek.
Fifty-two metamorphs were observed along the State section, particularly along the stream channel (Figure 19). Eleven adults were captured (six females, five males), mostly in oxbow pools or side channels. As in past surveys, the oxbow pools on the State section supported a few adult frogs, while numerous metamorphs were common along the migratory channel. The vegetative condition of the riparian area varied greatly throughout the State transect, which made
13

14
Figure 19. August 2006 survey results. Where individuals were clustered, multiple metamorph captures are represented by single points.

Figure 19. Campsite oxbow exclosure in August.
it difficult to determine the habitat ratings. Most areas had received heavy grazing use. The newly constructed exclosure fences received pressure from livestock pushing through the barbed wire to reach protected vegetation (Figure 19) and livestock were present during the survey. As noted in previous years, the only riparian habitat that exhibited any complexity with woody growth was in the natural exclosure, where livestock could not gain access. Native ungulates used that area however, as evidenced by bedding areas and fecal pellets observed there. The lower portion of the State section experienced particularly heavy grazing use, and the side pool breeding site was completely Dry (Figure 20). We completed the exclosure fence around the Skeleton Scar (Figure 21) after completing the transect survey. Additional Studies
Figure 20. Side pool breeding site was the only location found to have tadpoles in June.
Figure 21. Completing the Skeleton Scar exclosure in August.
15

Figure 22. Bridge-lip suckers, showing
uring the 2005 surveys, twenty spotted frogs w
e
ts,
D ere swabbed for Chytrid analysis as a part of the
hlarger effort being conducted by USGS in the Oregon-northern California region. Ten of the twenty swabs submitted tested positive for Chytrid confirming the presence of this fungus in tpopulation of spotted frogs at Dry Creek in 2005 (Michael Adams and Rebecca Cole, USGS, personal communication). For further information on the Chytrid study, and for the final resulplease contact Michael Adams, Research Ecologist, USGS Forest & Rangeland Ecosystem Science Center, 3200 SW Jefferson Way, Corvallis, OR, 97331 [email protected].
uring the August survey of 2006, two additional research efforts were coordinated with the
ng )
hris collected 26 toe-clips from adult and metamorph spotted frogs captured in both the BLM
en and Laura collected 45 bridge-lip suckers (Catostomus columbianus) using a backpack
, in
by )
s. The
l.
Dspotted frog recruitment survey. Chris Funk (USGS, Corvallis) collected samples for the Columbia Spotted Frog Great Basin Distinct Population Segment (DPS) mtDNA sequencianalysis, and Kenneth Lujan (USFWS, Willard, WA) and Laura Kessel (USFWS, Orofino, IDcollected fish samples for the National Wild Fish Health Survey database (Appendix III). Cand State transects. Results of the genetic analysis will be completed in 2007 and published in apeer-reviewed scientific article upon acceptance (potentially 2008). Kelectrofisher. Externally, the fish showed white patches on the skin and fins, small leeches, Black spot (Neascus), and embedded anchor worms. The anchor worms were causing hemorrhaging throughout the body surfacethe fins, and in the eyes causing exophthalmia (popped eyes) (Figure 22). Fungus was also found on the fins that were infected by the anchor worms. Internally, the fish had hemorrhaging in the body cavity causedtapeworms. Brain-heart infusion agar (BHIAmedia was used to isolate the bacteria Aeromonas hydrophila from the kidneyEnzyme Linked Immunosorbent Assay (ELISA), which tests for the presence ofRenibacterium salmonium (RS), remains pending at the time of this report submitta
external conditions.
16

Discussion Although 422 frogs have been PIT-tagged in the Dry Creek survey area over six years, only 32 have been captured in more than one year (Table 4). Most were captured first as subadults, and subsequently as adults (when gender could be determined). Only six frogs have been captured across three or more years, and only one of those was an adult at its first capture. That frog, female #434E2B7F25 was at least in her fifth year in 2004; she was not recaptured in 2005 or 2006. The other frogs, four females and one male, were in their fourth year at their last capture. No other frogs could be verified as over three years in age. For the purposes of this report, “age” is defined as follows: First year: first calendar year of life (egg, tadpole, metamorph stages)
Second year: second calendar year of life (previous year’s metamorph cohort, now subadults)
Third year: third calendar year of life (previous year’s subadult cohort, now adults) Fourth year: fifth calendar year of life
Table 4. Recapture data. (green=subadult; red=female; blue=male)
DATE hour gender mass
SVL (snout-
vent length)
PIT tag number
UTM (easting)
UTM (northing)
distance (m) from
one capture to the next
6/6/2001 1546 sa 9.7 49 41620A620B 442454 4817407 6/8/2001 1237 sa 9.3 49 41620A620B 442447 4817424 18.38 8/4/2001 1217 f 23.6 65 41620A620B 442407 4817306 124.6 6/6/2002 1105 F 30.1 70 41620A620B 442442 4817419 118.3 6/7/2001 1103 sa 14.7 56 42384B4216 442745 4817588 6/6/2002 1157 F 36.5 73 42384B4216 442682 4817602 64.54 6/7/2002 1050 F 35 74 42384B4216 442682 4817603 1 6/6/2003 1532 sa 12 51 433C5D7064 443181 4817455 6/7/2003 1142 sa 11.5 52 433C5D7064 443174 4817464 11.4 6/7/2004 1353 F 32.5 68 433C5D7064 443201 4817460 27.29 8/20/2004 1308 F 28.5 67 433D052673 442344 4817270 6/7/2005 1503 F 24 67 433D052673 442254 4817154 146.82 8/11/2002 1507 F 38.8 73 434E2B7F25 443169 4817464 6/7/2003 1147 F 36 74 434E2B7F25 443165 4817469 6.4 6/6/2004 1304 F 48 78 434E2B7F25 443293 4817422 136.36 6/7/2004 1316 F 48 78 434E2B7F25 443306 4817425 13.34 6/7/2003 1003 sa 9.5 48 43504D4627 443489 4817431 6/6/2004 1102 F 27.5 67 43504D4627 443486 4817438 7.62 6/7/2004 1130 F 28 67 43504D4627 443484 4817409 29.07 6/5/2005 1526 F 29.5 72 43504D4627 443448 4817431 42.19 6/7/2002 1309 F 34.5 75 4350506E41 441100 4816940 6/7/2003 1554 F 30.5 75 4350506E41 441097 4816938 3.61 6/8/2003 1553 sa 11.5 50 43512B2A78 8/20/2004 835 F 25 65 43512B2A78 441103 4816942
17

6/6/2004 1235 SA 13 52 435243287E 443356 4817414 6/4/2005 1520 F 27.5 67 435243287E 443318 4817419 38.33 6/7/2003 1002 sa 14 52 43573B5E21 443489 4817431 6/6/2004 1104 F 28 66 43573B5E21 443486 4817438 7.62 6/8/2003 1036 sa 12 51 435777396C 442695 4817595 6/7/2004 910 F 29 66 435777396C 442681 4817613 22.8 8/20/2004 1709 F 34.5 71 435777396C 442676 4817611 5.39 6/4/2005 1904 F 34.5 71 435777396C 442686 4817607 10.77 6/6/2003 1212 sa 10.5 42 43577A5D43 442839 4817608 6/4/2005 1747 F 29 72 43577A5D43 442842 4817607 3.16 6/7/2002 1230 F 14.5 54 4358056A44 440900 4816950 6/7/2003 1514 F 27.5 69 4358056A44 440804 4817010 113.21 8/9/2003 1007 F 29 67 435852595C 441143 4816909 6/5/2004 1453 F 24 68 435852595C 441163 4816902 21.1 6/7/2004 1750 F 24 68 435852595C 441163 4816902 0 6/6/2004 1240 SA 8.5 45 43595D7C2A 443345 4817422 6/7/2004 1300 SA 8.5 45 43595D7C2A 443331 4817420 14.14 6/5/2005 1622 M 12 54 43595D7C2A 443275 4817438 58.82 6/2/2006 1325 m 14.0 56 43595D7C2A 443266 4817440 9.22 6/6/2003 1215 sa 11 44 435A336346 442839 4817608 6/7/2003 1249 sa 435A336346 442839 4817608 0 6/6/2004 1410 F 30.5 69 435A336346 442843 4817613 6.4 6/6/2003 1436 sa 12.5 50 435A3B583D 443730 4817622 6/7/2003 907 sa 12.5 51 435A3B583D 443721 4817609 15.81 6/7/2004 1110 M 19 57 435A3B583D 443662 4817552 82.04 6/6/2004 1416 SA 10 48 435A4C6906 442733 4817601 6/4/2005 1851 M 16 56 435A4C6906 442686 4817607 47.38 6/5/2005 1908 M 16 56 435A4C6906 442684 4817606 2.24 6/7/2002 1311 M 18 52 435B2A2063 441100 4816940 6/7/2003 1559 M 18.5 58 435B2A2063 441097 4816938 3.61 6/8/2003 1034 sa 10.5 49 435B2B0157 442695 4817595 6/4/2005 1852 F 31 70 435B2B0157 442686 4817607 15 6/5/2005 1900 F 31 70 435B2B0157 442684 4817606 2.24 8/11/2005 1259 F 34 73 435B2B0157 442681 4817603 4.24 6/5/2005 1705 SA 7.5 43 462E30242A 443244 4817461 6/2/2006 1240 m 16.0 56 462E30242A 443499 4817471 255.2 6/6/2005 1144 SA 11.0 50 4658221C3D 442498 4817430 8/11/2005 1150 M 16.5 56 4658221C3D 442500 4817426 4.47 6/4/2006 1025 m 18.0 58 4658221C3D 442381 4817297 175.5 6/5/2005 1748 SA 8.0 45 4658264149 443026 4817471 6/1/2006 1441 f 24.0 65 4658264149 442844 4817613 230.84 8/10/2006 1619 F 31.0 72 4658264149 442772 4817809 * 6/6/2005 1158 SAF 13.0 50 4658346141 442419 4817388 6/4/2006 954 f 32.0 70 4658346141 442442 4817421 40.22 8/10/2006 1157 f 46.0 79 4658346141 442500 4817425 58.14 6/5/2005 1352 SA 9.5 45 46584C0261 443545 4817495 6/2/2006 1121 m 15.0 54 46584C0261 443531 4817492 14.32
18

6/4/2005 1755 SA 6.0 40 465850322B 442842 4817607 6/5/2005 1826 SA 6.0 40 465850322B 442848 4817615 10 6/3/2006 1310 m 13.0 55 465850322B 442839 4817612 9.49 6/5/2005 1635 SA 7.5 45 4658573143 443264 4817444 6/1/2006 1327 f 21.0 62 4658573143 443200 4817459 39 6/6/2005 1106 SA 5.5 39 46590B3B03 6/1/2006 1434 f 15.0 60 46590B3B03 442844 4817613 6/3/2006 1311 f 17.0 59 46590B3B03 442843 4817609 4.12 8/10/2006 1240 f 29.5 68 46590B3B03 442641 4817604 202.06 6/6/2005 1204 SA 10.5 49 46591B1427 442454 4817367 6/7/2005 1800 SA 10.5 49 46591B1427 442454 4817369 2 6/3/2006 1345 f 23.0 65 46591B1427 442665 4817605 316.57 6/7/2005 1504 F 35.0 75 4659370702 442258 4817157 6/3/2006 1512 f 40.0 80 4659370702 442258 4817164 7 6/4/2006 1049 f 39.0 80 4659370702 442254 4817151 13.6 6/6/2005 1545 SAF 13.0 52 4659407C32 440827 4817005 6/3/2006 1632 f 30.0 72 4659407C32 440823 4817013 8.94 6/4/2006 1212 f 29.0 70 4659407C32 440815 4817015 8.25 6/4/2005 1701 F 19.0 62 46594E4D50 443084 4817488 6/2/2006 1327 f 22.0 67 46594E4D50 443262 4817447 182.66 * distance cannot be calculated because UTMs were obtained in a different projection.
Based upon distances traveled (straight line between GPS points), the furthest distance traveled was 316.57 m, by female #46591B1427. She was found in the isolated oxbow pools between the second pinch and natural exclosure in 2005. High water flows in early 2006 scoured that area (no frogs were found there in the June 2006 survey), so it is possible that she passively rode the high water flows to the next suitable habitat, the oxbow pools below the campsite. As shown in Table 4, several frogs moved over 100m, but none were detected to move outside of the survey transect. Because adult survivorship appears to be low compared to other Great Basin spotted frog occurrences, it is increasingly important to monitor yearly recruitment into the population. Table 5 shows the number of metamorphs observed each August.
Table 5. Numbers of metamorphs observed, 2001-2005 (entire survey transect). YEAR NUMBER OF METAMORPHS
August 4, 2001 37 August 11, 2002 71 August 9, 2003 98 August 20, 2004 223* August 11, 2005 100 August 10, 2006 152 *the entire transect was not completed.
Subadult frogs reached their highest documented numbers in June 2005, following the August 2004 peak in metamorph numbers. However, by August 2006, riparian habitat ratings declined
19

to very poor in specific sections (not all) of the survey transect, the lowest ratings since monitoring began. Metamorph frog numbers were approximately 50% lower in 2005 (100) than in 2004 (223+), but rebounded somewhat in 2006 (152). Another measure of recruitment success is to identify the number of metamorphs that survived their first winter and were observed the following year as subadults. Table 6 relates these two data sets.
Table 6. The relationship between the number of metamorphs observed and the number of subadults observed the following year (entire survey transect).
YEAR NUMBER OF SUBADULTS June 2001 53 (? metamorphs in 2000) June 2002 29 (37 metamorphs in 2001) June 2003 73 (71 metamorphs in 2002) June 2004 74 (98 metamorphs in 2003) June 2005 134 (223 metamorphs in 2004) June 2006 27 (100 metamorphs in 2005)
The high water event of early 2006, combined with a smaller metamorph cohort of 2005 could be the reason for such a small number of subadults in 2006. It should be noted, however, that where habitat was more stable (downstream of the survey transect), an additional 16 subadults were captured (over a distance of just 0.897 mi). These subadults could be residents of that stream reach, or could have moved passively downstream (individuals are not marked until their first subadult capture). Because the habitat was largely in tact compared to that upstream, it would stand to reason that individuals might move there, at least temporarily.
Figure 17 shows the total of each age class present in the population (entire survey transect) each survey year.
Survey Totals by Age Class/Gender
0
50
100
150
200
250
300
350
2001 2002 2003 2004 2005 2006
Survey Year
Num
ber o
f Ind
ivid
ual
Figure 17. Total individuals in each age class, by survey year.
s
metamorphssubadultsmalesfemales
Eventually, trends in survivability may be evident by gender; however all that is clear at this time is that more females are in the adult population than males. A trend could be developing toward smaller (possibly younger) adults, but several more years’ data will need to be obtained before significance can be determined. A number of additional questions can
20

only be answered by collecting additional data, such as size at maturity, mortality between age classes, and the extent to which outmigration occurs across different age class (if at all). Because of individual variability in growth, size ranges cannot always predict age with certainty. However, it is safe to say that an 80 SVL female is older than a 50 SVL female in June of any given year. Therefore, using the following criteria based upon capture data, survivability trends can be inferred (Table 4). Breaks in age class were based upon recapture data for known subadults (when 2nd year could be assigned with certainty to a PIT-tagged individual – refer to Table 3) and upon the SVL breaks in Figure 16b. Criteria:
• Uncaptured subadults and adults were not included in these totals because there was a possibility that they were captured and counted another time in any given year.
• Uncaptured metamorphs were included because they were only viewed once, in the last survey of the year.
• Only the first capture of the year for recaptured frogs was counted, as it is easiest to determine subadult age class then.
• All 42mm and under SVL in August were considered metamorphs. • For new captures in August, allowances were made for annual growth for females. No
males captured in August needed to be adjusted for annual growth. Table 7. Cohort survival across survey years. Yellow blocks identify peaks in numbers for each age class.
COHORT-> “birth” year
1998 cohort
1999 cohort
2000 cohort
2001 cohort
2002 cohort
2003 cohort
2004 cohort
2005 cohort
2006
cohort
Egg masses
Unknown
Unknown
Unknown
Unknown
Unknown
Unknown
12 masses, at least 6000 individuals
Unknown
Unknown
In th
e fir
st y
ear
of li
fe
Metamorphs (Gosner stage 47 to 45 SVL in August)
Unknown
Unknown
Unknown
(2001 survey)
37
(2002 survey)
71
(2003 survey)
98
(2004 survey)
223
(2005 survey)
100
(2006
survey)
152
In th
e se
cond
yea
r of
life
Subadults (SVL 39-60 in June, no identifiable males over 53; females to 69 in August)
Unknown
Unknown
(2001 survey)
41
(2002 survey)
34
(2003 survey)
53
(2004 survey)
84
(2005 survey)
151
(2006 survey)
45
In th
e th
ird
year
of l
ife
Adults (SVL F 61-75, M 54-57 in June; SVL F 70-75 in August)
Unknown
(2001 survey) 3 females 0 males 3 TOTAL
(2002 survey) 7 females 0 males 7 TOTAL
(2003 survey) 10 females 3 males 13 TOTAL
(2004 survey) 18 females 3 males 21 TOTAL
(2005 survey) 14 females 0 males 14 TOTAL
(2006 survey) 32 females 19 males 51 TOTAL
In th
e fo
urth
ye
ar o
f life
or
olde
r
Adults (SVL F 76+, M 58+)
(2001 survey) 3 females 4 males 7 TOTAL
(2002 survey) 1 female 1 male 2 TOTAL
(2003 survey) 0 females 3 males 3 TOTAL
(2004 survey) 1 female 0 males 1 TOTAL
2005 survey) 0 females 0 males 0 TOTAL
(2006 survey) 1 female 4 males 5 TOTAL
21
Cohort Survivorship Between Age Classes
0
50
100
150
200
250
Yea
r 1(m
etam
orph
s)
Yea
r 2(s
ubad
ults
)
Yea
r 3(a
dults
)
Yea
r 4+
(adu
lts)
Age Class
Num
ber o
f ind
ivid
ual
199819992000200120022003200420052006
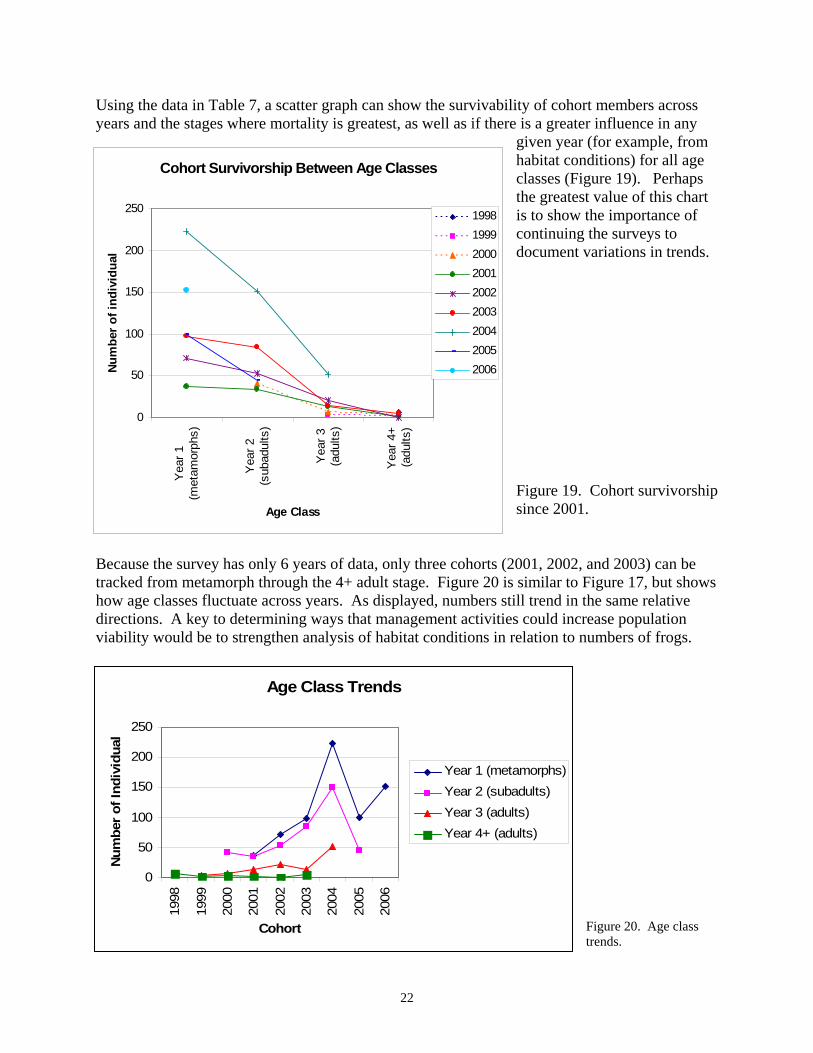
Using the data in Table 7, a scatter graph can show the survivability of cohort members across years and the stages where mortality is greatest, as well as if there is a greater influence in any
given year (for example, from habitat conditions) for all age classes (Figure 19). Perhaps the greatest value of this chart is to show the importance of continuing the surveys to document variations in trends. Figure 19. Cohort survivorship since 2001.
Because the survey has only 6 years of data, only three cohorts (2001, 2002, and 2003) can be tracked from metamorph through the 4+ adult stage. Figure 20 is similar to Figure 17, but shows how age classes fluctuate across years. As displayed, numbers still trend in the same relative directions. A key to determining ways that management activities could increase population viability would be to strengthen analysis of habitat conditions in relation to numbers of frogs.
Age Class Trends
0
50
100
150
200
250
1998
1999
2000
2001
2002
2003
2004
2005
2006
Cohort
Num
ber o
f Ind
ivid
ual
Year 1 (metamorphs)Year 2 (subadults)Year 3 (adults)Year 4+ (adults)
Figure 20. Age class trends.
22

By plotting the Lincoln-Peterson Population Estimate on the same chart as the habitat measures, it was hoped that a relationship could be detected between frog numbers and habitat conditions (Figure 21). The highest population estimate occurred when habitat ratings were best (June 2005). However, habitat conditions have been found to fluctuate greatly within each year, depending on the timing of livestock use. Therefore the ability to determine if a causal relationship exists is limited. By constructing the exclosures in 2006, three very small habitat patches can be considered as controls in the future. Their small size may limit their value for statistical results, but if frog responses to the protected habitat can be detected, then future management actions could be tested on a larger scale.
Habitat Ratings/Population Estimates
7462
168
255
80
0
50
100
150
200
250
300
June
200
1
Augu
st 2
001
June
200
2
Augu
st 2
002
June
200
3
Augu
st 2
003
June
200
4
Augu
st 2
004
June
200
5
Augu
st 2
005
June
200
6
Augu
st 2
006
Survey Dates
SSAR
VUBA
L-Ppopulationestimate
Figure 21. Habitat measures and frog population estimate. Habitat measures are plotted as means of their percentages (0-25% is plotted as 12.5%; 26-50% is plotted as 37.5%; 51-75% is plotted as 62.5%; and 76-100% is plotted as 87.5%) (see Appendix II for rating criteria). For both habitat ratings depicted here, higher percentages represent poorer habitat conditions.
Six years of this monitoring effort have been completed and the following conditions are noted at this time:
• There was an increase in numbers of observations of all life stages (except the largest adults) through June 2005, but numbers declined in 2006.
• High spring rain events take the hardest toll on habitat in stream reaches that have the highest livestock use. Two areas withstood habitat scour: the natural exclosure (livestock cannot access because of geological features), and downstream of the survey transect (grazing regime was changed to winter use only, and therefore, livestock did not concentrate in the canyon).
23

24
• Habitat connectivity (wet corridor) increased in 2003, 2004, and early 2005. • Ambient temperatures were milder in 2004 and 2005. • Predator (garter snake) numbers cycled high (2001); low (2002); high (2003); low
(2004); low (2005); high (2006). • Vegetative cover along the riparian corridor improved from 2002-early 2005. • Woody vegetation is increasing in density and height in the natural exclosure. • Symptoms of disease have been observed in frogs and fish. • Suitable breeding sites are widespread, but not being used (not a limiting factor). • Suitable overwintering sites seem limited and may vary from year to year.
This was the final year of this monitoring effort, however funding has been approved for at least one more season. Future Considerations
• Additional survey years are needed to track cohort trends, ambient conditions (weather, grazing regime, etc.), and to determine the likelihood of long-term persistence.
• In 2007, exclosure data can be segregated from baseline conditions as well as that of grazed pastures to better analyze potential correlations and habitat ratings.
• If the small exclosures appear to be beneficial by creating diverse and reliable spotted frog habitat, enlargements should be considered along with changes in grazing regime (for example, winter-use-only proved successful for improving riparian habitat stability downstream).
• Additional water quality analyses and development of options for improving ecosystem health, consistent with land use objectives.

APPENDIX I
MONITORING METHODS
Two population estimate methods will be used in this Monitoring Plan: mark-recapture and visual encounter surveys. Mark-recapture methods can provide accurate estimates of population size within the constraints of the following assumptions: boundaries must be accurately assessed, and ideally, immigration and emigration must not exist, and births and deaths must not occur. Visual encounter surveys provide an estimate of relative abundance as long as every individual is equally likely to be observed regardless of weather, season, or other variables; each frog is recorded only once; and there are no observer-related effects. These two methods will be used to provide comparative numbers across 10 years for the Dry Creek monitoring site. The goal is to accurately detect trends in numbers at the site over the long-term. Mark-recapture numbers will be used to calculate the Lincoln Index (Peterson Estimate) to estimate occurrence size in the spring and visual encounter numbers to assess breeding success in the late summer. The Lincoln-Peterson Index is calculated as follows: N=rn/m N=occurrence size r=number of frogs caught, marked, and released on day #1 n=number of frogs caught on day #2 m=total number of marked frogs caught on day #2 For example, if on the first day 30 frogs are captured, marked, and released and on the second day, 28 frogs are caught, of which 20 had been previously marked, then using the equation, N=(30)(28)/20, N=42. Two people will visit the site three times each year - twice in the spring for a mark-recapture population estimate and habitat analysis and once in the late summer for an assessment of breeding success and habitat analysis. Beginning and ending points (determined by ownership, accessibility, and occurrence boundaries from previous surveys) will be staked and flagged, and GPS locations will be recorded at the first survey in the spring of 2001. Attempts will be made to capture every frog within the delimited area within a specified time frame. Frogs will be tagged with Passive Integrated Transponder tags. (Toe-clipping was discontinued in 2003) Parameters to be measured at each monitoring site, once in the spring and once in the late summer include:
•Water chemistry: dissolved oxygen, temperature, pH, and conductivity •Habitat/land use: streambank alteration and vegetation use by animals (Platts 1987). (Vegetative stability ratings are discontinued as of 2005.)
Data will be recorded in a standard log book. The site will be photographed in the spring and late summer from a standard point (to be staked and flagged in the spring of 2001). A report will be compiled annually and submitted to the BLM. The report will consist of tables summarizing population numbers and maps of the area surveyed. Water chemistry and habitat/land use measures will be discussed along with their relevance to population trends. Raw data and field notes will be included as appendices.
25

APPENDIX II HABITAT/LAND USE RATINGS
FROM: Platts W. S. 1987. Methods for evaluating riparian habitat with applications to management.
USFS Intermountain Forest and Range Experiment Station. Ogden, Utah. GTR INT-221.
Streambank soil alteration rating (SSAR) Rating (%) Description 0 Streambanks are stable and are not being altered by water flows or animals. 1-25 Streambanks are stable, but are being lightly altered along the transect line. Less
than 25% of the streambank is receiving any kind of stress and if stress is being received, it is very light. Less than 25% of the streambank is false, broken down, or eroding.
26-50 Streambanks are receiving only moderate alteration along the transect line. At
least 50% of the streambank is in a natural stable condition. Less than 50% of the streambank is false, broken down, or eroding. False banks are rated as altered. Alteration is rated as natural, artificial, or a combination of the two.
51-75 Streambanks have received major alteration along the transect line. Less than
50% of the streambank is in a stable condition. Over 50% of the streambank is false, broken down, or eroding. A false bank that may have gained some stability and cover is still rated as altered. Alteration is rated as natural, artificial, or a combination of the two.
76-100 Streambanks along the transect line are severely altered. Less than 25% of the
streambank is in a stable condition. Over 75% of the streambank is false, broken down, or eroding. A past damaged bank, now classified as a false bank, that has gained some stability and cover is still rated as altered. Alteration is rated as natural, artificial, or a combination of the two.
Vegetation use by animals (VUBA) Rating (%) Description 0-25 Vegetation use is very light or none at all. Almost all of the potential plant (light) biomass at present stage of development remains. The vegetative cover is very
close to that which would occur naturally without use. If bare areas exist (i.e., bedrock), they are not because of loss of vegetation from past grazing use.
26-50 Vegetation use is moderate and at least one-half of the potential plant biomass remains. (moderate) Average plant stubble height is greater than half of its potential height at its
present stage of development. Plant biomass no longer on site because of past grazing is considered as vegetation that has been used.
51-75 Vegetative use is high and less than half of the potential plant biomass remains. (high) Plant stubble height averages over two inches. Plant biomass no longer on site
because of past grazing is considered as vegetation that has been used. 76-100 Use of the streamside vegetation is very high. Vegetation has been removed to two (very high) inches or less in average stubble height. Almost all of the potential vegetative
biomass has been used. Only the root system and part of the stem remains. That potential biomass that is now non-existent because of past elimination but grazing is considered vegetation that has been used.
26

27
APPENDIX III
NATIONAL WILD FISH HEALTH SURVEY Case History Number: W06-156 Location: Dry Creek County: Malheur State: Oregon National Wild Fish Health Survey Background: In 1996, the U.S. Fish and Wildlife Service requested and received a $1 million annual increase in appropriations for fish disease work. Six hundred thousand dollars was used to initiate a National Wild Fish Health Survey under the leadership of the Service’s Regional Fish Health Centers, and in cooperation with stateholders such as states, Tribes, and the aquaculture industry. This project incorporates standardized diagnostic and data management methods to ensue national comparability, identifies target pathogens, fish species, and habitats for survey, and is developing a systematic and interagency approach to fish health management of important watersheds. A National Wild Fish Health Survey Database has been established to receive data from the Survey. The database is accessible electronically via the Internet at www.wildfishsurvey.fws.gov. The purpose of the National Wild Fish Health Survey is to determine the distribution of specific pathogens in wild fish populations. Methodologies: Each fish is evaluated for target pathogens and parasites that are known to infect that particular species. In addition, the standard methods used in the Survey will detect the major salmonid fish pathogens should they exist in other species. The National Wild Fish Health Survey Procedures Manual is updated on an annual basis. Target Pathogens: Viruses
1. Infectious Hemotopoietic Necrosis Virus (IHNV) 2. Infectious Pancreatic Necrosis Virus (IPNV) 3. Viral Hemorrhagic Septicemia Virus (VHSV) 4. Oncorhynchus Masou Virus (OMV) 5. Largemouth Bass Virus (LMBV)
Bacterial pathogens
1. Aeromonas salmonicida (AS), Furunculosis 2. Edwardsiella ictaluri (ESC), Enteric Septicemia 3. Renibacterium salmoninarum (RS), Bacterial Kidney Disease 4. Yersinia ruckeri (YR), Enteric Redmouth
Parasites
1. Myxobolus cerebralis (WD), Whirling Disease