colour vision and visual ecology of the blue-spotted ... · colour vision and visual ecology of the...
TRANSCRIPT

Abstract Relatively little is known about the physical
structure and ecological adaptations of elasmobranch
sensory systems. In particular, elasmobranch vision has
been poorly studied compared to the other senses.
Virtually nothing is known about whether elasmo-
branchs possess multiple cone types, and therefore the
potential for colour vision, or how the spectral tuning
of their visual pigments is adapted to their different
lifestyles. In this study, we measured the spectral
absorption of the rod and cone visual pigments of the
blue-spotted maskray, Dasyatis kuhlii, using micro-
spectrophotometry. D. kuhlii possesses a rod visual
pigment with a wavelength of maximum absorbance
(kmax) at 497 nm and three spectrally distinct cone
types with kmax values at 476, 498 and 552 nm. Mea-
surements of the spectral transmittance of the ocular
media reveal that wavelengths below 380 nm do not
reach the retina, indicating that D. kuhlii is relatively
insensitive to ultraviolet radiation. Topographic anal-
ysis of retinal ganglion cell distribution reveals an area
of increased neuronal density in the dorsal retina.
Based on peak cell densities and using measurements
of lens focal length made using laser ray tracing and
sections of frozen eyes, the estimated spatial resolving
power of D. kuhlii is 4.10 cycles per degree.
Keywords Elasmobranch �Microspectrophotometry �Visual pigment � Ocular media � Ganglion cell
topography
AbbreviationsDW Disc width
IR Infra-red
LED Light emitting diode
MS222 Tricaine methanesulphonate salt
OLM Outer limiting membrane
T0.5 Wavelength at 0.5 normalized transmittance
UV Ultraviolet
kmax Wavelength of maximum absorbance
Introduction
Elasmobranchs (sharks, skates and rays) are an ancient
group of vertebrates that first appeared over 400 mil-
lion years ago. Traditionally, these fishes were thought
to have poorly developed visual systems and were be-
lieved to rely heavily on non-visual senses such as
olfaction and electroreception for prey detection,
predator avoidance, mating and communication
(Cohen 1989). Indeed, until the discovery of cones in
the retina of the lemon shark, Negaprion brevirostris
(Gruber et al. 1963), and despite some early reports of
cones in the elasmobranch retina (Neumayer 1897;
Schaper 1899; Walls 1942), it was commonly assumed
that the elasmobranch eye contained an all-rod retina
and was specialised only for dim light (scotopic) vision
(Walls 1942). While a few species examined with
modern microscopic techniques are reported to be
cone free, namely the skates Raja erinacea and Raja
S. M. Theiss (&) � T. J. Lisney � S. P. Collin �N. S. HartVision, Touch and Hearing Research Centre,School of Biomedical Sciences, University of Queensland,St Lucia, Brisbane, QLD 4072, Australiae-mail: [email protected]
J Comp Physiol A (2007) 193:67–79
DOI 10.1007/s00359-006-0171-0
123
ORIGINAL PAPER
Colour vision and visual ecology of the blue-spotted maskray,Dasyatis kuhlii Muller & Henle, 1814
Susan M. Theiss Æ Thomas J. Lisney ÆShaun P. Collin Æ Nathan S. Hart
Received: 30 June 2006 / Revised: 29 August 2006 / Accepted: 2 September 2006 / Published online: 26 September 2006� Springer-Verlag 2006

ocellata, the blackmouth catshark, Galeus melastomus,
and the Portuguese dogfish, Centroscymnus coelolepis
(Dowling and Ripps 1970; Bozzano et al. 2001; Bozzano
2004), the majority of over 40 species investigated to
date have duplex retinae with varying rod to cone
ratios (Hart et al. 2006). However, while the spectral
properties of elasmobranch rods have been studied
extensively (Denton and Shaw 1963; Crescitelli et al.
1985; Cohen et al. 1990), almost nothing is known of
the spectral absorption characteristics of the visual
pigments contained within the cones.
A single spectral class of photoreceptor can only
code for the brightness of an image and not its colour.
Thus, for an animal to have colour vision, it must
possess at least two different photoreceptor types with
spectrally distinct but overlapping spectral sensitivities
and the neural machinery to compare their outputs
(Jacobs 1981). Few studies have investigated the
physiological basis for, or behavioural manifestation
of, colour discrimination in elasmobranchs, and at
present it is unknown whether elasmobranchs have
colour vision. Past behavioural experiments on the
blacktip reef shark, Carcharhinus melanopterus, grey
reef shark, Carcharhinus menisorrah = amblyrhynchos,
and the lemon shark, N. brevirostris have proved
inconclusive (Tester and Kato 1966; Gruber 1975),
mostly because these tests did not control for the
effects of perceived stimulus intensity, making it impos-
sible to distinguish whether the animal was responding
to the hue of the stimulus colour or its effective
brightness. The most encouraging results on the
potential for colour vision in elasmobranchs have come
from a recent study by Hart et al. (2004), where three
spectrally distinct cone visual pigments were found
using microspectrophotometry in two species of shov-
elnose ray, the giant shovelnose ray, Rhinobatos typus,
and the eastern shovelnose ray, Aptychotrema rostrata.
This was the first study to demonstrate that some
species of elasmobranchs have multiple cone types and,
therefore, the potential for colour vision. Moreover,
the discovery of five cone photoreceptor types, each
containing a different visual pigment (opsin) gene, in a
jawless vertebrate, the southern hemisphere lamprey,
Geotria australis, (Collin et al. 2003a, b), suggests that
the retinal prerequisites for colour vision existed in
ancestral vertebrates, prior to the divergence of the
elasmobranchs. Consequently, one would anticipate
that multiple spectrally distinct cone pigments are
widespread in other cartilaginous fish.
The range of wavelengths to which an animal is
sensitive is dependent not only on the spectral sensi-
tivity of its visual pigments, but also upon the wave-
lengths of light that reach the retina. Therefore, any
consideration of colour vision must take into account
the transmission of the ocular media (Douglas and
McGuigan 1989). Other aspects of the visual system,
such as spatial resolving power, are equally important.
The peak density and topographic distribution of retinal
neurons can often be correlated with the visual ecology
of a species (Hughes 1977; Collin and Pettigrew 1988).
Topographic analyses can reveal the presence of areae
of increased photoreceptor and ganglion cell density
that mediate increased spatial resolving power in a
particular region of the visual field. Several elasmo-
branchs, for example, possess a horizontal visual ‘streak’
of increased ganglion cell density. This retinal organi-
sation is thought to be an adaptation to open, relatively
featureless environments dominated by a clear visual
horizon, such as the sand–water interface, or the hori-
zontal gradient of light in the water column (Hueter
1991; Bozzano and Collin 2000; Hueter et al. 2004).
The blue-spotted maskray, Dasyatis kuhlii, is a
tropical benthic marine ray usually found on sandy
bottoms near rocky or coral reefs (Last and Stevens
1994). This species is widely distributed throughout the
Indo-Pacific region (Last and Stevens 1994; Last and
Compagno 1999) and derives its name from the bright
blue spots found on its grey to brownish coloured disc.
The retina of Dasyatis kuhlii is already known to
possess cones (Kohbara et al. 1987), and it inhabits a
similar, brightly-lit habitat to both Rhinobatos typus
and Aptychotrema rostrata, the two species of shovel-
nose ray previously shown to have multiple cone types
(Hart et al. 2004). Although they share similar habitats,
D. kuhlii and the two shovelnose rays, R. typus and A.
rostrata, are not closely related and belong to different
elasmobranch orders (Myliobatiformes and Rajafor-
mes respectively) (McEachran and Aschliman 2004) D.
kuhlii also has a number of different morphological
and behavioural adaptations, suggesting that their
ecology may be quite different. For example, D. kuhlii
has an angular disc and feeds mainly on polychaete
worms (S. Pierce and S. Pardo, personal communica-
tion), while shovelnose rays have a distinct wedge-
shaped disc and feed on sand-dwelling crustaceans and
shellfish (Last and Stevens 1994). One significant dif-
ference between D. kuhlii and the vast majority of
other rays is the blue spots found on the disc, which
could be beneficial to this species for camouflage and/
or visual communication, although their function is
presently unknown. Here, we describe the visual sys-
tem of D. kuhlii in terms of the morphology and
spectral absorption properties of its retinal photore-
ceptors, the spectral transmittance of the ocular media,
the topographic distribution of ganglion cells in the
retina and the optics of the lens.
68 J Comp Physiol A (2007) 193:67–79
123

Materials and methods
Animal collection and handling
All procedures were approved by the University of
Queensland Animal Ethics Committee and conducted
under the ethical guidelines of the National Health and
Medical Research Council of Australia. A total of 27
specimens of Dasyatis kuhlii were collected using seine
nets from shallow coastal waters around Moreton Bay,
Queensland under a Queensland General Fisheries
Permit (PRM02910F). Animals ranged in size from
19.0 to 39.4 cm disc width (DW) and were housed in
circulating seawater aquaria under fluorescent strip
lighting on a 12 h:12 h light:dark cycle.
Light and electron microscopy
One animal (23.5 cm DW) was euthanased with an
overdose of tricaine methanesulphonate salt (MS222;
1:2,000 in seawater) for light microscopical examina-
tion of the retina and ultrastructural examination of
rod and cone photoreceptors following the methods of
Collin et al. (1999) and Hart et al. (2004). For both
light and electron microscopy, hemisected eyes were
fixed in 2% paraformaldehyde, 2.5% glutaraldehyde in
0.1 M cacodylate buffer (pH 7.4) at 4�C for 2 days and
post-fixed in 2% osmium tetroxide. For light micros-
copy, retinal tissue was dehydrated and embedded in
EPON before semi-thin sections (1 lm) were cut on an
LKB ultramicrotome, mounted on slides and stained
with toluidine blue. Following permanent mounting
and coverslipping in DEPEX (Aldrich Chemical
Company Inc., USA), stained retinal sections were
photographed using an Olympus DP30 digital camera
mounted on a Leitz Dialux 20 compound microscope.
For electron microscopy, sections were also cut on an
LKB rotary ultramicrotome using glass knives. Sec-
tions were placed on grids and stained with lead citrate
and uranyl acetate, and examined on either a Phillips
410 or a Phillips CM10 transmission electron micro-
scope set at 80 kV (Phillips Inc., Eindhoven, The
Netherlands). Measurements of individual (unfixed)
photoreceptors were undertaken during microspectro-
photometric analysis and taken from the television
screen used to view the preparations, using a piece of
transparent acetate marked with a scale to the cali-
brated magnification of the microscope.
Microspectrophotometry
Sixteen animals (20.5–35.5 cm DW) were dark-adapted
for 1.5–2.5 h to allow for visual pigment regeneration
and euthanased with an overdose of MS222 (1:2,000 in
seawater) followed by spinal pithing. Following the
methods of Hart (2004) and Hart et al. (2004), eye
removal and retinal dissection was performed under
the illumination provided by a bank of 24 infra-red
(IR) light emitting diodes (LED) and visualized using
an IR image converter (FJW Industries, USA) attached
to one ocular of a stereo dissection microscope. After
enucleation, one eye was immersed in elasmobranch
Ringer solution (330 mmol l–1 urea, 350 mmol l–1 NaCl,
4 mmol l–1 KCl, 5 mmol l–1 CaCl2, 2 mmol l–1 MgCl2;
approximate osmolality 1,050 mOsm kg–1; pH 7.4),
while the second eye was sealed in a light-tight container
and stored at 4�C for use the following day. The
immersed eye was then hemisected and the lens
removed. To facilitate microdissection of the retina, a
quarter of the eyecup was cut away and the pigment
epithelium, tapetum, and retina were gently pulled away
from the sclera. The vitreous humour was then cut away
from the retina as much as possible. Using fine forceps,
the retina was carefully teased away from the pigment
epithelium and small pieces of retinal tissue (approxi-
mately 1–3 mm2) were dissected free and transferred to
a drop of elasmobranch Ringer solution containing 5%
dextran (MW 200,000–300,000; ICN Biomedicals Inc.,
USA) on a 24 · 64 mm No. 1 glass coverslip. The retina
was teased apart using fine forceps, covered with an
18 · 18 mm No. 0 coverslip and then gently compressed
beneath filter paper to soak up any excess liquid around
the edges of the coverslip. The edges of the top coverslip
were then sealed with nail varnish to prevent dehydra-
tion of the preparation and slides were stored in a light-
tight box at 4�C until use. The following day the same
procedure was carried out for the second eye.
Transverse absorbance spectra (330–800 nm) of
visual pigments within both rod and cone outer
segments were made using a computer-controlled,
single-beam, wavelength-scanning microspectropho-
tometer described in detail elsewhere (Hart 2004). A
sample scan was made by aligning the measuring
beam within the outer segment and recording the
amount of light transmitted at each wavelength.
Measuring beam dimensions varied from 1 · 1 lm
for small cone outer segments to 2 · 12 lm for rod
outer segments. A baseline scan was then made in an
identical way from a cell-free area of the preparation
as close to the cell as possible. The baseline trans-
mittance was subtracted from the sample scan at each
corresponding wavelength to give a ‘pre-bleach’ spec-
trum for that cell. Subsequently, the cell was bleached
with full spectrum ‘white’ light from the monochroma-
tor for three minutes and identical sample and baseline
scans were made to give a ‘post-bleach’ spectrum. The
J Comp Physiol A (2007) 193:67–79 69
123

post-bleach spectrum was deducted from the pre-bleach
spectrum to create a difference spectrum that was
analysed along with the pre-bleach spectra as described
elsewhere (MacNichol 1986; Govardovskii et al. 2000;
Hart 2002). Briefly, sample and baseline data were
converted to absorbance values at 1 nm intervals and
the upward and downward scans averaged together by
fitting a weighted three-point running average to the
absorbance data (Hart 2002; Shand et al. 2002). Pre-
and post-bleach absorbance spectra were normalized to
the peak and long-wavelength offset absorbances
determined by fitting a variable-point unweighted
running average to the data (Hart 2002, 2004; Shand
et al. 2002,). A regression line was fitted to the long-
wavelength limb of the normalized absorbance data
between 30 and 70% of the normalized maximum
absorbance (MacNichol 1986), and the regression
equation was used to estimate the wavelength of max-
imum absorbance (kmax) with a corresponding template
overlayed for display (Govardovskii et al. 2000).
Ocular media spectral transmittance
Spectral transmittance measurements (300–800 nm) of
the ocular media were made using a calibrated, com-
puter-controlled Ocean Optics S2000 spectroradiome-
ter (Ocean Optics, Florida, USA), with a pulsed xenon
light source (PX-2 Ocean Optics), following methods
similar to those used by Siebeck and Marshall (2000)
and Hart (2004). One individual (25.1 cm DW) was
euthanased with an overdose of MS222 (1:2,000 in
seawater) and both eyes quickly removed. A small
piece of the sclera (approximately 2–3 mm2) was cut
out of the back of the eye, in line with the optic axis,
and the underlying choroid, pigment epithelium and
retina were removed to create an aperture for the
incident measuring beam to leave the eye. Each eye
was then placed cornea-side down on a metal specimen
holder, with a 50 lm diameter fibre optic cable posi-
tioned near the cornea in order to pass light through
the entire ocular media (cornea, aqueous humour, lens,
and vitreous humour). A 1,000 lm diameter fibre optic
cable was positioned above the eye, in line with the
hole in the sclera, to collect light transmitted through
the ocular media. The integration time was set at 20 ms
with 20 scans averaged for each measurement. Four
measurements were taken from each eye with the
baseline measurement consisting of an identical
arrangement but with the eye removed from the light
path. Transmittance data for both eyes were averaged,
linearly interpolated to 1 nm intervals from 300 to
800 nm, and fitted with a 31-point unweighted running
average. The curve was normalized and the wavelength
at which there was 0.5 of the normalized transmittance
(T0.5) was determined (Douglas and McGuigan 1989).
Results were largely qualitative as absolute measure-
ments of reflectance and transmittance are not possible
using this technique.
Ganglion cell topography
Three animals (21.2, 22.8 and 23.7 cm DW) were eu-
thanased with an overdose of MS222 (1:2,000 in sea-
water) prior to enucleation. Following the methods of
Stone (1981), a ventral slit was made in the eye in order
to establish orientation of the retina. Eyes were
hemisected and fixed in 4% paraformaldehyde
in 0.1 M phosphate buffer solution (pH 7.4) at 4�C for
2–7 days and then stored in 0.1 M phosphate buffer
(pH 7.4) at 4�C. The retina was dissected away from
the sclera and separated from the tapetum and
underlying pigment epithelium, with care taken to
maintain the orientation of the retina. Once the vitre-
ous humour was carefully cut away from the retina,
peripheral slits were made in order to flatten the retina
onto a gelatinised glass slide. The retinae were fixed to
the slide using 16% paraformaldehyde, rinsed in dis-
tilled water and air dried. The five retinae examined
were first defatted in xylene, and then rehydrated
through a descending alcohol series followed by a rinse
in distilled water. The retinae were then stained for
Nissl substance using a 0.05% cresyl violet solution
(pH 4.3) for 5–9 min. Once staining was complete, the
retinae were rinsed in distilled water, dehydrated
through an ascending alcohol series and cleared in
xylene. Stained slides were then coverslipped in
DEPEX (Aldrich Chemical Company Inc., USA).
Retinae were placed on a visualiser (ELMO Visual
Presenter EV-550) and the enlarged outline was traced
onto transparent graph paper, with care taken to match
the calibrations of the graph paper to the projected
image of a calibrated micrometer slide. Retinae were
then examined using a compound microscope (Leitz
Dialux 20), fitted with an eyepiece graticule, at a mag-
nification of either ·630 or ·1,000. A scale was deter-
mined by matching obvious landmarks on the retina
with the relative position of the microscope stage. Ret-
inal cells located within the ganglion cell layer were
visualized using a 10 · 10 square eyepiece graticule and
sampled every 1 mm across the retina. In elasmo-
branchs, ganglion cells, in addition to amacrine and glial
cells, lie within both the inner plexiform and ganglion
cell layers (Walls 1942; Anctil and Ali 1974; Gruber and
Cohen 1978; Peterson and Rowe 1980; Collin 1988). All
neural elements in these two layers were counted and
no attempt was made to distinguish ganglion cells from
70 J Comp Physiol A (2007) 193:67–79
123

amacrine cells. Glial cells were easily identified by their
dense staining and elongated shape (Hughes 1977) and
were excluded from cell counts. Retinal shrinkage is
known to vary between 2 and 10% using the whole-
mount method (Hart 2002) but was not taken into ac-
count here. However, since the artefactually high cell
packing associated with retinal shrinkage occurs pre-
dominantly at the periphery and along the radial cuts
placed into the retina prior to wholemounting (Mednick
and Springer 1988), these areas were avoided in the
assessment of cell density. The number of cells counted
was converted to cells mm–2 by dividing by the sampled
area (15.1 · 10–3 mm2 at ·630 magnification and
7.2 · 10–3 mm2 at ·1,000 magnification). Iso-density
contour maps were then constructed by joining areas of
similar cell density and creating smooth curves.
Lens focal length–ray tracing and cryosectioning
To establish the focal length of the lens, we used laser
ray tracing and direct measurements from transverse
sections of frozen eyes. Four eyes from three individ-
uals (21.1, 25.1, and 30.2 DW) were used for laser ray
tracing. Following euthanasia with an overdose of
MS222 (1:2,000 in seawater), the eyes were quickly
removed. A minute orientation mark was made in the
lens to ensure that ray tracing measurements were
made along the optic axis. The lens was then excised
and stabilised on a small washer situated on top of a
glass block within a container filled with elasmobranch
Ringer solution. A moveable, collimated red laser
diode (k = 655 nm) was mounted on a rack and pinion
assembly at one end of the container, and the lens
positioned such that the laser beam would pass through
the horizontal meridian. A digital camera (Optio 555,
Pentax, Japan) was mounted directly above the lens.
For each eye, five photographs were taken with the
laser beam passing through the lens at five different
points; one directly through the centre of the lens, one
on each edge of the lens, and one between the edge
and the centre of the lens on either side. To improve
visualisation of the laser beam, two drops of milk were
added to the Ringer solution. The five digital images
were then downloaded to a PC and overlayed using
Photoshop 7.0 (Adobe) to determine where the beams
converged. The distance from the lens centre to the
point of convergence was considered to be the focal
length. Matthiessen’s ratio was calculated by dividing
this distance by the lens radius (Matthiessen 1880).
For cryosectioning, the right eye from a single indi-
vidual (24.0 cm DW) was frozen and sectioned to obtain
intraocular dimensions in the axial plane. The eye was
removed and frozen in a mixture of dry ice and ethanol
(Sivak 1978) and stored at –80�C. Having first noted the
orientation, the eye was then embedded in Tissue-Tek
OCT compound (Sakura Finetechnical Co., Ltd, Tokyo,
Japan) containing a few drops of black Indian ink to
distinguish the outline of the cornea. The resultant block
was sectioned at –25�C on a cryostat (American Optical
Corporation, New York, USA). Scaled photographs of
the block face were taken every 80 lm. The photograph
showing the greatest lens thickness was identified and
taken to represent a section through the geometric axis
of the eye (Sivak 1976, 1978) and used for optical
measurements. Measurements of lens to retina distances
were made from the lens centre to the choroid–retina
border (Sivak 1976; Hueter 1980) at a range of angles
(from +45� to –60�) on either side of the geometric axis,
which is the line joining the centre of the lens to the
centre of the pupil (Sivak 1976; Collin et al. 1999).
Calculating spatial resolving power assuming
a hexagonal mosaic
Focal lengths (f) of lenses from eyes used to measure
ganglion cell topography were calculated using the
averaged values measured using laser ray tracing.
Estimates of the theoretical peak spatial resolving
power were calculated using the maximum ganglion
cell density found in the retina and the focal length.
Following the methods of Hart (2002) and assuming a
hexagonal retinal mosaic, the distance (d) subtended
by one degree on the retina was calculated where:
d ¼ 2pf
360: ð1Þ
Assuming that ganglion cells are the limiting factor
for spatial resolving power and that they are packed in
a hexagonal array, the cell-to-cell spacing (S) was
determined using the formula:
S2 ¼ 2
Dffiffiffi
3p
� � ; ð2Þ
where D is the peak density of ganglion cells mm–2.
The maximum spatial (Nyquist) frequency (v) of a
grating resolvable by this arrangement (Snyder and
Miller 1977) was calculated as:
v ¼ 1
Sffiffiffi
3p
� � : ð3Þ
To express spatial resolving power in cycles per
degree, the value of v was multiplied by d.
J Comp Physiol A (2007) 193:67–79 71
123

Results
The eyes of Dasyatis kuhlii are located on the dorsal
surface of the head and face laterally, as seen in other
batoid elasmobranchs (Fig. 1a). Each eye has a near-
spherical lens and possesses a highly reflective blue–
green tapetum, extending across the retinal meridian,
but which is absent from the dorsal and ventral retinal
margins. The cornea is clear and continuous with a
hard, fibrous sclera. The cornea overlies a golden-
brown iris, which forms an oval-shaped pupil in the
dark-adapted state and a crescent-shaped pupil in the
light-adapted state (Fig. 1b).
Photoreceptor morphology
The retina of D. kuhlii possesses both rod and cone
photoreceptors (Fig. 1c, d). Photoreceptor morphology
and characterisation is based on light and electron
microscopy as well as observations and measurements
of unfixed receptors during microspectrophotometry
(Table 1). Rods are characterized by their long, cylin-
drical outer segments, varying in diameter from 2 to
3.5 lm and from 13 to 34 lm in length (Fig. 2a). Cones
are more difficult to locate within the retinal prepara-
tion, but are easily distinguishable from the rods by
their shorter, conical outer segments (Fig. 2b–d). Cone
outer segments were typically 2–10 lm in length, and
tapered from 2 to 5 lm at the base closest to the inner
segment to 1–2 lm at the tip. Three different cone
types can be distinguished based solely on the diameter
of the inner segment and the location of the nucleus
(vitread to the outer limiting membrane (OLM),
sclerad to the OLM or straddling the OLM) (Fig. 2).
Microspectrophotometry
Microspectrophotometric data for all photoreceptors
are summarized in Table 2 and Fig. 3. All visual pig-
ment absorbance spectra are considered to represent
vitamin A1-based visual pigments, or rhodopsins, based
on the fit of the data to A1 visual pigment templates
(Govardovskii et al. 2000). The retina of D. kuhlii
contains a single type of rod, the outer segment of
Fig. 1 Dorsal (a) and lateral (b) views of the blue-spottedmaskray, Dasyatis kuhlii, showing the elevated eyes andcrescent-shaped pupil in the light-adapted state. c Lightmicrograph of the retina in transverse section showing the thicklayer of photoreceptors (p). Note the myelinated axons of theganglion cells situated in the ganglion cell layer (gcl) and thelarge horizontal cells tiered into at least three sublaminae. d Low
power electron micrograph showing the slender outer segmentsof the rod photoreceptors (rp) abutting the retinal pigmentepithelium (rpe) and the layer of cone photoreceptors (cp)adjacent to the outer nuclear layer (onl). Four cones are depictedby asterisks. ct choroidal tapetum, inl inner nuclear layer, iplinner plexiform layer. Scale bars 50 mm in a; 30 mm in b; 25 lmin c; 20 lm in d
72 J Comp Physiol A (2007) 193:67–79
123
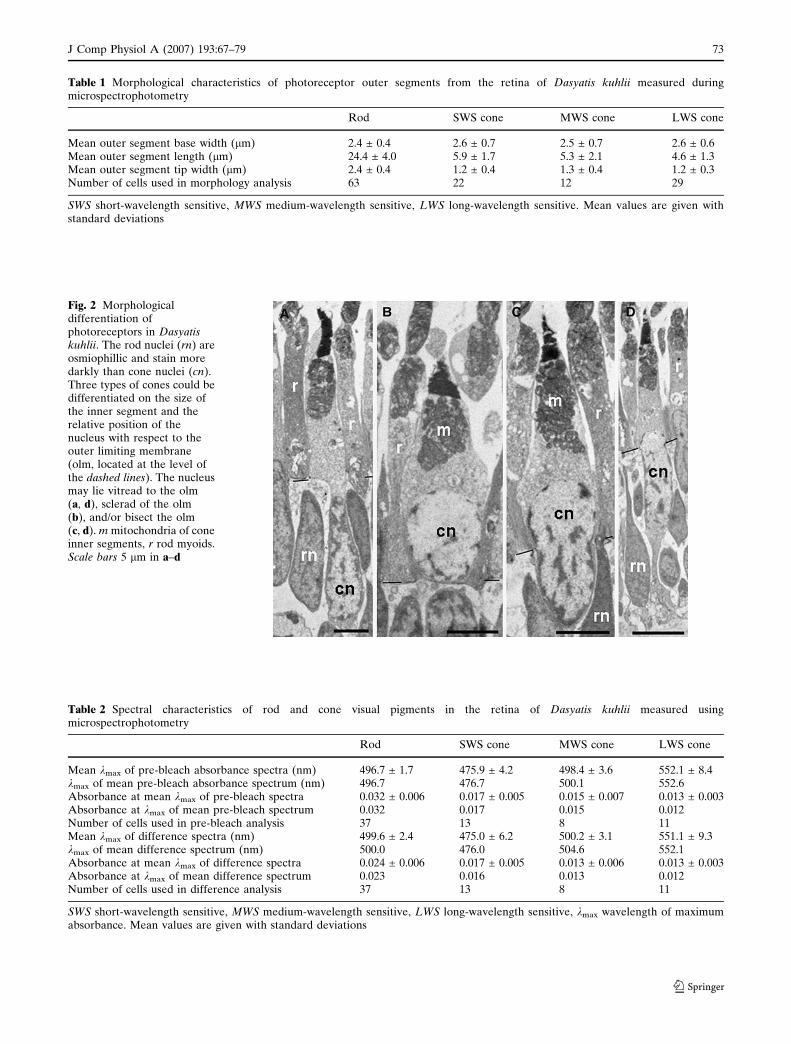
Table 1 Morphological characteristics of photoreceptor outer segments from the retina of Dasyatis kuhlii measured duringmicrospectrophotometry
Rod SWS cone MWS cone LWS cone
Mean outer segment base width (lm) 2.4 ± 0.4 2.6 ± 0.7 2.5 ± 0.7 2.6 ± 0.6Mean outer segment length (lm) 24.4 ± 4.0 5.9 ± 1.7 5.3 ± 2.1 4.6 ± 1.3Mean outer segment tip width (lm) 2.4 ± 0.4 1.2 ± 0.4 1.3 ± 0.4 1.2 ± 0.3Number of cells used in morphology analysis 63 22 12 29
SWS short-wavelength sensitive, MWS medium-wavelength sensitive, LWS long-wavelength sensitive. Mean values are given withstandard deviations
Fig. 2 Morphologicaldifferentiation ofphotoreceptors in Dasyatiskuhlii. The rod nuclei (rn) areosmiophillic and stain moredarkly than cone nuclei (cn).Three types of cones could bedifferentiated on the size ofthe inner segment and therelative position of thenucleus with respect to theouter limiting membrane(olm, located at the level ofthe dashed lines). The nucleusmay lie vitread to the olm(a, d), sclerad of the olm(b), and/or bisect the olm(c, d). m mitochondria of coneinner segments, r rod myoids.Scale bars 5 lm in a–d
Table 2 Spectral characteristics of rod and cone visual pigments in the retina of Dasyatis kuhlii measured usingmicrospectrophotometry
Rod SWS cone MWS cone LWS cone
Mean kmax of pre-bleach absorbance spectra (nm) 496.7 ± 1.7 475.9 ± 4.2 498.4 ± 3.6 552.1 ± 8.4kmax of mean pre-bleach absorbance spectrum (nm) 496.7 476.7 500.1 552.6Absorbance at mean kmax of pre-bleach spectra 0.032 ± 0.006 0.017 ± 0.005 0.015 ± 0.007 0.013 ± 0.003Absorbance at kmax of mean pre-bleach spectrum 0.032 0.017 0.015 0.012Number of cells used in pre-bleach analysis 37 13 8 11Mean kmax of difference spectra (nm) 499.6 ± 2.4 475.0 ± 6.2 500.2 ± 3.1 551.1 ± 9.3kmax of mean difference spectrum (nm) 500.0 476.0 504.6 552.1Absorbance at mean kmax of difference spectra 0.024 ± 0.006 0.017 ± 0.005 0.013 ± 0.006 0.013 ± 0.003Absorbance at kmax of mean difference spectrum 0.023 0.016 0.013 0.012Number of cells used in difference analysis 37 13 8 11
SWS short-wavelength sensitive, MWS medium-wavelength sensitive, LWS long-wavelength sensitive, kmax wavelength of maximumabsorbance. Mean values are given with standard deviations
J Comp Physiol A (2007) 193:67–79 73
123

which contains a medium-wavelength (‘green’) sensi-
tive visual pigment with a mean wavelength of maxi-
mum absorbance (kmax) of the pre-bleach spectra at
496.7 ± 1.7 nm (n = 37). Cone outer segments contain
visual pigments that could be characterised into three
spectrally different types: a short-wavelength (‘blue’)
sensitive pigment with a mean pre-bleach kmax of
475.9 ± 4.2 nm (n = 13), a medium-wavelength
(‘green’) sensitive pigment with a mean pre-bleach
kmax of 498.4 ± 3.6 nm (n = 8), and a long-wavelength
(‘red’) sensitive pigment with a mean pre-bleach kmax
of 552.1 ± 8.4 nm (n = 11). Green cones were encoun-
tered much less frequently than the other cone types.
Only records from short, distinctly tapered outer
segments were included for analysis to avoid the possi-
bility of measuring a rod outer segment by mistake, as
the kmax values are almost identical.
Ocular media spectral transmittance
Ocular media spectral transmittance measurements
were averaged and normalized for the two eyes and are
Fig. 3 a Normalized meanphotoreceptor visual pigmentabsorbance spectra fromDasyatis kuhlii. The pre-bleach spectra (circles) areoverlayed with rhodopsinvisual pigment templates ofthe appropriate kmax
(Govardovskii et al. 2000);the post-bleach spectra(squares) are fitted with avariable point unweightedrunning average. bNormalized meanphotoreceptor visual pigmentbleaching difference spectraoverlayed with rhodopsinvisual pigment templates ofthe appropriate kmax
(Govardovskii et al. 2000).SWS, MWS and LWS refer toshort-, medium- and long-wavelength sensitive visualpigments, respectively
74 J Comp Physiol A (2007) 193:67–79
123

shown in Fig. 4. Ocular media measurements were ta-
ken from whole eyes and not for individual compo-
nents such as the cornea or lens. The T0.5 value of the
mean spectrum is 412 nm, and no light is transmitted
through the ocular media below approximately
380 nm.
Ganglion cell topography
The retina of D. kuhlii shows an elongated horizontal
streak of increased cell density extending across the
retinal meridian, dorsal to the optic nerve head
(Fig. 5). Cell densities within the horizontal streak
range from 2,000 to 4,000 cells mm–2. The retina of D.
kuhlii also possesses multiple areae of increased cell
density within the horizontal streak located both na-
sally and temporally, although the temporal area
(subtending frontal visual space) is larger and better
developed with an average peak of 4,251 ± 720 cells
mm–2 (n = 5). There is also an increase in cell density
around the centro-ventral located optic nerve head
(2,000–3,000 cells mm–2).
Lens focal length and spatial resolving power
Ray tracing was performed on four lenses of both right
and left eyes of D. kuhlii (Fig. 6a). Measurements of
focal length and Matthiessen’s ratio ranged from 5.63
to 10.41 mm and 2.17–2.67, respectively, with an
average Matthiessen’s ratio of 2.49 ± 0.20 (n = 4). The
lens is close to spherical with a dorso-ventral diameter
that is slightly longer than the axial diameter (ratio of
dorso-ventral diameter to axial diameter = 1:0.98).
From measurements made on the frozen, hemisected
eye, the distance from the centre of the lens to the
retina for a range of incident angles (from +30� to –60�about the visual axis, 0�) is essentially the same, with
an on-axis focal length of 8.00 mm (Fig. 6b). There is
no evidence of a ramped retina, which is seen in some
other stingrays (Sivak 1976). Using the peak ganglion
cell density from the topographical maps and the
averaged Matthiessen’s ratio from the ray tracing,
spatial resolving power values were calculated assum-
ing a hexagonal retinal mosaic for the five eyes used for
ganglion cell topography and range from 3.13 to 4.95
cycles per degree, with an average of 4.10 ± 0.69 cycles
per degree (n = 5).
Discussion
Dasyatis kuhlii used in this study were caught in water
less than 2 m deep, mainly off North Stradbroke Island
in Moreton Bay, Queensland, Australia. Although the
spectral characteristics of the water at this location
were not measured as part of this study, previous
radiance measurements taken nearby reveal that there
is a predominance of medium (‘green’) wavelengths at
depths of up to 5 m (Hart et al. 2004). A predominance
of medium wavelength light is typical of most coastal
waters, where the concentration of dissolved sub-
stances is higher than offshore waters, and as the depth
increases, the spectrum of light shifts to shorter
wavelengths since longer wavelengths are filtered out
(McFarland 1991).
Multiple cone types and the potential for colour
vision
The photoreceptors of D. kuhlii are typical of those
found in other elasmobranch species (Collin 1988;
Braekevelt 1994); rods were easily identifiable by their
long cylindrical outer segments, while cones were dis-
tinguished by their shorter, conical outer segments.
The presence of cones in the retina of D. kuhlii was
reported previously by Kohbara et al. (1987); however,
a quantitative estimate of the rod to cone ratio for D.
kuhlii has not been determined thus far. Peak rod to
cone ratios for other members of the Dasyatidae
studied range from 3:1 in the Atlantic stingray, D. sa-
bina (Logiudice and Laird 1994), to 10:1 in the short-
tailed stingray, D. brevicaudata (Braekevelt 1994). It is
expected that D. kuhlii will possess a rod to cone ratio
within this range. Although the size of the cone inner
segments and the relative position of their nuclei with
respect to the outer limiting membrane suggest three
morphological cone subtypes, there was no attempt to
correlate cone morphology with spectral sensitivity.
Fig. 4 Normalized mean (n = 8) transmittance spectrum of theocular media of Dasyatis kuhlii smoothed with a 31 nmunweighted running average. The wavelength at 0.5 of thenormalized transmittance (T0.5) is 412 nm
J Comp Physiol A (2007) 193:67–79 75
123

The rod visual pigment of D. kuhlii is a vitamin A1-
based rhodopsin with a kmax at 497 nm and is similar to
the rods of most other species of elasmobranch studied
to date, with the exception of deep-sea elasmobranchs,
which tend to have blue-shifted rod visual pigments
(Crescitelli et al. 1985). Although many elasmobranchs
are known to be active and feed during both day and
night, many are most active during dawn and dusk and
D. kuhlii is no exception. Light intensity is dramatically
decreased during these crepuscular periods, and the
spectral distribution of light varies at different times of
the day (McFarland 1986). In particular, a reduction of
yellow-orange light in the atmospheric spectrum re-
sults in an underwater spectrum dominated by short
wavelength photons and under these conditions, it
would be presumed that a rod visual pigment with a
shorter kmax would be optimal for enhancing scotopic
vision (McFarland 1991). These findings suggest that
the spectral position of the rod visual pigment of D.
kuhlii is a compromise that optimizes photon capture
under a variety of scotopic conditions, a hypothesis first
presented for tropical marine fishes that assumes that
the rod system is primarily used for the detection of
contrasting objects (Munz and McFarland 1973).
Dasyatis kuhlii possesses at least three spectrally-
distinct cone visual pigments and, therefore, is the third
recorded elasmobranch species to possess the potential
for trichromatic colour vision. While the rod and green
cone pigments had a similar maximum absorbance
value, every care was taken to distinguish between rods
and cone-like photoreceptors similar to the other cones
with different pigments. Rod and green cone pigments
are genetically distinct in a variety of vertebrates but
often show a similar kmax value (Heath et al. 1997;
Vihtelic et al. 1999). Using microspectrophotometry,
Gruber (1991) found only one cone type in the retina
of the Atlantic guitarfish, Rhinobatos lentiginosus, with
a kmax (499 nm) nearly identical to that of the rod vi-
sual pigment (496 nm). In contrast, Sillman et al.
(1996) were unable to measure the spectral sensitivity
of any cones known to be present in either the leopard
shark, Triakis semifasciata, or the brown smoothhound
Fig. 5 Topography of allneurons within the retinalganglion cell layer of the lefteye of a single specimen ofDasyatis kuhlii. (Discwidth = 228 mm; Equatorialeye diameter = 16.8 mm) Nnasal, V ventral, ON opticnerve head. Scale bar 2 mm
Fig. 6 a Laser ray tracing of the right lens of Dasyatis kuhlii. Thelens is immersed in elasmobranch Ringer solution containing twodrops of milk to aid in the visualisation of the laser beam, whichis directed through the axial meridian. (Lens axial diame-ter = 5.20 mm, lens focal length = 5.63 mm). b Cryosection of
the right eye in the axial plane along the optical axis (greatestlens diameter) showing the distance from the lens (l) to theretina (r). (Lens axial diameter = 6.50 mm, lens focallength = 8.00 mm). M medial, V ventral, c cornea. Scalebar 3 mm
76 J Comp Physiol A (2007) 193:67–79
123

shark, Mustelus henlei, using the same technique. In the
latter study, it is possible that cones were missed due to
the relatively low abundance and fragility of cone outer
segments and the low number of individuals examined.
To date, the only other species of elasmobranchs
known to have multiple cone visual pigments are the
reef-dwelling giant shovelnose ray, Rhinobatos typus,
and the coastal eastern shovelnose ray, Aptychotrema
rostrata. These two species have cone visual pigments
with kmax values at 477, 502 and 561 nm, and 459, 492
and 553 nm, respectively (Hart et al. 2004). An inter-
esting outcome of that study was that the visual pig-
ments of A. rostrata all had shorter kmax values than
those of R. typus. This was unexpected as the coral
habitat of R. typus is richer in shorter wavelengths than
the coastal waters in which A. rostrata live. The blue
and green cone pigments of D. kuhlii are more spec-
trally similar to those of R. typus, while the red cone
pigment is spectrally similar to that of A. rostrata.
Colour vision would be a significant advantage for D.
kuhlii and beneficial in prey detection, predator
avoidance, and possibly social behaviours and intra-
specific communication.
Spectral transmittance measurements showed that
wavelengths below about 380 nm are blocked by the
ocular media. The T0.5 value at 412 nm is comparable
to the spectral transmittance of the ocular media of
other dasyatids, such as the cowtail stingray, Pastina-
chus sephen (T0.5 402 nm) and the blue-spotted fantail
ray, Taeniura lymma (T0.5 437 nm), and the rhinobatid
ray Rhinobatos typus, which has a T0.5 value at 408 nm
(Siebeck and Marshall 2001). Many teleost fish are
known to have the potential for UV vision (Bowmaker
and Kunz 1987; Bowmaker et al. 1991; Hawryshyn and
Harosi 1994; McFarland and Loew 1994; Losey et al.
2003), and the genetic basis for ultraviolet-sensitive
visual pigments in the common ancestor of all extant
vertebrates has been established through molecular
studies on the southern hemisphere lamprey, Geotria
australis (Collin et al. 2003b; Collin and Trezise 2004).
It is possible that UV cones were missed using micro-
spectrophotometry, especially if they were present in
low numbers, but the ocular media transmittance data
suggests that UV wavelengths are not transmitted to
the retina and that D. kuhlii probably does not use UV
for vision.
Visual ecology and spatial resolving power
Dasyatis kuhlii possesses a dorsal horizontal streak of
increased ganglion cell density within which lie multi-
ple areae of higher cell density, located nasally, cen-
trally and temporally. Other species of ray possess a
very similar topographic arrangement, including the
giant shovelnose, ray Rhinobatos typus (Collin 1988),
the Atlantic stingray, Dasyatis sabina (Logiudice and
Laird 1994), Bigelow’s ray, Raja bigelowi (Bozzano
and Collin 2000), and the eastern shovelnose ray,
Aptychotrema rostrata (Litherland 2001). Many of
these bottom-dwelling rays, like D. kuhlii, lie on the
bottom or bury themselves in the substrate (often with
only their eyes and tail protruding), only swimming off
the bottom to forage for food or mates, or to escape
from predators (Tricas et al. 1997). Therefore, the
dorsal horizontal streak prevalent in most rays may be
important for the panoramic surveillance of the hori-
zon for potential predators, without the need for
extensive eye or body movements, which could reveal
the animals’ location (Bozzano and Collin 2000). The
temporal area in D. kuhlii is the largest of the three
areae and contains the highest cell density (mean
4,251 cells mm–2), suggesting that the lower frontal
region of the visual field is especially important. The
nasal, central and temporal areae found within the
streak would allow regions of the caudal, lateral and
nasal visual fields to be observed, respectively, with
higher spatial resolving power.
Essentially nothing is known of accommodation in
elasmobranchs, but it is assumed that the protractor
lentis muscle, which contracts to move the lens forward
for near vision, would remain relaxed post mortem.
This would then yield an altered focal length and
Matthiessen’s ratio when compared to a live animal or
the ray tracing, but it should be noted that the values
obtained for Matthiessen’s ratio were very similar
using both ray tracing and frozen section methods. A
hexagonal retinal mosaic optimises the spatial packing
of ganglion cells with circular receptive field profiles
and is probably a more accurate representation of
ganglion cell distribution in the retina than a square
mosaic (Snyder and Miller 1977; Wassle and Riemann
1978; Hart 2002), but nothing is known of retinal
packing in elasmobranchs and all previous studies
concerning elasmobranchs have calculated spatial
resolving powers assuming a square mosaic and a
Matthiessen’s ratio of 2.55. For comparison, values of
spatial resolving power for different species varied
from 3.98 to 7.64 cycles per degree, when corrected for
a hexagonal array (Hueter 1991; Bozzano and Collin
2000; Bozzano 2004). Pelagic species such as the tiger
shark, Galeocerdo cuvier, tend to have higher spatial
resolving power (7.19 cycles per degree), when com-
pared with benthic species such as the small-spotted
catshark, Scyliorhinus canicula (3.98 cycles per degree)
(Bozzano and Collin 2000). The calculated spatial
resolving power of D. kuhlii (4.12 cycles per degree) is
J Comp Physiol A (2007) 193:67–79 77
123

moderate when compared with the previous elasmo-
branchs studied and conforms to the trend that benthic
species have lower spatial resolving power than pelagic
species. This suggests that D. kuhlii is not as heavily
dependent on acute distance vision for such behaviours
as prey detection and predator avoidance and that in-
creased visual sensitivity, in conjunction with other
sensory modalities, may be more important.
Specific dietary information is lacking for most rays,
including D. kuhlii, but the majority of dasyatid species
feed on benthic or demersal invertebrates and fish
(Last and Stevens 1994; Tricas et al. 1997). The posi-
tion of the ventral mouth in the centre of the disc
dictates that in the final stages of a prey-directed
movement before a feeding strike, vision is obscured
by the animal itself. Therefore, the mechanoreceptive
lateral line and the electroreceptors (ampullae of
Lorenzini) are thought to play a large and important
role in foraging behaviour in rays, especially during the
final strike (Raschi 1986; Maruska and Tricas 1998;
Maruska 2001; Collin and Whitehead 2004). Vision,
however, may be useful in the initial detection of
epifaunal prey on the surface of the benthos, or the
detection of infaunal prey as they venture from holes
or burrows. Future studies should investigate the
relative sensitivity of the other sensory systems of
D. kuhlii, such as olfaction and electroreception, in
order to gain a more comprehensive analysis of how all
the sensory modalities function together.
Acknowledgments The authors would like to first thank twoanonymous reviewers for helpful comments on improving themanuscript. The authors would also like to thank Mike Bennett,Simon Pierce, Scott Cutmore, Peter Kyne, Joanna Stead, TinaChua, Justin Marshall and the staff of the University ofQueensland Moreton Bay Research Station. This work wasfunded by ARC Discovery Grants DP0558681 and DP0558844,NHMRC Project Grant 179837, the American ElasmobranchSociety (Donald R. Nelson Behaviour Research Award), andSigma Xi.
References
Anctil M, Ali MA (1974) Giant ganglion cells in the retina of thehammerhead shark (Sphyrna lewini). Vis Res 14:903–904
Bowmaker JK, Kunz YW (1987) Ultraviolet receptors, tetra-chromatic colour vision and retinal mosaics in the browntrout (Salmo trutta): age-dependent changes. Vis Res27:2101–2108
Bowmaker JK, Thorpe A, Douglas RH (1991) Ultraviolet-sensitive cones in the goldfish. Vis Res 31:349–352
Bozzano A (2004) Retinal specialisations in the dogfish Cen-troscymnus coelolepis from the Mediterranean deep-sea. SciMar 68:185–195
Bozzano A, Collin SP (2000) Retinal ganglion cell topography inelasmobranchs. Brain Behav Evol 55:191–208
Bozzano A, Murgia R, Vallerga S, Hirano J, Archer S (2001) Thephotoreceptor system in the retina of two dogfishes, Scylio-rhinus canicula and Galeus melastomus: possible relation-ship with depth distribution and predatory lifestyle. J FishBiol 59:1258–1278
Braekevelt CR (1994) Retinal photoreceptor fine structure in theshort-tailed stingray (Dasyastis brevicaudata). Histol Histo-pathol 9:507–514
Cohen JL (1989) Functional pathways in the elasmobranchretina. J Exp Zool Suppl 2:75–82
Cohen JL, Hueter RE, Organisciak DT (1990) The presence of aporphyropsin-based visual pigment in the juvenile lemonshark (Negaprion brevirostris). Vis Res 30:1949–1953
Collin SP (1988) The retina of the shovel-nosed ray, Rhinobatosbatillum (Rhinobatidae): morphology and quantitative anal-ysis of the ganglion, amacrine and bipolar cell populations.Exp Biol 47:195–207
Collin SP, Hart NS, Shand J, Potter IC (2003a) Morphology andspectral absorption characteristics of retinal photoreceptorsin the southern hemisphere lamprey (Geotria australis). VisNeurosci 20:119–130
Collin SP, Knight MA, Davies WL, Potter IC, Hunt DM, TreziseAEO (2003b) Ancient colour vision: multiple opsin genes inthe ancestral vertebrates. Curr Biol 13:R864–R865
Collin SP, Pettigrew JD (1988) Retinal topography in reefteleosts I. Some species with well-developed areae butpoorly-developed streaks. Brain Behav Evol 31:269–282
Collin SP, Potter IC, Braekevelt CR (1999) The ocular mor-phology of the southern hemisphere lamprey Geotriaaustralis Gray, with special reference to optical specialisa-tions and the characterisation and phylogeny of photore-ceptor types. Brain Behav Evol 54:96–118
Collin SP, Trezise AEO (2004) The origins of colour vision invertebrates. Clin Exp Optom 87:217–223
Collin SP, Whitehead D (2004) The functional roles of passiveelectroreception in non-electric fishes. Anim Biol 54:1–25
Crescitelli F, McFall-Ngai M, Horwitz J (1985) The visualpigment sensitivity hypothesis: further evidence from fishesof varying habitats. J Comp Physiol A Sens Neural BehavPhysiol 157:323–333
Denton EJ, Shaw TI (1963) The visual pigments of some deep-sea elasmobranchs. J Mar Biol Assoc UK 43:65–70
Douglas RH, McGuigan CM (1989) The spectral transmission offreshwater teleost ocular media-an interspecific comparisonand a guide to potential ultraviolet sensitivity. Vis Res29:871–879
Dowling JE, Ripps H (1970) Visual adaptation in the retina ofthe skate. J Gen Physiol 56:491–520
Govardovskii VI, Fyhrquist N, Reuter T, Kuzmin DG, Donner K(2000) In search of the visual pigment template. VisNeurosci 17:509–528
Gruber SH (1975) Duplex vision in the elasmobranchs: histo-logical, electrophysiological and psychophysical evidence.In: Ali MA (ed) Vision in fishes: new approaches inresearch. Plenum Press, New York, pp 525–540
Gruber SH, Cohen JL (1978) Visual system of the elasmo-branchs: state of the art 1960–1975. In: Hodgson ES,Mathewson RF (eds) Sensory biology of sharks, skates,and rays. Office of Naval Research, Arlington, pp 11–116
Gruber SH, Hamasaki DH, Bridges CDB (1963) Cones in theretina of the lemon shark (Negaprion brevirostris). Vis Res3:397–399
Gruber SH, Loew ER, McFarland WN (1991) Rod and conepigments of the Atlantic guitarfish, Rhinobatos lentiginosusGarman. J Exp Zool Suppl 5:85–87
78 J Comp Physiol A (2007) 193:67–79
123

Hart NS (2002) Vision in the peafowl (Aves: Pavo cristatus).J Exp Biol 295:3925–3935
Hart NS (2004) Microspectrophotometry of visual pigments andoil droplets in a marine bird, the wedge-tailed shearwaterPuffinus pacificus: topographic variations in photoreceptorspectral characteristics. J Exp Biol 207:1229–1240
Hart NS, Lisney TJ, Collin SP (2006) Visual communication inelasmobranchs. In: Ladich F, Collin SP, Moller P, KapoorBG (eds) Fish communication. Science Publishers, Inc.,Enfield, pp 337–392
Hart NS, Lisney TJ, Marshall NJ, Collin SP (2004) Multiple conevisual pigments and the potential for trichromatic colourvision in two species of elasmobranch. J Exp Biol 207:4587–4594
Hawryshyn CW, Harosi FI (1994) Spectral characteristics ofvisual pigments in rainbow trout (Oncorhynchus mykiss).Vis Res 34:1385–1392
Heath LA, Wilkie SE, Bowmaker JK, Hunt DM (1997) The rodand green cone opsins of two avian species, the budgerigar,Melopsittacus undulatus, and the mallard duck, Anas platy-rhynchus. Gene 204:121–126
Hueter RE (1980) Physiological optics of the eye of the juvenilelemon shark (Negaprion brevirostris) [Masters thesis].University of Miami, Coral Gables
Hueter RE (1991) Adaptations for spatial vision in sharks. J ExpZool Suppl 5:130–141
Hueter RE, Mann DA, Maruska KP, Sisneros SA, Demski LS(2004) Sensory biology of elasmobranchs. In: Carrier JC,Musick JA, Heithaus MR (eds) Biology of sharks and theirrelatives. CRC Press, New York
Hughes A (1977) The topography of vision in mammals oncontrasting lifestyles: comparative optics and retinalorganization. In: Autrum H, Jung R, Loewenstein WR,MacKay DN, Teuber HL (eds) Handbook of sensoryphysiology, vol VIII/5. Springer, Berlin Heidelberg NewYork, pp 613–756
Jacobs GH (1981) Comparative color vision. Academic, NewYork
Kohbara J, Niwa H, Oguri M (1987) Comparative light micro-scopic studies on the retina of some elasmobranch fishes.B Jpn Soc Sci Fish 53:2117–2125
Last PR, Compagno LJV (1999) FAO specie identification guidefor fishery purposes. In: Carpenter KE, Niem VH (eds) Theliving marine resources of the Western Central Pacific, vol 2.Batoid fishes, chimaeras and bony fishes part 1 (Elopidae toLinophrynidae). FAO, Rome
Last PR, Stevens JD (1994) Sharks and Rays of Australia.CSIRO, Australia
Litherland L (2001) Retinal topography in elasmobranchs:interspecific and ontogenetic variation [Honours thesis].University of Queensland, Australia
Logiudice FT, Laird RJ (1994) Morphology and density distri-bution of cone photoreceptor in the retina of the Atlanticstingray, Dasyatis sabina. J Morphol 221:277–289
Losey GS, McFarland WN, Loew ER, Zamzow JP, Nelson PA,Marshall NJ (2003) Visual biology of Hawaiian coral reeffish. I. Ocular transmission and visual pigments. Copeia2003:433–454
MacNichol EF (1986) A unifying presentation of photopigmentspectra. Vis Res 26:1543–1556
Maruska KP (2001) Morphology of the mechanosensory lateralline system in elasmobranch fishes; ecological and behav-ioral considerations. Environ Biol Fishes 60:47–75
Maruska KP, Tricas TC (1998) Morphology of the mechano-sensory lateral line system in the Atlantic stingray, Dasyatissabina: the mechanotactile hypothesis. J Morphol 238:1–22
Matthiessen (1880) Untersuchungen uber den Aplanatismus unddie Periscopie der Krystallinsen des Fischauges. PfugersArch Gesamate Physiol Menschen Tiere 21:287–307
McEachran JD, Aschliman N (2004) Phylogeny of Batoidea. In:Carrier JC, Musick JA, Heithaus MR (eds) Biology ofsharks and their relatives. CRC Press, New York
McFarland WN (1986) Light in the sea-correlations with behav-iors of fishes and invertebrates. Am Zool 26:389–401
McFarland WN (1991) Light in the sea: the optical world ofelasmobranches. J Exp Zool Suppl 5:3–12
McFarland WN, Loew ER (1994) Ultraviolet visual pigments inmarine fishes of the family Pomacentridae. Vis Res 34:1393–1396
Mednick AS, Springer AD (1988) Asymmetric distribution ofretinal ganglion cells in goldfish. J Comp Neurol 268:49–59
Munz FW, McFarland WN (1973) The significance of spectralposition in the rhodopsins of tropical marine fishes. Vis Res13:1829–1874
Neumayer L (1897) Der feinere Bau der Salachier Retina.Archiv Mikroskopishes Anat 48:83–111
Peterson EH, Rowe MH (1980) Different regional specializa-tions of neurons in the ganglion cell layer and innerplexiform layer of the California horned shark, Heterodon-tus francisci. Brain Res 201:195–201
Raschi WC (1986) A morphological analysis of the ampullae ofLorenzini in selected skates (Pisces, Rajoidae). J Morphol189:225–247
Schaper A (1899) Die nervosen Elemente der Selachier-Retinain Methylenblaupraparaten. Nebst einigen Bemerkungenuber das ‘‘Pigmentepithel’’ und die konzentrischen Stutzz-ellen. Festschrift zum 70ten Geburtstag von Carl vonKupffer. Gustav Fischer, Jena, pp 1–10
Shand J, Hart NS, Thomas N, Partridge JC (2002) Developmen-tal changes in the cone visual pigments of black breamAcanthopagrus butcheri. J Exp Biol 205:3661–3667
Siebeck UE, Marshall NJ (2000) Transmission of ocular media inlabrid fishes. Philos Trans R Soc Lond B Biol Sci 355:1257–1261
Siebeck UE, Marshall NJ (2001) Ocular media transmission ofcoral reef fish-can coral reef fish see ultraviolet light? VisRes 41:133–149
Sillman AJ, Letsinger GA, Patel S, Loew ER, Klimley AP (1996)Visual pigments and photoreceptors in two species of shark,Triakis semifasciata and Mustelus henlei. J Exp Zool 276:1–10
Sivak JG (1976) The accommodative significance of the ‘‘ramp’’retina of the eye of the stingray. Vis Res 16:945–950
Sivak JG (1978) Optical characteristics of the eye of the spinydogfish (Squalus acanthias). Rev Can Biol 37:209–217
Snyder AW, Miller WH (1977) Photoreceptor diameter andspacing for highest resolving power. J Opt Soc Am 67:696–698
Stone J (1981) The wholemount handbook: a guide to thepreparation and analysis of retinal wholemounts. ClarendonPress, Kensington
Tester AL, Kato S (1966) Visual target discrimination in blacktipsharks (Carcharhinus melanopterus) and grey sharks (C.menisorrah). Pac Sci 20:461–471
Tricas TC, Deacon K, Last P, McCosker JE, Walker TI, Taylor L(1997) Sharks and rays. Harper Collins, London
Vihtelic TS, Doro CJ, Hyde DR (1999) Cloning and character-ization of six zebrafish photoreceptor opsin cDNAs andimmunolocalization of their corresponding proteins. VisNeurosci 16:571–585
Walls GL (1942) The vertebrate eye and its adaptive radiation.Cranbook Press, Bloomfield Hills
Wassle H, Riemann HJ (1978) The mosaic of nerve cells in themammalian retina. Proc R Soc Lond B Biol Sci 200:441–461
J Comp Physiol A (2007) 193:67–79 79
123