coloring maps and graphs · 2017-08-25 · 13.2 coloring graphs with two colors 199 the two regions...
TRANSCRIPT

13 Coloring Maps and Graphs
13.1 Coloring Regions with Two Colors
We draw some circles on the plane (say, n in number). These divide the plane into a number of regions. Figure 13.1 shows such a set of circles, and also an "alternating" coloring of the regions with two colors; it gives a nice pattern. Now our question is, can we always color these regions this way? We'll show that the answer is yes. Let us state this more exactly:
Theorem 13.1.1 The regions formed by n circles in the plane can be colored with red and blue in such a way that any two regions that share a common boundary arc will be colored differently.
(If two regions have only one or two boundary points in common, then they may get the same color.)
Let us first see why a direct approach to proving this theorem does not work. We could start with coloring the outer region, say blue; then we have to color its neighbors red. Could it happen that two neighbors are at the same time neighbors of each other? Perhaps drawing some pictures and then arguing carefully about them, you can design a proof that this cannot happen. But then we have to color the neighbors of the neighbors blue again, and we would have to prove that no two of these are neighbors of each other. This could get quite complicated! And then we would have to repeat this for the neighbors of the neighbors of the neighbors ....
We should find a better way to prove this, and fortunately, there is a better way!
L. Lovász et al., Discrete Mathematics© Springer Science+Business Media, LLC 2003

198 13. Coloring Maps and Graphs
FIGURE 13.1. Two-coloring the regions formed by a set of circles.
Proof. We prove the assertion by induction on n, the number of circles. If n = 1, then we get only two regions, and we can color one of them red, the other one blue. So let n > 1. Select any of the circles, say C, and forget about it for the time being. We assume that the regions formed by the remaining n - 1 circles can be colored with red and blue so that regions that share a common boundary arc get different colors (this is just the induction hypothesis).
Now we put back the remaining circle, and change the coloring as follows: Outside C, we leave the coloring as it was; inside C, we interchange red and blue (Figure 13.2).
. .....
~ .....
FIGURE 13.2. Adding a new circle and recoloring.
It is easy to see that the coloring obtained this way satisfies what we wanted. In fact, look at any small piece of arc of any of the circles. If this arc is outside C, then the two regions on its two sides were different and their colors did not change. If the arc is inside C, then again, the two regions on its two sides were differently colored, and even though their colors were switched, they are still different. Finally, the arc could be on C itself. Then

13.2 Coloring Graphs with Two Colors 199
the two regions on both sides of the arc were one and the same before we put C back, and so they had the same color. Now, one of them is inside C and this switched its color; the other is outside, and this did not. So after the recoloring, their colors will be different.
Thus we have proved that the regions formed by n circles can be colored with two colors, provided that the regions formed by n - 1 circles can be colored with 2 colors. By the Principle of Induction, this proves the theorem. D
FIGURE 13.3. Find the color of a region.
13.1.1 Assume that the color of the outer region is blue. Then we can describe what the color of a particular region R is without having to color the whole picture as follows:
if R lies inside an even number of circles, it will be colored blue;
if R lies inside an odd number of circles, it will be colored red.
Prove this assertion (see Figure 13.3).
13.1.2 (a) Prove that the regions, into which n straight lines divide the plane, are colorable with 2 colors.
(b) How could you describe what the color of a given region is?
13.2 Coloring Graphs with Two Colors
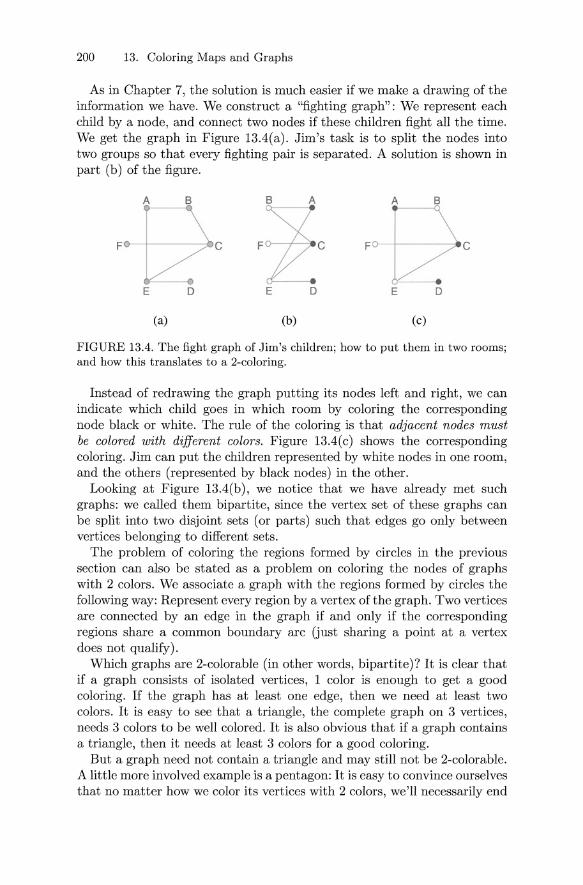
Jim has six children, and it is not an easy bunch. Chris fights with Bob, Faye, and Eve all the time; Eve fights (besides with Chris) with Al and Di all the time; and Al and Bob fight all the time. Jim wants to put the children in two rooms so that pairs of fighters should be in different rooms. Can he do this?
200 13. Coloring Maps and Graphs
As in Chapter 7, the solution is much easier if we make a drawing of the information we have. We construct a "fighting graph": We represent each child by a node, and connect two nodes if these children fight all the time. We get the graph in Figure 13.4(a). Jim's task is to split the nodes into two groups so that every fighting pair is separated. A solution is shown in part (b) of the figure.
A B
FD---+----... C
E
(a)
--D
A B
Fo--f'--·C Fo---+----... C
E D E D
(b) (c)
FIGURE 13.4. The fight graph of Jim's children; how to put them in two rooms; and how this translates to a 2-coloring.
Instead of redrawing the graph putting its nodes left and right, we can indicate which child goes in which room by coloring the corresponding node black or white. The rule of the coloring is that adjacent nodes must be colored with different colors. Figure 13.4( c) shows the corresponding coloring. Jim can put the children represented by white nodes in one room, and the others (represented by black nodes) in the other.
Looking at Figure 13.4(b), we notice that we have already met such graphs: we called them bipartite, since the vertex set of these graphs can be split into two disjoint sets (or parts) such that edges go only between vertices belonging to different sets.
The problem of coloring the regions formed by circles in the previous section can also be stated as a problem on coloring the nodes of graphs with 2 colors. We associate a graph with the regions formed by circles the following way: Represent every region by a vertex of the graph. Two vertices are connected by an edge in the graph if and only if the corresponding regions share a common boundary arc (just sharing a point at a vertex does not qualify).
Which graphs are 2-colorable (in other words, bipartite)? It is clear that if a graph consists of isolated vertices, 1 color is enough to get a good coloring. If the graph has at least one edge, then we need at least two colors. It is easy to see that a triangle, the complete graph on 3 vertices, needs 3 colors to be well colored. It is also obvious that if a graph contains a triangle, then it needs at least 3 colors for a good coloring.
But a graph need not contain a triangle and may still not be 2-colorable. A little more involved example is a pentagon: It is easy to convince ourselves that no matter how we color its vertices with 2 colors, we'll necessarily end

13.2 Coloring Graphs with Two Colors 201
up with two adjacent vertices with the same color. We can generalize this observation to any cycle of odd length: If we start coloring any node with (say) black, then as we walk along the cycle we must color the next node white, the third node black, and so on. We must alternate with colors black and white. But because the cycle is odd, we return to the start node in the wrong phase, ending up with coloring the last node black, and so having two adjacent black nodes.
It follows that if a graph contains an odd cycle, then it cannot be 2-colorable. The following simple theorem asserts that nothing more complicated can go wrong:
Theorem 13.2.1 A graph is 2-colorable if and only if it contains no odd cycle.
Proof. We already know the "only if" part of this theorem. To prove the "if" part, suppose that our graph has no odd cycle. Pick any vertex a and color it black. Color all its neighbors white. Notice that there cannot be an edge connecting two neighbors of a, because this would give a triangle. Now color every uncolored neighbor of these white vertices black. We have to show that there is no edge between the black vertices: no edge goes between u and the new black vertices, since the new black vertices didn't belong to the neighbors of a; no edge can go between the new black vertices, because it would give a cycle of length 3 or 5. Continuing this procedure the same way, if our graph is connected, we'll end up with 2-coloring all vertices.
It is easy to argue that there is no edge between two vertices of the same color: Suppose that this is not the case, so we have two adjacent vertices u and v colored black (say). The node u is adjacent to a node Ul colored earlier (which is white); this in turn is adjacent to a node U2 colored even earlier (which is black); etc. This way we can pick a path P from U that goes back all the way to the starting node. Similarly, we can pick a path Q from v to the starting node. Starting from v, let's follow Q back until it first hits P, and then follow P forward to u. This path forms a cycle with the edge uv. Since the nodes along the path alternate in color, but start and end with black, this cycle is odd, a contradiction (Figure 13.5).
If the graph is connected, we are done: We have colored all vertices. If our graph is not connected, we perform the same procedure in every component, and obviously, this will give a good 2-coloring of the whole graph. This proves Theorem 13.2.1. 0
It is worth pointing out that in the proof above we did not really have much choice: We could choose the color of the starting node, but then our hands were forced all the way through coloring the connected component of that point. Then we had a free choice for the color of the first node of the next component, but then the rest of the component was forced again. This means that we not only proved Theorem 13.2.1, but also gave an algorithm for finding a 2-coloring if it exists (and to find an odd cycle if it does not).

202 13. Coloring Maps and Graphs
u
a FIGURE 13.5. Bad 2-coloring yields an odd cycle.
13.2.1 Prove that the graph obtained from the regions of a system of circles contains no odd cycle.
13.3 Coloring graphs with many colors
Suppose that we have a graph, and we find that it cannot be colored with two colors; we may want to color it with more colors. (The rule of the game is the same: the two endpoints of any edge must be colored differently.) If we have many colors, then we can just color every node with a different color. If the graph has n nodes, then n colors are always sufficient. Obviously, if the graph is complete, then we do need n colors, since every node must get a different color (recall the Pigeonhole Principle!).
If we can color a graph with k colors, we say that the graph is k-colorable. The smallest k for which the graph is k-colorable is called the chromatic number of the graph.
Suppose that we want to use, say, only 3 colors. Can we decide whether they are enough to color the nodes? It turns out that going from 2 colors to 3 is a real jump in difficulty.
We can try to proceed as in the case of 2 colors. Let the 3 colors be red, blue and green. We start with any node a, and color it red. This we can do without loss of generality, since all colors play the same role. Then we take a neighbor b of a, and color it blue (this is still no restriction of generality). Now we proceed to another neighbor c of a. If c is connected to b by an edge, then its color is forced to be green. But suppose that it is not connected to b. Then we have two choices to color c, blue or green, and these are not alike: It makes a difference whether band c have the same color or not. So we make a choice and proceed. In the next step, we may have to make a choice again, etc. If any of these choices turns out to be wrong, we'll have to backtrack and try the other one. Eventually, if a 3-coloring is possible at all, we'll find it.

13.3 Coloring graphs with many colors 203
All this backtracking takes a lot of time. We don't give a rigorous analysis here, just note that in general, we may have to go through both choices for a large fraction (say, half) of the nodes, which will take time 2n/2. We have seen that this number becomes astronomical for very moderate sizes of n.
But the jump in difficulty is not that this simple procedure takes so long: the real trouble is that nothing substantially better is known! And there are results in complexity theory (cf. Section 15.1) that suggest that nothing substantially better can be designed at all. The situation is similar for coloring with any number k of colors, once k > 2.
Suppose that we have a graph and we badly need to color it with k colors. Are there at least some special cases when we can do so? One such case is described in the following result, called Brooks's Theorem:
Theorem 13.3.1 If every node in a graph has degree at most d, then the graph can be colored with d + 1 colors.
Of course, the condition given in Brooks's Theorem is only sufficient, but not necessary: there are graphs in which some nodes, possibly even all nodes have high degree, and the graph is colorable with 2 colors.
Proof. We give a proof using the Principle of Induction. We can start our proof with small graphs. If the graph has less than d + 1 vertices, then it can be colored by d + 1 (or fewer) colors, since every vertex can be colored differently. Suppose that our theorem is true for any graph with fewer than n vertices. Pick a point v of our graph G, and omit from G this vertex v and the edges incident to it. The remaining graph G' has n - 1 vertices. Obviously every degree is at most d (omitting a vertex does not increase the degrees), so G' can be colored by d + 1 colors, by the induction hypothesis. Since v has at most d neighbors, but we have d + 1 colors, there must be a color that does not occur among the neighbors of v. Coloring v with this color, we get a coloring of G by d + 1 colors. This completes the induction. o
Brooks, in fact, proved more: With some simple exceptions, a graph in which all nodes have degree at most d can be colored with d colors. The exceptions can be described as follows. For d = 2, the graph has a connected component that is an odd cycle; for d > 2, the graph has a connected component that is a complete graph with d + 1 nodes. The proof that these graphs are exceptions is easy; the proof that these are the only exceptions is harder and not given in this book.
Returning to the situation where you want to k-color a graph, suppose you find that Brooks's Theorem does not apply, and say a large number of random trials to color the graph also fail, and you begin to suspect that no k-coloring exists at all. How can you convince yourself that this is indeed the case? One lucky break is if you find k + 1 nodes in the graph forming a complete subgraph. Obviously, this part of the graph needs k + 1 colors.
204 13. Coloring Maps and Graphs
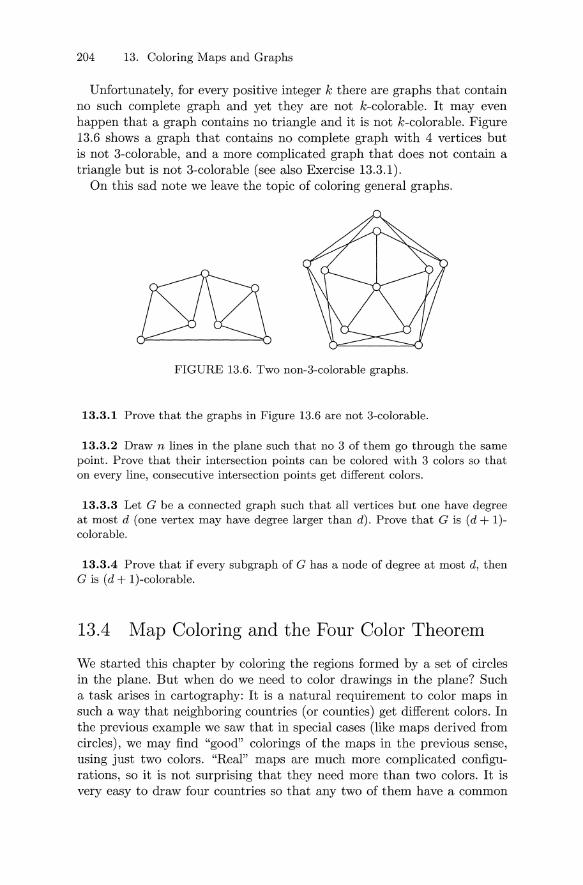
Unfortunately, for every positive integer k there are graphs that contain no such complete graph and yet they are not k-colorable. It may even happen that a graph contains no triangle and it is not k-colorable. Figure 13.6 shows a graph that contains no complete graph with 4 vertices but is not 3-colorable, and a more complicated graph that does not contain a triangle but is not 3-colorable (see also Exercise 13.3.1).
On this sad note we leave the topic of coloring general graphs.
FIGURE 13.6. Two non-3-colorable graphs.
13.3.1 Prove that the graphs in Figure 13.6 are not 3-colorable.
13.3.2 Draw n lines in the plane such that no 3 of them go through the same point. Prove that their intersection points can be colored with 3 colors so that on every line, consecutive intersection points get different colors.
13.3.3 Let G be a connected graph such that all vertices but one have degree at most d (one vertex may have degree larger than d). Prove that Gis (d + 1)colorable.
13.3.4 Prove that if every subgraph of G has a node of degree at most d, then Gis (d + I)-colorable.
13.4 Map Coloring and the Four Color Theorem
We started this chapter by coloring the regions formed by a set of circles in the plane. But when do we need to color drawings in the plane? Such a task arises in cartography: It is a natural requirement to color maps in such a way that neighboring countries (or counties) get different colors. In the previous example we saw that in special cases (like maps derived from circles), we may find "good" colorings of the maps in the previous sense, using just two colors. "Real" maps are much more complicated configurations, so it is not surprising that they need more than two colors. It is very easy to draw four countries so that any two of them have a common

13.4 Map Coloring and the Four Color Theorem 205
FIGURE 13.7. Four mutually neighboring countries
boundary, and so all four need different colors in a "good" coloring (see Figure 13.7).
Now consider a "real-life" planar map, for instance the map of the states of the continental US. We assume that each country (state) is connected (consists of one piece). In school maps usually six colors are used, but four colors are enough, as shown in Figure 13.8.
FIGURE 13.8. Coloring the states of the United States.
Would three colors be enough? One can easily see that the answer is negative. Let's start to color our map with three colors, say red, blue, and yellow (it does not make any difference which of the three colors we start with); we have to prove that sooner or later we get stuck. Let's start by coloring Nevada red. Then all the neighboring states can get only colors blue or yellow. Let's color California blue (without loss of generality). Then the next neighboring state clockwise, Oregon, is a common neighbor of both Nevada and California, so it must be colored yellow; the next state, Idaho, must be blue again; the next state, Utah, must be yellow. But now we are stuck, because the last state among the neighbors of Nevada, Arizona,
206 13. Coloring Maps and Graphs
cannot get any of the three colors red, blue, or yellow, so we must use a fourth color (see Figure 13.8).
It is not by accident that in two different cases to color a map we needed four colors, but four colors were enough. It is a theorem that to color any planar map, four colors always suffice.
This famous theorem has a history well over a century old. It was raised by Francis Guthrie in England in 1852. For decades it was kicked around by mathematicians as a simple but elusive puzzle, until the difficulties in obtaining a proof became apparent in the 1870s. An erroneous proof was published in 1879 by Alfred Kempe , and the problem was regarded as solved for a good decade before the error was discovered. The difficulty of the problem was overlooked to the degree that in 1886 it was posed at Clifton College as a challenge problem to students; part of the requirement was that "No solution may exceed one page, 30 lines of MS., and one page of diagrams." (The real solution 90 years later used more than 1000 hours of CPU time!)
After the collapse of Kempe's proof, for more than a century many mathematicians, amateur and professional, tried in vain to solve this intriguing question, called the Four Color Conjecture. Several further erroneous proofs were published and the refuted.
A whole new area of mathematics, graph theory, grew out of attempts to prove the Four Color Conjecture. Finally, in 1976 events took a surprising turn: Kenneth Appel and Wolfgang Haken gave a proof of the Four Color Conjecture (which is therefore the Four Color Theorem now), but their proof used computers very heavily to check an enormous number of cases. Even today, the use of computers could not be eliminated from the proof (although nowadays it takes much less time than the first proof, partly because computers are faster, partly because a better arrangement of the case distinction was found); we still don't have a "pure" mathematical proof of this theorem.
It is beyond the scope of this book even to sketch this proof; but we can use the results about graphs that we have learned to prove the weaker fact that 5 colors suffice to color every planar map.
We can transform this to a graph coloring problem. In each country we pick a point; let's call this the capital of the country. Now, if two countries share a border, then we can connect their capitals by a railway line that stays in the two countries and crosses the border only once. Furthermore, we can design these lines so that the lines from any capital to various points on the border of the country (going on to capitals of adjacent countries) do not cross each other. Then the capitals and the lines connecting them form a graph, which also is planar. This graph is called the dual graph of the original map (Figure 13.9).
A word here to make things precise: It could happen that the common border of two countries consists of several pieces. (For example, in our world the border of China and Russia consists of two pieces, separated by

13.4 Map Coloring and the Four Color Theorem 207
" .
....
FIGURE 13.9. A graph and its dual
Mongolia.) For the purpose of studying colorings, it suffices to connect the capitals of these two countries by one line only, through either one of these pieces of their common border.
There is another graph in the picture, consisting of the borders between countries. The nodes of this graph are the "triangles," points where three or more countries meet. But we have to be careful: This "graph" may have two or more edges connecting the same pair of nodes! So this is an example where we need multigraphs to model the situation correctly. We don't need to bother about this, however: we can just talk about a planar map and its dual graph.
Instead of coloring the countries of the original map, we could color the nodes of its dual graph: Then the rules of the game would be that two nodes connected by an edge must be colored with different colors. In other words, this is graph coloring as defined in Section 13.3. So we can rephrase the Four Color Theorem as follows:
Theorem 13.4.1 Every planar graph can be colored with 4 colors.
Our more modest goal is to prove the "Five Color Theorem" :
Theorem 13.4.2 Every planar graph can be colored with 5 colors.
Let us start with something even more modest:
Every planar graph can be colored with 6 colors.
(7 colors or 8 colors would be even more modest, but would not be any easier. )
Let us look at what we already know about graph coloring; is any of it applicable here? Do we know any condition that guarantees that the graph is 6-colorable? One such condition is that all points in a graph have degree at most 5 (Theorem 13.3.1). This result is not applicable here, though,

208 13. Coloring Maps and Graphs
because a planar graph can have points of degree higher than 5 (the "dual" graph in Figure 13.9 has a point of degree 7, for example). But if you solved the exercises, you may recall that we don't have to assume that all nodes of the graph have degree at most 5. The same procedure as used in the proof of Theorem 13.3.1 gives a 6-coloring if we know that the graph has at least one point of degree 5 or less, and so do all its subgraphs (Exercise 13.3.4). Is this condition applicable here?
The answer is yes:
Lemma 13.4.3 Every planar graph has a point of degree at most 5.
Proof. This lemma follows from Euler's Formula. In fact, we only need a consequence of Euler's Formula, namely, Theorem 12.2.2: A planar graph with n nodes has at most 3n - 6 edges.
Assume that our graph violates Lemma 13.4.3, and so every node has degree at least 6. Then counting the edges node by node, we count at least 6n edges. Each edge is counted twice, so the number of edges is at least 3n, contradicting Theorem 12.2.2. 0
Since the subgraphs of a planar graph are planar as well, it follows that they too have a point of degree at most 5, and so Exercise 13.3.4 can be applied, and we get that every planar graph is 6-colorable.
So we have proved the "Six Color Theorem." We want to shave off 1 color from this result (how nice it would be to shave off 2!). For this, we use the same procedure of coloring points one by one again, together with Lemma 13.4.3; but we have to look at the procedure more carefully. Proof [of the Five Color Theorem]. So, we have a planar graph with n nodes. We use induction on the number of nodes, so we assume that planar graphs with fewer than n nodes are 5-colorable. We also know that our graph has a node v with degree at most 5.
If v has degree 4 or less, then the argument is easy: Let us delete v from the graph, and color the remaining graph with 5 colors (which is possible by the induction hypothesis, since this is a planar graph with fewer nodes). The node v has at most 4 neighbors, so we can find a color for v that is different from the colors of its neighbors, and extend the coloring to v.
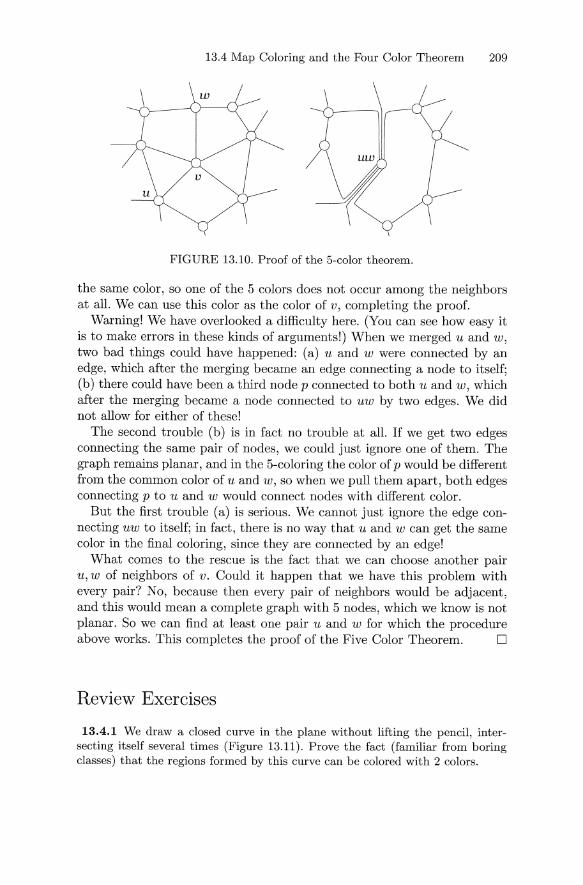
So the only difficult case occurs when the degree of v is exactly 5. Let u and w be two neighbors of v. Instead of just deleting v, we change the graph a bit more: We use the place freed up by the deletion of v to merge u and w to a single point, which we call uw. Every edge that entered either u or w will be redirected to the new node uw (Figure 13.10).
This modified graph is planar and has fewer nodes, so it can be colored with 5 colors by the induction hypothesis. If we pull the two points u and w apart again, we get a coloring of all nodes of G except v with 5 colors. What we gained by this trick of merging u and w is that in this coloring they have the same color! So even though v has 5 neighbors, two of those have
13.4 Map Coloring and the Four Color Theorem 209
FIGURE 13.10. Proof of the 5-color theorem.
the same color, so one of the 5 colors does not occur among the neighbors at all. We can use this color as the color of v, completing the proof.
Warning! We have overlooked a difficulty here. (You can see how easy it is to make errors in these kinds of arguments!) When we merged u and w, two bad things could have happened: (a) u and w were connected by an edge, which after the merging became an edge connecting a node to itself; (b) there could have been a third node p connected to both u and w, which after the merging became a node connected to uw by two edges. We did not allow for either of these!
The second trouble (b) is in fact no trouble at all. If we get two edges connecting the same pair of nodes, we could just ignore one of them. The graph remains planar, and in the 5-coloring the color of p would be different from the common color of u and w, so when we pull them apart, both edges connecting p to u and w would connect nodes with different color.
But the first trouble (a) is serious. We cannot just ignore the edge connecting uw to itself; in fact, there is no way that u and w can get the same color in the final coloring, since they are connected by an edge!
What comes to the rescue is the fact that we can choose another pair u, w of neighbors of v. Could it happen that we have this problem with every pair? No, because then every pair of neighbors would be adjacent, and this would mean a complete graph with 5 nodes, which we know is not planar. So we can find at least one pair u and w for which the procedure above works. This completes the proof of the Five Color Theorem. D
Review Exercises
13.4.1 We draw a closed curve in the plane without lifting the pencil, intersecting itself several times (Figure 13.11). Prove the fact (familiar from boring classes) that the regions formed by this curve can be colored with 2 colors.

210 13. Coloring Maps and Graphs
FIGURE 13.11. 2-coloring the regions of a curve
13.4.2 Let G be a connected graph such that all vertices have degree at most d, and there exists vertex with degree strictly less than d. Prove that G is dcolorable.
13.4.3 Let G be a connected graph such that all vertices but d + 1 have degree at most d (the remaining d + 1 vertices may have degree larger than d). Prove that G is (d + 1 )-colorable.
13.4.4 Construct a graph G as follows: The vertices of G are the edges of a complete graph Ks on 5 vertices. The vertices of G are adjacent if and only if the corresponding edges of Ks have an endpoint in common. Determine the chromatic number of this graph.
13.4.5 Let Gn be the graph arising from Kn (where Kn is the complete graph on n vertices) by omitting the edges of a Hamiltonian cycle. Determine the chromatic number of Gn .
13.4.6 Show by an example that on a continent where countries are not necessarily connected (as in medieval Europe), 100 colors may not be enough to color a map.
13.4.7 If every face of a planar map has an even number of edges, then the graph is bipartite.
13.4.8 If every node of a planar map has even degree, then the faces can be 2-colored.
13.4.9 (a) Consider a planar map in which every node has degree 3. Suppose that the faces can be 3-colored. Prove that the graph of the map is bipartite.
(b) [A challenge exercise.] Prove the converse: If every node of a bipartite planar graph has degree 3, then in the map obtained by drawing it in the plane, the faces can be 3-colored.