coloplast earnings conference call q1 2017/18 relations...• strong underlying growth in us chronic...
TRANSCRIPT

Coloplast Earnings Conference Call Q1 2017/181 February 2018
• .
Page 2
The forward-looking statements contained in this presentation, including forecasts of sales and earnings performance, are not guarantees of future results and are subject to risks, uncertainties and assumptions that are difficult to predict. The forward-looking statements are based on Coloplast’scurrent expectations, estimates and assumptions and based on the information available to Coloplastat this time.
Heavy fluctuations in the exchange rates of important currencies, significant changes in the healthcare sector or major changes in the world economy may impact Coloplast's possibilities of achieving the long-term objectives set as well as for fulfilling expectations and may affect the company’s financial outcomes.
Forward-looking statements
• .
Coloplast delivered Q1 organic growth of 8% and an EBIT margin of 31%
Page 3
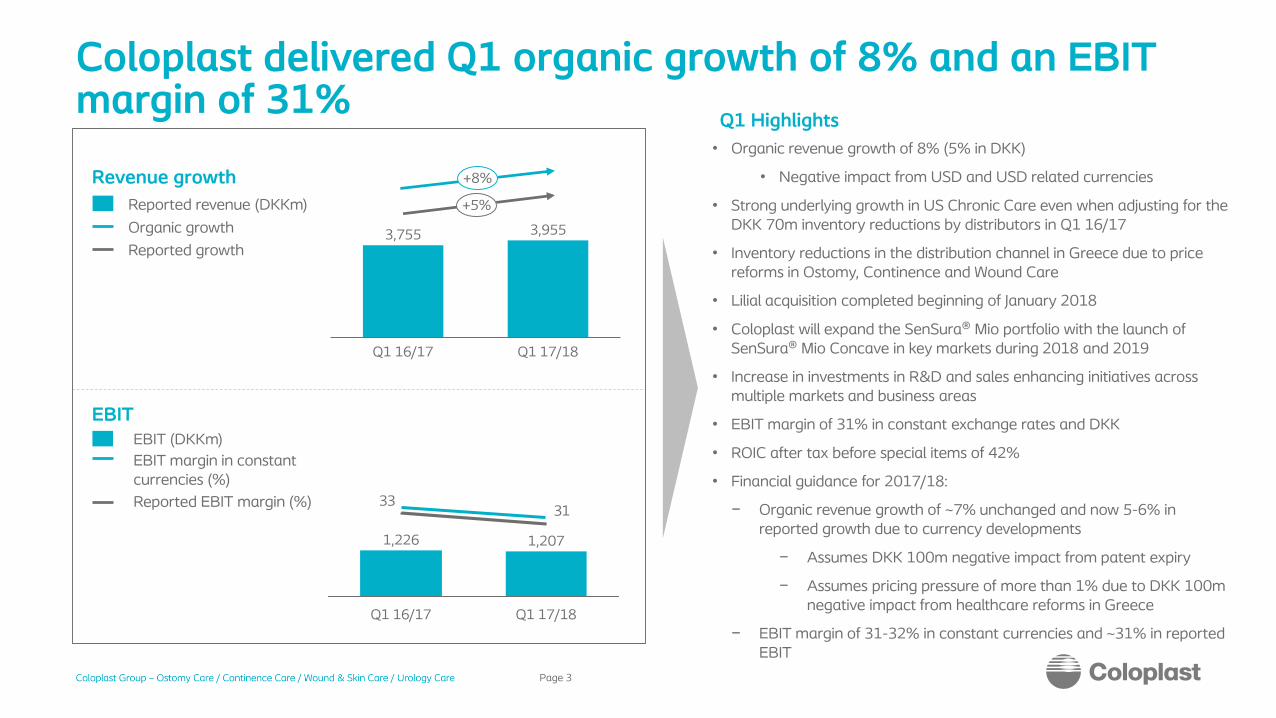
• Organic revenue growth of 8% (5% in DKK)
• Negative impact from USD and USD related currencies
• Strong underlying growth in US Chronic Care even when adjusting for the DKK 70m inventory reductions by distributors in Q1 16/17
• Inventory reductions in the distribution channel in Greece due to price reforms in Ostomy, Continence and Wound Care
• Lilial acquisition completed beginning of January 2018
• Coloplast will expand the SenSura® Mio portfolio with the launch of SenSura® Mio Concave in key markets during 2018 and 2019
• Increase in investments in R&D and sales enhancing initiatives across multiple markets and business areas
• EBIT margin of 31% in constant exchange rates and DKK
• ROIC after tax before special items of 42%
• Financial guidance for 2017/18:
− Organic revenue growth of ~7% unchanged and now 5-6% in reported growth due to currency developments
− Assumes DKK 100m negative impact from patent expiry
− Assumes pricing pressure of more than 1% due to DKK 100m negative impact from healthcare reforms in Greece
− EBIT margin of 31-32% in constant currencies and ~31% in reported EBIT
Q1 Highlights
Revenue growth
EBITEBIT (DKKm)
Reported revenue (DKKm)
Organic growth
Reported EBIT margin (%)
Q1 16/17
3,755
Q1 17/18
+5%
3,955
+8%
3133
Q1 17/18
1,2071,226
Q1 16/17
EBIT margin in constant currencies (%)
Reported growth

• .
Strong growth in all business areas except Wound Care due to price reforms in Greece
Page 4
Other developed markets
Emerging markets
Coloplast Group
European markets
Reported revenueDKKm
Q1 17/18 revenue by geography
Organic growthGeographicarea
4%
18%
10%
8%
Continence Care
Urology Care
Wound & Skin Care
Ostomy Care
ColoplastGroup
Q1 17/18 revenue by business area
9%
10%
11%
-5%
8%
Business area
Reported revenueDKKm
Organic growth
434
473
1,613
1,435
Share of organic growth
635
2,392
928
3955
Share of organic growth
47%
46%
16%
-9%
100%
28%
50%
22%
100%3,955
• .
Currency effect
∆ Other operating
items
0.6
0.6
∆ R&D-to-sales
-0.3
31.1
30.5
∆ Admin-to-sales
0.1
Reported EBIT
margin Q1 17/18
EBIT margin Q1
17/18 (Constant
Currencies)
Reported EBIT
margin Q1 16/17
-1.3
-1.3
∆ Gross profit
∆ Distribution-
to-sales
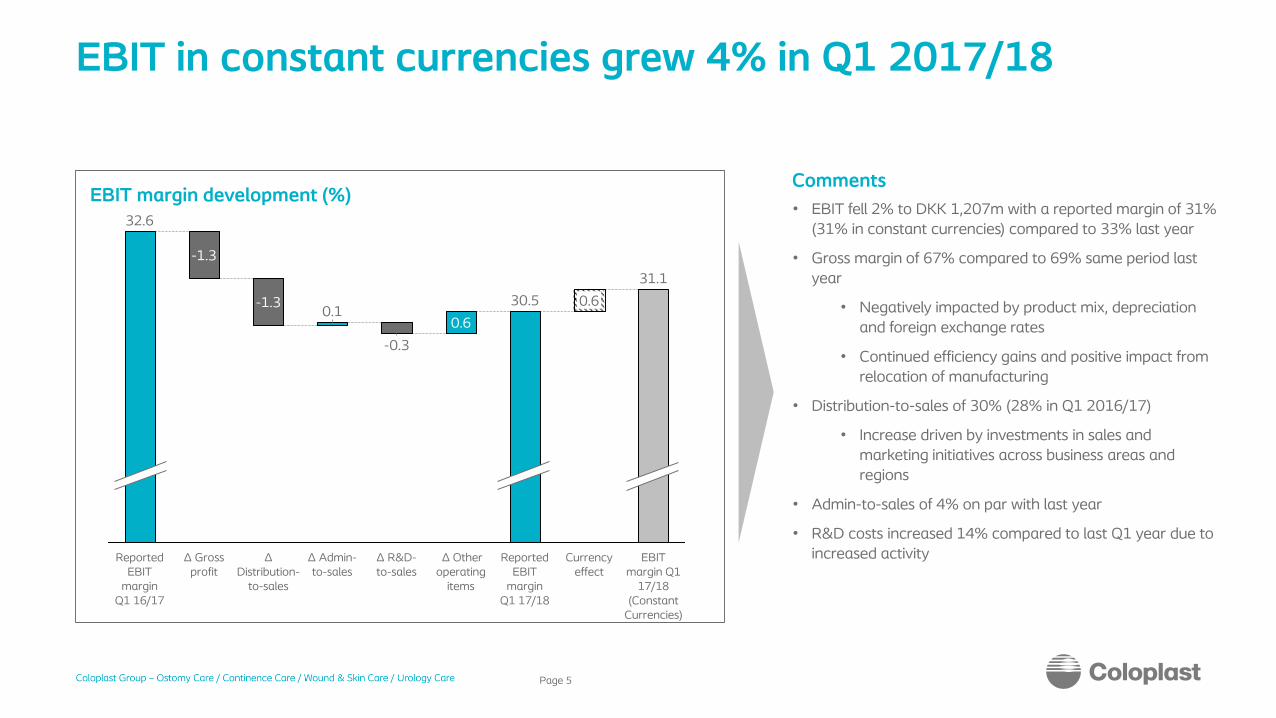
32.6• EBIT fell 2% to DKK 1,207m with a reported margin of 31%
(31% in constant currencies) compared to 33% last year
• Gross margin of 67% compared to 69% same period last year
• Negatively impacted by product mix, depreciation and foreign exchange rates
• Continued efficiency gains and positive impact from relocation of manufacturing
• Distribution-to-sales of 30% (28% in Q1 2016/17)
• Increase driven by investments in sales and marketing initiatives across business areas and regions
• Admin-to-sales of 4% on par with last year
• R&D costs increased 14% compared to last Q1 year due to increased activity
EBIT in constant currencies grew 4% in Q1 2017/18
Page 5
CommentsEBIT margin development (%)

• .
Updated reported growth guidance for 17/18
Page 6
Tax rate
CAPEX (DKKm)
EBIT margin
Sales growth
Guidance 17/18 Guidance 17/18 (DKK)
~7% (organic)
31-32% (constant exchange rates)
5-6%
~31%
~700
~23%
Key assumptions
• DKK 100m patent expiry• More than 1% negative price pressure of which DKK
100m from price reform in Greece• DKK guidance includes Comfort Medical in Q1 and
Lilial in Q2-Q4
• Impact from patent expiry and Greece• Incremental investments of up to 2% of
revenue• DKK 20m from reduction in DK production
employees• Includes Comfort Medical and Lilial
• Factory expansion in Nyírbátor• New machines for new and existing products

Page 7