collier's report
TRANSCRIPT
Accelerating success.
Research & Forecast Report
Philippines 1Q 2015
Growth momentum to continue in 2015 Despite a lackluster performance during the first half of 2014, the Philippine economy finished strongly during the fourth quarter, ending with a full year growth rate of 6.1%. This strong performance is expected to carry over to 2015, as spending from on-going infrastructure projects and robust domestic consumption continue to support growth. The IMF has already adjusted its 2015 GDP forecast upwards by 10 basis points (+6.7%) and JP Morgan by 90 basis points (+6.4%). The government, on the other hand, aims to reach growth rates of between 7 and 8% in 2015.
OfficeIncreasing demand for office space has ramped up the construction timelines of upcoming projects for the year. Three office buildings totalling 39,500 sq m of usable area were completed as of 1Q 2015. Colliers forecasts that at the end of 2015, close to 576,000 sq m of usable office space will be delivered, 43% of which will be located in Fort Bonifacio.Makati CBD vacancy remained stable at 2.18% amidst a slight increase in vacancy in Grade B office buildings. Still, rental rates continued to appreciate as availability of office space remains limited.
ResidentialFour residential condominiums were completed in the major Metro Manila CBDs during the first quarter, delivering 1,649 new units across major business locations in Metro Manila. However, construction delays at several condominium projects will push back the bulk of the expected new supply for 2015. By year’s end, 8,253 residential units will be completed. With few new developments to absorb the still strong demand, rents and resale prices are expected to further appreciate.
RetailThe country’s continued strong domestic consumption had Metro Manila’s retail stock increasing by 182,000 sq m in the first quarter to 5.9 million sq m; newly opened malls are mainly classified as neighbourhood or district centers due to decreasing opportunities to find large available land parcels in the metropolis. While renovations in existing malls have led to a reduction in occupancy, the opening of expansions in the same malls has mitigated the effect of the increase in vacancies. As such, retail rents in Makati and Ortigas further appreciated by 1.6 and 3.2% QoQ, respectively.
Market Indicators
OFFICE
RESIDENTIAL
RETAIL

2 Research & Forecast Report | 1Q 2015 | Philippines | Colliers International
Strong 2014 economic growth causes revision in this year’s forecastThe Philippines continued its phenomenal economic growth story in 2014, as the economy expanded by 6.1% despite lower growth rates posted in the first (+5.6%) and third (+5.3%) quarters. With the economy growing above 6% over the last three years, the government has proclaimed that the country is no longer the “sick man of Asia” and has transformed itself into one of the tiger economies for the next decade. As a result of strong growth, several organisations have adjusted their forecast for 2015, with IMF increasing by 10 basis points (+6.7%) and JP Morgan increasing by 90 basis points (+6.4%). The government, on the other hand, aims to reach growth rates of between 7 and 8% in 2015.
Exports provided the biggest push in the economic growth story with both goods (+12.1%) and services (+12.2%) expanding by double digits in 2014. This could be attributed to a surging industrial sector, particularly in manufacturing (+8.1%) and construction-related activities (+8.5%), and a flourishing Business Process Outsourcing (BPO) industry, which was able to remit USD18.4 billion in export revenues. Infrastructure development is also expected to bring in more avenues for growth as more projects in the Public-Private Partnership programme are being put up for bids including the development, operations and maintenance of regional airports.
Domestic consumption continued to sustain the economy although concerns have been raised after OFW remittances grew the slowest (2.4%) in the first two months of the year. The global economic slowdown has caused remittances to dip, particularly in areas where there is a large concentration of Filipinos abroad. The government, however, recognised
that while external shocks could not be controlled, domestic shocks can be addressed to spur local spending. The inflation environment remains healthy (2.4%) in the first quarter while lending rates have stayed at their lowest (4.5 - 6.9%) since last year, thereby allowing consumers to purchase big ticket items such as real estate and vehicles, and companies to undergo massive expansion strategies.
With a burgeoning economy and a healthy property market over the last few years, real estate loans have grown substantially as of December 2014, increasing by 24% YoY to PHP1.04 trillion. Despite the rapid increase, non-performing loans only amounted to 2.5% of the total real estate portfolio, the lowest in six years. This may be attributed to the stricter policies and regulations implemented by the Central Bank to ensure the stability of the financial sector, by monitoring real estate activities of universal and commercial banks.
Economic Growth Indicators
Economic Indicators2007 2008 2009 2010 2011 2012 2013 2014
Gross National Product 6.10 6.00 6.50 8.40 3.20 6.40 7.50 6.30
Gross Domestic Producta 6.60 4.20 1.10 7.60 3.90 6.80 7.20 6.10
Household Final Consumption Expenditure 4.60 3.70 2.30 3.40 6.10 6.60 5.70 5.40
Government Final Consumption Expenditure 6.90 0.30 10.90 4.00 1.00 15.50 7.70 1.80
Capital Formation (0.50) 23.40 (8.70) 31.60 8.10 (5.30) 29.90 1.10
Exports 6.70 (2.70) (7.80) 21.00 (4.20) 8.50 (1.10) 12.10
Imports 1.70 1.60 (8.10) 22.50 0.20 4.90 5.40 5.80
AHFFb 4.70 3.20 (0.70) (0.20) 2.70 2.80 1.10 1.90
Industry 5.80 4.80 (1.90) 11.60 2.30 7.30 9.30 7.50
Services 7.60 4.00 3.40 7.20 5.10 7.40 7.20 6.00
Average Inflationc 2.90 8.30 4.10 3.90 4.60 3.20 3.00 4.10
Budget Surplus/Deficit (PHP Bn) (12.40) (68.10) (298.50) (314.40) (197.70) (242.80) (164.10) (73.09)
PHP:US$ (Average) 46.10 44.70 47.60 45.10 43.31 42.09 42.45 44.40
Average 91-Day T-Bill Rates (%) 3.40 5.20 4.00 3.70 1.37 1.58 0.32 1.24
Source: Philippine Statistics Authority, Bangko Sentral ng Pilipinas, Bureau of Treasury a at constant 2000 pricesbAgriculture, Hunting, Forestry, Fishing
c at constant 2006 prices
Source: Bangko Sentral ng Pilipinas
OFW Remittancesa
a as of February 2015
3 Research & Forecast Report | 1Q 2015 | Philippines | Colliers International
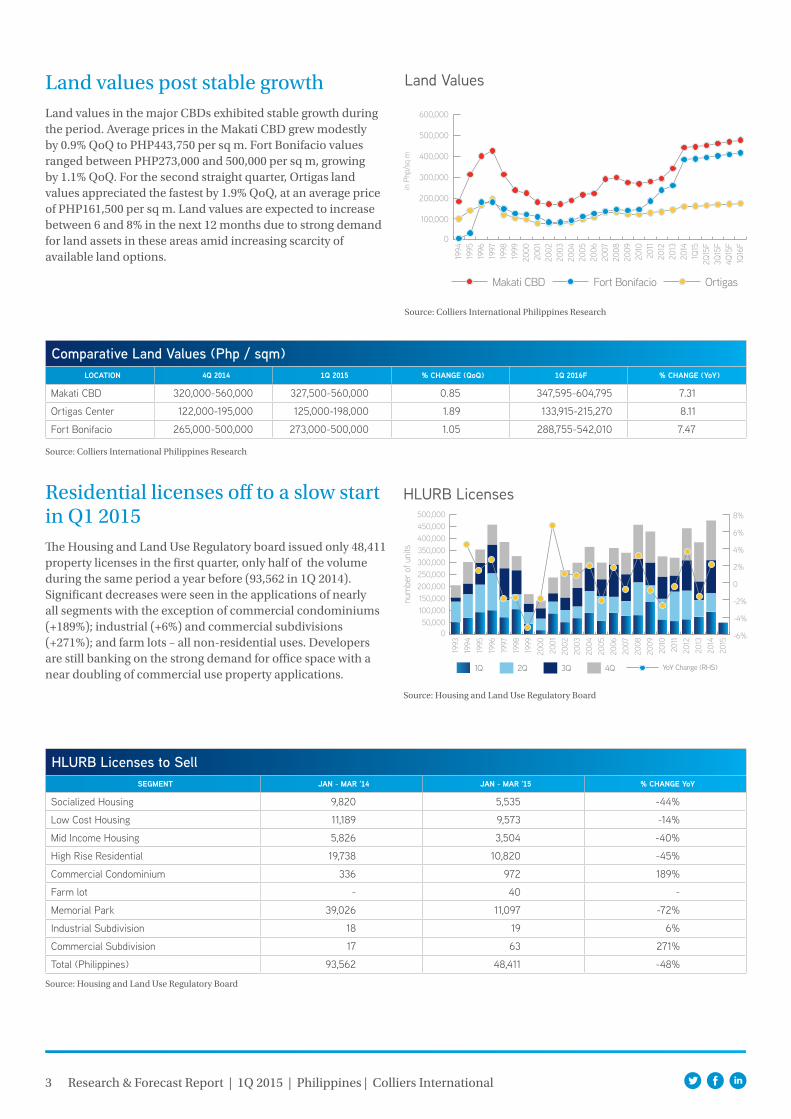
Land values post stable growth Land values in the major CBDs exhibited stable growth during the period. Average prices in the Makati CBD grew modestly by 0.9% QoQ to PHP443,750 per sq m. Fort Bonifacio values ranged between PHP273,000 and 500,000 per sq m, growing by 1.1% QoQ. For the second straight quarter, Ortigas land values appreciated the fastest by 1.9% QoQ, at an average price of PHP161,500 per sq m. Land values are expected to increase between 6 and 8% in the next 12 months due to strong demand for land assets in these areas amid increasing scarcity of available land options.
Residential licenses off to a slow start in Q1 2015The Housing and Land Use Regulatory board issued only 48,411 property licenses in the first quarter, only half of the volume during the same period a year before (93,562 in 1Q 2014). Significant decreases were seen in the applications of nearly all segments with the exception of commercial condominiums (+189%); industrial (+6%) and commercial subdivisions (+271%); and farm lots – all non-residential uses. Developers are still banking on the strong demand for office space with a near doubling of commercial use property applications.
Comparative Land Values (Php / sqm)LOCATION 4Q 2014 1Q 2015 % CHANGE (QoQ) 1Q 2016F % CHANGE (YoY)
Makati CBD 320,000-560,000 327,500-560,000 0.85 347,595-604,795 7.31
Ortigas Center 122,000-195,000 125,000-198,000 1.89 133,915-215,270 8.11
Fort Bonifacio 265,000-500,000 273,000-500,000 1.05 288,755-542,010 7.47
Source: Colliers International Philippines Research
Land Values
Source: Colliers International Philippines Research
HLURB Licenses
Source: Housing and Land Use Regulatory Board
HLURB Licenses to SellSEGMENT JAN - MAR '14 JAN - MAR '15 % CHANGE YoY
Socialized Housing 9,820 5,535 -44%
Low Cost Housing 11,189 9,573 -14%
Mid Income Housing 5,826 3,504 -40%
High Rise Residential 19,738 10,820 -45%
Commercial Condominium 336 972 189%
Farm lot - 40 -
Memorial Park 39,026 11,097 -72%
Industrial Subdivision 18 19 6%
Commercial Subdivision 17 63 271%
Total (Philippines) 93,562 48,411 -48%
Source: Housing and Land Use Regulatory Board
4 Research & Forecast Report | 1Q 2015 | Philippines | Colliers International
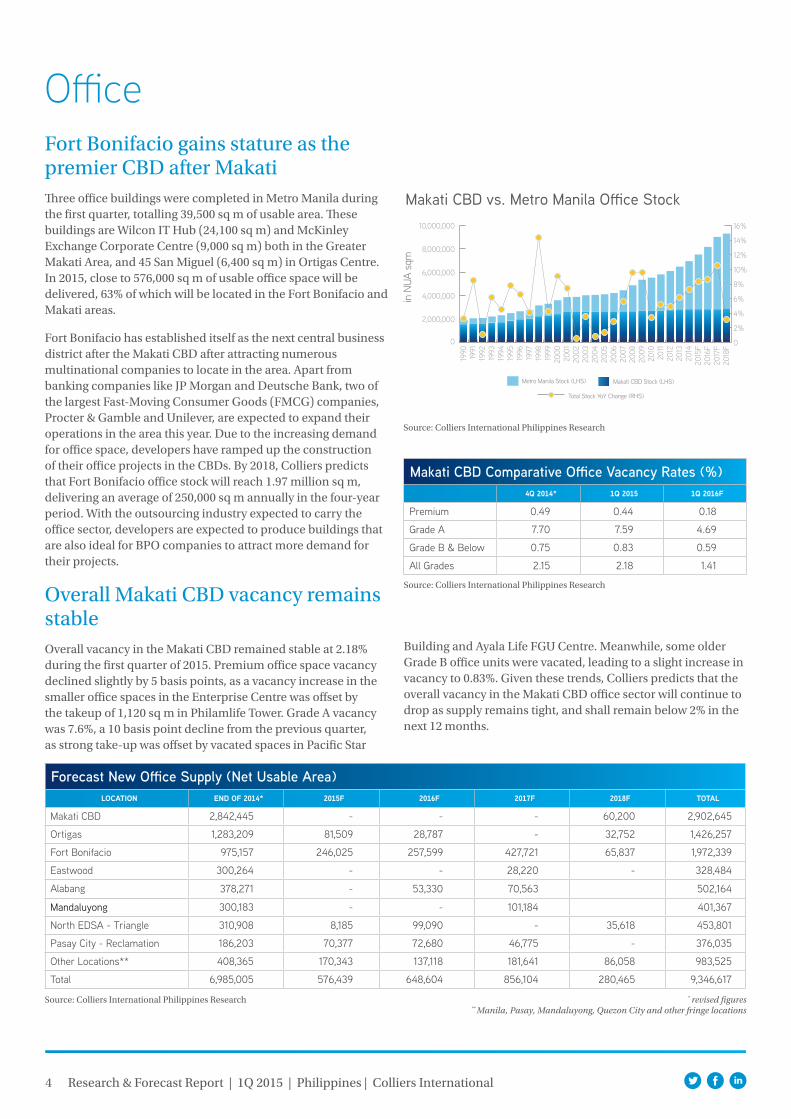
OfficeFort Bonifacio gains stature as the premier CBD after MakatiThree office buildings were completed in Metro Manila during the first quarter, totalling 39,500 sq m of usable area. These buildings are Wilcon IT Hub (24,100 sq m) and McKinley Exchange Corporate Centre (9,000 sq m) both in the Greater Makati Area, and 45 San Miguel (6,400 sq m) in Ortigas Centre. In 2015, close to 576,000 sq m of usable office space will be delivered, 63% of which will be located in the Fort Bonifacio and Makati areas.
Fort Bonifacio has established itself as the next central business district after the Makati CBD after attracting numerous multinational companies to locate in the area. Apart from banking companies like JP Morgan and Deutsche Bank, two of the largest Fast-Moving Consumer Goods (FMCG) companies, Procter & Gamble and Unilever, are expected to expand their operations in the area this year. Due to the increasing demand for office space, developers have ramped up the construction of their office projects in the CBDs. By 2018, Colliers predicts that Fort Bonifacio office stock will reach 1.97 million sq m, delivering an average of 250,000 sq m annually in the four-year period. With the outsourcing industry expected to carry the office sector, developers are expected to produce buildings that are also ideal for BPO companies to attract more demand for their projects.
Overall Makati CBD vacancy remains stableOverall vacancy in the Makati CBD remained stable at 2.18% during the first quarter of 2015. Premium office space vacancy declined slightly by 5 basis points, as a vacancy increase in the smaller office spaces in the Enterprise Centre was offset by the takeup of 1,120 sq m in Philamlife Tower. Grade A vacancy was 7.6%, a 10 basis point decline from the previous quarter, as strong take-up was offset by vacated spaces in Pacific Star
Building and Ayala Life FGU Centre. Meanwhile, some older Grade B office units were vacated, leading to a slight increase in vacancy to 0.83%. Given these trends, Colliers predicts that the overall vacancy in the Makati CBD office sector will continue to drop as supply remains tight, and shall remain below 2% in the next 12 months.
Forecast New Office Supply (Net Usable Area)LOCATION END OF 2014* 2015F 2016F 2017F 2018F TOTAL
Makati CBD 2,842,445 - - - 60,200 2,902,645
Ortigas 1,283,209 81,509 28,787 - 32,752 1,426,257
Fort Bonifacio 975,157 246,025 257,599 427,721 65,837 1,972,339
Eastwood 300,264 - - 28,220 - 328,484
Alabang 378,271 - 53,330 70,563 502,164
Mandaluyong 300,183 - - 101,184 401,367
North EDSA - Triangle 310,908 8,185 99,090 - 35,618 453,801
Pasay City - Reclamation 186,203 70,377 72,680 46,775 - 376,035
Other Locations** 408,365 170,343 137,118 181,641 86,058 983,525
Total 6,985,005 576,439 648,604 856,104 280,465 9,346,617
Source: Colliers International Philippines Research * revised figures** Manila, Pasay, Mandaluyong, Quezon City and other fringe locations
Makati CBD vs. Metro Manila Office Stock
Source: Colliers International Philippines Research
Makati CBD Comparative Office Vacancy Rates (%)4Q 2014* 1Q 2015 1Q 2016F
Premium 0.49 0.44 0.18
Grade A 7.70 7.59 4.69
Grade B & Below 0.75 0.83 0.59
All Grades 2.15 2.18 1.41
Source: Colliers International Philippines Research

5 Research & Forecast Report | 1Q 2015 | Philippines | Colliers International
Office rents exhibit stable growthPremium rents continued to rally in the first quarter, growing by 2.2% QoQ to PHP1,175 per sq m per month. Landlords of Premium office buildings were able to charge more due to strong demand amid limited availability of space. Meanwhile, Grade A rents accelerated in the period at 3.2% QoQ. As such, an average Grade A office space will cost an average monthly rent of PHP878 per sq m per month. On the other hand, Grade B rents exhibited slower growth compared to the previous period, at 1.9% QoQ to PHP673 per sq m per month. Colliers expects that rental rates in the Makati CBD will grow between by 6.5 and 7.6% over the next 12 months.
Capital value growth accelerates during 1QCapital value growth in the Makati CBD outpaced rent growth during the period, as landlords considered the sudden uptick in average land values two quarters ago. Premium office space averaged PHP158,000 per sq m, a 2.4% QoQ increase. Grade A office values, much like rents, appreciated the fastest at 4.1% QoQ as a result of a higher acquisition price at one of the office spaces in the area. On the other hand, Grade B capital values averaged PHP73,500 per sq m, growing by 3.2% QoQ. Colliers expects that capital value growth will continue to outpace rent growth in the next 12 months, between 7.5 and 8.6%, as capital value growth expectations remain more bullish.
Makati CBD Office Supply and Demand
Source: Colliers International Philippines Research
Comparative Rental Rates (Php/sq m/month)
Makati CBD (based on net usable area)GRADE 4Q 2014 1Q 2015 % CHANGE (QoQ) 1Q 2016F % CHANGE (YoY)
Premium 1,000 - 1,300 1,020 - 1,330 2.17 1,085 - 1,425 6.67
Grade A 695 - 1,005 705 - 1,050 3.24 745 - 1,125 6.53
Grade B 550 - 770 560 - 785 1.89 595 - 850 7.64
Source: Colliers International Philippines Research
Source: Colliers International Philippines ResearchComparative Office Capital Values (Php / sq m)
Makati CBD (based on net usable area)GRADE 4Q 2014 1Q 2015 % CHANGE (QoQ) 1Q 2016F % CHANGE (YoY)
Premium 146,500 - 162,000 148,000 - 168,000 2.43 157,470 - 182,475 7.58
Grade A 83,000 - 113,000 86,000 - 118,000 4.08 91,275 - 127,975 7.48
Grade B 59,000 - 83,500 62,000 - 85,000 3.16 66,880 - 92,810 8.63
Source: Colliers International Philippines Research
Makati CBD Office Capital Values
Source: Colliers International Philippines Research
6 Research & Forecast Report | 1Q 2015 | Philippines | Colliers International
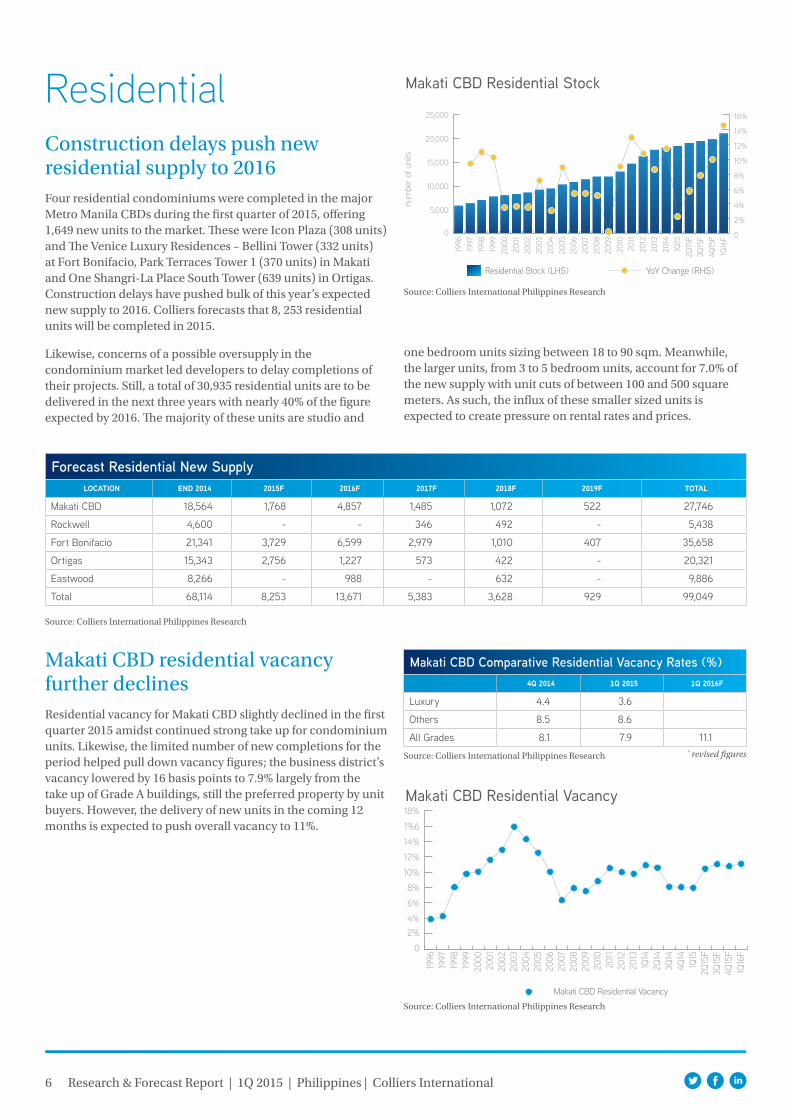
ResidentialConstruction delays push new residential supply to 2016Four residential condominiums were completed in the major Metro Manila CBDs during the first quarter of 2015, offering 1,649 new units to the market. These were Icon Plaza (308 units) and The Venice Luxury Residences – Bellini Tower (332 units) at Fort Bonifacio, Park Terraces Tower 1 (370 units) in Makati and One Shangri-La Place South Tower (639 units) in Ortigas. Construction delays have pushed bulk of this year’s expected new supply to 2016. Colliers forecasts that 8, 253 residential units will be completed in 2015.
Likewise, concerns of a possible oversupply in the condominium market led developers to delay completions of their projects. Still, a total of 30,935 residential units are to be delivered in the next three years with nearly 40% of the figure expected by 2016. The majority of these units are studio and
Forecast Residential New SupplyLOCATION END 2014 2015F 2016F 2017F 2018F 2019F TOTAL
Makati CBD 18,564 1,768 4,857 1,485 1,072 522 27,746
Rockwell 4,600 - - 346 492 - 5,438
Fort Bonifacio 21,341 3,729 6,599 2,979 1,010 407 35,658
Ortigas 15,343 2,756 1,227 573 422 - 20,321
Eastwood 8,266 - 988 - 632 - 9,886
Total 68,114 8,253 13,671 5,383 3,628 929 99,049
Makati CBD Residential Vacancy
Source: Colliers International Philippines Research
Makati CBD residential vacancy further declinesResidential vacancy for Makati CBD slightly declined in the first quarter 2015 amidst continued strong take up for condominium units. Likewise, the limited number of new completions for the period helped pull down vacancy figures; the business district’s vacancy lowered by 16 basis points to 7.9% largely from the take up of Grade A buildings, still the preferred property by unit buyers. However, the delivery of new units in the coming 12 months is expected to push overall vacancy to 11%.
one bedroom units sizing between 18 to 90 sqm. Meanwhile, the larger units, from 3 to 5 bedroom units, account for 7.0% of the new supply with unit cuts of between 100 and 500 square meters. As such, the influx of these smaller sized units is expected to create pressure on rental rates and prices.
Makati CBD Residential Stock
Source: Colliers International Philippines Research
Source: Colliers International Philippines Research
Makati CBD Comparative Residential Vacancy Rates (%)4Q 2014 1Q 2015 1Q 2016F
Luxury 4.4 3.6
Others 8.5 8.6
All Grades 8.1 7.9 11.1
Source: Colliers International Philippines Research * revised figures
7 Research & Forecast Report | 1Q 2015 | Philippines | Colliers International
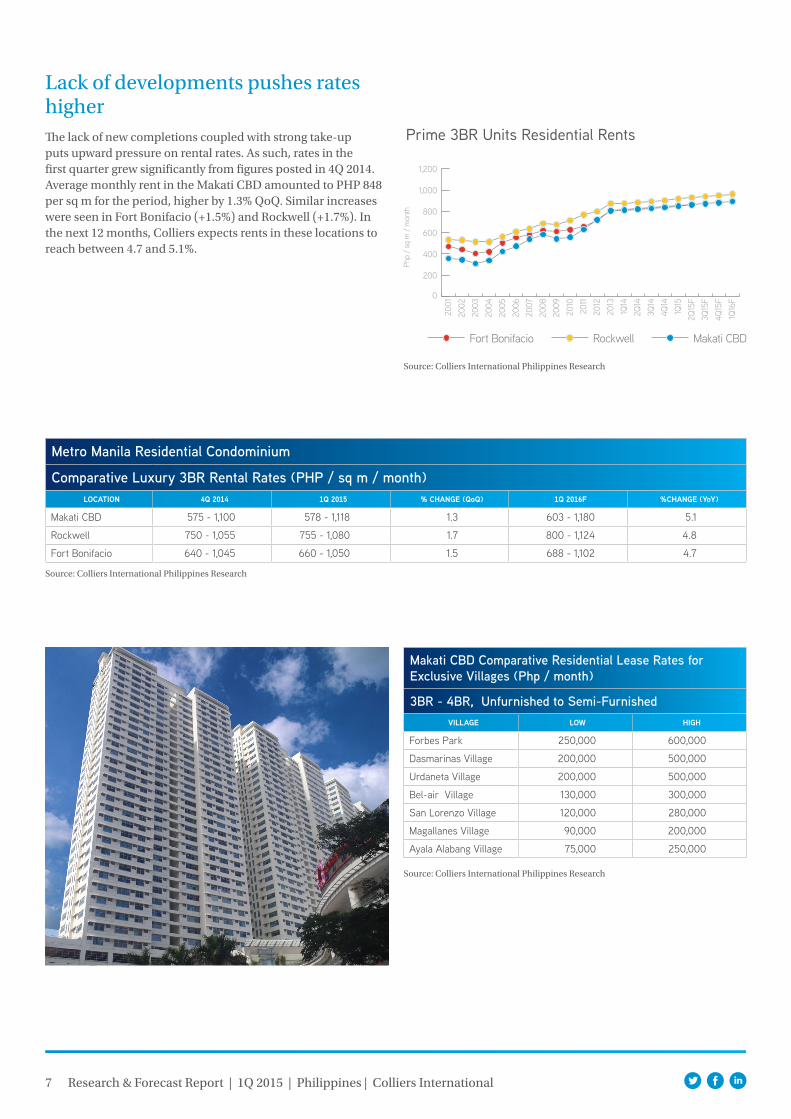
Lack of developments pushes rates higherThe lack of new completions coupled with strong take-up puts upward pressure on rental rates. As such, rates in the first quarter grew significantly from figures posted in 4Q 2014. Average monthly rent in the Makati CBD amounted to PHP 848 per sq m for the period, higher by 1.3% QoQ. Similar increases were seen in Fort Bonifacio (+1.5%) and Rockwell (+1.7%). In the next 12 months, Colliers expects rents in these locations to reach between 4.7 and 5.1%.
Prime 3BR Units Residential Rents
Source: Colliers International Philippines Research
Metro Manila Residential Condominium
Comparative Luxury 3BR Rental Rates (PHP / sq m / month)LOCATION 4Q 2014 1Q 2015 % CHANGE (QoQ) 1Q 2016F %CHANGE (YoY)
Makati CBD 575 - 1,100 578 - 1,118 1.3 603 - 1,180 5.1
Rockwell 750 - 1,055 755 - 1,080 1.7 800 - 1,124 4.8
Fort Bonifacio 640 - 1,045 660 - 1,050 1.5 688 - 1,102 4.7
Source: Colliers International Philippines Research
Makati CBD Comparative Residential Lease Rates for Exclusive Villages (Php / month)
3BR - 4BR, Unfurnished to Semi-FurnishedVILLAGE LOW HIGH
Forbes Park 250,000 600,000
Dasmarinas Village 200,000 500,000
Urdaneta Village 200,000 500,000
Bel-air Village 130,000 300,000
San Lorenzo Village 120,000 280,000
Magallanes Village 90,000 200,000
Ayala Alabang Village 75,000 250,000
Source: Colliers International Philippines Research
8 Research & Forecast Report | 1Q 2015 | Philippines | Colliers International
Metro Manila Residential Condominium
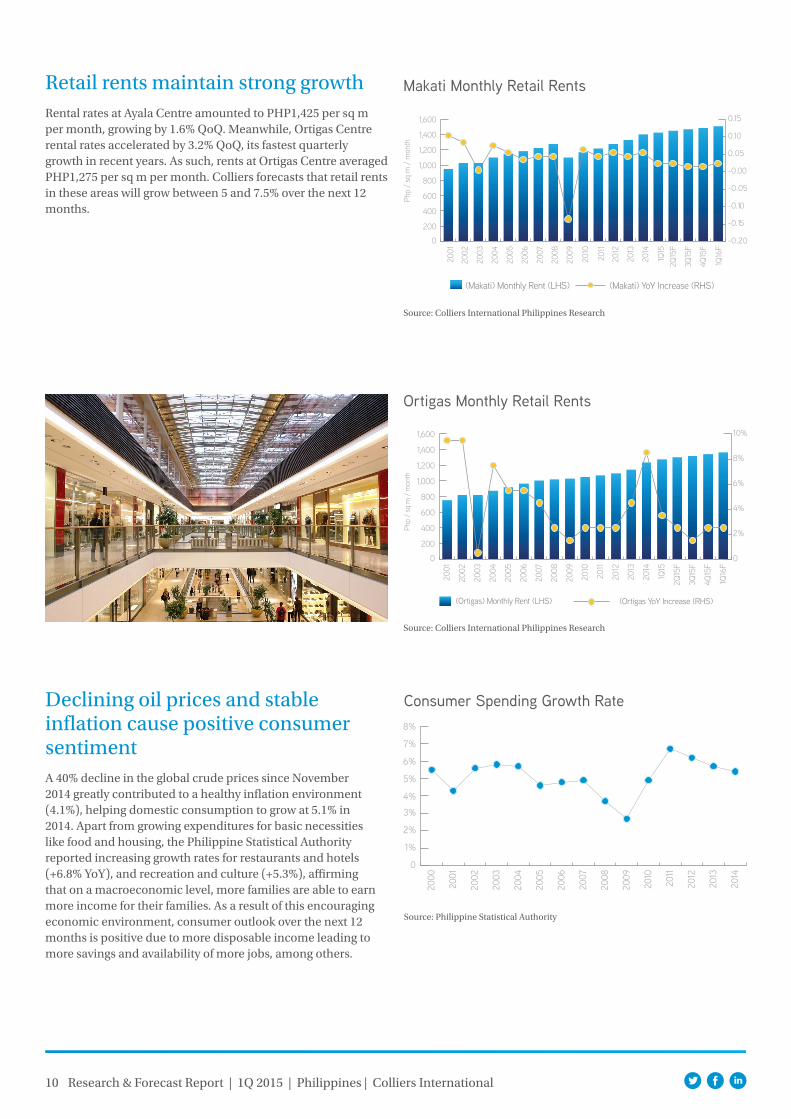
Comparative Luxury 3BR Capital Values (PHP / sqm)LOCATION 4Q 2014 1Q 2015 % CHANGE (QoQ) 1Q 2016F % CHANGE (YoY)
Makati CBD 100,000 - 189,000 102,500 - 192,200 1.3 106,670 - 203,000 5.8
Rockwell 117,000 - 180,000 119,000 - 189,000 3.7 125,805 - 198,200 5.1
Fort Bonifacio 110,000 - 172,500 113,000 - 179,500 3.5 118,750 - 192,000 6.3
Source: Colliers International Philippines Research
Capital values continue to outgrow rental ratesCapital values for Makati CBD residential property grew a tad higher by 1.3% to a range of PHP100,000 to 189,000 per sq m. Rockwell values continued to post the fastest growth, which for the quarter was at 3.7% QoQ, between PHP119,000 and 189,000 per sq m; the lack of new supply in the business center continues to push property values in the area even higher. Similar growth was seen also in Fort Bonifacio (+3.5 %) where there is still significant land bank for development. Colliers expects that values will grow from 5.8 to 6.3% by the end of the next 12 months.
Prime 3BR Units Residential Capital Values
Source: Colliers International Philippines Research
Comparative Residential Lease Rates (High-Rise)
3BR, Semi Furnished to Fully FurnishedLOCATION MINIMUM AVERAGE MAXIMUM
Apartment Ridge/Roxas Triangle
Rental Range (Php/month) 130,000 180,000 280,000
Average Size (sq m) 250 295 330
Salcedo Village
Rental Range (Php/month) 120,000 140,000 160,000
Average Size (sq m) 180 195 210
Legaspi Village
Rental Range (Php/month) 125,000 205,000 250,000
Average Size (sq m) 185 225 280
Rockwell
Rental Range (Php/month) 120,000 160,000 280,000
Average Size (sq m) 120 185 290
Fort Bonifacio
Rental Range (Php/month) 105,000 200,000 285,000
Average Size (sq m) 120 195 300
Source: Colliers International Philippines Research

9 Research & Forecast Report | 1Q 2015 | Philippines | Colliers International
RetailShift to smaller format retail development observed in Metro ManilaMetro Manila retail stock reached 5.9 million sq m, increasing by 182,000 sq m over the last six months due to the completion of eight projects. Notable projects include Estancia (35,000 sq m) by Ortigas and Company, and Robinsons Las Pinas (25,700 sq m) by Robinsons Land. The majority of completed projects were classified as neighborhood and district centers, primarily catering to the immediate population in a certain locality. An additional 179,000 sq m of retail space is expected to be delivered by the end of the year.
Decreasing opportunities to find large available land parcels in the metropolis, exacerbated by the competition for land for the booming condominium and office markets, have resulted in the decreasing number of regional and superregional centers and a shift towards smaller format retail. Compact mall development is also strategic as it allows the retailer to go into residential enclaves that are otherwise underserved in terms of retail. With worsening traffic conditions in Metro Manila, shoppers would prefer to go to a convenient neighborhood location than to spend time in traffic going to a regional mall. In the four-year supply pipeline, only five projects are classified as regional and superregional centers. Three are expansion projects, utilizing the unused space in the current malls. These projects include Filinvest’s expansion of Festival Supermall (+57,000 sq m) and SM Prime Holdings’ SM Mall of Asia (+200,000 sq m) expansion project. Meanwhile, two are new projects and both are owned by Ayala Land, which was able to increase its land bank in Metro Manila with key acquisitions and partnerships – the Circuit Mall (58,000 sq m) in Makati, and Arca South Taguig Phase 1 (73,000 sq m) on the former FTI property in Taguig.
Despite smaller retail spaces dominating new supply, retail developers remain bullish in pursuing these projects due to strong domestic consumption amid a stable economic outlook. From 2016 to 2018, an average of 210,000 sq m of retail space is targeted to be delivered annually.
Retail Stock
Metro Manila CLASSIFICATION 4Q 2014 1Q 2015 % CHANGE (QoQ) 1Q 2016F % CHANGE (YoY)
Super Regional 3,657,635 3,657,635 0.00 3,714,635 1.56
Regional 934,983 1,014,983 8.56 1,034,983 1.97
District/Neighborhood 1,200,843 1,228,515 2.30 1,449,068 17.95
All Levels 5,793,461 5,901,133 1.86 6,198,686 5.04
Source: Colliers International Philippines Research
Retail vacancies decline despite expansion activitiesVacancy rates at both regional and superregional malls declined further in the last six months, posting an occupancy rate of 97.9% as of the first quarter. While some retail spaces were rendered vacant due to renovation and relocation activities, retailers have opened new shops in these malls thereby increasing the occupancy rate and mitigating the effects of the vacated areas.
Some retailers are embarking on expansion activities to facilitate further growth of their businesses. At the same time, new entrants in the food, fashion, and technology sectors are expected to be online in the next six to nine months. As a result, Colliers predicts that occupancy will revert to high 98% levels by the end of the year.
Metro Manila
Comparative Retail Vacancy Rates (%)4Q 2014 1Q 2015
Super Regional 1.98 1.53
Regional 3.66 4.17
Source: Colliers International Philippines Research
10 Research & Forecast Report | 1Q 2015 | Philippines | Colliers International
Retail rents maintain strong growthRental rates at Ayala Centre amounted to PHP1,425 per sq m per month, growing by 1.6% QoQ. Meanwhile, Ortigas Centre rental rates accelerated by 3.2% QoQ, its fastest quarterly growth in recent years. As such, rents at Ortigas Centre averaged PHP1,275 per sq m per month. Colliers forecasts that retail rents in these areas will grow between 5 and 7.5% over the next 12 months.
Source: Colliers International Philippines Research
Source: Colliers International Philippines Research
Ortigas Monthly Retail Rents
Consumer Spending Growth Rate
Source: Philippine Statistical Authority
Declining oil prices and stable inflation cause positive consumer sentimentA 40% decline in the global crude prices since November 2014 greatly contributed to a healthy inflation environment (4.1%), helping domestic consumption to grow at 5.1% in 2014. Apart from growing expenditures for basic necessities like food and housing, the Philippine Statistical Authority reported increasing growth rates for restaurants and hotels (+6.8% YoY), and recreation and culture (+5.3%), affirming that on a macroeconomic level, more families are able to earn more income for their families. As a result of this encouraging economic environment, consumer outlook over the next 12 months is positive due to more disposable income leading to more savings and availability of more jobs, among others.
-0.20
-0.15
-0.10
-0.05
-0.00
0.05
0.10
0.15
0
1%
2%
3%
4%
5%
6%
7%
8%
Makati Monthly Retail Rents
Author:Mark LagunillaAnalyst | Philippines+63 2 888 [email protected]
Contributors:Julius GuevaraDirector | Research & [email protected]
David A. YoungManaging Director | [email protected]
Copyright © 2015 Colliers International.
The information contained herein has been obtained from sources deemed reliable. While every reasonable effort has been made to ensure its accuracy, we cannot guarantee it. No responsibility is assumed for any inaccuracies. Readers are encouraged to consult their professional advisors prior to acting on any of the material contained in this report.
Colliers International Philippines11F Frabelle Business Center 111 Rada St Legaspi Village Makati City 1229 Philippines
TEL +63 2 888 9988
502 offices in 67 countries on 6 continents
billion in annual revenue
billion square feet under management
professionals and staff
$2.3 1.70 16,300
United States: 140 Canada: 31 Latin America: 24 Asia: 39ANZ: 160 EMEA: 108