college statistics 2016-17 - sfc.ac.uk · pdf filesummary: fao: 30/01/2018 . sfc/st/01/2018 :...
TRANSCRIPT

College Statistics 2016-17
Issue date: Reference: Summary: FAO:
30/01/2018 SFC/ST/01/2018 This publication provides an overview of college sector statistics from 2006-07 to 2016-17. Principals and Directors of Scotland’s colleges
Further information:
Contact: Cathy Mitchell Job title: Senior Policy / Analysis Officer Department: Finance Email: [email protected]
Scottish Funding Council Apex 2
97 Haymarket Terrace Edinburgh EH12 5HD
T 0131 313 6500 F 0131 313 6501
www.sfc.ac.uk

Contents
Contents 2
List of Figures / Tables 3
Key points 4
Links to Key Points 5
Introduction 6
Trends in Student Numbers and Activity 7
Student Numbers and Enrolments 7
Volume of Activity 8
Trends in Mode and Duration of Study 12
Non-Recognised Qualifications and Courses Lasting Under 10 Hours 13
SFC Funded Hours of Learning 15
Student Characteristics 18
By Age 18
By Gender 19
By Disability 19
By Ethnicity 21
Further Information 23
Annex A: Measuring Student Numbers, Volume of Activity and Changes in Policy 24
Annex B: Methodology - WSUMs to Credits 27
Implications for time-series 28
Annex C: College Outcome Agreements 29

3
List of Figures / Tables
Figure 1 Number of Students and Enrolments, 2006-07 to 2016-17
Table A
Percentage of Students Enrolled on Multiple Courses, 2012-13 to 2016-17
Table B
Student Numbers and Volume of Activity in Scotland's Colleges, 2006-07 to 2016-17
Table C Credits Delivered Against Target, 2016-17
Figure 2 Delivery Against Target, 2006-07 to 2016-17
Figure 3 FTEs Delivered Against FTE Target, 2012-13 to 2016-17 Figure 4
Number & Proportion of Enrolments by Mode and Level of Study, 2006-07 to 2016-17
Figure 5
Enrolments of Under 10 Hours and Non-Recognised Qualifications, 2006-07 to 2016-17
Figure 6 Proportion of Learning Hours by Age Group, 2006-07 to 2016-17 Figure 7
Average Hours of Learning - Part Time Students, 2006-07 to 2016-17
Figure 8
Percentage of Learning Hours by Recognised Qualifications and Special Programmes, 2006-07 to 2016-17
Table D Full-time, SFC-funded Students by Age, 2016-17
Figure 9 Student Enrolments by Gender, 2006-07 to 2016-17 Figure10
Percentage of Hours Delivered to Students with a Disability, 2006-07 to 2016-17
Figure 11
Percentage of Learning Hours to students with a Disability by Programme Type, 2006-07 to 2016-17
Figure 12
BME Student Learning Hours - Percentage of Total Learning Hours, 2006-07 to 2016-17
Figure 13
Enrolments for Students from a Minority Ethnic Background, 2016-17
Table E Students to Enrolments, 2016-17
Table F Notable Changes in External Factors Affecting the College Sector Table G Selected National Performance Measures, 2014-15 to 2016-17

4
Key points
1. This report provides an overview of college sector statistics from 2006-07 to 2016-17. The figures include measurement of student numbers presented in terms of headcounts and enrolments. They also include measurements of college activity expressed in Credits, Hours of Learning and Full Time Equivalents (FTEs). The credit based system of funding college activity was introduced in 2015-16, and this report is therefore presenting activity in Credits for the second time.
2. The key points from this report are:
· In 2016-17 the college sector delivered 121,653 full-time equivalent (FTE) places. This included 117,502 SFC funded FTE places, 0.3% higher than in 2015-16 and exceeding the sector FTE target of 116,269.
· In 2016-17 the college sector delivered 1,762,032 Credits. This included 1,699,760 Core Credits meaning that colleges exceeded the Core Credit target by 0.5%.
· In 2016-17 the headcount total for the college sector was 235,737, an increase of 3.7% from 2015-16. The enrolment total was 291,849, an increase of 3.8% from 2015-16.
· The number of enrolments to full-time HE courses has remained at the same level between 2015-16 and 2016-17, decreasing by 2 enrolments or 0.0%.
· The number of enrolments to full-time FE courses has also remained at the same level between 2015-16 and 2016-17, increasing by 14 enrolments or 0.0%.
· The number of enrolments to part-time HE courses increased by 799 between 2015-16 and 2016-17, equivalent to 4.7%.
· The number of enrolments to part-time FE courses, the largest group, increased by 9,996, or 5.4%, between 2015-16 and 2016-17.
· Students aged 18 and 19 make up the largest proportion of full-time SFC funded enrolments, accounting for 34.4%.
· In 2016-17, male students accounted for 50.4% of all enrolments and this is the first time that there have been more total male enrolments than female enrolments in the college sector. In terms of Credits delivered, females accounted for 51.3%.
5
Under 16 16 to 17 18 to 19 20 to 24 25 and over2016-17 Students 392 12,924 26,185 17,528 19,175Difference from 2015-16 -36 -210 217 -211 491Difference from 2006-07 -539 -5659 6736 4534 5662
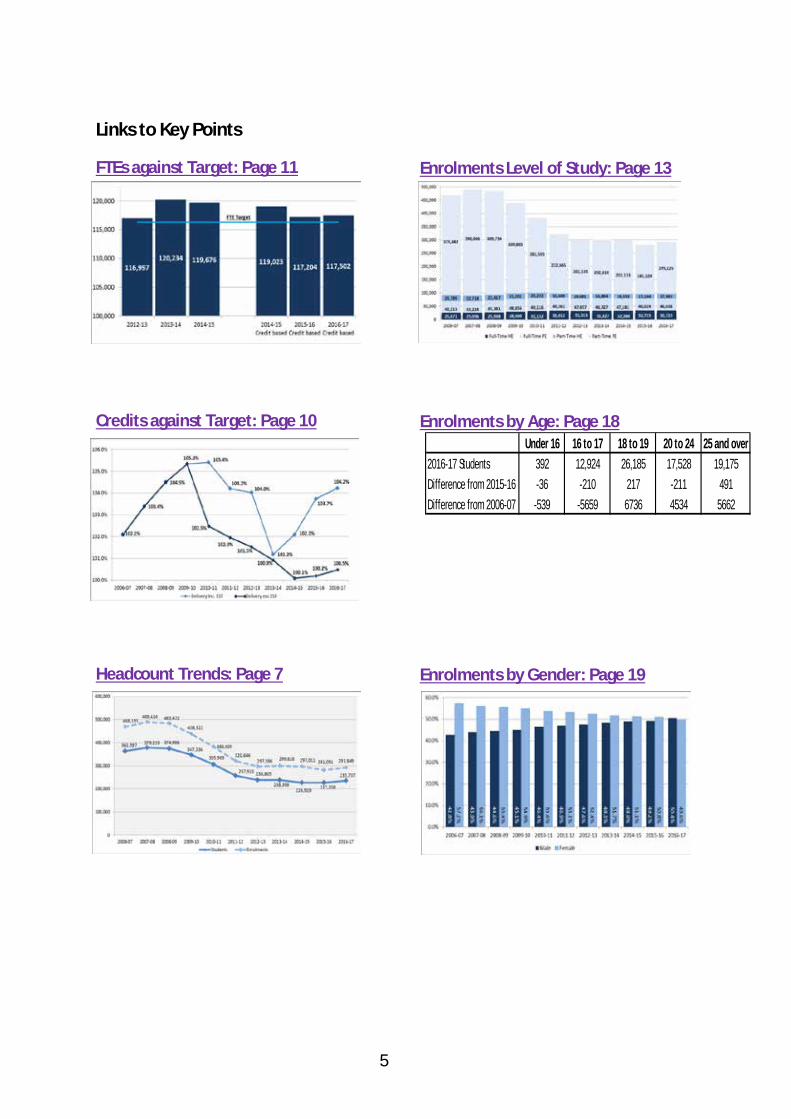
Links to Key Points
FTEs against Target: Page 11
Credits against Target: Page 10
Headcount Trends: Page 7
Enrolments Level of Study: Page 13
Enrolments by Age: Page 18
Enrolments by Gender: Page 19

6
Introduction
3. This report provides an overview of college sector statistics from 2006-07 to 2016-17. Student numbers in the college sector are measured by both headcount and enrolments. This is because a student can enrol on multiple college courses within one academic year. Headcounts measure the number of students in an academic year and enrolments measure the number of times students enrol on programmes of study. This is explained in more detail in Annex A.
4. The Credit based system of funding college activity was introduced in 2015-16, meaning that this is the second year of reporting on that basis. Previously, colleges were funded to deliver a defined number of Weighted Student Units of Measurement (WSUMs). The simpler Credit-based system replaced WSUMs, and provides a clear separation between activity volume measures and funding. Credit targets do not include subject weights, Extended Learning Support (ELS) claims, or full-time tariffs that were all part of the previous WSUM targets. This is explained further in Annex B.
5. This report focuses on trends in student numbers and activity targets. It also covers trends in full and part-time enrolments, and the make up of learning hours delivered by colleges.
6. This report shows trends in the level and mode of study of the sectors enrolments. These are presented in four groups: full-time higher education (HE), part-time HE, full-time further education (FE) and part-time FE. Due to the additional reporting from colleges of the SCQF levels of courses, as defined by the SCQF level framework, the definition of higher education as qualifications at SCQF level 7 and above can be applied to courses delivered in the college sector.
7. This is part of ongoing improvement work around the reporting of qualifications and their level and is due to come in to full effect in academic year 2017-18, as stated in the FES 2 Guidance for 2017-18. This work began in 2016-17, specifically looking at Scottish Vocational Qualifications (SVQ3s) and Advanced Highers. However, to allow continuity in the time series shown in this report, enrolments to these two qualifications have been defined as at Further Education level. Further work with colleges and other colleagues will be undertaken to ensure continued improvement in this area. For more details please see Section 2: ‘Trends in Student Numbers and Activity’ and Table F in Annex A.
8. Excel tables containing the background data to all the charts presented in this report can be found on the SFC website.

7
9. SFC’s Infact database allows for more detailed analysis of provision within Scotland’s colleges. More detail is in the ‘Further Information’ section of this report.
Trends in Student Numbers and Activity
10. This section focuses on trends across college provision from 2006-07 using headcount and enrolments and the volume of activity delivered at sector level.
Student Numbers and Enrolments
11. Figure 1 shows the number of students and the number of enrolments from these students in each academic year between 2006-07 and 2016-17. The trend in student headcount and enrolments has comparably levelled out since 2012-13. In 2016-17 the headcount total increased by 8,479 (+3.7%) to 235,737 and the enrolment total increased by 10,798 (3.8%) to 291,849.
12. As previous College Statistics publications have noted, the decrease in headcount between 2007-08 and 2012-13 is primarily because of the policy shift away from short courses and non-recognised qualifications that did not support labour market demands (described more fully in Table F in Annex A).
Figure 1: Number of Students and Enrolments, 2006-07 to 2016-17
13. The difference between the headcount and enrolment totals is due to students enrolling on more than one course within the same academic year. In 2016-17 there were 42,630 students enrolled on multiple courses, totalling 98,743

8
enrolments. Table A below shows the percentage of students on multiple courses between 2013-14 and 2016-17.
Table A: Percentage of Students Enrolled on Multiple Courses, 2013-14 to 2016-17 Number of
Courses Percentage of
Students 2013-14
Percentage of Students 2014-
15
Percentage of Students 2015-
16
Percentage of Students 2016-
17 1 81.7% 77.1% 82.8% 81.9% 2 13.5% 17.5% 13.2% 14.6% 3 3.2% 3.9% 2.7% 2.4% 4 1.0% 1.0% 0.7% 0.6% 5 or more 0.6% 0.6% 0.6% 0.5%
14. Further details of the number of students with multiple enrolments are shown
in in Annex A.
Volume of Activity
15. Table B below sets out the time series from 2006-07 for enrolments and headcounts (as shown in Figure 1) alongside the equivalent activity measures. Under the credit system, that has been in place since 2015-16, the relevant measures for activity are Credits, Hours of Learning (excluding FT tariffs) and Full-time Equivalents (FTEs). Data under the credit system has also been retrospectively calculated for 2014-15.
16. Annex A gives further detail and explanation for each measure shown in Table B and provides contextual information that is relevant to trends in the table.

9
Table B: Trend in Student Numbers and Volume of Activity in Scotland's Colleges, 2006-07 to 2016-17 Student Numbers Volume of Activity
Academic Year Headcount Enrolments
SUMS (including FT
tariffs)
Credits (excluding FT tariff)
Hours of Learning
(including FT tariffs)
Hours of Learning
(excluding FT tariffs)
FTE based on pre 2015-16
methodology
FTE based on simplified
2015-16 methodology
2006-07 363,597 468,155 2,025,821 81,032,840 120,808 2007-08 379,233 489,610 2,054,446 82,177,840 122,641 2008-09 374,986 483,472 2,056,991 82,279,640 123,031 2009-10 347,336 438,522 2,085,760 83,432,840 124,670 2010-11 305,969 383,005 2,069,796 82,794,180 124,650* 2011-12 257,913 320,646 1,957,886 84,048,520 122,068* 2012-13 238,805 297,586 1,844,145 79,403,362 119,759** 2013-14 238,399 299,828 1,912,161 76,486,439 120,555**
2014-15 226,919 297,011 1,908,089 1,755,601 76,323,551 70,224,040 121,962** 121,309** 2015-16 227,258 281,051 1,752,536 70,101,427 121,184** 2016-17 235,737 291,849 1,762,032 70,481,280 121,653**
*includes ESF FTEs ** includes SDS Employability Fund and ESF FTEs
10
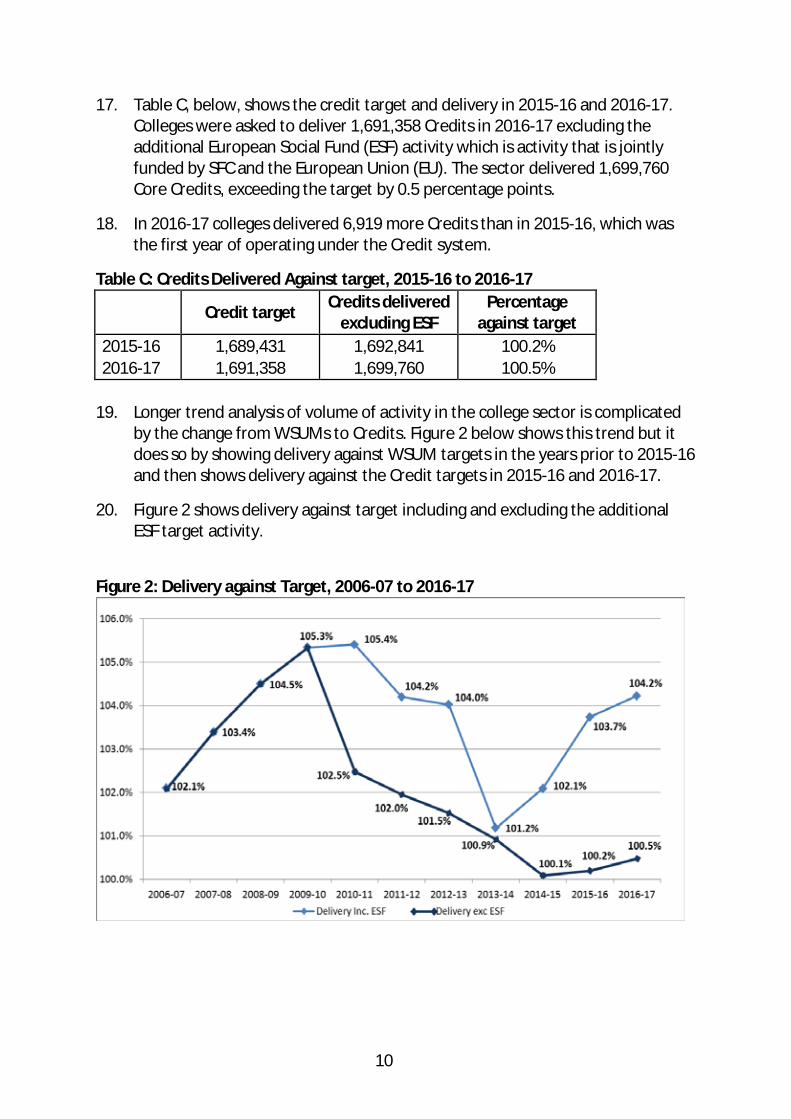
17. Table C, below, shows the credit target and delivery in 2015-16 and 2016-17. Colleges were asked to deliver 1,691,358 Credits in 2016-17 excluding the additional European Social Fund (ESF) activity which is activity that is jointly funded by SFC and the European Union (EU). The sector delivered 1,699,760 Core Credits, exceeding the target by 0.5 percentage points.
18. In 2016-17 colleges delivered 6,919 more Credits than in 2015-16, which was the first year of operating under the Credit system.
Table C: Credits Delivered Against target, 2015-16 to 2016-17
Credit target Credits delivered excluding ESF
Percentage against target
2015-16 1,689,431 1,692,841 100.2% 2016-17 1,691,358 1,699,760 100.5%
19. Longer trend analysis of volume of activity in the college sector is complicated
by the change from WSUMs to Credits. Figure 2 below shows this trend but it does so by showing delivery against WSUM targets in the years prior to 2015-16 and then shows delivery against the Credit targets in 2015-16 and 2016-17.
20. Figure 2 shows delivery against target including and excluding the additional ESF target activity.
Figure 2: Delivery against Target, 2006-07 to 2016-17

11
21. The college sector also has an FTE target and since 2012-13 this target has been 116,269 FTE places. SFC funded activity and SDS Employability Fund activity are both counted towards this target. The 598 FTE places delivered at HE level by Scotland’s Rural College (SRUC) that were moved from the college data collection from 2013-14 (see Annex A Paragraph 9) are also included in the 116,269 college target in order to create a like for like comparison.
22. Not all FTE activity delivered by the college sector counts towards the 116,269 target. ESF activity, for example, does not count towards this target because the nature of ESF funding is of providing additionality to the core activity of the sector. In 2016-17 colleges delivered an additional 4,151 FTEs for ESF programmes. In total, colleges delivered over 120,000 FTEs that were either wholly or partly funded by SFC, and around 132,500 FTEs including students that are not funded by SFC. This report focuses on SFC funded provision.
23. Figure 3, below, provides an overview of college delivery in terms of FTE places. It shows that colleges delivered 117,502 SFC funded FTE places in 2016-17.
Figure 3: FTEs Delivered Against FTE Target, 2012-13 to 2016-17

12
Trends in Mode and Duration of Study
24. The type of activity delivered by colleges can vary depending on the mode and level of study. This section provides a detailed breakdown, showing the number of full and part-time enrolments to further education (FE) and higher education (HE) level courses delivered in Scotland’s colleges from 2006-07 to 2016-17.
25. Higher education is defined for the purposes of reporting in colleges as qualifications at SCQF Level 7 and above. There has been significant and ongoing work undertaken with the college sector to ensure uniform application of this definition in line with the SCQF Framework. This definition is significant because it reclassifies some qualifications at SCQF level 7 from FE to HE. In this data for 2016-17, these qualifications (specifically Advanced Higher and Scottish Vocational Qualification Level 3 (SVQ3) qualifications) have been treated as FE to allow continuity of time series. This affected 242 Advanced Higher enrolments and 4,416 SVQ3s. Further details and the number of enrolments that are affected are provided in Table F in Annex A.
26. The majority of the sector’s total enrolments are on part-time FE courses. In 2016-17, 66.9% of the sector’s 291,849 enrolments were on part-time FE courses. Figure 4 below shows the numbers and proportions for each level and mode of study in each year from 2006-07.
27. The number of enrolments to full-time HE courses has remained at the same level between 2015-16 and 2016-17, decreasing by 2 enrolments. Since 2006-07 the number of enrolments to full-time HE courses has increased by 7,052, equivalent to 27.5%.
28. The number of enrolments to full-time FE courses also remained at the same level between 2015-16 and 2016-17, increasing by 14 enrolments. The number of enrolments to full-time FE courses has increased by 2,825 since 2006-07, equivalent to 6.5%.
29. The number of enrolments to part-time HE courses has decreased by 24.5% over the time period since 2006-07 but there has been an increasing trend in these numbers since 2011-12. Between 2015-16 and 2016-17 the number of part-time HE enrolments increased by 799, equivalent to 4.7%.
30. The number of enrolments to part-time FE courses, the largest group, increased by 9,996, or 5.4%, between 2015-16 and 2016-17. This group has had the largest decrease in enrolments since 2006-07, decreasing by 180,357 enrolments or 48.0%. This decrease is explored more fully in the next section on non-recognised qualifications and courses lasting under 10 hours. The characteristics of the students that enrolled on these courses in 2007-08, the

13
year with the highest number of part-time FE enrolments. Further detail is available in the College Statistics 2015-16 publication.
Figure 4: Enrolments by Mode and Level of Study, 2006-07 to 2016-17
Non-Recognised Qualifications and Courses Lasting Under 10 Hours
31. The decline in part-time enrolments, particularly to FE level courses, is perhaps the most notable trend shown in Figure 4. Part-time FE enrolments include programmes that do not lead to recognised qualifications and those that last for less than 10 hours. It is a reduction in these courses that has led to the significant decrease in part-time FE enrolments1. The reduction in these very short programmes and non-recognised qualifications accounts for around 136,348 (65.7%) of the total reduction of 207,494 part-time FE enrolments between 2007-08 and 2016-17.
32. In 2016-17, there were 80,378 enrolments on these very short programmes and non-recognised qualifications. This represents 27.5% of all enrolments, yet accounts for less than 2 million learning hours and only 2.7% of SFC funded activity.
1 Consistent with the Scottish Government’s policy direction, SFC decided not to fund short courses lasting for less than 10 hours from 2010-11 onwards, with exceptions to this rule for courses delivered in partnerships with schools, courses designed for widening access, or those that meet the training needs of unemployed people.

14
33. Figure 5 below shows that between 2015-16 and 2016-17 there was an increase in both non-recognised qualifications and courses lasting under 10 hours, ending the general downward trend since 2007-08. The increase was most significant for courses under 10 hours in duration, increasing by 9,797 enrolments or 53.2%.
Figure 5: Under 10 Hours & Non-Recognised Qualifications, 2006-07 to 2016-17
Where an enrolment is both to a non-recognised qualification and under 10 hours in duration it is counted only as 'Under 10 Hours'

15
SFC Funded Hours of Learning
34. This section focuses on SFC-funded hours of learning. The hours of learning measure is based on SFC-funded students for whom we collect information on planned learning hours. SFC does not collect information on planned learning hours for students funded from other sources.
35. As explained in Annex B, from 2015-16 onwards hours of learning are calculated on a different basis from hours of learning in 2005-06 to 2014-15. For this reason, many charts showing hours of learning are shown as a percentage of learning hours to enable time series comparisons. The change in methodology should still be noted and taken into consideration when making comparisons between years.
36. Since 2012-13 the percentage of learning hours delivered to those in the 16 to 24 age group have decreased from 70.9% of all learning hours to 68.1% in 2016-17. In this time, the proportion of learning hours delivered to students over the age of 25 has increased from 26.5% to 29.2%.
37. The percentage of learning hours delivered to those under the age of 16 remains a small proportion, at its highest in 2008-09 at 5.1%.
Figure 6: Hours of Learning by Age Group, 2006-07 to 2016-17
The figures from 2015-16 use the updated methodology and are for Hours of Learning based on Credits. Percentages refer to the hours of learning in Table B. 38. The number of learning hours completed by part-time students varies
depending on the course. Courses range from under 10 hours of learning to 600

16
hours which would be defined as a full-time course. Figure 7 below shows the average hours studied by part-time learners from 2006-07 to 2016-17.
39. The average number of learning hours for part-time students reached a peak in 2013-14 at 157 hours. This has decreased in each year since and in 2016-17 was 144 hours per part-time student.
Figure 7: Average Hours of Learning - Part Time Students, 2006-07 to 2016-17
40. Figure 8 below, shows the proportion of learning hours split between
recognised qualifications, non-recognised qualifications and bespoke provision courses. Bespoke provision courses refer to specialist programmes that are offered by colleges for students requiring any additional support, available to those with or without a reported disability. Further detail on these programmes is shown in Figure 11 below.
41. Figure 8 shows that the vast majority of learning hours are delivered to recognised qualifications on mainstream programmes. The proportion of learning hours delivered to recognised qualifications has been increasing since 2006-07 and reached 97.4% in 2016-17.

17
Figure 8: Percentage of Learning Hours by Programmes Type, 2006-07 to 2016-17
42. Figure 8a in the Background Tables online shows this split in activity measured
in enrolments. It shows that 23.3% of the sectors enrolments are to non-recognised qualifications, although this only equates to a small proportion of the learning hours delivered.

18
Student Characteristics
43. This section includes high level summary details for selected student characteristics in colleges by enrolment numbers and hours of learning. These measurements for student activity are used for comparability over time. Age, gender, disability and ethnicity are shown in this section. A more detailed analysis can be found in the SFC Report on Widening Access or on the SFC website.
By Age
44. The age profile of students at college varies by mode and level of attendance. Table D shows the number of full-time, SFC-funded students by age group. Table D shows that those aged 18 and 19 make up the largest proportion of full-time SFC funded students and the number of enrolments by this group increased by 217 between 2015-16 and 2016-17. There has also been an overall increase of 34.6% in enrolments by this group since 2006-07.
45. Enrolments by full-time students aged 16 to 17 decreased between 2015-16 and 2016-17, and overall since 2006-07. Enrolments by full-time students aged 20 to 24 decreased by 211 between 2015-16 and 2016-17 but have seen an increase of 34.9% since 2006-07.
46. For those aged under 16, there was a slight decrease of 36 enrolments between 2015-16 and 2016-17 and a decrease equivalent to 57.9% between 2006-07 and 2016-17. For those aged 25 and over, enrolments increased by 2.6% between 2015-16 and 2016-17 and by 41.9% between 2006-07 and 2016-17.
47. Overall, the 18 to 19 age group accounted for 34.4% of all full-time SFC-funded enrolments and the 25 and over age group accounted for 25.2%.
Table D: Full-time, SFC-funded Student Enrolments by Age, 2016-17
Under 16 16 to 17 18 to 19 20 to 24 25 and over
2016-17 Students 392 12,924 26,185 17,528 19,175 Difference from 2015-16 Difference from 2006-07
-36 -539
-210 -5,659
+217 +6,736
-211 +4,534
+491 +5,662
48. Further detail of this trend for 16 to 24 year olds is shown in Figure A in the
Background Tables online. Figure 6 above also shows hours of learning by age group.

19
By Gender
49. For the first time since 2006-07, there were more total male enrolments than female enrolments in the college sector. Figure 9 below shows that male students accounted for 50.4% of all enrolments, an increase of 1.2 percentage points from 2015-16 and an increase of 7.6 percentage points from 2006-07. This equates to 146,911 male enrolments, 144,653 female enrolments and 285 enrolments of ‘other’ gender in 2016-17.
50. Table G in Annex C shows, however, that females still account for a higher proportion of Credits delivered in colleges. The Table shows that 51.3% of Credits were delivered to females.
Figure 9: Student Enrolments by Gender, 2006-07 to 2016-17
51. Additional information on gender by subject is provided in the Background
Tables online and a more detailed analysis can be found in the SFC Gender Action Plan and corresponding Technical Report for 2015-16.
By Disability
52. Figure 10 below shows the percentage of learning hours delivered to students with a declared disability. The chart shows that the proportion of the sectors total learning hours delivered to students with a declared disability has been increasing since 2006-07. In 2016-17, 17.1% of all learning hours were delivered to students with a declared disability, an increase of 0.3 percentage points from 2015-16 and of 4.7 percentage points since 2006-07.

20
Figure 10: Percentage of Learning Hours to Students with a Declared Disability, 2006-07 to 2016-17
53. Colleges offer specialist programmes (bespoke provision courses) for students
requiring any additional support, available to those with or without a reported disability.
54. Figure 11, below, shows the proportion of learning hours delivered to students with a declared disability on mainstream programmes and on bespoke provision courses. It shows that 78.6% of learning hours to students with a declared disability are on mainstream programmes. There was a 0.1% decrease between 2015-16 and 2016-17 in the proportion of learning hours delivered to students with a declared disability studying on bespoke provision, but generally this proportion has been decreasing since 2006-07.

21
Figure 11: Percentage of Learning Hours to Students with a Declared Disability by Programme Type, 2006-07 to 2016-17
By Ethnicity
55. Figure 12 below shows the percentage of learning hours delivered to students from a Black and Minority Ethnic (BME) background. After a decrease between 2010-11 and 2011-12, the proportion of learning hours delivered to students from BME backgrounds has been increasing year on year. In 2016-17, 6.4% of learning hours were delivered to students from a BME background.
Figure 12: Percentage of Learning Hours to Students from Black and Minority Ethnic Backgrounds, 2006-07 to 2016-17
56. Figure D in the Background Tables online shows the learning hours in Figure 12
above split by the breakdown of ethnicities.

22
57. These learning hours also correspond to 19,089 enrolments from BME students. A more detailed breakdown of the ethnicity of these enrolments is shown in Figure 13 below. Figure 13 shows that the largest group in the BME population is those of African ethnicity, with 5,019 total enrolments.
58. Figure 13 shows the BME enrolments by funding type, separating those funded by SFC and those funded from other sources. Courses funded from other sources are likely to be commercially funded and can indicate students coming from overseas.
Figure 13: Enrolments for Students from Black and Minority Ethnic Backgrounds, 2016-17

23
Further Information
59. The Infact database allows for more detailed analysis of provision within Scotland’s colleges. Please note that figures on Infact may differ from those presented here. FTE figures may differ as Infact also includes FTE figures for students not funded by SFC. These students are not counted in this report. Please also note that headcount figures may differ, as this report will count a student once irrespective of how many colleges they attended, whereas Infact will count them at each college.
60. All charts and data shown in this report are available in an Excel spreadsheet on the SFC website.
61. A publication detailing College Performance Indicators for 2016-17 is scheduled to be published on the SFC website on 13 February 2018. Student numbers presented in this report may differ from those contained in other publications, as the reports are prepared for different purposes. For example, the College Performance Indicators publication excludes students who begin courses in January and finish in December of the same year as results will not be available for these students until the course ends. However in this report, activity relating to these students is counted.
62. The SFC Report on Widening Access presents further statistics on widening access in the College and University sectors.

24
Annex A: Measuring Student Numbers, Volume of Activity and Changes in Policy
1. There are two ways to count student numbers in the college sector: headcount and enrolments. Headcounts count the number of students, and enrolments count the number of times the students that make up the headcount total enrol on separate courses. A student can often enrol on multiple courses in one academic year so we expect the number of enrolments to be greater than the headcount total.
2. Table E below shows how the number of students corresponds to the number of enrolments in 2016-17.
Table E: Students to Enrolments, 2016-17
Number of students (headcount)
Number of courses taken Enrolments
193,106 1 193,106 34,356 2 68,712
5,681 3 17,043 1,469 4 5,877 1,124 5 or more 7,111
235,737 291,849
3. The volume of activity delivered to these students can also be measured in a number of ways, which are covered in this report.
4. Historically the volume of student activity was linked to the funding methodology for colleges, but this changed in 2015-16 when SFC began to fund on the basis of Credits rather than WSUMs. The move to Credits simplified the measurement of the volume of activity delivered to students by separating it from funding considerations, explained further in Annex B.
5. Table B from the ‘Trends in student numbers and activity’ section shows the number of SUMs delivered from 2006-07 to 2014-15. The SUMs measure (where one SUM is equivalent to 40 hours of learning) was designed to measure volume and inform funding decisions. As a result it was not a pure volume measure and included a full time tariff in all years. In 2014-15 FE students studying for 16 SUMs or more (640 hours of learning) qualified for a full time tariff of 20 SUMs. Students on HE programmes who studied for 12 SUMs or more qualified for a full time tariff of 15 SUMs.

25
6. The Credit measure replaces SUMs from 2015-16. Each Credit is also worth 40 hours of learning but there is no longer a full time tariff as described above. The removal of the full time tariff is the only difference between SUMs and Credits.
7. The ‘Hours of Learning’ measure was calculated by multiplying the number of SUMs by 40. As the SUMs measure included a full time tariff the reported hours of learning was also higher than the actual hours of learning. From 2015-16 ‘Hours of Learning’ is based on the Credit measure and therefore more reflective of actual hours of learning.
8. We have also changed our FTE (Full-time Equivalent) methodology but the reported levels of FTEs are very similar under both systems. Table B shows that the number of FTEs is 0.5% lower under the new Credit system compared to the old system for 2014-15.
9. Table B also includes updated FTE numbers for 2012-13, 2013-14 and 2014-15. In 2012-13 the Scottish Government announced that the college sector would be asked to deliver 116,269 FTEs each year. Also in 2012-13, after the FTE target was announced, 598 FTEs that were previously delivered by the three agricultural colleges were transferred to SRUC and were subsequently reported via the Higher Education Statistics Agency rather than the Further Education Statistical return. These 598 FTEs have been added to the total FTE count to enable us to show a more complete, like for like, picture of delivery against the 116,269 FTE target. It should be noted that the 116,269 FTEs were exceeded in each year since 2012-13 before taking these 598 FTEs into account.
10. Throughout the time period shown in Table B there has been a number of significant changes to policy that have affected trends in student numbers and the volume of activity delivered by colleges. Table F below describes these main changes and it is important to be aware of these changes when looking at trends and fluctuations in the figures in Table B.

26
Table F: Notable Changes in External Factors Affecting the College Sector
Date Change Impact on the trends presented in this report
2008-09
Colleges directed to prioritise more substantial courses designed to improve employment prospects.
Reduction in number of students enrolled on very short programmes of study unlikely to lead to employment or higher level of study.
2011-12
Decision to focus school / college courses towards the senior phase of high school.
Reduction in college activity targets of 5%, but students affected continue to have a full-time place at school.
2012-13
Introduction of College Outcome Agreement.
Reduction in SFC funded learning hours delivered to those aged 16 to 24, with this activity being commissioned by the SDS Employability Fund (equivalent to 586 FTEs in 2016-17).
Transfer of funded learning hours from SFC to SDS.
2015-16 WSUMs replaced with Credits and removal of full-time tariffs.
Hours of learning reduce under the Credit system as a result of improvements that removed funding considerations and created a more pure measure of activity
2017-18 Re-coding of SCQF level 7 courses from FE level to HE level.
Courses at SCQF level 7 are defined as HE for the purposes of reporting consistent with the SCQF Framework levels. In previous years these could have been FE or HE. These courses are still funded as FE courses. Further consultation will be conducted on this definition.
11. In 2017-18, the Scottish Government announced the intention to restate the focus on learners aged 16 to 24 year olds. This intention is laid out in the Ministerial Letter of Guidance from October 2017. The College Statistics publication for 2017-18 may therefore include revised tables showing a greater coverage of all age groups.

27
Annex B: Methodology - WSUMs to Credits
1. Colleges have been funded to deliver a WSUM target for over 20 years. The WSUM was however not widely known or understood outwith the college sector, and did little to inform our stakeholders of the value colleges deliver for Scotland. To aid transparency and to improve the planning process, WSUM targets were replaced with much simpler Credit targets from 2015-16.
2. The new Credit based system means that there is now a clear separation between our volume measures and funding considerations. Credit targets no longer include subject weights, Extended Learning Support claims, or full-time tariffs that were all part of the previous WSUM targets.
3. As Credits are based on planned activity, reported learning hours better reflect the course content that the student enrolled to undertake rather than actual hours of learning. If a student enrols on a course that requires 720 hours of learning then this will be the value used in our reporting even if the student later withdraws, but importantly, only if the student continues to actively participate in their course beyond the funding qualifying date (1 November for full time courses and after 25% of course days have passed for part time courses).
4. Where students withdraw after this date the college will still claim for the 720 hours, since classroom space, staff and other college resources have been committed for the student and substitution for another student cannot happen at this late stage.
5. Colleges are unable to claim Credits for students who withdraw prior to the funding qualifying date. As a result no learning hours are reported for these students at all. The college will still have committed staff and college resources for these students but will receive no funding from SFC.
6. Full-time Tariffs – Under the previous methodology, colleges could have delivered 16 SUMs to a full-time FE student and qualified for a full-time tariff for that student. The Credit measure is now a closer measure of activity separated from funding considerations.
7. The full-time tariff has meant that previously full-time students have been funded at a higher rate than part-time students in terms of price per SUM delivered, but this is no longer the case.
8. Extended Learning Support (ELS) - The WSUM methodology also included an uplift for students enrolled on mainstream courses who required additional learning support. Where a typical full-time student would count towards around 20 WSUMs, students who required additional support would count toward 50 WSUMs (2.5 times as many). The additional 30 WSUMs helped fund the expensive additional support necessary, that colleges provided, often on a one to

28
one basis. Colleges will continue to deliver this support, with funding now specified separately in each region’s outcome agreement, but it will no longer count towards their Credit targets.
9. More information on changes to the ELS can be found on the SFC website.
10. Subject Weights – subject weightings were incorporated into WSUM values to account for subjects that are more expensive for colleges to deliver. For example, a student studying for 10 SUMs (400 hours) could be counted as 7.4 WSUMs if they enrolled on a social studies course which costs less to deliver, or they could be counted as 12.6 WSUMs on an engineering course as these are more expensive courses to deliver.
11. The Credit method no longer has subject weightings but the differentiation in subject prices are reflected in the funding model of subject Price Groups.
Implications for time-series
12. SUMs measure was not a pure measure of college activity and instead a hybrid measure that included both volume and price. A Credit target will be lower than the equivalent WSUM target as a result of removing the full-time tariffs, ELS volume and subject weights. Despite the change in methodology, the Credit target and the WSUMs target allow for the same number of student places in each region.
13. The implications for measures of activity are more notable. The simplified Credits system introduces a simplified and more easily understood measure of the level of FTEs delivered by colleges. Under this system 1 FTE is equal to 15 core Credits irrespective of the level of study or mode of delivery. We continue to recognise the additional learning for students requiring extended support to keep up with their peer groups. Although there is a small drop in the FTE figure for 2014-15 when it is calculated based on Credits as opposed to WSUMs, as shown in Table B above, the impact is slight. Colleges were still given, and exceeded, the same FTE target for 2015-16 as they were given under the previous methodology.
14. Hours of learning – the hours of learning measure is more affected by the move to Credits and the removal of the full-time tariffs. Hours of learning under the different methodologies are not comparable, as can be seen in Table B where the two figures are shown for 2014-15. The drop in hours of learning under the Credit system is a result of improvement of the measure by removing funding considerations and creating a more pure measure of activity.
15. In later sections of this report in order to look at time series comparisons using hours of learning, the percentage of learning hours delivered to particular groups is used.

29
Annex C: College Outcome Agreements
1. As part of the Outcome Agreement process, SFC introduced a National Performance Framework to be used to help measure and assess the impact of the Outcome Agreements across a range of key priority areas.
2. The table below shows the 2014-15 to 2016-17 figures for some of the measures.
Table G: Selected National Performance Measures, 2014-15 to 2016-17 SFC Priority Measure 2014-15 2015-16 2016-17
Right learning in the right place
Credits delivered 1,755,601 1,752,536 1,762,032
Proportion of Credits delivered to learners aged 16-19
47.7% 46.9% 46.6%
Proportion of Credits delivered to learners aged 20-24
22.2% 21.8% 21.5%
Proportion of full-time Credits delivered to learners aged 16-19
52.3% 51.7% 51.6%
Proportion of full-time Credits delivered to learners aged 20-24
23.7% 23.1% 22.7%
Access for people from the widest range of backgrounds
Proportion of Credits delivered to learners from the 10% most deprived areas
16.7% 16.9% 17.2%
Proportion of Credits to learners from a care experienced background
0.3% 1.0% 1.6%
Proportion of Credits to Female learners
51.4% 51.7% 51.3%
Proportion of Credits to Male learners
48.6% 48.3% 48.6%
Proportion of Credits to BME learners
5.7% 6.0% 6.4%
Proportion of Credits to Disabled learners
16.0% 16.8% 17.1%
3. Further information on Outcome Agreements can be found on the SFC website.
© Scottish Funding Council 2018