collecting costs at the country level ppt, 608kb
TRANSCRIPT
Antiretroviral Treatment Costs in Mexico
WHO/UNAIDS Workshop on Strategic Information for Anti-Retroviral Therapy Programmes
30 June to 2 July, 2003Assessment of programme outcomes (economic)
Sergio Bautista, Tania Dmytraczenko, Gilbert Kombe and Stefano Bertozzi
Presentation prepared by INSP, 30 June 2003
Purpose of the Study
To document—using a consistent methodology—the Mexican experience in HIV/AIDS treatment in 3 health subsystems– Ministry of Health (SSA)– Mexican Social Security Institutes (IMSS/ISSSTE)– National Institutes of Health (INS)
Presentation prepared by INSP, 30 June 2003
Specific Objectives of the Study
Identify patterns of HIV/AIDS care and treatment and related costs by type of therapy received– ARV triple therapy or not
To estimate the annual care costs per patient by
•Subsystems SSA, IMSS/ISSSTE,
INS•Care setting Inpatient, outpatient
•Level of care Specialized clinics, secondary
and tertiary hospitals•Disease stage CDC classification CD4

Presentation prepared by INSP, 30 June 2003
Study Approach: Site selection
11 health facilities were selected– SSA sites (5)– IMSS/ISSSTE sites (4)– INS sites (2)
Geographic Location– Mexico City (6)– Guadalajara (2)– Cuernavaca (2)
Level of Care– Highly specialized tertiary care
facilities (3)– Secondary care facilities (7)– Specialized HIV clinic (1)

Presentation prepared by INSP, 30 June 2003
Study Approach: Sample size and eligibility
Convenience sample to reflect clinical and treatment criteria of interest:– ARV recipients (75%)– Not on ARVs (15%)– Deceased (10%)– 1062 patients randomly selected, with sample stratification
Patients eligibility criteria– 18 years or older at first consultation– Diagnosed with HIV and confirmed by Western, Elisa or laboratory
culture, or symptomatic AIDS– Documented visit at a study site between 1/1/2000- 12/31/2001
Presentation prepared by INSP, 30 June 2003
Data Collection Instruments
Utilization (patient chart review)– Socio-demographic characteristics– Clinical events including outpatient, inpatient, labs,
drugs, surgical procedures and interventions
Unit costs (facility questionnaire)– Existing unit cost data
• Facility- or subsystem-specific– Micro-costing of AIDS-specific diagnostic tests and drugs– Recurrent costs (except for AIDS-specific tests)
Presentation prepared by INSP, 30 June 2003
Data Collection Process
5 trained teams, each composed of an economist and a MD/nurse
Data were captured retrospectively for a period of 3 years from the date of last consultation in the study period
Accuracy and reliability of data collection was strengthened with real-time data entry in the field and error checking interface

Presentation prepared by INSP, 30 June 2003
SSA IMSS/ISSSTE INS Education (n=506) (n=144) (n=87)
Primary or less 30.0% 9.0% 26.4% Secondary+ 54.0% 52.8% 55.2% Higher 16.0% 38.2% 18.4%
Mode of Transmission (n=496) (n=175) (n=69) Unsafe injection 1.2% -- -- Transfusion 3.0% 5.7% 2.9% Occupational risk -- -- 1.5% Sexual 95.8% 94.3% 95.7%
Sexual Preference (n=404) (n=127) (n=44) Heterosexual, male 40.3% 62.2% 40.9% Homosexual, male 45.5% 29.9% 43.2% Bisexual, male 14.1% 7.8% 15.9%
Characteristics of the Sample (n=1062)
Presentation prepared by INSP, 30 June 2003
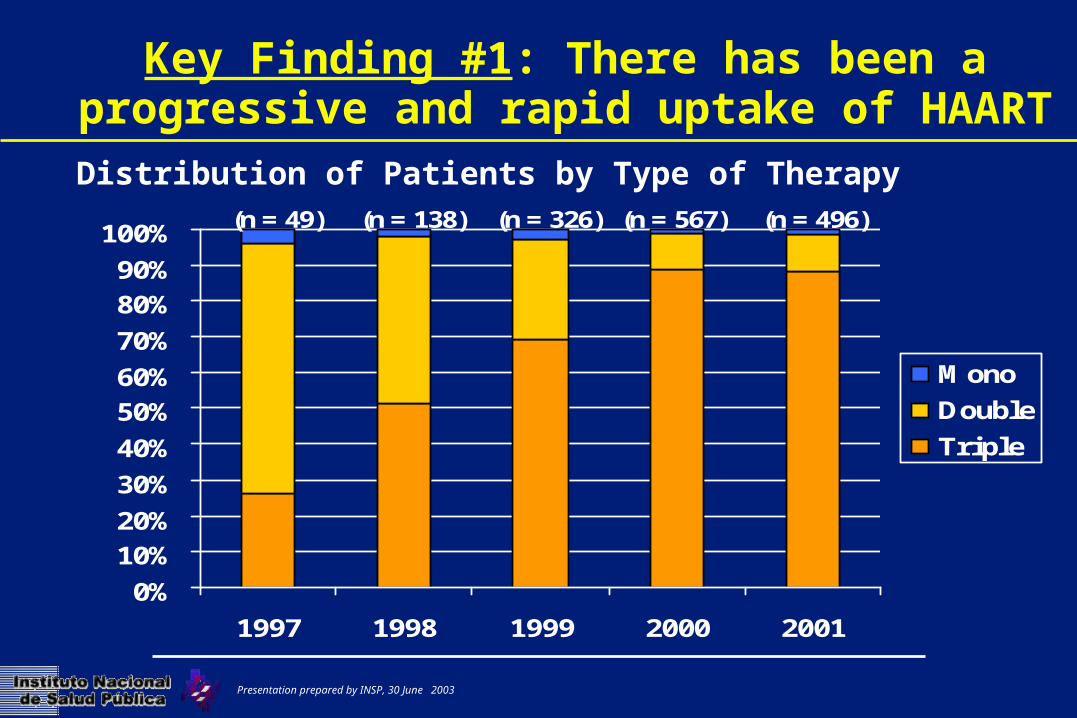
Key Finding #1: There has been a progressive and rapid uptake of HAART
0%10%20%30%40%50%60%70%80%90%
100%
1997 1998 1999 2000 2001
MonoDoubleTriple
(n = 49) (n = 138) (n = 326) (n = 567) (n = 496)
Distribution of Patients by Type of Therapy
Presentation prepared by INSP, 30 June 2003
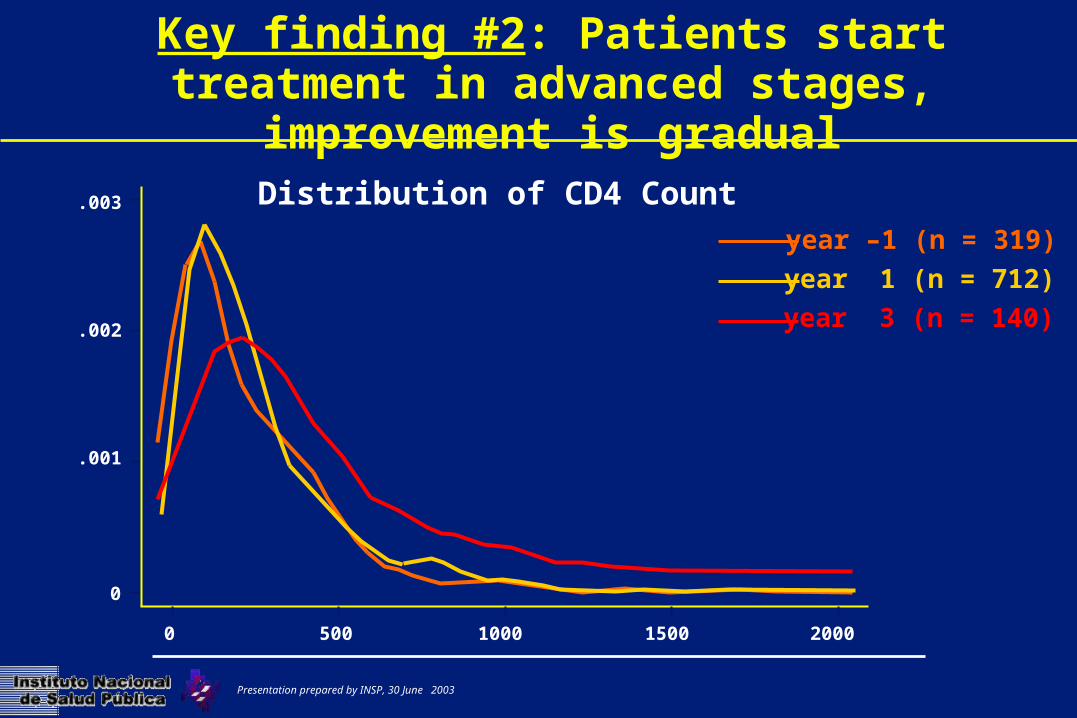
Key finding #2: Patients start treatment in advanced stages, improvement is gradual
.003
.002
.001
0
2000150010005000
year –1 (n = 319)year 1 (n = 712)year 3 (n = 140)
Distribution of CD4 Count
Presentation prepared by INSP, 30 June 2003
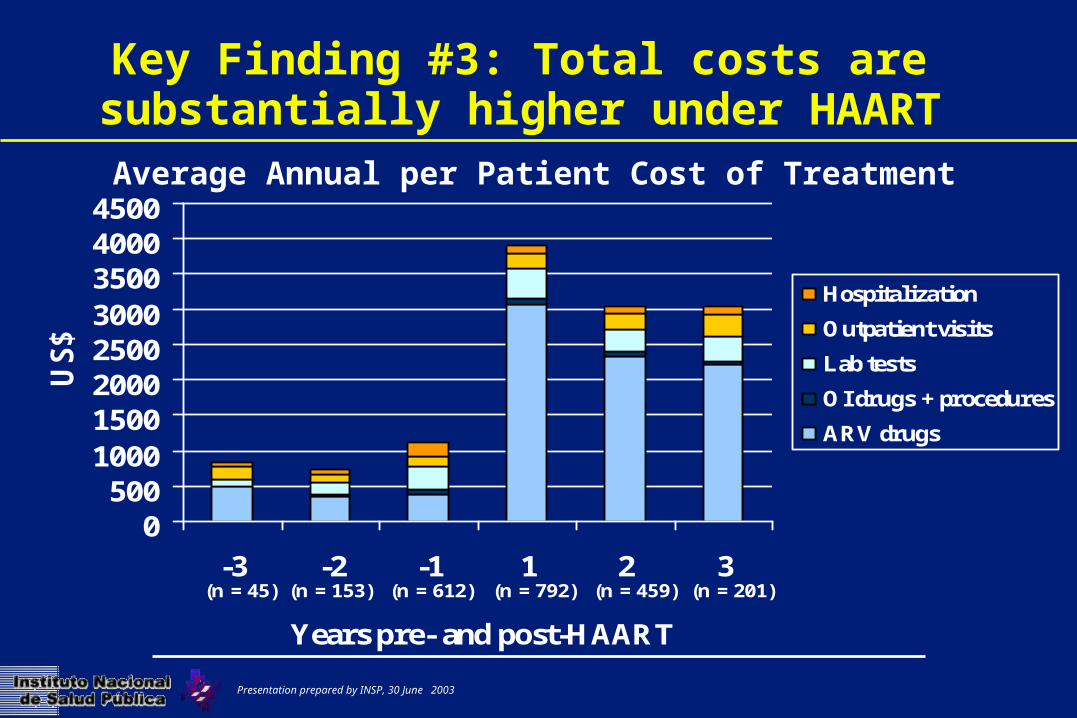
Key Finding #3: Total costs are substantially higher under HAART
0500
10001500200025003000350040004500
-3 -2 -1 1 2 3
Years pre- and post-HAART
US$
HospitalizationOutpatient visitsLab testsOI drugs + proceduresARV drugs
(n = 45) (n = 153) (n = 612) (n = 792) (n = 459) (n = 201)
Average Annual per Patient Cost of Treatment

Presentation prepared by INSP, 30 June 2003
Key Finding #4: Lab tests and Outpatient visits are the largest contributors to treatment costs,
excluding ARVs
0100200300400500600700800900
-3 -2 -1 1 2 3
Years pre- and post-HAART
US$
HospitalizationOutpatient visitsOI drug + proceduresLab tests
(n = 45) (n = 153) (n = 612) (n = 792) (n = 459) (n = 201)
Average Annual per Patient Cost of Treatment, Excl. ARVs

Presentation prepared by INSP, 30 June 2003
Key Finding #5: Treatment costs are higher for patients in advanced stages of illness
CD4 RangeOutpatient
visitsHospital
daysLab tests
OI drugs+ procedures
Total
0-199 (n = 1016)
190 104 759 91 1144
200-349(n = 484)
205 36 603 30 874
350-499(n = 270)
279 23 566 21 888
>500(n = 306)
271 8 496 61 836
Avg Annual per Patient Cost of Treatment Excl. ARVs, by CD4 count

Presentation prepared by INSP, 30 June 2003
Summary
Our findings are consistent with studies done in other countries– ARV comprises >75% of total treatment costs– Outpatient and monitoring costs increase as patients start
triple therapy Unlike Sub-Saharan African countries, hospitalization is not a big
factor in Mexico Costs associated with late initiation of treatment and during last
year of life

Presentation prepared by INSP, 30 June 2003
Policy Recommendations I
Governments should be realistic about resource requirements of starting and scaling-up ARV treatment– Lab capacity– Human resource training
Countries should be prepared for the shift in care and treatment patterns of patients on HAART especially from inpatient to outpatient
Clinicians should clearly understand when to initiate and how to monitor patients on therapy
Presentation prepared by INSP, 30 June 2003
Policy Recommendations II
Estimating total cost of ARV treatment can significantly help countries plan for scaling-up– Negotiating drug prices
Medium to long-term prospective is needed for a full evaluation of program costs
Presentation prepared by INSP, 30 June 2003