collaborative ednap exercise on the irisplex system for
TRANSCRIPT

u n i ve r s i t y o f co pe n h ag e n
Collaborative EDNAP exercise on the IrisPlex system for DNA-based prediction ofhuman eye colour
Chaitanya, L; Andersen, Jeppe Dyrberg; Morling, Niels; Kayser, Manfred
Published in:Forensic Science International: Genetics
DOI:10.1016/j.fsigen.2014.04.006
Publication date:2014
Citation for published version (APA):Chaitanya, L., Andersen, J. D., Morling, N., & Kayser, M. (Ed.) (2014). Collaborative EDNAP exercise on theIrisPlex system for DNA-based prediction of human eye colour. Forensic Science International: Genetics, 11,241-251. https://doi.org/10.1016/j.fsigen.2014.04.006
Download date: 19. Feb. 2022
Forensic Science International: Genetics 11 (2014) 241–251
Collaborative EDNAP exercise on the IrisPlex system for DNA-basedprediction of human eye colour
Lakshmi Chaitanya a,1, Susan Walsh a,1,2, Jeppe Dyrberg Andersen b, Ricky Ansell c,Kaye Ballantyne d, David Ballard e, Regine Banemann f, Christiane Maria Bauer g,Ana Margarida Bento h, Francesca Brisighelli i, Tomas Capal j, Lindy Clarisse k,Theresa E. Gross l, Cordula Haas m, Per Hoff-Olsen n, Clemence Hollard o,Christine Keyser o, Kevin M. Kiesler p, Priscila Kohler n, Tomasz Kupiec q,Adrian Linacre r, Anglika Minawi f, Niels Morling b, Helena Nilsson s,Lina Noren c, Renee Ottens r, Jukka U. Palo t, Walther Parson g,Vincenzo L. Pascali i, Chris Phillips u, Maria Joao Porto h,Antti Sajantila t,v, Peter M. Schneider l, Titia Sijen k, Jens Sochtig u,Denise Syndercombe-Court e, Andreas Tillmar s, Martina Turanska w,Peter M. Vallone p, Lıvia Zatkalıkova w, Anastassiya Zidkova x,y,Wojciech Branicki q,z, Manfred Kayser a,*a Department of Forensic Molecular Biology, Erasmus MC University Medical Centre Rotterdam, Rotterdam, The Netherlandsb Section of Forensic Genetics, Department of Forensic Medicine, Faculty of Health Sciences, University of Copenhagen, Copenhagen, Denmarkc Swedish National Laboratory of Forensic Science (SKL), Linkoping, Swedend Forensic Services Department, Victoria Police, Macleod, Victoria, Australiae Department of Forensic and Analytical Science, School of Biomedical Sciences, King’s College London, United Kingdomf Kriminaltechnik, Bundeskriminalamt, Wiesbaden, Germanyg Institute of Legal Medicine, Innsbruck Medical University, Innsbruck, Austriah Servico de Genetica e Biologia Forense, Delegacao do Centro, Instituto Nacional de Medicina Legal, Coimbra, Portugali Forensic Genetics Laboratory, Institute of Legal Medicine, Universita Cattolica del Sacro Cuore, Rome, Italyj Department of Forensic Genetics, Institute of Criminalistics, Prague, Czech Republick Department of Human Biological Traces, Netherlands Forensic Institute, The Hague, The Netherlandsl Institute of Legal Medicine, Faculty of Medicine, University of Cologne, Cologne, Germanym Institute of Legal Medicine, University of Zurich, Zurich, Switzerlandn Department of Forensic Biology, Norwegian Institute of Public Health, Oslo, Norwayo Laboratoire d’Anthropologie Moleculaire, Universite de Strasbourg, Institut de Medecine Legale, Strasbourg, Francep Material Measurement Laboratory, National Institute of Standards and Technology, Gaithersburg, MD, USAq Section of Forensic Genetics, Institute of Forensic Research, Krakow, Polandr School of Biological Sciences, Flinders University, Adelaide, South Australia, Australias Department of Forensic Genetics and Forensic Toxicology, National Board of Forensic Medicine, Linkoping, Swedent Department of Forensic Medicine, Hjelt Institute, University of Helsinki, Helsinki, Finlandu Forensic Genetics Unit, Institute of Legal Medicine, University of Santiago de Compostela, Santiago de Compostela, Spainv Institute of Applied Genetics, Department of Forensic and Investigative Genetics, University of North Texas Health Science Center, Fort Worth, TX, USAw Institute of Forensic Science, Ministry of the Interior, Department of Biology and DNA Analysis, Slovenska Lupca, Slovakiax Institute of Biology and Medical Genetics, First Faculty of Medicine, Charles University in Prague and General University Hospital in Prague, Prague,
Czech Republicy Institute of Forensic Medicine and Toxicology, First Faculty of Medicine, Charles University in Prague, Prague, Czech Republicz Department of Genetics and Evolution, Institute of Zoology, Jagiellonian University, Krakow, Poland
Contents lists available at ScienceDirect
Forensic Science International: Genetics
jou r nal h o mep ag e: w ww .e lsev ier . co m / loc ate / fs ig
* Corresponding author. Tel.: +31 10 7038073; fax: +31 10 7044575.
E-mail address: [email protected] (M. Kayser).1 These authors contributed equally to this work.2 Current affiliation: Yale Molecular Anthropology Laboratory, Department of Anthropology, Yale University, 10 Sachem Street, New Haven, CT 06511, USA.
http://dx.doi.org/10.1016/j.fsigen.2014.04.006
1872-4973/� 2014 Elsevier Ireland Ltd. All rights reserved.
L. Chaitanya et al. / Forensic Science International: Genetics 11 (2014) 241–251242
A R T I C L E I N F O
Article history:
Received 27 December 2013
Received in revised form 24 March 2014
Accepted 11 April 2014
Keywords:
EDNAP
ISFG
IrisPlex
Eye colour prediction
Forensic DNA phenotyping
FDP
A B S T R A C T
The IrisPlex system is a DNA-based test system for the prediction of human eye colour from biological
samples and consists of a single forensically validated multiplex genotyping assay together with a
statistical prediction model that is based on genotypes and phenotypes from thousands of individuals.
IrisPlex predicts blue and brown human eye colour with, on average, >94% precision accuracy using six
of the currently most eye colour informative single nucleotide polymorphisms (HERC2 rs12913832,
OCA2 rs1800407, SLC24A4 rs12896399, SLC45A2 (MATP) rs16891982, TYR rs1393350, and IRF4
rs12203592) according to a previous study, while the accuracy in predicting non-blue and non-brown
eye colours is considerably lower. In an effort to vigorously assess the IrisPlex system at the
international level, testing was performed by 21 laboratories in the context of a collaborative exercise
divided into three tasks and organised by the European DNA Profiling (EDNAP) Group of the
International Society of Forensic Genetics (ISFG). Task 1 involved the assessment of 10 blood and saliva
samples provided on FTA cards by the organising laboratory together with eye colour phenotypes;
99.4% of the genotypes were correctly reported and 99% of the eye colour phenotypes were correctly
predicted. Task 2 involved the assessment of 5 DNA samples extracted by the host laboratory from
simulated casework samples, artificially degraded, and provided to the participants in varying DNA
concentrations. For this task, 98.7% of the genotypes were correctly determined and 96.2% of eye colour
phenotypes were correctly inferred. For Tasks 1 and 2 together, 99.2% (1875) of the 1890 genotypes
were correctly generated and of the 15 (0.8%) incorrect genotype calls, only 2 (0.1%) resulted in
incorrect eye colour phenotypes. The voluntary Task 3 involved participants choosing their own test
subjects for IrisPlex genotyping and eye colour phenotype inference, while eye photographs were
provided to the organising laboratory and judged; 96% of the eye colour phenotypes were inferred
correctly across 100 samples and 19 laboratories. The high success rates in genotyping and eye colour
phenotyping clearly demonstrate the reproducibility and the robustness of the IrisPlex assay as well as
the accuracy of the IrisPlex model to predict blue and brown eye colour from DNA. Additionally, this
study demonstrates the ease with which the IrisPlex system is implementable and applicable across
forensic laboratories around the world with varying pre-existing experiences.
� 2014 Elsevier Ireland Ltd. All rights reserved.
1. Introduction
The field of forensic genetics is making great strides with therapid scientific and technological evolution in obtaining newknowledge and creating innovative tools for solving crimes moreand more effectively. Forensic DNA Phenotyping (FDP), a nascentadvancement in this field, is one example of recent innovativedevelopments in forensic genetics and involves the prediction of anindividual’s externally visible characteristics (EVCs) using biologi-cal samples obtained at a crime scene or from an anonymous body(parts) that may belong to a missing person [1–4]. ConventionalDNA identification involves the comparison of DNA profilesderived from short tandem repeat (STR) marker genotypesobtained from evidence and reference samples, which is usefulin cases when the sample donor is known from their DNA profile. Incertain circumstances, sample donors may not be identified, i.e. amatch (or familial match) of the DNA profiles with known suspectssuch as those in criminal offender DNA (profile) databases or withante-mortem samples in cases of missing persons is not successful,or when DNA profile comparisons with putative relatives ofmissing persons does not reveal the degree of similaritiesindicating biological relationship. In these situations, FDP can beused to help investigative authorities focus their search forunknown suspects or missing persons towards individuals withparticular DNA-predicted externally visible phenotypes. The DNA-based prediction of EVCs can thus aid investigations by police andother authorities by reducing the number of possible suspects orother individuals if conventional STR typing of the evidence fails toproduce identification [1,2]. Furthermore, reconstructing appear-ance information from biological samples such as bones or teeth orother remains of deceased individuals is relevant in anthropologi-cal research disciplines including those relying on ancient DNAanalysis [1,2,5].
Several model-based approaches, amongst others [4,6], havebeen developed for predicting a particular phenotype from DNAmost notably human eye (iris) colour [7]; the IrisPlex system is onesuch tool [8]. IrisPlex can accurately predict blue and brown eyecolour with a precision of >94%, according to a previous study [9],using six of the most informative eye colour markers: rs12913832(HERC2), rs1800407 (OCA2), rs12896399 (SLC24A4), rs16891982(SLC45A2 (MATP)), rs1393350 (TYR) and rs12203592 (IRF4) in asingle genotyping assay and a prediction model based onthousands of individuals for which IrisPlex genotype and eyecolour phenotype data are available [7,8,10]. The 94% accuracy isbased on using a threshold of p > 0.7, however it is possible to useIrisPlex prediction with a lower p > 0.5 threshold. The assessmentof precision accuracy is based on a broad European dataset of>3800 individuals using IrisPlex can be found in Table 3 of thatpublication [9]. The IrisPlex assay represents the first FDP systemthat successfully underwent developmental validation using theScientific Working Group on DNA Analysis Methods (SWGDAM)guidelines for use in forensic casework [10]. The IrisPlex predictionmodel, first established on thousands of Dutch Europeans, has beenevaluated in several populations within and outside Europe andwas shown to perform reliably, independent of the bio-geographicorigin of the individual tested [9,11].
In an international effort to test the reliability and consistencyof the IrisPlex system for eye colour prediction through an interlaboratory exercise, the European DNA Profiling (EDNAP) Group, aworking group of the International Society for Forensic Genetics(ISFG), carried out a collaborative study led by the Department ofForensic Molecular Biology of the Erasmus University MedicalCenter Rotterdam (Netherlands), who initially developed andvalidated the IrisPlex system [8–10] and for this reason werechosen to conduct this further assessment on the IrisPlex toolalone. Of the 21 participating laboratories, 18 were from Europe,

L. Chaitanya et al. / Forensic Science International: Genetics 11 (2014) 241–251 243
2 were from Australia and 1 was from the U.S.A. The prime aim ofthis exercise was to implement the method and assess theperformance of the system across different forensic laboratorieswith varying levels of experience, from complete novices with noSNP typing experience to participants with SNaPshot experienceand those with specific IrisPlex experience.
Notably, some authors previously raised issues about markercontent and model outcomes of the IrisPlex system [12–15]. Thepresent collaborate EDNAP exercise, however, represents a rathertechnical exercise to test the performance of the IrisPlex systemacross laboratories with varying levels of pre-existing experience.Therefore, issues about marker and model choice for predicting eyecolour from DNA may be addressed in more dedicated futurestudies. Here, we present the results of this collaborative EDNAPexercise, placing emphasis on the reliability and consistency inusing the IrisPlex system for blue and brown eye colour predictionfrom DNA.
2. Materials and methods
2.1. Samples and materials provided to the participating laboratories
The organising laboratory (Department of Forensic MolecularBiology, Erasmus MC University Medical Center Rotterdam,Netherlands) divided the entire exercise into three different tasks.All participants were provided with a detailed written laboratoryprotocol [8] as well as the eye colour prediction model that is aninteractive excel spread-sheet as published earlier [10]. Further-more, for assay interpretation guidelines, participants were given aprotocol stating a 50 relative fluorescent units (rfu) peak heightthreshold should be used for allele calls using the IrisPlex specificGeneMapper software (Applied Biosystems) Bin and Panel setprovided. For a broader understanding of average peak heights andbalance ratios, participants were asked to refer to the previousdevelopmental validation publication of the IrisPlex system [10]. Inaddition to the samples and the primers provided for each task, allreagents, which include: 1� PCR buffer, 2.7 mM MgCl2, 200 mM ofeach dNTP, 0.5 U AmpliTaq Gold Polymerase, SNaPshotTM Multi-plex chemistry for the single base extension (SBE) reactions(Applied Biosystems, Foster City, CA), Exonuclease Shrimp AlkalinePhosphatase (ExoSAP-IT), and Shrimp Alkaline Phosphatase (SAP)(USB Corporation, Cleveland, OH), required for running the IrisPlexsystem were shipped on dry ice to each of the 21 participatinglaboratories. The laboratories were asked to use their own internalsizing standard (LIZ 120) and formamide for the capillaryelectrophoresis run.
Table 1DNA extraction and quantification protocols used by the 21 laboratories for both Tasks
Lab ID Ext raction Proto col 1 2 EZ1 DN A Inv estigat or Kit on an EZ1 Advanced XL ( Qiagen) Quan
3 4 Ta sk 1 : EZ1 advanced ( Qiagen); Ta sk 3 :DN A B lood Mini Kit ( Qiagen) ABI pr ism® 7900 ( Life
5 Chelex + Qiaqu ick 6 QIAam p® DN A Mini ( Qiagen, Hil den, Germa ny) qPCR using the 7900 HT Fast R 7 Chelex 8 5% solution of B T C helex 100 r esin (B io-R ad) Quantifil er® Hum 9 QIAmp DN A b lood Mini kit from Qiagen Quantifil er®
10 QIAmp DN A b lood Mini kit from Qiagen 11
12 QIAamp mini columns ( Qiagen) real-time 13 EZ1 robot ( Qiagen) 14 Qiagen EZ1 Advanced XL extract ion r obot with the EZ1 DN A Inv estigat or Kit Quanti
15 QiAmp DN A Mini kit ( Qiagen) 16 QiAmp DN A Mini kit ( Qiagen) 17 Qiagen EZ1 Inv estigat or Handboo k Ther
18 Appli ed B yosistem s Prepfil er Forensic DN A Extract ion kit Ta 19 Chelex Q
20 Pheno l–C hloroform Qua
21 Qiagen M48 r obotic stat ion and MagAtt ract DN A Mini M48 Kit
Due to an ExoSAP-ITTM degradation issue noted during the earlyphase of the exercise, which subsequently was acknowledged bythe producing company as a bad batch of enzyme, aliquots of anewly delivered and tested ExoSAP-ITTM were shipped again to therequesting laboratories, while the others opted to use their in-house standard cleaning protocols. As this was a clean-upprocedure, it did not impede on the testing of the IrisPlex assayoverall. Purified products were run by the laboratories using theirin-house Genetic Analysers (for type, see Table 1) and analysedwith the previously published eye colour prediction model [10]provided by the organising laboratory for predicting human eyecolour from IrisPlex genotypes.
As a disclaimer for the choice of samples used in thisassessment, please note that it is well established and documented[7,9,16,17], that the IrisPlex system through its use of six eye colourassociated SNPs performs very well in predicting blue and browneye colour with Area Under the receiving operator Curve (AUC)values >0.9; however its use for predicting intermediate eye colour(current AUC of �0.7) is not at an optimum level yet. This is due tothe current lack of knowledge on DNA predictors for these non-blue, non-brown eye colours i.e. green eye colour, individuals withheterochromia etc. which is not only a limitation of the IrisPlex butof all currently available DNA test systems for eye colour [4,6]. DNAvariants with similarly high prediction effects on non-blue/browneye colours as the IrisPlex SNPs have on blue and brown eye colourhave yet to be identified. Therefore, the IrisPlex system waspreviously promoted for the prediction of blue and brown eyecolours and thus the organising laboratory opted to test variationsin blue and brown eye colour alone for Tasks 1 and 2 to evaluate thecurrent IrisPlex system assay and prediction performance on thesecategories. Task 3 however incorporates all three categories as thistask was based on samples provided by the participatinglaboratories who were not asked to focus on blue and browneye colour alone when selecting their Task 3 volunteers.
Tasks 1 and 2 contain samples from individuals of European(80% per task) and non-European bio-geographic origin (20% pertask) including one admixed individual in Task 1. The individualsused in Task 3, including information about their bio-geographicbackground, were at the discretion of the participating laboratoriesand were unknown to the organising lab.
2.2. Task 1 – IrisPlex eye colour prediction from biological samples
with eye colour knowledge
The organising laboratory provided all participating laborato-ries with five blood samples (labelled Ind1–Ind5) and five saliva
1 and 2. Grey boxes indicate no data received from the participating laboratory.
Quantificat ion Proto col Polymer Genetic Analyzer
POP 4 3130 xl
tifil er® Duo DN A Quantificat ion Kit ( Life Techno logies) POP 6 310 0
POP 4 313 0
Techno logies-LT) u sing Quantifil er® Huma n DN A Quantificat ion Kit (LT). POP 4 3130 xl
Task 1 : Qub it and Ta sk 2 : R T-PCR Quantifil er® POP 4 3130 xl
eal-time PCR System ( Appli ed B iosystem s, Darmsta dt, Germa ny) and Alu Primers POP 4 3500 xl
Quantifil er® Duo POP 7 3130 xl
an DN A Quantificat ion Kit ( Life Techno logies) on AB 7900 R T-PRC POP 4 313 0
Huma n kit on Appli ed B iosystem s 7500 Rea l-Time PCR Syste m POP 7 3500 xl
Nanodr op POP 7 3500 xl
Quantifil er® Huma n POP 4 3130 xl
quantitat ive PCR ass ay u sing ALU r epeat s from Nicklas et el. POP 7 3130 xl
Quantifil er® POP 7 3130 xl
fil er® Huma n DN A Quantificat ion Kit ( Life Techno logies) POP 4 3130 xl
Nanodr op POP 4 3130 xl
POP 7 350 0
mo Scientific NanoDrop 2000 /2000 c spect rophotomete r POP 4 313 0
sk 1 and Ta sk 3 a 1% agarose g el; Ta sk 2 - a R T PCR POP 4 313 0
uantifil er® DUO in an 7500 Rea l-Time PCR Syste m POP 7 313 0
ntifil er® Huma n DN A Quantificat ion Kit and AB 7300. POP 4 313 0
Quantifil er kit® and ABI 7500 POP 7 3130 xl

L. Chaitanya et al. / Forensic Science International: Genetics 11 (2014) 241–251244
samples (labelled Ind6–Ind10) on FTA cards of 10 individuals withblue (N = 5) or brown (N = 5) eye colour. To produce these samples,fresh venous blood and saliva samples were collected from tendifferent individuals and 100 mL of each of the samples werepipetted on to the FTA cards. A digital eye image from each of these10 individuals who donated blood or saliva was also provided tothe participants. All the laboratories were instructed to use theirown in-house DNA extraction and quantification protocols. Allparticipating laboratories were asked to generate the IrisPlexgenotype profile from each of the 10 samples and using theprovided IrisPlex prediction model, to conclude the eye colourprediction of the 10 donor individuals by noting the probabilityand precision accuracy per each sample and individual using theguidelines implemented in a previous publication [9] as providedto the participants. An example report was also provided to eachlaboratory to ease the fill-out for return. As the participants wereprovided with eye pictures, they already knew the eye colour of thestudy individuals of Task 1 before analyses. However, theconclusion of the eye colour phenotypes had to be based on thegenotypes determined by each individual laboratory consideringthe probability and precision accuracy guidelines provided by theorganising laboratory. The term ‘precision accuracy’ relates to theprevious publication [9], which undertook a study on the finalprediction called by the IrisPlex model in terms of probabilityvalues on over 3800 European individuals. It assesses the highestprobability value (which is defined as the eye colour of theindividual) and how correct the eye colour prediction was atthresholds that increase in increments of 0.05p; from no thresholdto p > 0.95 [9].
2.3. Task 2 – IrisPlex eye colour prediction from DNA of simulated
casework samples without eye colour knowledge
The laboratories were provided with five DNA samplesextracted from simulated casework samples (labelled CW1–CW5) from 5 individuals with blue (N = 2) or brown (N = 3) eyecolour. DNA samples were extracted by the organising laboratorywith the QIAamp DNA mini kit (Qiagen, Hagen, Germany). Thefollowing biological materials were used for DNA extractions: 2buccal swabs (CW1 and CW2) – both samples subjected to UVradiation using the Bio-Link (Vilber Lourmat) for 1 min at astrength of 50 J/cm2 before DNA extraction; saliva on glass slide(CW3) stored at room temperature for 1 week before DNAextraction, whole blood on glass slide (CW4) stored at roomtemperature for 1 week before DNA extractions, and semen DNAextracted from a frozen donated sample (CW5). DNA concentra-tions were measured using the nanodrop system and 3 mL of thefollowing solutions were provided: CW1: 0.5 ng/mL, CW2: 0.1 ng/mL, CW3: 0.25 ng/mL, CW4: 2 ng/mL, and CW5: 50 ng/mL (seeTable 2 for overview). The samples CW1–CW4 were freshlyextracted, quantified and run using the IrisPlex system prior toDNA degradation, thereby serving as a control to their degradedcounterparts. In contrast to Task 1, in Task 2 the laboratories werenot provided with any eye colour phenotype information of thesample donors. Participants were also not provided with any othersample information such as DNA concentration or treatment prior
Table 2Details of the simulated casework samples provided to the participating
laboratories for the Task 2.
Sample # Sample type Treatment Concentration (ng/mL)
CW1 Buccal Swab UV for 1 min 0.5
CW2 Buccal Swab UV for 1 min 0.1
CW3 Saliva on Slide RT for 1 week 0.25
CW4 Blood on slide RT for 1 week 2
CW5 Semen – 50
to DNA extractions of the DNA extracts they received for Task 2.They were asked to generate the IrisPlex genotype profile for eachindividual and report back the obtained eye colour probabilitiesand accuracies using the model and materials provided, and tofinally conclude the most likely eye colour category per individual.An example report was also provided.
2.4. Task 3 – participant-driven IrisPlex eye colour prediction
This part of the study was optional. Each participatinglaboratory was instructed to collect and genotype samples fromfive different individuals of any eye colour. Selection of volunteersand biological materials was at the discretion of the participants.An important caveat in this task is that IrisPlex cannot guarantee ahigh prediction accuracy of the non-blue and non-brown eyecolours; however, in contrast to Tasks 1 and 2 no eye colourphenotype restrictions were imposed on the participants in theirchoice of volunteers for Task 3. The laboratories were asked toreport the DNA concentration, IrisPlex genotypes, eye colourprobability outcomes and accuracy percentages, and a digital high-resolution eye image of the genotyped individuals. The organisinglaboratory instructed that the iris photo should be taken in naturallight conditions (no fluorescent bulb light) with and without flashlens using a digital camera focusing on eyes only (no full portrait).
3. Results and discussion
3.1. Sample extractions and quantifications by each participating
laboratory
As the DNA extraction and quantification method can influencegenotyping outcomes due to the quality and quantity of DNAextracted and consequently input into a downstream reaction, itcan thus influence phenotype inference from the genotypesproduced in FDP systems. Therefore we included extraction andquantification monitoring in this exercise. As part of Task 1, thehost laboratory provided the participating laboratories withbiological samples (blood and saliva samples on FTA cards) fromwhich the participants extracted and quantified DNA using theirmethods of choice. To note, the affiliated laboratory number in theauthor list does not represent the laboratory number describedthroughout the paper. Protocols used for DNA extraction andquantification were different and are listed in Table 1. As evident,the different extraction and quantification methods used by theparticipating laboratories provided varying results, as summarisedin a box plot diagram (Fig. 1), even though the same volume ofbiological sample was provided to each of the participants on FTAcards. Labs #2, 4, 13, 14 and 17 used the Qiagen EZ1 investigator kitfor extraction and reported on average higher quantification valuesas compared to Labs #6, 9, 10, 12 and 15 that used the QiagenQIAamp DNA mini kit extraction protocol. Lab #20 applied aPhenol–Chloroform extraction approach, which yielded on averagehigher quantification values compared to all the other methodsused. Lab #18 used the Prepfiler Forensic DNA extraction kit andobtained on average higher final DNA amounts than all othermethods, except Phenol–Chloroform. Labs #5, 7, 8, and 19, whichused the Chelex extraction protocol, reported comparatively lowerquantification values than all other methods used in this exercise.Worthy to note, this figure assumes that all laboratory input DNAvolumes were similar (i.e. the recommended 1 mL). The preciseextraction volumes used by all labs were not available to theorganising laboratory. This figure merely represents the differingextraction methods yielding varying final DNA concentrations,however, it is expected that the participants followed allrecommendations provided by the organising lab which specifi-cally states a 1 mL volume with at least a concentration of 32 pg

Fig. 1. Box-plot (scaled to 3 ng/mL) showing the variation in obtained DNA concentrations using different methods for extraction and quantification between the 21
laboratories for the 15 samples used in Task 1 and 2. Note that for Task 1 (samples Ind1–Ind10), biological samples were provided to the participants so that DNA extraction
and DNA quantifications were carried out by the participants on the same volumes of biological materials provided on FTA cards, while for Task 2 (samples CW1–CW5)
participants were provided with already extracted DNA samples that varied in treatment and DNA concentrations. Medians are represented by the horizontal lines and the
boxes depict the 25–75% quartiles. The whiskers represent the minimum and the maximum values. Outliers are marked with the laboratory number where they were
reported.
L. Chaitanya et al. / Forensic Science International: Genetics 11 (2014) 241–251 245
DNA input for IrisPlex profiling. The DNA samples provided forTask 2 were previously extracted by the host laboratory using theQIAamp DNA mini kit (Qiagen). The participating laboratories wererequested to measure DNA concentrations using their method ofchoice and to report back the values. Because different quantifica-tion methods were used, the obtained concentration estimatesdiffered (Fig. 1 and Supplementary Table 1), similar to Task 1, eventhough equal aliquots of the very same DNA solutions per eachsample were provided to each of the participants. As evident,sample CW2 was recorded as the most variable (0.01–2.61 ng/mL),which contradicts recorded measurements by the organisinglaboratory of 100 pg (Fig. 1).
Supplementary material related to this article can be found, inthe online version, at doi:10.1016/j.fsigen.2014.04.006.
Overall, the recorded DNA quantification data indicate that allsamples shipped, both the biological samples on FTA cards of Task1 and the extracted DNA samples of Task 2, and remained ratherstable during transportation and short-term storage at theparticipating laboratories. For the impact of the varying amountsof DNA obtained by the participants in Task 1 and the varying DNAconcentration measures obtained in Task 2 on genotype andphenotype accuracy, see the specific chapters on Tasks 1 and 2below. From the DNA quantification data reported by theparticipating laboratories for the samples used in Task 3(Supplementary Table 1) it is evident that all the samplesgenotyped for this portion of the exercise were of reasonable
quantity. When conducting genotyping analyses and calling thepeaks, the 50 rfu fluorescence threshold was set for calling allelesfor a locus in all tasks and samples.
3.2. Task 1 – IrisPlex eye colour prediction from biological samples
with eye colour knowledge
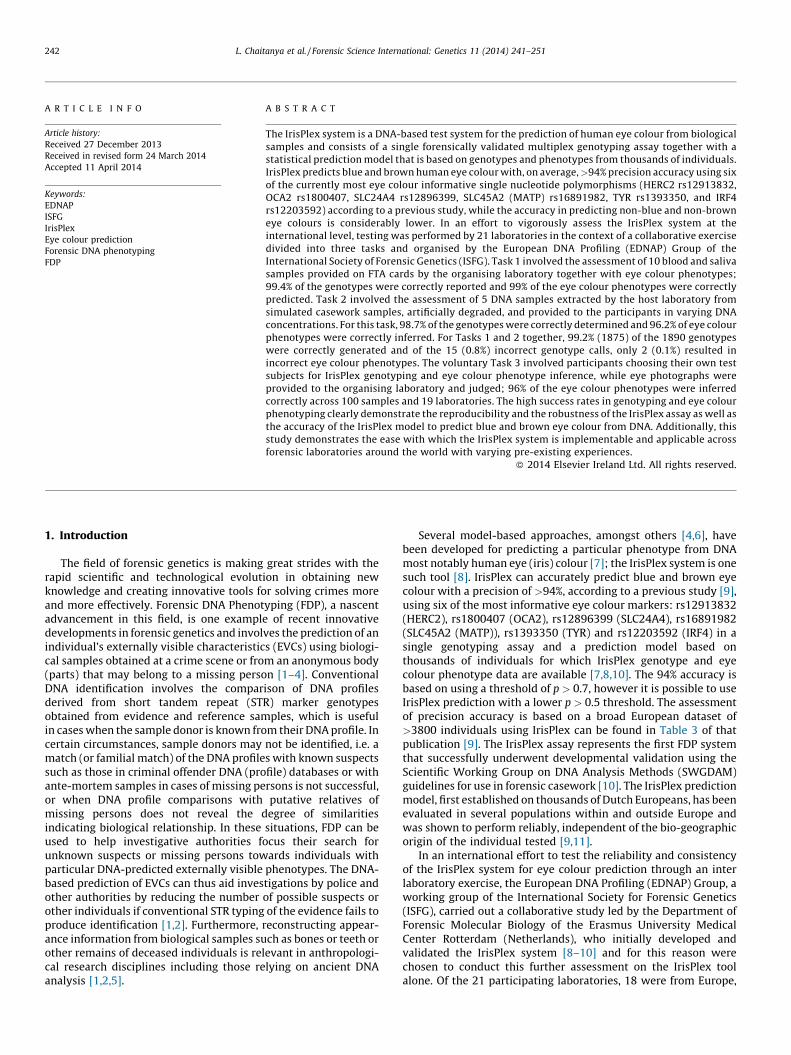
All participating laboratories reported the predicted eye colourand their probabilities in the format as requested by the organisinglaboratory. Fig. 2 depicts the accurate genotype and eye colourphenotype calls for all the ten samples as obtained by the 21participating laboratories. Supplementary Table 2 lists thegenotypes of the ten individuals with their respective eye colourprobability and accuracy. Fig. 3 shows the eye colour images of the10 individuals used in this task.
Supplementary material related to this article can be found, inthe online version, at doi:10.1016/j.fsigen.2014.04.006.
Twenty of the 21 laboratories (95%) predicted the eye colour ofall 10 individuals included in Task 1 correctly from IrisPlex (Fig. 2;green bars). Overall, 208 (99%) of the 210 samples analysed in thistask by all the 21 laboratories were reported with the correct eyecolour phenotype prediction. An overview of the samples withincorrect genotypes that were discordant with the organisinglaboratory is provided in Table 3. Only one laboratory (Lab #3)faced difficulties in concluding the correct eye colour phenotypefor two samples (Individual 1 and 10). The phenotype for both
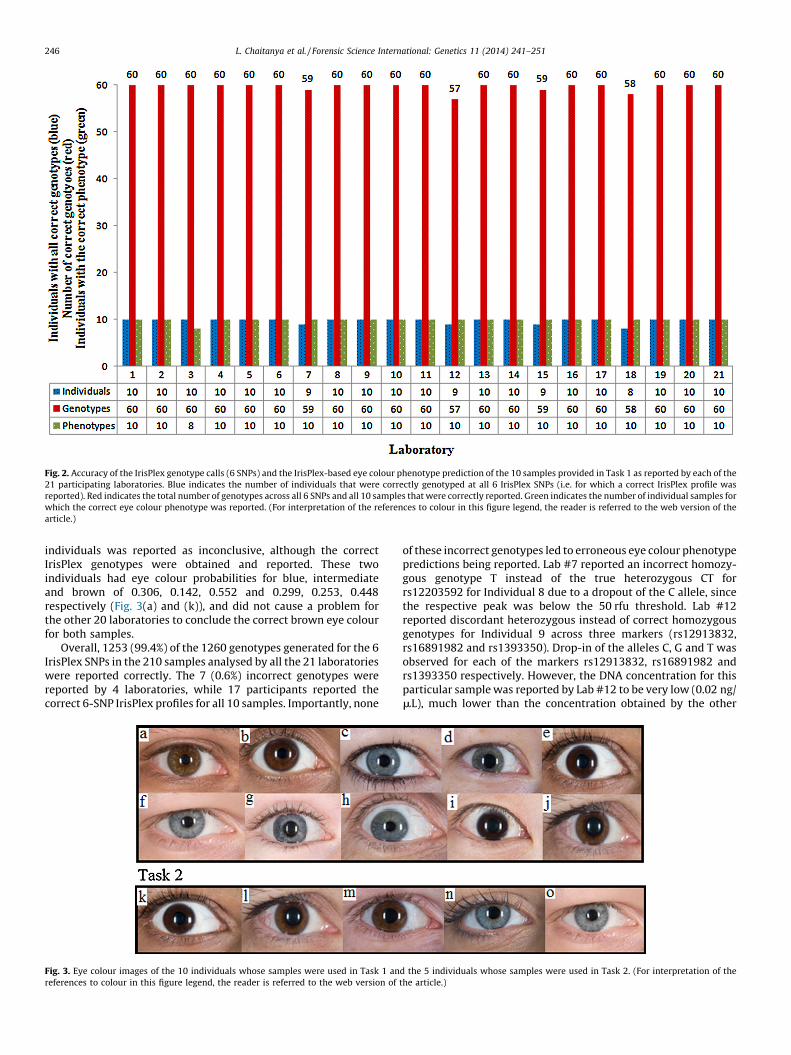
Fig. 2. Accuracy of the IrisPlex genotype calls (6 SNPs) and the IrisPlex-based eye colour phenotype prediction of the 10 samples provided in Task 1 as reported by each of the
21 participating laboratories. Blue indicates the number of individuals that were correctly genotyped at all 6 IrisPlex SNPs (i.e. for which a correct IrisPlex profile was
reported). Red indicates the total number of genotypes across all 6 SNPs and all 10 samples that were correctly reported. Green indicates the number of individual samples for
which the correct eye colour phenotype was reported. (For interpretation of the references to colour in this figure legend, the reader is referred to the web version of the
article.)
L. Chaitanya et al. / Forensic Science International: Genetics 11 (2014) 241–251246
individuals was reported as inconclusive, although the correctIrisPlex genotypes were obtained and reported. These twoindividuals had eye colour probabilities for blue, intermediateand brown of 0.306, 0.142, 0.552 and 0.299, 0.253, 0.448respectively (Fig. 3(a) and (k)), and did not cause a problem forthe other 20 laboratories to conclude the correct brown eye colourfor both samples.
Overall, 1253 (99.4%) of the 1260 genotypes generated for the 6IrisPlex SNPs in the 210 samples analysed by all the 21 laboratorieswere reported correctly. The 7 (0.6%) incorrect genotypes werereported by 4 laboratories, while 17 participants reported thecorrect 6-SNP IrisPlex profiles for all 10 samples. Importantly, none
Fig. 3. Eye colour images of the 10 individuals whose samples were used in Task 1 an
references to colour in this figure legend, the reader is referred to the web version of
of these incorrect genotypes led to erroneous eye colour phenotypepredictions being reported. Lab #7 reported an incorrect homozy-gous genotype T instead of the true heterozygous CT forrs12203592 for Individual 8 due to a dropout of the C allele, sincethe respective peak was below the 50 rfu threshold. Lab #12reported discordant heterozygous instead of correct homozygousgenotypes for Individual 9 across three markers (rs12913832,rs16891982 and rs1393350). Drop-in of the alleles C, G and T wasobserved for each of the markers rs12913832, rs16891982 andrs1393350 respectively. However, the DNA concentration for thisparticular sample was reported by Lab #12 to be very low (0.02 ng/mL), much lower than the concentration obtained by the other
d the 5 individuals whose samples were used in Task 2. (For interpretation of the
the article.)
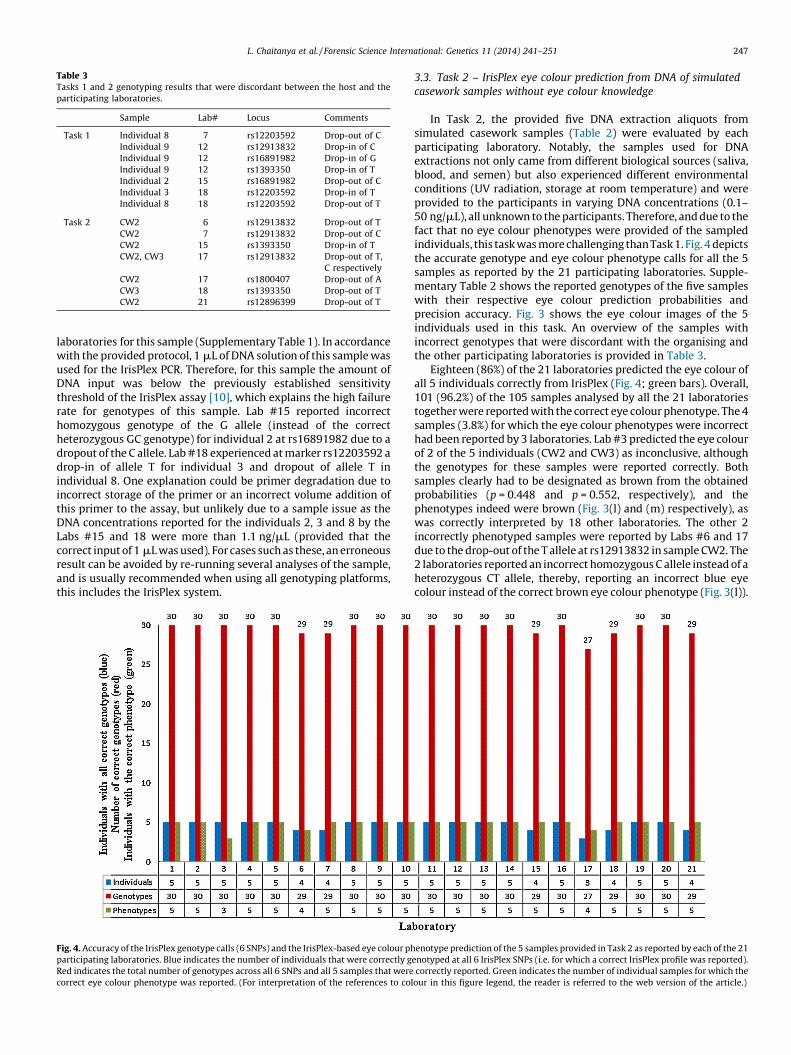
Table 3Tasks 1 and 2 genotyping results that were discordant between the host and the
participating laboratories.
Sample Lab# Locus Comments
Task 1 Individual 8 7 rs12203592 Drop-out of C
Individual 9 12 rs12913832 Drop-in of C
Individual 9 12 rs16891982 Drop-in of G
Individual 9 12 rs1393350 Drop-in of T
Individual 2 15 rs16891982 Drop-out of C
Individual 3 18 rs12203592 Drop-in of T
Individual 8 18 rs12203592 Drop-out of T
Task 2 CW2 6 rs12913832 Drop-out of T
CW2 7 rs12913832 Drop-out of C
CW2 15 rs1393350 Drop-in of T
CW2, CW3 17 rs12913832 Drop-out of T,
C respectively
CW2 17 rs1800407 Drop-out of A
CW3 18 rs1393350 Drop-out of T
CW2 21 rs12896399 Drop-out of T
L. Chaitanya et al. / Forensic Science International: Genetics 11 (2014) 241–251 247
laboratories for this sample (Supplementary Table 1). In accordancewith the provided protocol, 1 mL of DNA solution of this sample wasused for the IrisPlex PCR. Therefore, for this sample the amount ofDNA input was below the previously established sensitivitythreshold of the IrisPlex assay [10], which explains the high failurerate for genotypes of this sample. Lab #15 reported incorrecthomozygous genotype of the G allele (instead of the correctheterozygous GC genotype) for individual 2 at rs16891982 due to adropout of the C allele. Lab #18 experienced at marker rs12203592 adrop-in of allele T for individual 3 and dropout of allele T inindividual 8. One explanation could be primer degradation due toincorrect storage of the primer or an incorrect volume addition ofthis primer to the assay, but unlikely due to a sample issue as theDNA concentrations reported for the individuals 2, 3 and 8 by theLabs #15 and 18 were more than 1.1 ng/mL (provided that thecorrect input of 1 mL was used). For cases such as these, an erroneousresult can be avoided by re-running several analyses of the sample,and is usually recommended when using all genotyping platforms,this includes the IrisPlex system.
Fig. 4. Accuracy of the IrisPlex genotype calls (6 SNPs) and the IrisPlex-based eye colour ph
participating laboratories. Blue indicates the number of individuals that were correctly g
Red indicates the total number of genotypes across all 6 SNPs and all 5 samples that were
correct eye colour phenotype was reported. (For interpretation of the references to col
3.3. Task 2 – IrisPlex eye colour prediction from DNA of simulated
casework samples without eye colour knowledge
In Task 2, the provided five DNA extraction aliquots fromsimulated casework samples (Table 2) were evaluated by eachparticipating laboratory. Notably, the samples used for DNAextractions not only came from different biological sources (saliva,blood, and semen) but also experienced different environmentalconditions (UV radiation, storage at room temperature) and wereprovided to the participants in varying DNA concentrations (0.1–50 ng/mL), all unknown to the participants. Therefore, and due to thefact that no eye colour phenotypes were provided of the sampledindividuals, this task was more challenging than Task 1. Fig. 4 depictsthe accurate genotype and eye colour phenotype calls for all the 5samples as reported by the 21 participating laboratories. Supple-mentary Table 2 shows the reported genotypes of the five sampleswith their respective eye colour prediction probabilities andprecision accuracy. Fig. 3 shows the eye colour images of the 5individuals used in this task. An overview of the samples withincorrect genotypes that were discordant with the organising andthe other participating laboratories is provided in Table 3.
Eighteen (86%) of the 21 laboratories predicted the eye colour ofall 5 individuals correctly from IrisPlex (Fig. 4; green bars). Overall,101 (96.2%) of the 105 samples analysed by all the 21 laboratoriestogether were reported with the correct eye colour phenotype. The 4samples (3.8%) for which the eye colour phenotypes were incorrecthad been reported by 3 laboratories. Lab #3 predicted the eye colourof 2 of the 5 individuals (CW2 and CW3) as inconclusive, althoughthe genotypes for these samples were reported correctly. Bothsamples clearly had to be designated as brown from the obtainedprobabilities (p = 0.448 and p = 0.552, respectively), and thephenotypes indeed were brown (Fig. 3(l) and (m) respectively), aswas correctly interpreted by 18 other laboratories. The other 2incorrectly phenotyped samples were reported by Labs #6 and 17due to the drop-out of the T allele at rs12913832 in sample CW2. The2 laboratories reported an incorrect homozygous C allele instead of aheterozygous CT allele, thereby, reporting an incorrect blue eyecolour instead of the correct brown eye colour phenotype (Fig. 3(l)).
enotype prediction of the 5 samples provided in Task 2 as reported by each of the 21
enotyped at all 6 IrisPlex SNPs (i.e. for which a correct IrisPlex profile was reported).
correctly reported. Green indicates the number of individual samples for which the
our in this figure legend, the reader is referred to the web version of the article.)

L. Chaitanya et al. / Forensic Science International: Genetics 11 (2014) 241–251248
Overall, 622 (98.7%) of the 630 genotypes generated for the 6IrisPlex SNPs in the 105 samples analysed by all laboratoriestogether were correctly reported in Task 2. The 8 (1.3%) incorrectgenotypes were produced in 2 samples (CW2 and CW3) by 6laboratories, while 15 of the 21 laboratories (71.4%) reported thecorrect 6-SNP IrisPlex profile for all 5 samples. In contrast to the 2(25%) genotype errors in sample CW2 by Lab #6 and 17 that causedphenotype errors as mentioned in the previous paragraph, theremaining 6 incorrect genotypes (75%) did not have any impact onthe eye colour phenotype accuracy. At rs12913832, Lab #7reported an incorrect genotype due to a drop-out of the C allelefor sample CW2. A drop-in of the T allele for CW2 and drop-out ofthe T allele for CW3 at rs1393350 resulted in incorrect genotypingby Labs #15 and 18 respectively. Furthermore, incorrect genotypeswere reported by Lab #21 at rs12896399 for sample CW2 due to adrop-out of the T allele. Lab #17 experienced problems in the firsttyping of samples CW1, 2 and 3 and subsequently retyped thesesamples in different DNA dilutions. At rs12913832, drop-out of theT allele for CW2 (as mentioned above); drop-out of the C allele forCW3, and drop-out of the A allele at rs1800407 for CW2 werereported which resulted in erroneous results for this laboratory. Adilution step performed by the participating laboratory, due to amisleading quantification result, of the already low quantitydegraded samples provides a likely explanation for the drop-out ofthe alleles in this set of samples.
Several laboratories (n = 3; Labs #3, 6 and 17) experienceddifficulties with correct phenotyping of the simulated and treatedcasework samples in Task 2 for which no eye colour phenotypeswere provided as opposed to the untreated biological samplesprovided together with eye colour phenotypes in Task 1 (n = 1; Lab#3). Similarly, more laboratories (n = 6; Labs #6, 7, 15, 17, 18 and21) had difficulties in correct genotyping of Task 2 samples inrelation to Task 1 samples (n = 4; Labs #7, 12, 15 and 18). WithinTask 2, the most genotyping and phenotyping difficulties i.e. allelicdrop-outs and drop-ins were reported for 2 particular samples(CW2 and CW3). Sample CW2 was reported with differentincorrect genotypes by 5 of the laboratories (Labs #6, 7, 15, 17and 21) and sample CW3 was reported incorrectly by 2laboratories (Labs #17 and 18) (see Table 3 for overview). SampleCW2 must therefore be noted as being a difficult sample togenotype. From Fig. 1, it is evident that, of the laboratories thatreported quantification data for Task 2, sample CW2 was recordedas the most variable (0.01–2.61 ng/mL), which strongly deviatesfrom the recorded measurements by the organising laboratory of100 pg. Given its unusual quantification range, severe degradationand heterozygosity at 3 (rs12913832, rs1800407 and rs12896399)of the 6 SNPs, increased incidence of allelic drop-out may beexpected in sample CW2 as compared to the homozygous sampleCW1 (which also experienced UV degradation) that caused noproblems for genotyping. This demonstrates, as expected and asalso known for any other genotyping assay, that the combination oflow quality and low quantity template DNA provides challenges forcorrect genotyping including for the IrisPlex assay. However, itshould be emphasised that 244 of the 252 (96.8%) genotypes of themost challenging samples CW2 and CW3 were generated correctlyby 15 of the 21 (71.4%) participating laboratories, whichdemonstrates the reliability of the IrisPlex assay for difficultDNA samples. This also represents the necessity of employingduplicate analysis when genotyping samples of low DNA quantityin final case work applications.
3.4. Task 3 – participant-driven IrisPlex testing
The optional Task 3 of the exercise, where participants wereasked to recruit their own volunteers for IrisPlex genotyping andeye colour prediction, was performed by 20 of the 21 laboratories.
Lab #7 could not perform this task due to reported ethical issues.Supplementary Table 3 summarises the data for this task. Based onthe digital eye images provided by the participants (Fig. 5), theorganising laboratory judged the correct phenotypes by twoindependent experienced observers. Lab #12 performed thisexercise and reported the genotype and phenotype, but providedno eye images to the host laboratory for inspection. As it was notpossible to judge the accuracy of the results provided by thisparticipant, they were excluded from the analyses. As can be seenin Fig. 6, 16 of the 19 laboratories (84.2%) predicted the eye colourof all analysed individual samples correctly, while 3 laboratoriesfaced difficulties in concluding the correct eye colour from theestimated probability combinations for some samples. Overall, 96(96%) of the 100 samples analysed by the 19 laboratories werereported with the correct eye colour prediction, as judged by theorganising laboratory based on the digital eye images sent by theparticipants. The 4 samples reported with incorrect eye colourwere from 3 different laboratories (1x#2, 2x#3, and 1x#5). Lab #2reported blue eye colour (p = 0.678) for their sample 1 but the eyeimage showed brown colour and the estimated brown eyeprobability was only 0.191 (Fig. 5(a)). Lab #3 obtained thefollowing probabilities for their sample 1: Blue – 0.207, Interme-diate – 0.161 and Brown – 0.632 and reported an inconclusiveresult, while the probability for brown was by far higher than forthe other two categories so that brown should have beenconcluded instead and indeed the respective eye image showedbrown (Fig. 5(b)). Sample 4 of Lab #3 appeared blue from theimages (Fig. 5(c)) but a high brown eye probability (p = 0.892) wasobtained while the blue eye probability was low (p = 0.024). Lab #5obtained probabilities of Blue – 0.375, Intermediate – 0.264 andBrown – 0.361 for their sample 1, and reported blue eye colour butthe image indicates brown eye colour (Fig. 5(d)). In this case,however, the eye colour could have been reported inconclusivesince the brown and the blue eye colour probabilities were verysimilar. It is therefore important to use and report the level ofprecision accuracy based on each probability threshold with thefinal prediction, i.e. p < 0.5 highest probability value, p > 0.5highest probability value. This can be found in Table 2 of ourprevious publication [9]. It is noteworthy to emphasise that theIrisPlex genotypes in Task 3 were not verified independently incontrast to those in Tasks 1 and 2. Therefore we cannot know forsure if any of the 4 incorrect phenotype predictions in Task 3 mayhave been caused by incorrect genotypes, although the highgenotyping accuracy rates achieved in Tasks 1–3 suggest thismight be somewhat unlikely. Due to violation of anonymity, thegeographic origin of these individuals cannot be determined.
Supplementary material related to this article can be found, inthe online version, at doi:10.1016/j.fsigen.2014.04.006.
Further to note, participants for Task 3 were not asked torestrict their choice of volunteers to blue and brown eye colouronly. This was different from Tasks 1 and 2 where only volunteerswith blue and brown eye colour were used due to knownlimitations of the IrisPlex system to accurately predict non-blueand non-brown eye colours [8–10]. However only Lab #1 reported2 individuals as intermediate (p = 0.411 and p = 0.405) and fromthe eye images (Fig. 5(e) and (f) respectively), we can confirm thatthe individuals were correctly predicted as intermediate as theycontain substantial pupillary rings of a different colour (i.e.majority of iris blue colour with obvious brown pupillary ring). It isalso worth noting that although no restrictions were imposed onthe choice of samples for Task 3, all the laboratories (except Lab #1)chose individuals with either blue or brown eyes and hence it ismost likely that all the participants were guided by knowledge of(or clearly considered the) limitations of IrisPlex for accuratelypredicting non-blue and non-brown eye colour phenotypes.Furthermore, according to general knowledge, the frequency of

Fig. 5. Eye images sent by the participating laboratories used for the voluntary aspect of the study, Task 3. Eye images include probability values for blue, intermediate and
brown eye colour provided by the participants as determined from the IrisPlex genotypes. The area surrounded by the red lines indicates the incorrect eye colour prediction as
assessed by the host laboratory from inspection of the eye images provided, and compared with the eye colour phenotype reported by the participants based on IrisPlex
analysis. (For interpretation of the references to colour in this figure legend, the reader is referred to the web version of the article.)
L. Chaitanya et al. / Forensic Science International: Genetics 11 (2014) 241–251 249

Fig. 6. Accuracy of the IrisPlex-based eye colour phenotype prediction of the samples selected by all 19 laboratories participating in Task 3 (Lab #7 did not participate in this
task). Lab #12 though performed the task, did not include images and hence was not considered here. The correct eye colour phenotype was assessed by the host laboratory
from inspection of the eye images provided, and compared with the eye colour phenotype reported by the participants based on IrisPlex analysis. Blue indicates the number of
individuals that were genotyped and green indicates the number of individuals for which the correct phenotype was reported. (For interpretation of the references to colour in
this figure legend, the reader is referred to the web version of the article.)
L. Chaitanya et al. / Forensic Science International: Genetics 11 (2014) 241–251250
blue and/or brown eyes is comparatively higher than intermediatein the population, which could explain the rarity of volunteers withintermediate eye colour phenotype used in Task 3.
The overall performances of the participating laboratories in all3 tasks, is shown in Supplementary Table 4.
Supplementary material related to this article can be found, inthe online version, at doi:10.1016/j.fsigen.2014.04.006.
4. Conclusions
Overall, the high level of consistency achieved throughout thiscollaborative effort in all 3 tasks illustrates the reliability of theIrisPlex assay in producing highly accurate 6-SNP genotypes and ofthe IrisPlex prediction model in producing accurate blue andbrown eye colour phenotypes from IrisPlex genotypes. As shownhere and previously [8], the IrisPlex assay provides reproducibleresults despite differing levels of experience of the laboratorypersonnel involved and differing DNA extraction and quantifica-tion methods used. The results obtained in this collaborativeexercise demonstrate the robustness and reproducibility of DNA-based eye colour prediction when using the IrisPlex system indifferent forensic laboratories world-wide. As emphasised before[8–10], future focus shall be placed on improving DNA-basedprediction of non-blue and non-brown eye colours, for which the
IrisPlex system is less suitable than for blue and brown eye colourprediction from DNA.
Acknowledgements
We would like to thank Gabriela Huber, Nelli Roininen andMintu Hedman for outstanding technical assistance and VlastimilStenzl for support. This work was funded in part by theNetherlands Forensic Institute (NFI) and a grant from theNetherlands Genomic Initiative (NGI)/Netherlands Organizationfor Scientific Research (NWO) within the framework of theForensic Genomics Consortium Netherlands (FGCN). Funding forAdrian Linacre and Renee Ottens was provided by the AttorneyGeneral’s Office, South Australia, for Theresa Gross by the EU 7thFramework Programme (FP7/2007–2013) under Grant AgreementN8 285487 (EUROFORGEN-NoE), and for Antti Sajantila by theFinnish Foundations’ Pool Professorship (Paulo Foundation).
References
[1] M. Kayser, P.M. Schneider, DNA-based prediction of human externally visiblecharacteristics in forensics: motivations, scientific challenges, and ethical consid-erations, Forensic Sci. Int. Genet. 3 (June (3)) (2009) 154–161.
[2] M. Kayser, P. de Knijff, Improving human forensics through advances in genetics,genomics and molecular biology, Nat. Rev. Genet. 12 (March (3)) (2011) 179–192.
L. Chaitanya et al. / Forensic Science International: Genetics 11 (2014) 241–251 251
[3] J. Han, P. Kraft, H. Nan, Q. Guo, C. Chen, A. Qureshi, S.E. Hankinson, F.B. Hu, D.L.Duffy, Z.Z. Zhao, N.G. Martin, G.W. Montgomery, N.K. Hayward, G. Thomas, R.N.Hoover, S. Chanock, D.J. Hunter, A genome-wide association study identifies novelalleles associated with hair color and skin pigmentation, PLoS Genet. 4 (May (5))(2008) e1000074.
[4] Y. Ruiz, C. Phillips, A. Gomez-Tato, J. Alvarez-Dios, M. Casares de Cal, R. Cruz, O.Maronas, J. Sochtig, M. Fondevila, M.J. Rodriguez-Cid, A. Carracedo, M.V. Lareu,Further development of forensic eye color predictive tests, Forensic Sci. Int. Genet.7 (January (1)) (2013) 28–40.
[5] G.G. Fortes, C.F. Speller, M. Hofreiter, T.E. King, Phenotypes from ancientDNA: approaches, insights and prospects, Bioessays 35 (August (8)) (2013)690–695.
[6] K.L. Hart, S.L. Kimura, V. Mushailov, Z.M. Budimlija, M. Prinz, E. Wurmbach,Improved eye- and skin-color prediction based on 8 SNPs, Croat. Med. J. 54 (June(3)) (2013) 248–256.
[7] F. Liu, K. van Duijn, J.R. Vingerling, A. Hofman, A.G. Uitterlinden, A.C. Janssens, M.Kayser, Eye color and the prediction of complex phenotypes from genotypes, Curr.Biol. 19 (March (5)) (2009) R192–R193.
[8] S. Walsh, F. Liu, K.N. Ballantyne, M. van Oven, O. Lao, M. Kayser, IrisPlex: asensitive DNA tool for accurate prediction of blue and brown eye colour inthe absence of ancestry information, Forensic Sci. Int. Genet. 5 (June (3))(2011) 170–180.
[9] S. Walsh, A. Wollstein, F. Liu, U. Chakravarthy, M. Rahu, J.H. Seland, G. Soubrane, L.Tomazzoli, F. Topouzis, J.R. Vingerling, J. Vioque, A.E. Fletcher, K.N. Ballantyne, M.Kayser, DNA-based eye colour prediction across Europe with the IrisPlex system,Forensic Sci. Int. Genet. 6 (May (3)) (2012) 330–340.
[10] S. Walsh, A. Lindenbergh, S.B. Zuniga, T. Sijen, P. de Knijff, M. Kayser, K.N.Ballantyne, Developmental validation of the IrisPlex system: determination ofblue and brown iris colour for forensic intelligence, Forensic Sci. Int. Genet. 5(November (5)) (2011) 464–471.
[11] J. Purps, M. Geppert, M. Nagy, L. Roewer, Evaluation of the IrisPlex eye colorprediction tool in a German population sample, Forensic Sci. Int. Genet. 3(December (1)) (2011) 202–203.
[12] C. Martinez-Cadenas, M. Pena-Chilet, M. Ibarrola-Villava, G. Ribas, Gender is amajor factor explaining discrepancies in eye colour prediction based on HERC2/OCA2 genotype and the IrisPlex model, Forensic Sci. Int. Genet. 7 (July (4)) (2013)453–460.
[13] P.R. Prestes, R.J. Mitchell, R. Daniel, K.N. Ballantyne, R.A.H. van Oorschot, Evalua-tion of the IrisPlex system in admixed individuals, Forensic Sci. Int. Genet. 3(December (1)) (2011) e283–e284.
[14] G.M. Dembinski, C.J. Picard, Evaluation of the IrisPlex DNA-based eye colorprediction assay in a United States population, Forensic Sci. Int. Genet. 9 (March)(2014) 111–117.
[15] L. Yun, Y. Gu, H. Rajeevan, K.K. Kidd, Application of six IrisPlex SNPs andcomparison of two eye color prediction systems in diverse Eurasia populations,Int. J. Legal Med. (January) (2014), http://dx.doi.org/10.1007/s00414-013-0953-1.
[16] V. Kastelic, E. Pospiech, J. Draus-Barini, W. Branicki, K. Drobnic, Prediction of eyecolor in the Slovenian population using the IrisPlex SNPs, Croat. Med. J. 54 (August(4)) (2013) 381–386.
[17] S. Walsh, F. Liu, A. Wollstein, L. Kovatsi, A. Ralf, A. Kosiniak-Kamysz, W. Branicki,M. Kayser, The HIrisPlex system for simultaneous prediction of hair and eyecolour from DNA, Forensic Sci. Int. Genet. 7 (January (1)) (2013) 98–115.