collaborative air quality monitoring strategy: … · collaborative air quality monitoring...
TRANSCRIPT

1
Collaborative Air Quality Monitoring Strategy: Background and Opportunities
Prepared for: Healthy Public Policy Team, Toronto Public Health February, 2015

2
Author: Kevin Behan, Clean Air Partnership Project Team: Toronto Public Health Stephanie Gower, Health Research Specialist, Healthy Public Policy, Toronto Public Health Kate Bassil, Manager, Healthy Public Policy Directorate, Toronto Public Health Clean Air Partnership Emily Trainor, Researcher, Clean Air Partnership Gabriella Kalapos, Executive Director, Clean Air Partnership Kevin Behan, Deputy Director, Clean Air Partnership Recommended Citation: Clean Air Partnership (2015). Collaborative Air Quality Monitoring Strategy: Background and Opportunities. Report prepared for: Healthy Public Policy Team, Toronto Public Health. February, 2015. For more information, contact: Healthy Public Policy Team, Toronto Public Health, (416) 392.6788 Kevin Behan, Clean Air Partnership, (416) 392.0255 Report available at: www.toronto.ca/health/reports
About Clean Air Partnership: Clean Air Partnership (CAP) is a registered charity that works in partnership to promote and coordinate actions to improve local air quality and reduce greenhouse gases for healthy communities. Our applied research on municipal policies strives to broaden and improve access to public policy debate on air pollution and climate change issues. Clean Air Partnership’s mission is to transform cities into more sustainable, resilient, and vibrant communities where resources are used efficiently, the air is clean to breathe and greenhouse gas emissions are minimized.

3
Table of Contents
Executive Summary ............................................................................................................... 4
1 Introduction: Air Quality Monitoring and Modelling ........................................................ 6
2 Pollution and Health ....................................................................................................... 8
2.1 Common Air Pollutants .................................................................................................... 8
2.2 Air Toxics ........................................................................................................................ 12
2.3 Broad Health Effects of Air Pollution ............................................................................. 12
2.4 Burden of Illness Estimates ............................................................................................ 13
2.5 Vulnerability ................................................................................................................... 14
2.6 Air Quality and Land Use ................................................................................................ 14
2.7 Air Quality and Heat ....................................................................................................... 15
2.8 Summary ........................................................................................................................ 17
3 Current Monitoring and Modelling of Air Quality in the GTHA and beyond .................... 17
3.1 Federal Air Pollution Management and Monitoring ...................................................... 17
3.2 Provincial Air Pollution Management and Monitoring in Ontario ................................. 18
3.3 Local Air Pollution Monitoring and Modelling in the GTHA ........................................... 22
3.4 Air Monitoring in Other Jurisdictions and Regions ........................................................ 28
3.5 Summary ........................................................................................................................ 30
4 The Future of Air Quality Monitoring in the GTHA ......................................................... 32
4.1 Academic Studies Enhancing Spatial Coverage of Pollutant Monitoring ...................... 32
4.2 Next Generation Air Monitors ....................................................................................... 34
4.3 Engaging Citizen Science ................................................................................................ 39
4.4 Use of Emerging Technologies for Improved Outreach ................................................. 42
4.5 Summary ........................................................................................................................ 45
5 References ................................................................................................................... 46

4
Executive Summary
Air quality monitoring and modelling efforts seek to improve air quality and the health of
our communities. Improving air quality means reduced health care costs for our provinces, less
sick days, and a healthier, more productive society. Monitoring air quality allows us to evaluate
the status of the air we breathe and compare it to targets we have set based on health
evidence, and to gauge historical improvements. Air quality models are essential air quality
management tools that allow for the prediction of current and future air quality under various
scenarios. Monitoring data feeds models, which allow for the short and long term forecasting of
pollution.
For decision making around pollution and health, air quality information must be available
at a relevant scale. For more local decision making, local information is required. Municipal and
regional decision makers want to model air quality in their jurisdictions. At present, there is
inadequate local and regional monitoring available to adequately support modelling efforts.
However, technological advances in monitoring, coupled with the rapid growth of social
entrepreneurship and active academic research communities mean we are at an exciting
juncture in pollution monitoring. While many ‘next generation’ monitoring technologies are in
their relative infancy, new products are making it to market at a rapid rate, allowing for
cheaper, more extensive local monitoring of air pollution. These technologies may not be ready
to fulfill the aforementioned need of decision makers for more extensive local air quality data,
but their rates of advancement are such that this gap will be filled in a relatively short time.
In 2014 Toronto Public Health released ‘Path to Healthier Air: Toronto Air Pollution Burden
of Illness Update’. The report observes that while emissions have decreased over the past
decade, in order to continue to protect health, future air quality advancements will be more
dependent than ever on local source improvements. The report notes that supporting
collection of data through air quality modelling and local monitoring is required to develop
suitable pollution prevention strategies. At its meeting of April 28, 2014, the Toronto Board of
Health reinforced this need, recommending that the City of Toronto, including Toronto Public
Health, convene a series of roundtables to design a collaborative air monitoring strategy for
Toronto.
Purpose of This Report
This report presents the current state of knowledge around monitoring in the GTHA to serve
as a primer for roundtables to commence in February and April of 2015. It describes the goals
and benefits of air quality monitoring generally and collates information about existing air
quality monitoring activities in Toronto and further afield. The report considers potential gaps

5
in the City's air quality monitoring network, and provides insight into how air quality monitoring
could change in the future with the introduction of more affordable, nimble technologies.
The purpose of this Report is to provide Roundtable participants with background information
on:
Health impacts of air pollution;
Present understanding and knowledge of local and regional air quality concerns;
Present air monitoring actions being undertaken in the Greater Toronto and Hamilton
area (GTHA);
How air modeling contributes to increasing our knowledge of air quality in the GTHA;
How air monitoring is being undertaken and advanced in other jurisdictions; and
New air monitoring technologies becoming available on the market.
This background information will better enable participants to provide their perspective and
input into the following themes which will be discussed at Air Monitoring Roundtables:
Current limitations of air monitoring for air quality related policy and decision making
purposes in the GTHA;
How air monitoring would ideally be able overcome these limitations in the future;
Priorities for improving air quality monitoring in the Region; and
Regional collaboration opportunities for advancing air quality monitoring priorities.
Report Structure
Section 1 of this Report presents a high level overview of air quality monitoring and modelling.
Section 2 reviews literature around air pollution and health, examining the health effects of air
pollution and how vulnerable populations are particularly affected, ad reviews burden of illness
estimates due to poor air quality. In advance of Roundtable events, readers are particularly
directed towards sections 3 and 4. Section 3 reviews current monitoring at federal, provincial
and municipal levels in Canada, and also provides some examples from other jurisdictions.
Section 4 examines the future of air monitoring, reviewing next generation monitors being
developed by academia, industry and social entrepreneurs.
6
1 Introduction: Air Quality Monitoring and Modelling
Air pollution is made up of a variety of substances, each with different sources, patterns of distribution, chemical reactions and health impacts. Pollutants have different associations with land use patterns and transportation. A number of studies have demonstrated that variations in air quality within a community can be as great as the variation between communities, suggesting that land use, urban design and proximity to roads can impact exposures (Hankey, 2011). The Health Effects Institute (2010) confirm this, noting that the principal source of variation in air quality within many communities is vehicle-related air pollution associated with high volume traffic corridors. A review of 15 different studies conducted by the World Health Organization found that concentrations of air pollutants along traffic corridors were 1.2 to 2.3 times higher than background levels in those urban areas (WHO 2005).
Air monitoring is the systematic assessment of the quantity and type of pollution levels over a set area. Ambient monitoring is the long term assessment of pollution, often over a large area. Emissions measurement entails the monitoring of pollution from specific, usually localized sources. Monitoring provides information on pollution levels which can be used to feed and ground truth air quality models. There are many monitoring types, with considerable variation in cost, accuracy, reliability, ease of use and potential application. Data collected by monitors are stored in a variety of ways, and held by a number of different agencies, with different policies regarding accessibility, ease of use and availability.
Traditional monitoring equipment is expensive to purchase, and must be maintained regularly. Most traditional air quality monitors are stationary, measuring air quality at only one location and cannot provide information about air pollution concentrations at other locations, or about where the air pollution is coming from. Many monitors only provide measurements at set time intervals, such as hourly or daily, and do not provide continuous data. Additionally, data custodians may compile data so that what is publicly available might be weekly, monthly or even yearly. Not all monitors are publicly owned and not all their data is publicly accessible. Compounding this, the types of pollutants, as well as the precision and accuracy of the collected data can vary depending on the operator. High-quality air quality monitoring data that is readily available to modellers and decision makers is geographically, and often temporally sparse.
Technological advancements in the last five years mean that the monitoring of air quality is now at an exciting juncture. The variety and availability of monitors is growing, with many new technologies at market and under development. The importance of citizen science in tracking levels of pollutants is growing rapidly. The intersect of citizen science with governmental monitoring presents great possibilities for more precise, and less resource intensive monitoring moving forward. While not without risk, this synergistic approach to monitoring can lead to a greater understanding of how, when and where poor air quality is of greatest concern.
Due to the considerable impacts it can have on health, air pollution must be monitored over space and time. Understanding the severity of the issue is imperative to the creation of appropriate alerts and prevention strategies for vulnerable populations, and in determining the necessity and effectiveness of mitigation measures. Monitoring can inform land use and transportation policies and can be used to assess development applications, informing
7
decisions around the siting of sensitive locations such as child care or senior care facilities for example. Monitoring also allows for the assessment of cumulative impacts. For example, should a highway be proposed, monitoring allows for the inclusion of background pollution levels during the environmental assessment, so the cumulative impact on the community can be assessed, as opposed to the specific impact of the new project only. Monitoring is also vital in the validation, evaluation and calibration of models. Monitoring can be complemented by other air quality analysis tools such as modelling.
There are many types of models. Models exist at global, regional and local scales, and can predict concentrations in the short or long term. Meteorological and dispersion models allow for the forecasting and movement of pollution. Just as meteorologists forecast weather in the short term, dispersion modelers can predict how pollutants will build under certain atmospheric conditions and estimate in which directions pollutants will disperse. Models can account for both the level of pollutants that will be emitted, and also how weather conditions will affect those pollutants once emitted (for example when an inversion occurs and warm air is trapped below cool air leading to poor air quality as pollutants cannot ‘escape’).
Receptor models allow for the identification and estimation of sources of poor air. Also referred to as source appointment models, receptor models are important for scientifically justifying priorities and observing trends related to specific pollution sources. Statistical models enable the examination of future policies, programs or regulatory decisions related to land development, technological improvements to vehicles, industrial emissions or population growth for example. This work is essential in determining the potential benefits/detriments of new regulation, technologies or environmental changes.
Comparing model performance to past events is key when assessing our levels of scientific understanding and model capabilities. We can combine models and monitoring to provide pollution concentration estimates for areas where monitoring is lacking. In the short term, modelling allows us to forecast air quality issues and present services such as an Air Quality Health Index forecast.
A model is only as reliable as its inputs. Data obtained through air quality monitors are a fundamental core dataset in air quality models. Traditional monitoring has operated using relatively few stationary monitors, which is useful in determining how air quality trends and measurements differ between communities. More recent research has demonstrated that differences in air quality within a community can be of an even greater magnitude than between communities. These findings have generated a great deal of interest in characterizing air quality at much finer resolutions, in neighbourhoods, or even a specific point location.
There are several limitations to modelling. One of which is that it requires a large amount of input data (which is often not available in a timely manner) and is very sensitive to the quality of the input data and the assumptions used within the models. Air pollution is complex. Multi-pollution effects can exist which are hard for models to comprehend. Models are often designed for a specific application and should not be used outside these applications without altering baseline assumptions. There is inherent uncertainty in all model data and model processes. Many models perform better when predicting long term concentrations as opposed
8
to short term concentrations at a specific location. While they strive for optimal performance, models cannot account for all processes that lead to an outcome.
An inherent characteristic of models is that their successful predictive abilities are reliant on their data inputs and the ability of the modeler. Canada is fortunate because there are a number of institutions (academic, government and private) with world-class modelling expertise. Canadian universities are at the cutting edge of improvements to model and model development. It can be generally stated that modelling in Canada is not constrained by the ability of modelers. It is however constrained by data availability. While pollution models often use multiple datasets including atmospheric conditions and study area characteristics as model inputs, pollution data provided by monitoring stations is an absolutely core input.
Section 2 of this report will first examine pollutants of concern to decision makers seeking to protect health and explore the relationship between pollution and health. Section 3 reviews current or ‘traditional’ monitoring networks. Section 4 examines the possibilities for future of air quality monitoring in the Greater Toronto and Hamilton Area. Section 5 concludes with possible cooperative air quality monitoring and modelling opportunities for consideration, consultation and implementation.
2 Pollution and Health
2.1 Common Air Pollutants
Ground-level ozone (O3), fine particulate matter (PM2.5), sulphur dioxide (SO2), nitrogen dioxide (NO2) and carbon monoxide (CO) form Common Air Pollutants. Also referred to as Common Air Contaminants or Criteria Air Pollutants, Common Air Pollutants form the greatest health threats to our communities and will be described individually in this section.
Common air pollutants are a subset of a large array of liquid droplets, gases and particulates that are collectively referred to as air pollutants. Other air pollutants include odours, volatile organic compounds, toxics, chlorofluorocarbons and other hazardous air pollutants. While there are a number of sources for these pollutants, including transportation and non-road equipment, many of these harmful, but less common pollutants are emitted by a limited number of industrial sources.
The Ontario Ambient Air Quality Criteria or AAQC is a “desirable” pollutant level as specified by the Ontario Ministry of the Environment. The AAQC is set with different averaging times as deemed appropriate by the effect they are specified to protect against. While for many pollutants, no safe level of exposure has been identified, the AAQC serves as a target below which communities should aspire to achieve. AAQCs exist for all common air pollutants. In addition to AAQCs, there exists Canadian Ambient Air Quality Standards, or CAAQS.
O3
Ground-level ozone is a secondary air pollutant that is formed in the atmosphere from reactions between other air pollutants, primarily nitric oxide and nitrogen dioxide(NOx) and volatile organic compounds (VOCs) (MOECC, 2012). Because these reactions are affected by
9
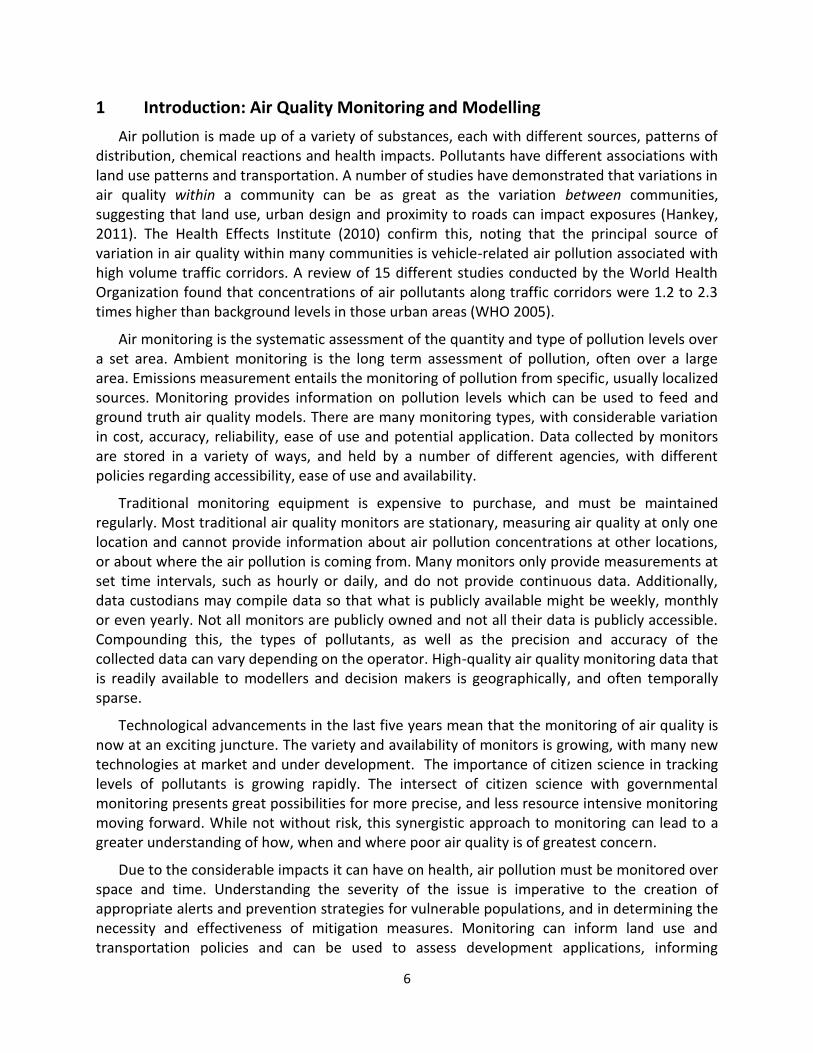
meteorological conditions, elevated concentrations of ground-level ozone are typically recorded on hot and sunny days from May to September, between noon and early evening (MOECC, 2012). Canadian ambient air quality standards (CAAQS) exist for Ozone and PM2.5, and have replaced what were previously called Canada Wide Standards for these pollutants. The 1-hour AAQC for O3 is 80 ppb (MOECC, 2014. The CAAQS (8-hour) for O3 is 63ppb. Figure 1 displays the relative sources of VOCs in the City of Toronto for the year 2006. Because O3 is not emitted directly, VOC emissions are instead used as a proxy for O3 formation. Figure contents taken from Golder Associates (2011)
Ground level O3 and smog are extremely harmful to human health and can result in acute and chronic damage to the respiratory system. This is of particular concern for individuals with cardiovascular and pulmonary diseases, including asthma and chronic obstructive pulmonary disease (COPD) (Health Canada, 2008). O3 has been shown to increase airway inflammation, affecting lung function and compromising oxygen exchange (Brown et al., 2008). Jerrett et al. (2009) reported positive associations between O3 concentration and respiratory causes of death. The coexistence of poor urban air quality during the summer months and especially during sustained periods of high temperatures has led many researchers to conduct studies to explore the relationship between human health, elevated pollution levels and the urban heat island effect (MOECC, 2012). Because ground level O3 is not directly emitted into the air, and is formed over a broader region, controls to reduce O3 precursors at a municipal level may not necessarily reap rewards without a concerted effort from surrounding municipalities, regions, provinces and states. O3 levels are in fact often higher away from the sources of the precursors. This is due to local scavenging of O3. Once formed, O3 can be scavenged by nitrogen monoxide (NO). In the absence of major NO sources, this cannot happen. For this reason, in busy urban communities, O3 levels can be lower than surrounding rural communities.
NO2
Nitrogen dioxide is an odorous, pungent, reddish-brown gas formed by the oxidation of NO which is emitted when fuel is combusted at high temperatures such as in fast moving vehicles and industrial processes (MOECC, 2012). NO2 is a principal component of smog and an important precursor for the formation of ground level ozone. The 1-hour AAQC for NO2 is 200 ppb (MOECC, 2012). Any time fuel is combusted in air, NOx are emitted, of which NO2 is a major component. Most studies on the health effects of gaseous NOx focus on NO2 due to more robust epidemiological links between NO2 and relative risk. Major sources of NOx emissions include the transportation sector, industrial processes and electricity generating stations. Nitrogen oxides are emitted when natural gas and oil are used to heat homes and businesses (MOECC, 2012). Figure 1 displays the sources of NOx in the City of Toronto for the year 2006.
Because NO is rapidly oxidized by ozone, most epidemiological studies tend to focus on NO2
instead of NO. Strong correlations have been observed between mortality and NO2 concentrations (Finkelestein et al, 2005). Stieb et al (2005) found an increase of 2.8% in non-traumatic mortality associated with a 24 ppb increase in NO2. For the City of Vancouver, Villeneuve et al (2003) observed a 3.5% increase in non-traumatic mortality associated with a

10
17.5ppb NO2 increase. Several studies also examined stroke, heart attacks and lung cancers and found significant relationships with NO2 levels (Rosenlund et al., 2009).
Figure 1 Common Air Pollutant Sources for 2006 in the City of Toronto (Golder Associates,
2011).
PM2.5
Airborne particulate matter is the general term used to describe a mixture of microscopic solid particles and liquid droplets that are suspended in air. Particulate matter (PM) is classified according to its size because of the different health effects associated with particles of different diameters. Fine particulate matter (PM2.5), that are less than 2.5µm in diameter, can penetrate deep into the respiratory system (MOECC, 2012). Particulate matter can be emitted directly from a source or formed in the atmosphere by the transformation of gaseous emissions and includes aerosols, smoke, fumes, dust, fly ash and pollen. The AAQC for PM2.5 is 30 µg/m3 over a 24-hour calendar day. The CAAQS for PM2.5 is 28 µg/m3 over a 24-hour calendar day or 10.0 µg/m3 over an annual calendar year. Figure 1 displays the sources of PM2.5 in the City of Toronto for the year 2006.
Long-term exposure to elevated levels of PM2.5 has also been associated with the development of chronic heart and lung diseases, including lung cancers (US EPA, 2004; Samet, 2000). The American Heart Association comprehensively reviewed health studies examining PM2.5 and concluded that a causal relationship exists between exposure to PM2.5 and cardiovascular disease and death; that long term exposure to elevated levels of PM2.5 increases the risk for cardiovascular mortality and reduces life expectancy; and reductions in levels of PM2.5 can decrease cardiovascular mortality within a few years (Brook et al, 2010). Pope et al.,
0%
10%
20%
30%
40%
50%
60%
70%
80%
90%
100%
SO2 NOx PM2.5 VOC CO
Biogenic / Agriculture
Nonroad
Mobile
Residential/Commercial
Industrial
11
2004 demonstrated the association between PM2.5 exposure and a broad range of cardiac events including ischemic heart disease, dysrhythmia, cardiac arrest and heart failure. It was also observed by Jerrett et al (2009) that socioeconomic and demographic characteristics also correlated with exposure levels within urban areas.
SO2
Sulphur dioxide is a colourless gas formed when sulphur burns in the presence of oxygen during the combustion of coal or other industrial processes (MOECC, 2012). SO2 concentrations are closely related to the presence of industry, particularly heavy industry and smelting processes (Weng and Yang, 2006). Residential burning of coal for heating was a major source of SO2 pollution in urban areas prior to the creation of legislation against its use. The 1-hour AAQC for SO2 is 250 ppb (MOECC, 2012. Industrial uses including smelting and electrical utilities account for the vast majority of SO2 emissions. Figure 1 displays the sources of SO2 in the City of Toronto for the year 2006.
Exposure to SO2 has been demonstrated to result in a series of health impacts ranging from colds and sore throats, reduced respiratory capacity, and cardiovascular morbidity. Zmirou et al (1998) observed that while SO2 did not show association with mortality after adjusting for PM concentrations in US cities, this was not the case in European studies where the relationship was proven. Stieb et al. (2005) demonstrate this, where a meta-analysis of time-series analyses on air pollutants and health showed a 0.9% increase in all cause mortality due to a 9.4 ppb increase in SO2. In Ontario, cardiovascular morbidity due to SO2 was suggested by Fung et al (2006) for the City of Windsor, where hospital admission rates for seniors rose by 2.6% for an interquartile range increase of 19.3 ppb SO2.
CO
Carbon monoxide, although poisonous, is colourless, odourless and tasteless. CO is a residual gas produced that is produced through incomplete fuel combustion. Because of the nature of its production, CO is primarily emitted from the transportation sector. The 1-hour AAQC for CO is 30 ppb (MOECC, 2012). Figure 1 displays the sources of CO in the City of Toronto for the year 2006.
Health problems associated with exposure to CO range from less obvious cardiovascular and neurobehavioral effects at low concentrations to unconsciousness and death due to acute or chronic exposure to higher concentrations of CO (Raub et al, 2000). Higher concentrations are most often found indoors and are due to proximal residential exposure to a concentrated source as opposed to atmospheric pollution due to transportation, industry and other processes. However, health effects due to atmospheric CO are substantial. The WHO estimates that globally over 3 million people are killed each year by environmental air pollution associated with vehicle and industrial CO emissions (WHO, 2014).
Stieb et al. (2005) observed significant relationships between CO concentrations and non-traumatic mortality. In Canada, the relationship between cardiovascular morbidity and CO
12
levels was found by Szyszkowicz (2009) for ischemic heart disease and ER admissions due to chest pains respectively. Villeneuve et al (2003) observed a seasonal relationship between CO and stroke, where during the summer impacts were significant. More recently, research has demonstrated clear associations between ambient CO exposure with increased risk of hospitalization due to a range of cardiovascular complaints, cardiac arrhythmia in particular.
2.2 Air Toxics
Air toxics, or Hazardous Air Pollutants, are a class of several hundred poisonous pollutants with considerable health effects. Long term exposure to toxics is associated with cancers, reproductive effects, birth defects, immune system damage, developmental effects and respiratory effects. Examples of common toxics include benzene (gasoline), perchloroethylene (dry cleaning facilities), methyl chloride (commonly used solvent), dioxin (smelting and paper production), asbestos (building material) and, toluene (gasoline).
While some toxics, like radon, come from natural sources, most are the result of human activity. Humans are exposed to toxics through several mechanisms. Breathing contaminated air is the most common. Other contamination mechanisms include the consumption of contaminated water; food grown on contaminated soil or; animal products where animals were farmed on contaminated soil (EPA, 2014). While the focus of this report is on common air pollutants due to their ubiquity and severity, toxics also warrant consideration.
2.3 Broad Health Effects of Air Pollution
The health effects of common air pollutants are described above. More general health effects due to pollution, as well as burden of illness estimates and specific considerations for vulnerable populations are presented in this section.
In addition to those health effects described for common air pollutants, it can be more generally stated that air pollution is responsible for significant health effects and drains our health care system as a result of its burden of illness. Air pollution affects health in many ways, with particularly adverse impacts on lungs, heart and blood vessels. Research has linked air pollution to a number of health concerns like:
Asthma and other respiratory illnesses; Chronic obstructive pulmonary disease; Cardiovascular disease; Lung cancer; Endocrine system effects; Neurological effects; Diabetes; and Allergies
In addition, air pollutants typically increase the severity or frequency of common respiratory
and cardiovascular medical conditions or illnesses. In 2013 the World Health Organization classified outdoor air pollution as a cancer causing agent (carcinogen) and scientific research indicates that there is no “safe level” for air pollution. In other words, there is no level below

13
which air pollution poses no adverse health effects. Even at low levels, air pollution can have important detrimental health impacts due to the ubiquity of exposure. If many thousands of people are exposed in an area, while the individual risk is low, such a large population is affected that many people suffer health effects. Air pollution poses a health risk all year long, not just in the hot summer months. These health impacts have a strong bearing on our quality of life and place unnecessary strain on the health care system. Pollution health effects are primarily as a result of exposure to the five common air pollutants.
Globally, there exists a wealth of academic literature demonstrating how short-term increases in concentrations of common air pollutants are associated with a broad range of acute health effects including reduced lung function; increases in the frequency and severity of asthmatic symptoms; increases in emergency room visits and hospital admissions for respiratory and cardiovascular conditions including respiratory infections, asthma; and an increase in non-traumatic deaths for respiratory and cardiovascular conditions (OMA, 2005; Stieb, 2005; WHO, 2005; US EPA 2004; Brook et al, 2010).
2.4 Burden of Illness Estimates
In 2004, researchers from Health Canada and Environment Canada conducted a study to estimate the burden of illness associated with air pollution in several Canadian cities. They concluded that the five common air pollutants are responsible for approximately 2,900 deaths each year in Windsor, Hamilton, Toronto and Ottawa. They attributed one third of those deaths to acute health impacts associated with the mix of the five air pollutants and two thirds to the chronic health impacts associated with PM2.5 alone, concluding that air pollution is responsible for between 7% and 10% of all non-traumatic deaths in cities across Ontario (Judek, 2004).
In 1998, the Ontario Medical Association (OMA) declared air pollution “a public health crisis”. This statement was based on strong scientific evidence linking air pollutants like ozone, nitrogen oxides, carbon monoxide and tiny airborne particulates and acid droplets to various illnesses and breathing problems. According to the OMA’s 2005 report, The Illness Cost of Air Pollution in Ontario, particulate matter (one type of air pollution) is responsible for 5,900 premature deaths, 16,800 hospital admissions, almost 60,000 emergency room visits and costs Ontario’s health system almost half a billion dollars in direct health care costs (not including visits to family doctors) and lost productivity (as employees were too sick to come to work due to smog) on an annual basis (Ontario Medical Association, 2005).
In 2004, Toronto Public Health (TPH) reported that air pollution contributed to an estimated 1,700 premature deaths and 6,000 hospitalizations each year in Toronto alone. Ten years later, despite improvements in air quality, air pollution still has a serious impact on health in Toronto. Air pollution is now, estimated to contribute to 1,300 premature deaths and 3,550 hospitalizations each year in the City of Toronto (Toronto Public Health, 2014).
In 2008, the Canadian Medical Association estimated that for that year due to air pollution, Ontario suffered 1,178 acute premature deaths, 4,579 hospital admissions, 39,575 emergency department visits, 10,383,000 minor illnesses and 262,315 doctor’s office visits. The total health cost of air pollution in Ontario was estimated at $3,644,100,000 for 2008 (CMA, 2008).
14
It is important to note that similar burden of illness studies of the same geographical area often come up with different results. This is due to methodological differences between the studies. For example, some studies may examine all pollutants for which there is available monitoring information, while others may examine common air pollutants only. Additionally, some studies include chronic health impacts while others only include acute illness.
2.5 Vulnerability
Air pollution studies have found that while everyone is adversely affected by exposure to air pollution, children, the elderly, and those with pre-existing health conditions such as heart conditions, asthma and other respiratory illnesses, and diabetes are particularly vulnerable to negative health impacts resulting from exposure to air pollution. In addition it has also been found that air pollution poses a health risk all year long, not just in the hot summer months (Brook et al, 2004; Brook et al, 2010; OMA, 2005; WHO, 2004;). The effects on children can be particularly pronounced, as demonstrated by the Children’s Health Study, which followed about 6,000 children living in 12 communities in Southern California since 1993. This study found a three to five fold increase in decreased lung function among adolescents who grew up in communities with high levels of air pollution. The association was particularly strong for exposures to NO2, PM2.5, PM10 and atmospheric acidity (Gauderman, 2004). The study also found that physically active children living in high ozone communities are up to three times more likely to develop asthma than children living in low ozone communities.
Social vulnerability to poor air quality is also unevenly distributed. Due to high housing costs, lower-income neighbourhoods are considerably more likely to be clustered near pollution hotspots due to unavailability of reasonably priced land elsewhere. This means lower income and lower education individuals are at a higher risk of exposure to poor air quality. Lower education individuals may also be less likely to seek out information on the health effects of living in close proximity to pollution sources. Because of this, decision making around place of residence is unlikely to consider air quality and health effects (Clarke et al, 2014).
In summary, health impacts resulting from air pollution severely impact our quality of life and place unnecessary strain on the health care system. Reducing air pollution levels can reduce the burden of disease from asthma, stroke, lung cancer, and both chronic and acute respiratory and cardiovascular diseases. The lower the levels of air pollution, the better the cardiovascular and respiratory health of the population is on both the long- and short-term. However a thorough understanding of the trends and implications of air pollution would not be possible without an air pollution monitoring system.
2.6 Air Quality and Land Use
The relationships between land use patterns, vehicle emissions and air quality are complex. While pollution levels in cities vary, general local pollution patterns are a function of land-use/cover and flushing rates (Weng and Yang, 2006). Land use impacts air quality in a number of ways, through biogenic and anthropogenic emissions, changes to the urban climate and through the dry deposition of pollutants, where vegetative surfaces act as pollutant sinks and
15
when replaced with grey infrastructure no longer offer a potential route of pollutant uptake. As well as the air quality effects related to land use type, other factors affect air quality within a given land use classification. For example, as land-use densities rise, pollution levels generally follow, creating an urban-rural pollution gradient (Marsh and Grossa, 2002, as cited by Weng and Yang, 2006). The size of an individual land use unit also affects air quality. For example, when the degree of parkland/open space interspersed within urban areas together with meteorological conditions affect the flushing rates of pollutants in cities, or the time it takes for a pollutant to exit an urban system.
Perrotta (2012) observed how over the past twenty years, dozens of studies have been directed at negative health impacts of pollution along high volume traffic corridors with varying volumes (10k - 100k vehicles/day) and types of traffic (cars v trucks). Researchers examined a variety of pollutants including PM2.5, ultra-fine particles (UFPs), NO2, CO, black carbon (BC), and particle-bound polycyclic aromatic hydrocarbons (PPAH). Many health impacts were studied, including cardiac and respiratory issues, cancers, strokes and reproductive effects. Studies also examined separation distances between specific land uses and traffic corridors. Perrotta notes that in a 2007 review of air quality and health studies directed at high volume traffic corridors, Brugge, Durant and Rioux (2007) concluded that air levels of UFPs, BC, CO and NO are all elevated along high volume traffic corridors with greater than 30,000 vehicles per day, and that people living beside these highways are likely to receive much higher exposures to traffic-related air pollutants than people living beyond 200 metres from highways. They observed that that ‘the most susceptible and overlooked population in the US subject to serious health effects from air pollution may be those who live near major regional transportation routes, especially highways.’ This was reinforced by the Health Effects Institute (2010), demonstrating that air pollution associated with traffic corridors can extend as much as 300 to 500 metres from a highway.
Conversely, Perrotta (2012) observes how several studies have demonstrated that the walkability of communities can reduce emissions from the transportation sector by influencing reductions in car dependence. The California Air Resources Board (1997) found that compact, walkable, transit-oriented neighbourhoods can reduce vehicle-related air emissions by up to 20% compared to sprawling suburbs. A 2004 study by Frank and Chapman found that the most auto-oriented neighbourhoods in Atlanta generated 30% more trips than the most walkable neighbourhoods, noting that with each step up a five-part walkability scale, emissions of NOx and VOCs decreased by 6% and 3.6% respectively.
2.7 Air Quality and Heat
Comparing 2000-2009 monitored data with modeled results for 2040-2049, Senes Consulting (2012) note that for the City of Toronto, average annual temperatures are predicted to increase by 4.4°C, with projected average winter temperatures increasing by 5.7°C and average summer temperatures increasing by 3.8°C. Maximum daily temperatures are modeled to increase from 33°C (2000-2009) to 44°C (2040-2049). The number of days above 30°C is predicted to increase from 20 to 66 in this time frame, with the number of heat waves (3+ days above 32°C) increasing in frequency from 0.57 events/year to 2.53 events/year.
16
Climate change has important ramifications for air pollution. Even if there are reductions in pollutants emitted in the future, concurrent increases in temperature may mean that actual pollution levels may not change dramatically. This further impresses the need for reductions. In light of anticipated changes in the future climate, should emission remain status quo, pollution levels will increase. There are a number of reasons for this.
Urban surface temperatures are correlated with increases in photochemical smog and decreases in air quality (Lo and Quattrocho, 2003). The Ontario Medical Association, for the year 2008, estimates that 9,500 premature deaths in Ontario were due to smog (OMA, 2010). Heat compounds air quality issues in several ways. Heat is a prerequisite to the formation of O3. Elevated air temperatures facilitate the chemical reactions that transform atmospheric nitrogen oxides and volatile organic compounds into O3, one of the main components of photochemical smog (Waleck and Yuan, 1995). It has been demonstrated in the US context that for each 1˚C increase in temperature above 22˚C, smog is increased by 5% (Taha et al., 1994). PM can be emitted directly but can also be formed in the atmosphere through reactions with a variety of compounds including NOx, ammonia, and sulphates (PPIC, 2008)
A second way in which urban heat affects air quality is through emissions as a result of air conditioning (a/c). Many cities in western nations where electricity is relatively cheap use a/c to improve domestic comfort. This generates higher emissions from power plants and results in increased smog formation. US-based research by Akbari et al. (2001) found that a/c usage was responsible for 5–10% of urban peak electric demand, creating as much as 20% of population weighted smog concentrations in urban areas.
Yet another way that urban heat influences air quality is through its effect on air masses. Yokishado and Tsuchida (1996) measured wind speeds, temperature and NO2 concentrations over Tokyo Bay and noted that increased urban temperatures in the built up part of Tokyo Bay due to the urban heat island were influencing localized winter wind cycles. They concluded that the higher ambient temperatures of the built up portions of the shore were initiating a closed circulation system when interacting with sea air, resulting in a stagnant mass of air with high level of pollutants, specifically NO2 and particulate matter. Such a conclusion is relevant to Great Lakes cities which are influenced by localized lake effect wind patterns that help to disperse air pollutants and cool the urban core.
Improved air quality monitoring, coupled with local future climate information could allow for more precise modelling of future air quality conditions. Due to the nature of climate modelling, there is inherent uncertainty regarding the specifics of future temperature and other metorological parameters. However, general trends in the data are consistent, and consistently show warming, locally, regionally, and globally. Broadly accounting for future temperature changes is important in informing policy and programming to tackle air quality issues. Given the influence of temperature on air quality, it cannot be completely ignored when modelling for future conditions.

17
2.8 Summary
Pollution presents major concerns from a number of perspectives. Considering morbidity and mortality due to poor air quality from 2008 - 2031 the CMA (2008) estimates associated costs at over $117 billion in present day dollars, or almost 75% of the provincial deficit for the study year. There are many reasons why poor air quality must be addressed. The most pertinent reason is to protect the health of Ontarians. Vulnerability is not equally distributed among all communities, or within all communities. Relationships between heat, land use and air quality put our most vulnerable community members at an increased risk of morbidity and mortality.
3 Current Monitoring and Modelling of Air Quality in the GTHA and beyond
This Report broadly considers two monitoring types. The first is what could be referred to as ‘traditional’ monitoring networks. These stations are robust and reliable. They have collectively informed our understanding of pollution trends and health effects in the region. They are generally owned and operated by provincial and federal governments, with a few exceptions. Traditional monitoring networks encompass stationary, movable and mobile monitors. They are used for decision making by governments and for research purposes by academic and non-government communities. The second type of monitors considered is collectively referred to as ‘next generation’ monitoring networks. These networks include small research monitoring networks, portable monitors, and wearable monitors. They are generally privately or institutionally owned. They are lower in cost, at an earlier stage in their product life cycle and there is a broad range in terms of reliability and accuracy. At this juncture, next generation monitors are not used in government-level decision making. They are being actively used and studied by academic and practitioner research communities, and many are being used to inform individual-level day-to-day decision making.
This section describes ‘traditional’ monitoring networks. They are meticulously calibrated and maintained, and are excellent in informing decision makers in their locales. Because they are government owned and operated, their data is generally made publicly available and is easily accessible, however the time intervals at which these data come available can be lengthy, over a year in certain cases. They are geographically sparse, and expensive to acquire, install, operate and maintain. For these reasons, it is not possible to attain the coverage necessary to reflect the spatial gradient of pollution in our communities which we now know exists.
3.1 Federal Air Pollution Management and Monitoring
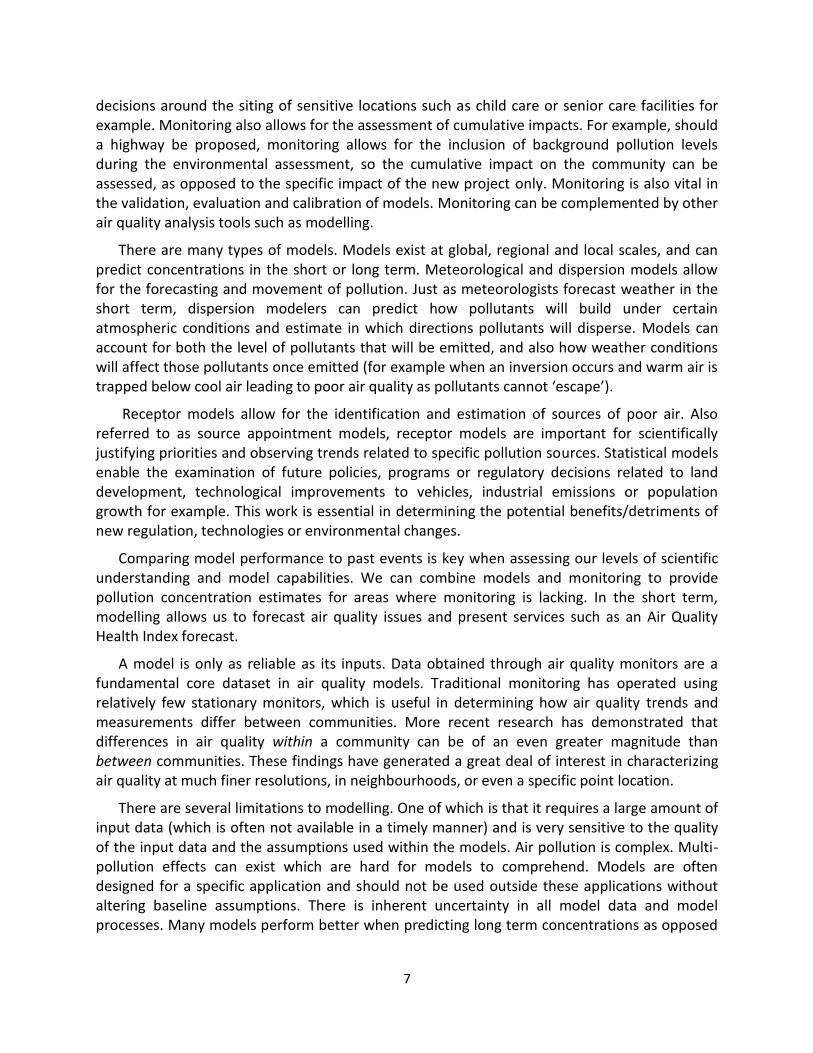
Air quality is monitored at the federal level via the National Air Pollution Surveillance Network (NAPS). The goal of the NAPS program is to provide accurate and long-term air quality data of a uniform standard across Canada. NAPS was established in 1969 to monitor and assess the quality of ambient (outdoor) air in the populated regions of Canada. NAPS is managed using a cooperative agreement among the provinces, territories and some municipal governments. A map of all NAPS stations across the country is available here: http://maps-cartes.ec.gc.ca/indicators-indicateurs/default.aspx?mapId=17&lang=en. There are 286 NAPS

18
sites in 203 communities across Canada. Most NAPS stations are operated by provincial agencies, but feed into the common federal NAPS portal.
NAPS provide hourly ambient measurements for SO2, NO2, O3, PM2.5, and CO. Over time, additional measurements have been added into the system and now include 167 organic compounds that are measured daily. Annually, NAPS data files are made available for download. Data files contain the continuous hourly and 24 hour integrated contaminant concentration data for air quality across Canada are easily accessed from the NAPS website at http://www.ec.gc.ca/rnspa-naps/ . Data are presented as Microsoft Excel tables in a user friendly way so that researchers and decision makers can easily study relevant pollutants. Detailed metadata is also provided to guide users. Measurements provided by NAPS are used by researchers and decision-makers in the determination of air quality trends and impacts, and to inform program and strategy development. For example, data can inform pollution control strategies, identify urban air quality trends and inform pollution forecasts. Land use planners, transportation planners and others whose decisions involve air quality also use these data in decision support. The measurements generated also inform the Air Quality Index (AQI) and Air Quality Health Index (AQHI).
Figure 2 NAPS Stations in the Greater Toronto Area
3.2 Provincial Air Pollution Management and Monitoring in Ontario
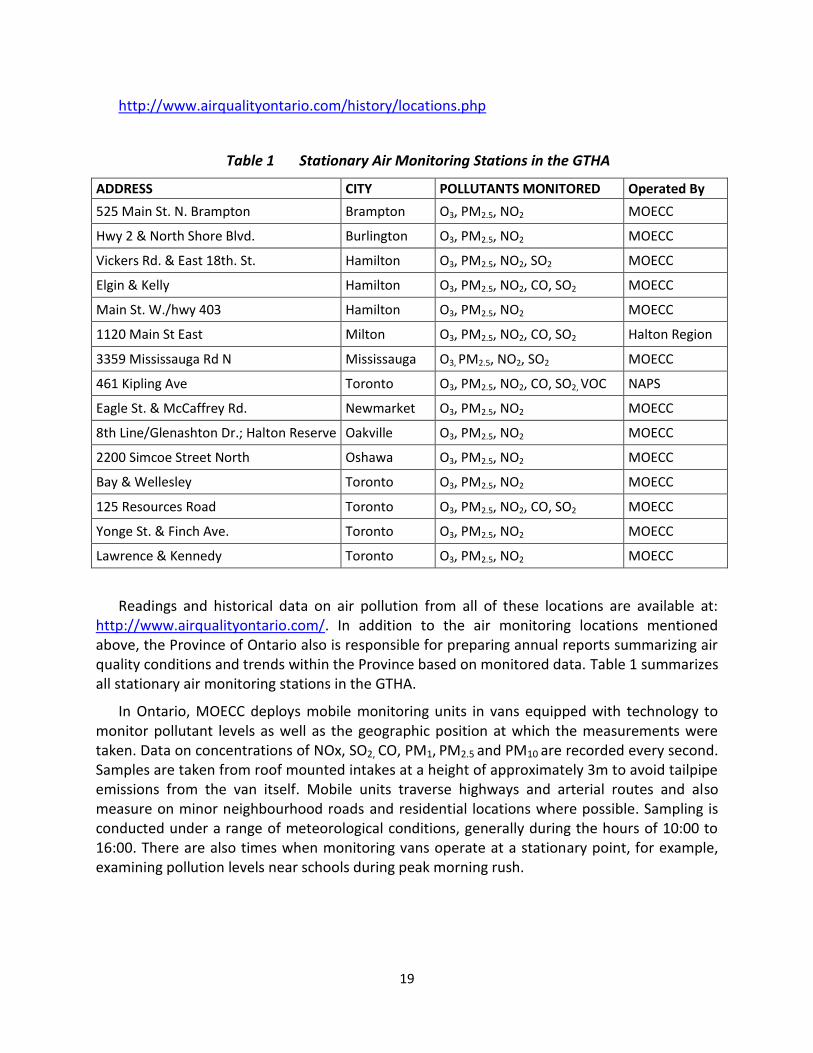
Within the Province of Ontario air quality monitoring is largely managed by the Ministry of Environment and Climate Change (MOECC) who maintains a network of 40 monitoring stations across the Province, 14 of which are in the GTHA (see Table 1). The Air Quality Office of the Environmental Monitoring and Reporting Branch continuously obtains data for criteria air pollutants and toxic substances of concern from these 40 sites (MOECC, 2012). Through these monitoring stations, the Ministry provides low resolution ambient pollution information considered to be representative of urban and rural areas of the province. Whilst this data may allow researchers to estimate pollution concentrations for an urban area, there is insufficient data to estimate variation in concentrations within an urban area. A map of monitoring stations is available here:
19
http://www.airqualityontario.com/history/locations.php
Table 1 Stationary Air Monitoring Stations in the GTHA
ADDRESS CITY POLLUTANTS MONITORED Operated By
525 Main St. N. Brampton Brampton O3, PM2.5, NO2 MOECC
Hwy 2 & North Shore Blvd. Burlington O3, PM2.5, NO2 MOECC
Vickers Rd. & East 18th. St. Hamilton O3, PM2.5, NO2, SO2 MOECC
Elgin & Kelly Hamilton O3, PM2.5, NO2, CO, SO2 MOECC
Main St. W./hwy 403 Hamilton O3, PM2.5, NO2 MOECC
1120 Main St East Milton O3, PM2.5, NO2, CO, SO2 Halton Region
3359 Mississauga Rd N Mississauga O3, PM2.5, NO2, SO2 MOECC
461 Kipling Ave Toronto O3, PM2.5, NO2, CO, SO2, VOC NAPS
Eagle St. & McCaffrey Rd. Newmarket O3, PM2.5, NO2 MOECC
8th Line/Glenashton Dr.; Halton Reserve Oakville O3, PM2.5, NO2 MOECC
2200 Simcoe Street North Oshawa O3, PM2.5, NO2 MOECC
Bay & Wellesley Toronto O3, PM2.5, NO2 MOECC
125 Resources Road Toronto O3, PM2.5, NO2, CO, SO2 MOECC
Yonge St. & Finch Ave. Toronto O3, PM2.5, NO2 MOECC
Lawrence & Kennedy Toronto O3, PM2.5, NO2 MOECC
Readings and historical data on air pollution from all of these locations are available at: http://www.airqualityontario.com/. In addition to the air monitoring locations mentioned above, the Province of Ontario also is responsible for preparing annual reports summarizing air quality conditions and trends within the Province based on monitored data. Table 1 summarizes all stationary air monitoring stations in the GTHA.
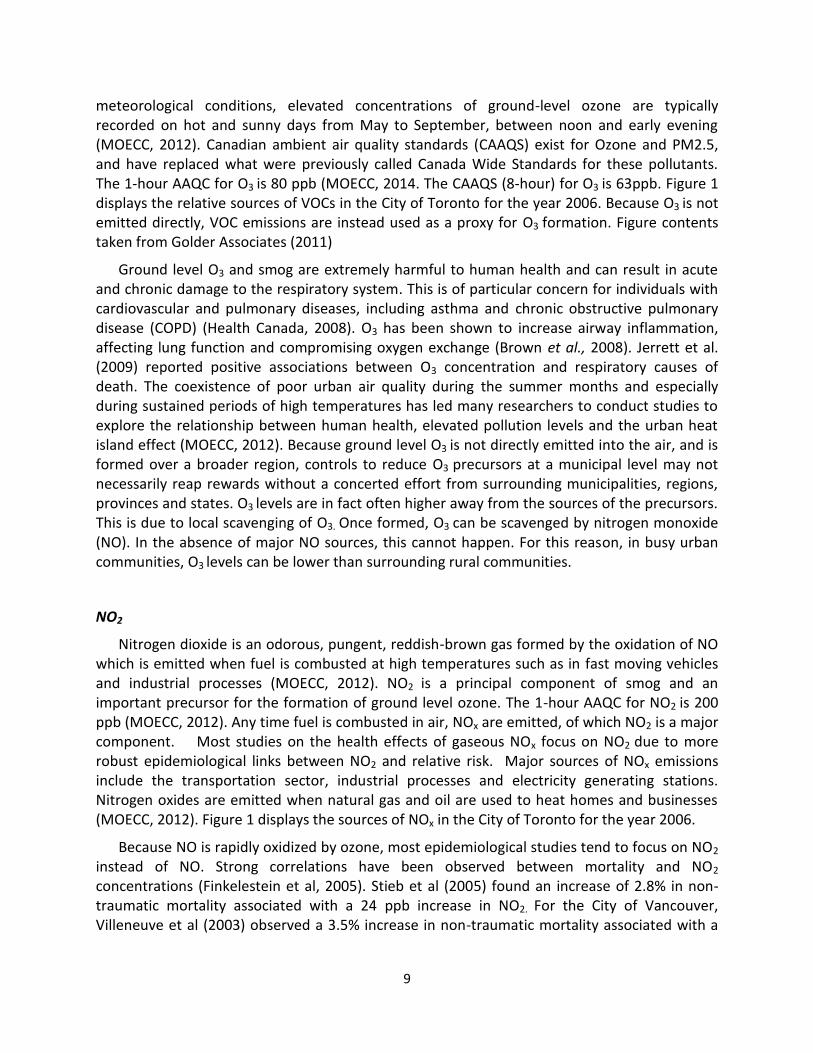
In Ontario, MOECC deploys mobile monitoring units in vans equipped with technology to monitor pollutant levels as well as the geographic position at which the measurements were taken. Data on concentrations of NOx, SO2, CO, PM1, PM2.5 and PM10 are recorded every second. Samples are taken from roof mounted intakes at a height of approximately 3m to avoid tailpipe emissions from the van itself. Mobile units traverse highways and arterial routes and also measure on minor neighbourhood roads and residential locations where possible. Sampling is conducted under a range of meteorological conditions, generally during the hours of 10:00 to 16:00. There are also times when monitoring vans operate at a stationary point, for example, examining pollution levels near schools during peak morning rush.

20
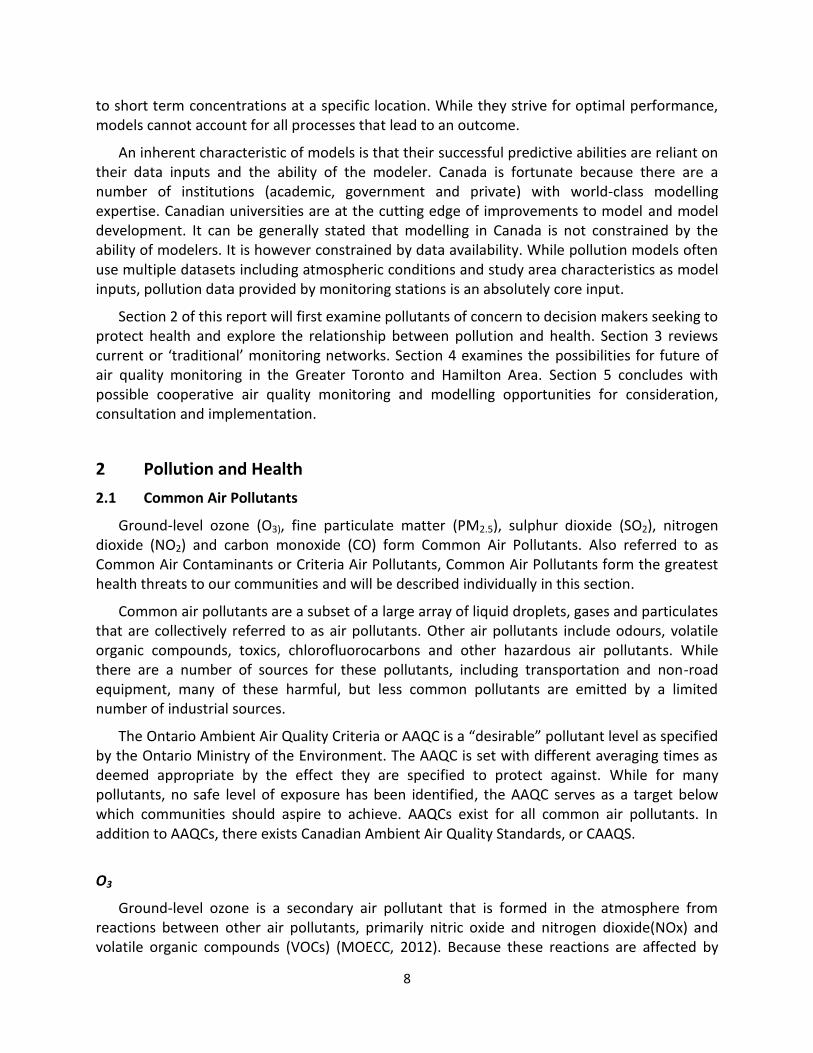
Figure 3 Hamilton Downtown Ambient Air Monitoring Site (Courtesy: Ontario MOECC)
To ensure analyses are not skewed by an overabundance of samples taken at the same point in space, repetitive coordinate points can be removed by filtering for unique locations only. Despite their many benefits, mobile units are resource intensive. They do not solve issues of inadequate spatial coverage over large communities, and are not suitable to providing spatio-temporal analyses of pollution patterns. Mobile monitors in use in Ontario are owned by the MOECC. Two are located in the Hamilton Region, one in the London Region. Several sophisticated units are located in the MOECC Resources Rd Laboratory in Toronto and are available by request for specific research projects.
While a municipality can request MOECC to conduct site specific monitoring, such requests are dependent on resource availability and suitability. Requests go to MOECC District Offices, and are passed along to MOECC Operations Division. Toronto Public Health has made several requests for site specific monitoring, but has never had a request successfully accepted.
Public Health Ontario (PHO) provides a system where public health units can borrow monitoring equipment for a set period of time. The PHO Environmental and Occupational Health Instrument Loan Program loans easy to use instruments with accompanying tip sheets on how to operate the monitors. Monitors are available to measure CO, Ammonia (NH₃), NO, NO₂, O₃, SO₂, Formaldehyde (CH₂O), PM, VOCs, Mercury (Hg) and UFPs. Consumables used by these monitors, such as memory cartridges or filters must be purchased separately by the health unit. Under unique circumstances, where monitoring equipment, PHO staff and the site in question are all in close proximity, PHO can undertake the monitoring exercise. This was the case regarding ML Ready Mix monitoring in South Etobicoke, Toronto.

21
Figure 4 Hamilton Region Mobile Monitor (Courtesy: Environment Hamilton)
Public Reporting of Air Pollution
There are at present two systems for publicly reporting on air quality levels in Ontario. The Province of Ontario reports the Air Quality Index readings and the federal government reports Air Quality Health Index reading from all Greater Toronto and Hamilton monitoring station locations (as well as from a number of other locations in Ontario such as Ottawa, Windsor and London for example).
Air Quality Index (AQI)
The ministry takes real-time air quality data from its AQI monitoring sites to produce Air Quality Index readings for each location. AQI readings are available on an hourly basis and reported out to media and the public.
If the AQI reading is below 16: the AQI is in the very good category If the AQI reading is in the range of 16 to 31: the AQI is in the good category If the AQI reading is in the range of 32 to 49, the AQI is in the moderate category If the AQI reading is in the range of 50 to 99, the AQI is in the poor category If the AQI reading is above 99, the AQI is in the very poor category
Air Quality Health Index (AQHI)
The readings from the above mentioned MOECC monitoring locations also feed into the Air Quality Health Index (AQHI) which was launched in select locations across Ontario starting in 2008. The AQHI was developed through a multi-stakeholder committee process involving the provinces, municipalities and members from the health and environmental non-government organization community.
The AQHI indicates the level of health risk associated with local air quality on a colour-coded scale ranging from 1 to 10+. The higher the number, the greater the health risk and hence the greater the need to take precautions. The AQHI provides different messages to those who are more sensitive to air pollution than to the general population. The index enables everyone to

22
take the appropriate actions to protect their health. Individuals can check the AQHI on a regular basis to find out how they can best be protected from air pollution.
The provincial Air Quality Index (AQI) reflects air quality relative to provincial standards, but was not developed to provide information about health risks. It reports on the air pollutant with the highest concentration, but does not take into consideration the combined effects of a variety of pollutants. In addition, the AQI was mainly developed to serve as a policy strategy for monitoring and reporting on air pollution levels in order to set and ensure provincial and federal air quality standards, while the AQHI was developed to help individuals assess and respond to potential air pollution impacts from their personal health perspective.
In 2015, Ontario will begin to transition away from AQI towards a complete AQHI network covering the entire province. Phase I (2015) will see Southern Ontario move to AQHI, followed by Central Ontario in 2016 and more northern regions in 2017.
3.3 Local Air Pollution Monitoring and Modelling in the GTHA
While the air quality monitoring stations in the GTHA provide some information on the air quality for the community as a whole it is not adequate to provide information on the variability of air quality conditions that can occur across a community. Air pollution levels can vary throughout a community depending on weather and how close you are to air pollution sources. Areas close to high traffic volumes and corridors and some industries and particularly areas in close proximity and/or downwind of such sources may also have higher air pollution levels then ambient levels at present monitoring stations. Historically, industrial sources were the greatest atmospheric health concern in urban areas. Due to the economic transition away from manufacturing industry, excessive land prices in and around cities that are prohibitive to heavy industry, and stringent regulation on industrial emissions, industrial point sources are not as damaging to health as they were in the past. Industrial facilities are governed by strict permitting and regulatory systems, and are required to report their emissions relative to their size and industrial capacity. They are still key emitters of certain pollutants that can have major local, regional and global effects. Industry is responsible for approximately 90% of SO2 emitted in southern Ontario, and for over 30% of NOx and PM2.5 emissions. For these reasons, together with increasing numbers of personal and freight vehicles across the region, a number of local governments have undertaken actions to enable them to have a better understanding of the local air pollution within their communities and the variability that exists within their communities.
Halton Region
The MOECC operates two air quality monitoring stations in southern Halton Region: one located in Burlington and the second located in Oakville. Due to inadequate air quality information and concerns related to growth in the northern part of the Region Halton Region installed a monitoring station in Milton on the Bishop Reding School. The continuous air monitoring data collected at this site is used to generate the Air Quality Health Index (AQHI) for residents in Milton and Halton Hills and real-time data is accessible from the Region’s air quality
23
web page: www.halton.ca/airquality. To facilitate research efforts, the Milton station measures the same five common air pollutants as MOECC’s local stations in Oakville and Burlington. This addition of the Milton monitoring station was part of a more comprehensive Air Quality Program in Halton Region that included:
Policy development that led to Regional Official Plan Amendments
Stationary air monitoring
Portable air monitoring
Air shed modelling
Education and outreach While the addition of the northern air quality monitoring station provided additional
information to Halton Region, monitoring was still limited spatially. In order to try and address this limitation Halton Region used air quality modelling to fill in the gaps between monitoring stations. A key result of this project was that modelling enabled Halton to answer “what if” questions. For example, how would air quality change due to an in modal shift on specific routes? The station is also used as an education and information tool to better understand how air pollution varies across the region and not just at select sites.
Region of Peel
MOECC operates two air monitors in Peel, one in Mississauga and one in Brampton. There are no air monitors within the jurisdiction of Caledon. Therefore, Peel Region also lacked a community-wide picture of air quality conditions and special variability across their region. Accordingly, the region has been implementing an air quality modelling and monitoring program since 2011. The goals of Peel Region’s modelling and monitoring program are to:
Better characterize air quality across Peel Region and the contribution of different sources and sectors;
Assess air quality impacts of population growth and demographics;
Assess air quality impacts due to land use and transportation policies;
Better inform municipal policy and program development;
Assess/predict health impacts of air quality and policies.
Region of Peel is focusing their efforts on modelling air pollution conditions and using mobile monitoring to test and validate modelling results. This is a five year program. So far, emissions and ancillary data have been compiled, and air quality models have been tested. Preliminary modelling results, lessons learned during emissions compilation and model development, and public health implications moving forward are now being examined by the Region. Additionally, as there is no air monitoring station in Caledon, passive air monitoring is being employed there for a multi-year examination of air quality in the Town.
City of Toronto (Toronto Public Health & Toronto Environment and Energy Division)
24
The City of Toronto was one of the first local governments to undertake modelling as a means to enable them to better understand the regional difference and local circumstances that would influence air quality in different parts of the City. Based on their efforts on air quality modelling the City of Toronto then brought their experiences and lessons learned to the Greater Toronto Clean Air Council and this resulted in an air quality modelling program involving 5 local governments that worked collaboratively to develop air quality modelling maps for the region. These efforts raised awareness of the potential for air quality modelling to improve policy and programming at the municipal and health unit scale of government. In addition, there was a desire to understand which communities were most impacted by air pollution and where interventions would have the likelihood to have the greatest health benefits for the greatest number of people.
Based on the understanding gained from air quality modelling the City of Toronto then began the process of developing neighbourhood air pollution studies to better understand air pollution at the neighbourhood level. The objectives of the Local Air Quality Studies included:
Identify sources and map the concentrations of 30 substances that have the most potential to impact neighbourhood air quality;
Determine which air contaminants are exceeding air quality standards (AAQC or CWS);
Assess the cumulative human health impacts of all 30 substances; and
Engage the community and work with them to identify community strategies to reduce exposure and improve resident health.
The first neighbourhood study focussed on the South Riverdale and Beaches neighbourhoods. The City worked in partnership with South Riverdale Community Health Centre to reach out to the community through a Neighbourhoods Acting on Air Quality (NAAQ) Project which aimed to:
Connect with the community to develop strategies for collective action for air quality improvements at the local neighborhood level;
Foster neighborhood action: connect people to actions, coordinate public communications and identify opportunities for involvement as a neighborhood;
Provide information for the general public on factors affecting air quality and methods of determining air quality;
Improve connections between existing municipal programs (i.e. Toronto Public Health, Toronto Environment and Energy Office) and the community by providing participant feedback and by centralizing information about the programs locally; and
Build on/synthesize overlapping partner objectives (i.e. building public awareness, fostering behaviour change and advocating for policy change)
The NAAQ project connected with the community via community outreach (movie nights, events, door to door) and a community advisory committee. Monitoring and modelling conducted through the project allowed residents to visualize the state of their air. Based on the interests of the community, a Leslieville/Riverdale Tree Project was developed that signed up residents for front and backyard tree plantings and energy efficient programs such as

25
Peaksaver. In 2014 the Etobicoke – Lakeshore neighbourhood study was undertaken and throughout 2014 and 2015 six additional studies covering 12 to 15 wards will be undertaken and integrated with data from local industrial emissions sources.
One of the key findings of the neighbourhood air pollution studies is the significant role transportation plays in impacting air pollution levels within a neighbourhood and the possible interventions that could be undertaken to try and address and mitigate those impacts in order to better protect public health. Additionally, the pollution impacts of providing a wider selection of transportation options, and not simply prioritizing personal motor vehicles, could result in improved health of residents and reduced health care costs. This goal has spurred Toronto Public Health to further research and advocate for policy opportunities to enable Toronto residents to better use active transportation as a means of getting to and from desired destinations in the safest and most efficient manner possible.
University of Toronto
The Southern Ontario Centre for Atmospheric Aerosol Research (SOCAAR) at the University of Toronto is an interdisciplinary centre for the study of air quality, with a focus on how aerosols impact human health and the environment. SOCAAR brings together medical personnel, atmospheric chemists and environmental engineers, and promotes collaborative research through access to state-of-the-art facilities and partnerships with government and industry. SOCAAR is equipped with a variety of measurement instrumentation:
The Field Measurement Facility is located in the University of Toronto’s Wallberg Building and samples and characterizes particles according to size and composition directly from the north side of 200 College Street. Instruments are capable of sampling a range of sizes from ultrafine to PM10, and can measure common air pollutants and a range of toxics ;
The Aerosol Chemistry Facility in housed within the Lash Miller Building of the Department of Chemistry and focuses on investigating atmospheric chemical processes; the Concentrated Ambient Particle Exposure Facility is located within the Gage Occupational and Environmental Health Unit and is used to study the health effects of ambient particulate matter on animals and humans.
The Engine Combustion and Emissions Facility located in the Mechanical Engineering Building specializes in research on the combustion of alternative fuels, including biodiesel, bio-oil, and biogas, methanol, natural gas, propane and hydrogen in spark ignition and diesel engines. The focus of the work is on reducing engine exhaust emissions.
MAPLE (Mobile Analysis of Particulate in the Environment) is a mobile sampling vehicle capable of measuring the spatial and temporal variations of ambient aerosol characteristics for common air pollutants. MAPLE’s mobile sampling platform is advantageous because it can provide a large pool of information about a designated geographical range, rather than stationary facilities, which only rely on a few locations. MAPLE can also be used to study atmospheric processes, map concentration distributions of aerosols, and determine the composition of emission sources and their influence on local and regional air quality.
26
In addition to the above mentioned facilities SOCAAR is also experimenting with new mobile and personal air pollution monitors that will be further explored in Part 2 of this Primer.
BioTox is SOCAAR’s cell culture and biochemistry facility. The laboratory provides facilities to study the in vitro and in vivo effects of air pollution exposure in a cellular, cell culture, and mouse animal models.
MetroLinx
As part of Metrolinx’s Ambient Air Monitoring and Reporting Plan, , GO Transit installed three Air Quality Monitoring (AQM) stations along the rail corridor. The three stations are located at:
Weston (Station 35021): the site of the new Weston GO station parking lot (Weston Road south of Lawrence Avenue) – installed February 2011
Junction (Station 35020): the north side of Wallace Avenue near Dundas Street West – installed September 2011 Strachan (Station 35022): the site between the Kitchener (formerly Georgetown) and Lakeshore rail corridors east of Strachan Avenue – installed January 2012
All three AQM stations continue to monitor NOX & NO2, PM2.5, acrolein, benzo(a)pyrene
and benzene. Data is sent to the MOECC for review prior to making it publicly available in the form of a report that details locations of emissions of concern, overall station operations, statistical summaries, pollution and wind roses, and an evaluation of the effects on monitoring results by abatement actions.
Clarkson Airshed Study
The Clarkson area is bounded by the QEW to the north, Winston Churchill Boulevard on the west and Southdown road on the east and Lake Ontario on the south. This area has experienced residential and commercial development in an area that was highly industrial. The study was initiated in 2000 in response to numerous complaints from residents and monitoring data for PM10 which suggested air pollutant levels may be elevated in the area in comparison to ambient levels. The first steps consisted of identification of industrial emitters, the siting of air monitoring equipment, developing an air emissions inventory, and air dispersion modelling. Sources included local industry, transportation routes, residential communities and long-range transport. The second part was an ambient air monitoring study that was conducted over a 22 month period at six locations within and around the area (no longer reporting). Pollutants targeted include TSP, PM10, PM2.5, NO, NO2 and VOCs. The third phase was an air shed modelling exercise to determine contributions and impacts from each source identified in phase 1. The fourth phase which began in 2007 and continues until present entails the implementation of abatement programs for 57 major emitters to reduce emissions of targeted pollutants and to develop and maintain an industry self-monitoring program in the airshed. The Clarkson Airshed Industrial Association (CASIA) still monitors air quality, with data quality controlled by MOECC.

27
City of Hamilton
Clean Air Hamilton is a multi-stakeholder group “committed to improving citizen’s health and quality of life through communication and promotion of realistic science-based decision making and sustainable practices”. It is made up of members from industry, MOECC, Environment Canada, City of Hamilton staff, several citizens and a few academics from McMaster University. Between 2004 –2009 they undertook a mobile air monitoring project using a MOECC mobile unit equipped to monitor the five common CACs. The unit was also equipped with a GPS to allow air monitoring results to be mapped. Mobile monitoring was conducted in neighbourhoods and schools, along roadways and downwind of industrial emission sources. This mobile monitoring study has provided Clean Air Hamilton with a picture of how air quality can vary across the community from one neighbourhood to another, from one time to another and from one traffic corridor to another. Results from this project demonstrated that high volume roadways and intersections can be associated with the largest variability and elevated levels of air pollution. The mobile monitoring unit also allows Clean Air Hamilton to understand air pollution levels over an area during weather inversions.
Because of the agglomeration of heavy industry situated in Hamilton, in addition to the above project and the three MOECC air monitors in the City of Hamilton there is also the Hamilton Air Monitoring Network (HAMN) which represents a number of industries carrying out air quality monitoring as per the MOECC’s Source Emissions Monitoring (SEM) program. The Network is industry funded. HAMN plays a role in helping to determine where progress is occurring and identifying areas requiring attention. The HAMN program encompasses operation of the samplers and monitoring network, laboratory analysis of the air samples, and quality assurance activities. It is HAMN’s responsibility to provide the MOE with access to real-time data and notification of exceedences (AAQC’s) The MOE reviews data reports and carries out analysis to assess trends in air quality.

28
Figure 5 Hamilton Air Monitoring Network Screenshot
Member industry companies are provided with real-time web-based access for all current and historical data. HAMN provides the MOE with real-time access to all continuous monitoring data and provides quarterly data summary reports for all continuous and non-continuous data, as well as notification of exceedances of standards (AAQC’s). Annual reports are made publicly available online.
Pan Am and Parapan Am Games Air Monitoring Actions
As part of the 2015 Pan Am and Parapan Am Games, in addition to the creation of an extensive metorological forecasting mesonet, AQHI forecasts will also be more geographically focussed, using six temporary locations in Toronto and two in Hamilton. This will greatly enhance the AQHI model resolution for the region. Additionally, forest fire smoke modelling, roadside ultrafine monitoring and the mapping of traffic related air pollution will occur. It is unlikely these stations will remain in operation after completion of the games in the fall of 2015. Additionally, the UofT SOCAAR team will be using four air monitoring stations in Toronto to build a map of street level pollution on and near roadways, and combining the results with epidemiological data to provide a high resolution picture of pollution in the City.
3.4 Air Monitoring in Other Jurisdictions and Regions
In addition to the monitoring and modelling efforts active in the Greater Toronto and Hamilton area there are other local and regional jurisdictions whose activities can serve to further understanding, offer lessons learned and provide examples and opportunities for collaboration and furthering progress on air pollution monitoring within the GTHA.
City of Ottawa
29
In the late 2000s the City of Ottawa identified the need for a more accurate understanding of air quality in their Air Quality and Climate Change Management Plan. At that time, the National Capital Region (over 2700km2) had one monitoring station that generated limited data for studies and environmental assessments. The City of Ottawa subsequently requested a second AQI monitoring site which was provided by the Province of Ontario. Further work was then undertaken that included the use of satellite data and air monitoring data collected from four permanent sites, as well as 8 mobile monitoring units within the two cities (Ottawa and Gatineau).
A number of orbiting satellites allow for remote sensing of pollutants. These include AURA, TERRA AQUA, ENVISAT, METOP and GOES. They are capable of estimating concentrations of NO2, PM, SO2, CO2 and Methane (CH4), although they are most successfully employed for PM2.5
and NO2. In Ottawa, ground monitoring was used to verify and support the satellite data used to monitor the National Capital Region. The project demonstrated the usefulness of satellite data for providing baseline data at the regional level and provided the City of Ottawa with a comprehensive baseline that the City is using to monitor air quality and pollutants over time.
Following this project the City of Ottawa purchased two mobile monitors to refine the ongoing satellite monitoring technology. It is important to note that while satellites can provide comprehensive pollution mapping of an urban area, a number of concerns exist. Satellite estimate must be ground-truthed and correlated with actual measurements taken on the ground. This is also an expensive undertaking, involving external consultants, which is cost-prohibitive for municipalities. This project was 50% funded for one year through Natural Resources GeoConnections program which no longer operates.
California, United States
The California Air Resource Board is responsible for monitoring the regulatory activity of California's 35 local air quality districts. Each district has its own regulations but we will highlight one of the 35 air quality districts in order to provide an example of a regional air pollution agency that works to coordinate air pollution activities.
The Bay Area Air Quality Management District is a public agency entrusted with regulating stationary sources of air pollution in the nine counties that surround San Francisco Bay. Their Air Monitoring Program operates and maintains a 27 station monitoring network, including necessary repair, maintenance, and quality control activities. The monitoring network provides data required to determine attainment status of both National and State ambient air quality standards. Additionally, a network of toxics monitors collect data to ensure permit conditions are met, for State and National programs. Sampling projects in specific communities, including PM2.5 speciation sampling and other short-term studies provide data for the development of Clean Air Plans, new and modified regulations, and further understanding of air quality in the Area. Two portable air monitors are placed in communities of interest for 1-2 years, to compare local air samples with those from the monitoring networks.
There are nine counties in the San Francisco Bay Area which form a regional air basin, sharing common geographical features and weather patterns, and therefore similar air pollution burdens, which cannot be addressed by counties acting on their own. The Air District

30
is governed by a 22-member Board of Directors composed of locally elected officials who oversee policies and adopt regulations for pollution control. The Air District is assisted by an Advisory Council of community, health, environmental, and other organizations. An independent Hearing Board adjudicates regulatory compliance issues and also hears appeals of permitting decisions.
Of great interest is their Community Air Risk Evaluation (CARE) program which was initiated in 2004 to evaluate and reduce health risks associated with exposures to outdoor toxic air contaminants, and moves beyond the stationary sources regulated by the Bay Area Air Quality Management District. Goals of the CARE Program are to:
Identify areas within the Bay Area where air pollution is the greatest contributor to health impacts and where populations are most vulnerable to air pollution impacts;
Apply sound science and robust technical analyses to design and focus effective mitigation measures in areas with highest impacts; and
Engage the communities and other stakeholder groups in the program and develop productive relationships with local agencies to craft mitigations that extend beyond what the Air District could do alone
The program examines emissions from point, area and on-road and off-road mobile sources with an emphasis on diesel exhaust, which is a major contributor to airborne health risk in California. It was developed to address the needs of communities where air pollution was consistently relatively high and corresponding health impacts were elevated. The Community Air Risk Evaluation (CARE) program represents an effort to reduce health disparities linked to air quality. The program has brought together government, communities and business in an effort to understand and address localized areas of elevated air pollution and its adverse health impacts on communities.
3.5 Summary
There are a number of monitoring efforts underway in southern Ontario. All orders of government are engaged in pollution monitoring at some level. Due to inadequate spatial coverage of modelling from higher orders of government, municipalities with available resources undertake their own monitoring. Currently, there are many methodologies and technologies employed, with a range of monitoring equipment being utilized and inconsistent data formats for monitoring outputs.
Stationary versus Portable Monitoring
The federal and provincial monitoring programs described in this section employ stationary monitors which are used to generate long-term, regional air quality information. The local monitoring programs described generally use site-specific monitors to produce short-term, local data. Stationary monitors are invaluable in providing high level environmental performance information over extended time periods and even generations. Site specific monitoring on the other hand can respond to more short-term, project or policy-specific research questions.

31
Perrotta & Associates (2010) reviewed air monitoring as a tool to assess and address local airsheds and micro-environments in Ontario. As part of this work, staff in six health units were interviewed, in addition to staff in municipalities and other orders of government with expertise in the area of environmental health. Staff unanimously felt there was a great deal of interest in assessing variations in air quality within communities. However, municipal and health unit staff did not envision complex monitoring networks where many air monitors would be stationed in locations for long periods of time. Rather, and with exceptions, they foresaw a more nimble system, where monitoring equipment would be used for limited timeframes to inform processes related to specific health unit or municipal tasks, such as land use planning decisions, policy development or environmental assessments.
Supplementing the work of Perrotta & Associates, to better understand how air quality monitoring and modelling can be better integrated into policy and decision making, in 2014 Clean Air Partnership held consultations with municipalities and health units in the GTHA. At that time, stakeholders were able to provide updated feedback on the 2010 Perrotta & Associates report. This feedback has been used in part to inform the remaining sections in this chapter.
It was noted by a number of key stakeholders that it would be useful to have additional access to mobile monitoring equipment, especially for areas where there are large air quality monitoring gaps at present and where there is significant growth expected and/or existing or proposed air quality emissions/concerns. The use of mobile monitors is often cited as a realistic and cost-effective way to gather the data and information that can enable an assessment of point sources, hotspots, or around traffic corridors, land development application sites or specific cases like drive-through restaurant assessments.
Roles and Responsibilities
Roles and responsibilities are complicated with regard to air pollution monitoring. Many local governments monitor pollution due to the absence of another level of government completing this work. The provincial government has a role to play because of their responsibility for air quality issues, transportation planning at the provincial and regional level and their regulation of point sources. The federal government has responsibility for transboundary air pollution, rail lines, airports and federal policies and regulations that impact air pollution levels.
Local governments undertaking air quality monitoring have benefitted from the support and expertise from other levels of government. MOECC and Environment Canada have air monitoring and modelling expertise and capacity while most municipalities do not. However MOECC and Environment Canada recognize that municipalities must have meaningful involvement in this work because they have responsibility for policy development as it relates to the urban environment.
Regarding monitoring of emissions at specific industrial locations, monitoring is required as part of reporting requirements into the Environment Canada National Pollutant Release Inventory (NPRI). This reporting is mandatory under the Canadian Environmental Protection Act, 1999. If one or more NPRI substances is manufactured, processed or otherwise used at a

32
facility in a calendar year, and the total number of hours worked at the facility exceeded the 20 000 hours (approximately 10 full-time employees), facility owners need to determine and report the total amount of each NPRI substance emitted during that year. Regardless of employee hours, any facility operating stationary combustion equipment must report for criteria air contaminants if the release thresholds are met. Industries that typically report to the NPRI include wastewater facilities; oil and gas facilities; chemical, plastic and paint manufacturers; manufacturers of wood products; metal fabricators; wood preservation facilities; metal plating facilities; military bases; pulp and paper mills; power stations; cement and lime manufacturers, and hospitals. NPRI reporting uses a combination of modelling and monitoring which must be undertaken at cost to the facility operator. Monitoring is undertaken at less frequent intervals than modelling. Based on monitoring data combined with amounts of manufacturing inputs used, modeled estimates can be provided to the NPRI (Environment Canada, 2015).
Site specific air monitoring is also required by MOECC as part of the Environmental Assessment (EA) process under certain circumstances. The Environmental Assessment Act sets out a process to consider environmental effects before a project begins. Projects covered by the act include major infrastructure projects, such as road construction, transit projects, waste management projects, waste water projects etc. Through compliance and effects monitoring, proponents must demonstrate that they have complied with commitments made in the EA and with the conditions of approval. As part of the effects monitoring that is undertaken after EA approval, the Ministry can require air quality or emissions monitoring to demonstrate compliance. Similarly, at a federal level, the Canadian Environmental Assessment Act has similar requirements at a federal level. Canada and Ontario have signed an agreement on EA coordination to minimize duplication.
4 The Future of Air Quality Monitoring in the GTHA
Responding to the shortcoming in spatial coverage provided by current monitoring efforts, a number of academic researchers, social entrepreneurs and private enterprises have sought to close this gap. Academic communities have focussed on creating and deploying their own networks of monitors, while social and private entrepreneurs are attempting to close this gap through the provision of more cost effective monitoring technologies. Many of these research efforts and new technologies are in their relative infancy, and as such, have various disadvantages. Some of these research networks and emerging technologies will now be described individually.
4.1 Academic Studies Enhancing Spatial Coverage of Pollutant Monitoring
University of Toronto (UofT) - SCULPT
The engagement of community members to enhance air quality monitoring is an exponentially expanding field offering the potential for a broader monitoring network with

33
many more sampling points. This can empower researchers and policy makers, while also fostering greater community engagement around health, air quality and the importance of local air quality information. The Southern Ontario Centre for Atmospheric Aerosol Research (SOCAAR) in the Department of Chemical Engineering & Applied Chemistry at the University of Toronto (UofT) is conducting the SCULPT air quality monitoring study (Spatial Characterization of Ultrafine Particles in Toronto). The study will investigate the impact of traffic by measuring UFPs, black carbon, and at different sites across Toronto, creating a map to highlight the spatial variance in these pollutants. Community members are being recruited to establish a monitoring network on private properties across the City for two week periods. Participants will document when they cooked, smoked, drove or operated a fireplace, clothes dryer, barbeque or lawn mower while the instruments are in place.
UofT - Near Road Monitoring Pilot Study
Another SOCAAR study ongoing at UofT aims to increase knowledge of traffic-related pollutant concentrations near major roadways. Observing that approximately 2, 4 and 10 million Canadians live within 50 m, 100 m and 250 m of major roads, this study will capture near-road pollutant measurements to understand how vehicle emissions affect overall air quality, and to track the results of technological engine advancements over time. Since 2013, a near roadway monitoring network pilot study has been evaluating differences between regional and near-road data to estimate traffic-related pollutant concentrations. The monitoring sites in Toronto are; urban (SOCAAR’s main lab), Highway 401 (MOECC site), and two suburban near road sites (Toronto Island and York University). This research will improve the understanding of the relationships between traffic-pollution exposure and health, and support the development of policy tools to mitigate health impacts.
MIT – CLAIRITY
The mission of this project is to assess the exposure of the MIT campus population to airborne pollution. This mission stems from the goal of an MIT Department of Civil and Environmental Engineering undergraduate course, where students are charged with bringing the idea of a ‘smart city’ to the MIT campus. CLAIRITY involves the design and implementation of a distributed air quality sensor network consisting of 24 nodes covering both indoor and outdoor locations. Locations were chosen based upon the constraints of the sensor nodes – such as power and Ethernet availability, while ensuring spatial representation across campus.
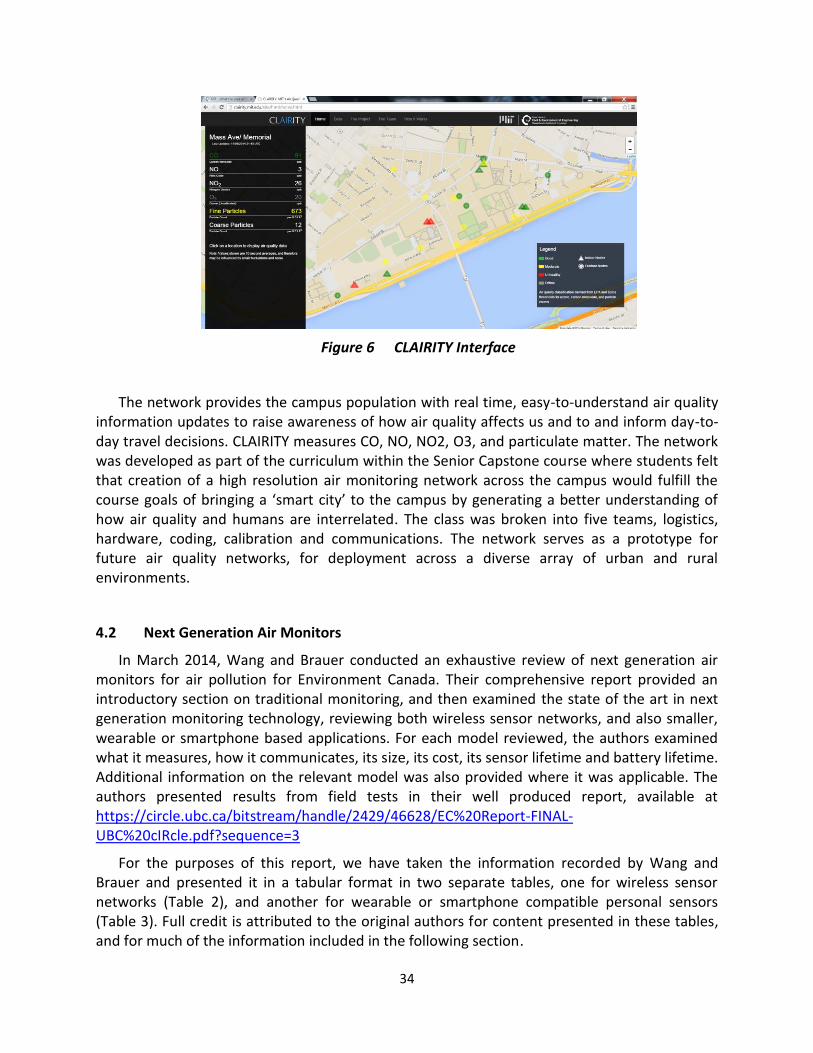
34
Figure 6 CLAIRITY Interface
The network provides the campus population with real time, easy-to-understand air quality information updates to raise awareness of how air quality affects us and to and inform day-to-day travel decisions. CLAIRITY measures CO, NO, NO2, O3, and particulate matter. The network was developed as part of the curriculum within the Senior Capstone course where students felt that creation of a high resolution air monitoring network across the campus would fulfill the course goals of bringing a ‘smart city’ to the campus by generating a better understanding of how air quality and humans are interrelated. The class was broken into five teams, logistics, hardware, coding, calibration and communications. The network serves as a prototype for future air quality networks, for deployment across a diverse array of urban and rural environments.
4.2 Next Generation Air Monitors
In March 2014, Wang and Brauer conducted an exhaustive review of next generation air monitors for air pollution for Environment Canada. Their comprehensive report provided an introductory section on traditional monitoring, and then examined the state of the art in next generation monitoring technology, reviewing both wireless sensor networks, and also smaller, wearable or smartphone based applications. For each model reviewed, the authors examined what it measures, how it communicates, its size, its cost, its sensor lifetime and battery lifetime. Additional information on the relevant model was also provided where it was applicable. The authors presented results from field tests in their well produced report, available at https://circle.ubc.ca/bitstream/handle/2429/46628/EC%20Report-FINAL-UBC%20cIRcle.pdf?sequence=3
For the purposes of this report, we have taken the information recorded by Wang and Brauer and presented it in a tabular format in two separate tables, one for wireless sensor networks (Table 2), and another for wearable or smartphone compatible personal sensors (Table 3). Full credit is attributed to the original authors for content presented in these tables, and for much of the information included in the following section.

35
Next Generation Wireless Sensor Networks
Geotech AQMesh
AQMesh is a wireless ‘near real time’ air quality monitor that measures main air pollution gases. It is a high sensitivity (ppb) air pollution monitoring system designed to work through a network of arrayed monitors to measure NO, NO2, O3, CO, SO2, humidity and atmospheric pressure. Specific applications of this technology include vertical profiling of pollution, street canyon studies, traffic pollution monitoring, airport and industrial fenceline monitoring. It is easy to install, battery powered and wireless, and able to form large or small networks - from single units to hundreds of units. Data is automatically downloaded and saved to a secure server, which can be accessed over the web. Costs range from $5,500 - $9,000 per unit.
Figure 7 Geotech AQMesh
Libelium Waspmote Plug & Sense
This monitor is versatile in that it allows for easy changing of sensor probes by unscrewing them and replacing them, allowing for easy maintenance and options to monitor different pollutants. It is powered by either an external solar panel, or a built in one. The unit also has a rechargeable battery from which it draws power when there is no solar power available. This model is ideal for streetlight or storefront installation. Up to 60 different sensors can be installed to monitor a range of pollutants, including common air pollutants, ammonia, ethanol, toluene, temperature, humidity, atmospheric pressure and many more. Costs range from $1,660 - $3,780 per unit.

36
Figure 8 Libelium Waspmote Plug & Sense
Cairpol CairNet
Cairpol produces this modular system consisting of sensors (CairSens), networked into a wireless communications module (CairNet). A non networked version (CairTub) is also available. Sensors cost $60 - $1,400 depending on the desired configuration of pollutants to be measured. The communications module costs $1,100-$2,800. A fully operational network of 10 CairNets monitoring O3, NO2 and CO would cost $5,400.
Figure 9 Cairpol CairNet
Smart Citizen
Smart Citizen is a platform that allows for participatory data collection around air quality (CO2, NO2), humidity, light intensity and noise pollution. The objective of Smart Citizen is to serve as a ‘node for building productive and open indicators, and distributed tools, and thereafter the collective constriction of the city for its own inhabitants’. The project uses geolocation and web connections, and provides free software for data collection. The Smart Citizen Kit costs $175, and consists of a Arduino compatible Data-Processing Board, Ambient Board, SCK enclosure, SCK Solar panel charger, Free web platform registration, iOS application for SCK and a Private RESTful API Key.

37
Figure 10 Smart Citizen data processing board and enclosure
Air Quality Egg
The Air Quality Egg is a sensor system designed to allow anyone to collect very high resolution readings of NO2 and CO concentrations outside of their home. These two gases are the most indicative elements related to urban air pollution that are sense-able by inexpensive, DIY sensors. The standard egg costs $200. You can upgrade the Air Quality Egg with sensors for O3 ($25), VOC's ($25), radiation ($60), and particulates ($40).
Figure 11 Air Quality Egg
Envirologger CO2
The Envirologger CO2 wireless system uses a COZIR optical sensor which measures ambient CO₂ levels with accuracy and stability in the range of 0 - 2,000 or 0 - 5,000 ppm or 0 - 1%, plus temperature and humidity (optional) and transmits the information wirelessly to an Envirologger internet gateway which stores the data on a cloud server and sends it in real time to your desktop, tablet or smart phone. Up to 50 sensors can be connected to each gateway and multiple gateways can be linked to provide a scalable solution for almost any application. CO2 sensors can be located up to 2km from the gateway even in a built up area and up to 20km if you have line of sight between the transmitter and gateway antennae. The sensors and

38
gateway run from a 12V transformer, or can be run on a batteries and/or small solar panel (optional) where mains power is unavailable. Costs for each node are $830, plus $550 for a transceiver, $3000 for a gateway, and $440-660 for annual gateway fees.
Figure 12 Envirologger CO2
Next Generation Wearable or Smartphone Compatible Personal Sensors
CitiSense
CitiSense was developed by University of California, San Diego. The device detects O₃, NO₂ and CO. The monitors communicate through your smart phone, providing real time data across the web that can be accessed either through a computer or through a smart phone app. CitiSense includes the design of a complete system that addresses issues of mobile power management, data security, privacy, inference with commodity sensors, and integration into a highly extensible and adaptive infrastructure comprising of Open Rich Services. Sensors in the system can be either stationary or mobile (worn on a user). Sensors currently cost $1000, however, production numbers are low and it is anticipated that costs will fall considerably with greater production.
Sensorcon Sensordrone
Sensordrone allows for smartphones to be used as communications hubs to upload air quality information from a small, memory-stick sized precision gas sensor. This is achieved through Bluetooth technology. Currently, the Sensordrone is calibrated for CO or CO2, and can also be used to detect reducing gases (like methane and propane), oxidizing gases (chlorine and ozone), temperature, humidity, light, pressure and many other characteristics. Prices start at under $100 for the basic ambient CO2 sensor, to $199 for the more advanced model which can monitor several gases and meteorological conditions also.
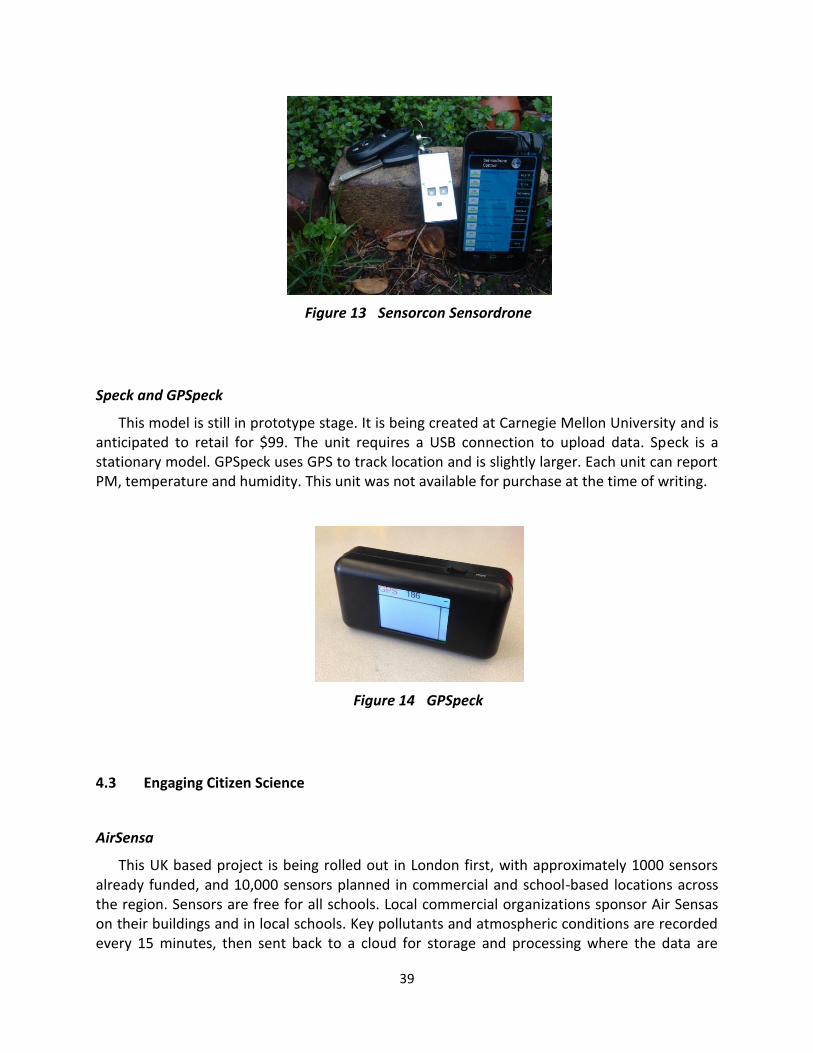
39
Figure 13 Sensorcon Sensordrone
Speck and GPSpeck
This model is still in prototype stage. It is being created at Carnegie Mellon University and is anticipated to retail for $99. The unit requires a USB connection to upload data. Speck is a stationary model. GPSpeck uses GPS to track location and is slightly larger. Each unit can report PM, temperature and humidity. This unit was not available for purchase at the time of writing.
Figure 14 GPSpeck
4.3 Engaging Citizen Science
AirSensa
This UK based project is being rolled out in London first, with approximately 1000 sensors already funded, and 10,000 sensors planned in commercial and school-based locations across the region. Sensors are free for all schools. Local commercial organizations sponsor Air Sensas on their buildings and in local schools. Key pollutants and atmospheric conditions are recorded every 15 minutes, then sent back to a cloud for storage and processing where the data are

40
prepared for use in free real time apps. The equipment comes in two versions: AirSensa A, which is wired into an electrical supply, and AirSensa B, which is solar-powered.
The AirSensa network uses unique sensor technology linked through a powerful cloud software platform. While it is funded by the private sector, it is developed through university research partnerships with support from the Department of the Environment, Food and Rural Affairs and the Greater London Authority. The program provides education materials for every school.
Figure 15 AirSensa Monitor
Float
FLOAT is a collaborative, community-oriented project centred on mapping air quality in Beijing. Through this crowd-funded project, participants fly simple but technologically advanced kites which sense pollutants in the air gathering air quality information. Sensors on the kites detect CO, PM and VOCs. Levels of these pollutants are displayed via LED lights that change in color (green, yellow, red), so during flights, participants can see how pollution levels change at increasing altitudes. For $200, participants get a compiled book about the project, with data visualizations, information on how to build the air sensing module, mappings and information about urban health and air quality, as well as a handmade kite with a built in air quality module and a short documentary DVD about the project. FLOAT is not intended to gather robust data about air quality, rather it is meant to spark and initiate dialogue on urban environmental health issues, allowing community members to map and record their findings and to hopefully influence policy.

41
Figure 16 FLOAT Kite with LED (Courtesy: Storify.com)
Elm
Elm monitors outdoor air quality using a nano-technology sensor in real time, wirelessly transmitting the data to a cloud-based system for storage, analysis and processing. The hardware and software solution is designed to seamlessly integrate with municipal analytic platforms for easy adoption and simple ongoing operation. Elm can be installed with minimal effort and requires limited maintenance. Elm nodes do require a direct power source, but can transmit data wirelessly every 20 seconds by wifi or GSM to a cloud server. Elm sensors can record NO2, O3, PM, VOCs, noise, temperature and humidity. Reports are available to the public through the Elm website.
Figure 17 Screenshot of Elm Data Portal
AirBeam
Arduino-powered AirBeam monitors record PM 2.5. AirBeams feed data to the AirCasting platform. AirCasting is a platform to record, map and share heath and environmental data. A number of other devices can feed information to the AirCasting platform, including noise, temperature, humidity, CO, NO2, heart rate, heart rate variability, breathing rate, activity level, peak acceleration and core temperature measurements. Wearable LED technologies allow for public indication of air quality. Personal, custom designed sensors can be connected to the AirCasting app. Both the accessories, and the AirBeam itself connect to an Android based smartphone by Bluetooth.
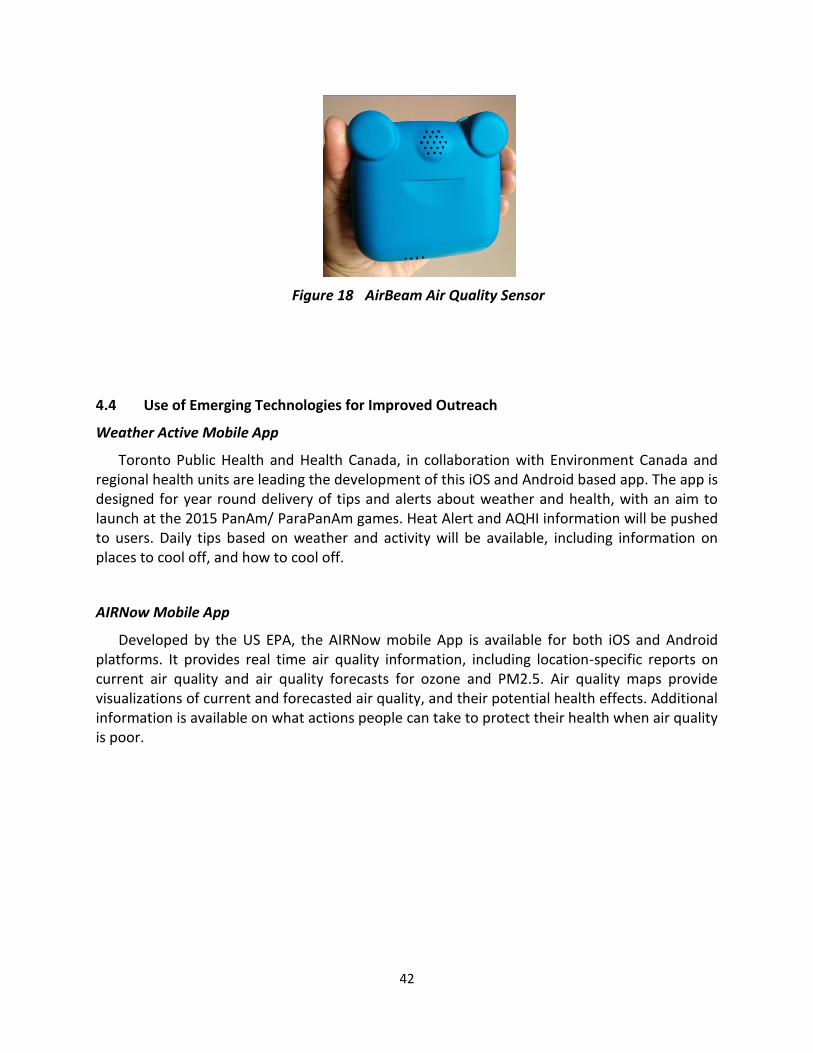
42
Figure 18 AirBeam Air Quality Sensor
4.4 Use of Emerging Technologies for Improved Outreach
Weather Active Mobile App
Toronto Public Health and Health Canada, in collaboration with Environment Canada and regional health units are leading the development of this iOS and Android based app. The app is designed for year round delivery of tips and alerts about weather and health, with an aim to launch at the 2015 PanAm/ ParaPanAm games. Heat Alert and AQHI information will be pushed to users. Daily tips based on weather and activity will be available, including information on places to cool off, and how to cool off.
AIRNow Mobile App
Developed by the US EPA, the AIRNow mobile App is available for both iOS and Android platforms. It provides real time air quality information, including location-specific reports on current air quality and air quality forecasts for ozone and PM2.5. Air quality maps provide visualizations of current and forecasted air quality, and their potential health effects. Additional information is available on what actions people can take to protect their health when air quality is poor.

43
Figure 19 Weather Active Mobile App
Figure 20 AirNow App Screenshot
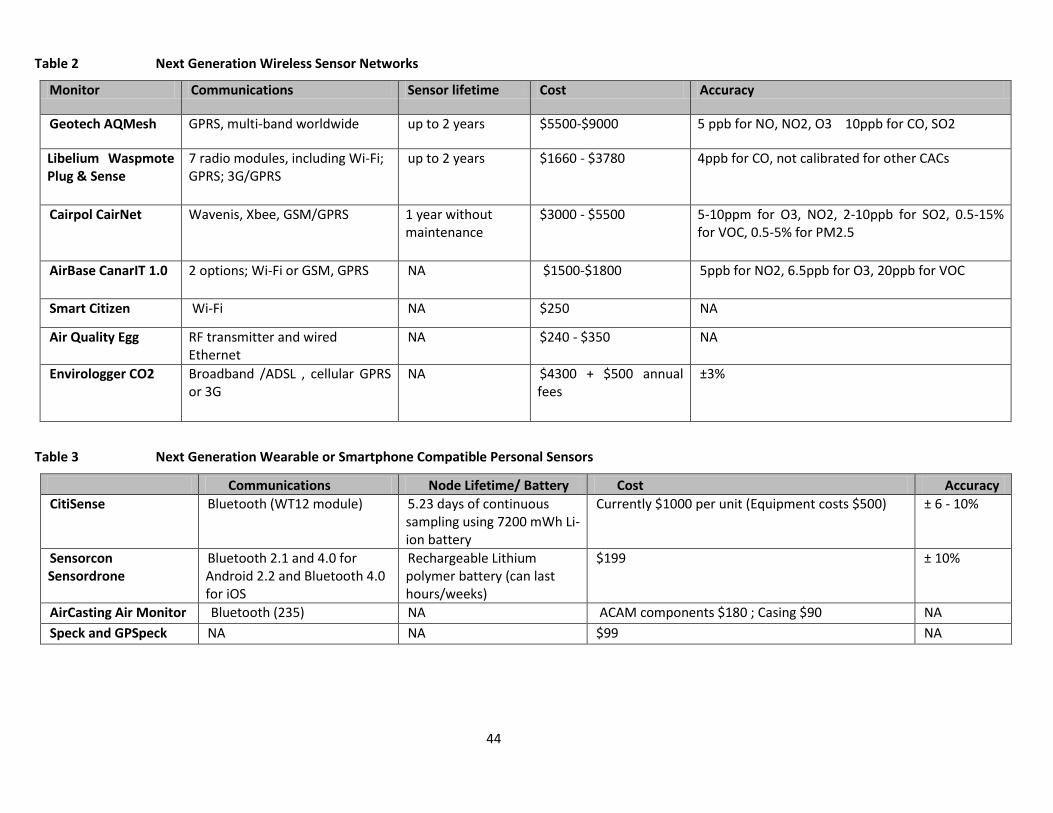
44
Table 2 Next Generation Wireless Sensor Networks
Monitor Communications Sensor lifetime Cost Accuracy
Geotech AQMesh GPRS, multi-band worldwide up to 2 years $5500-$9000 5 ppb for NO, NO2, O3 10ppb for CO, SO2
Libelium Waspmote Plug & Sense
7 radio modules, including Wi-Fi; GPRS; 3G/GPRS
up to 2 years $1660 - $3780 4ppb for CO, not calibrated for other CACs
Cairpol CairNet Wavenis, Xbee, GSM/GPRS 1 year without maintenance
$3000 - $5500 5-10ppm for O3, NO2, 2-10ppb for SO2, 0.5-15% for VOC, 0.5-5% for PM2.5
AirBase CanarIT 1.0 2 options; Wi-Fi or GSM, GPRS NA $1500-$1800 5ppb for NO2, 6.5ppb for O3, 20ppb for VOC
Smart Citizen Wi-Fi NA $250 NA
Air Quality Egg RF transmitter and wired Ethernet
NA $240 - $350 NA
Envirologger CO2 Broadband /ADSL , cellular GPRS or 3G
NA $4300 + $500 annual fees
±3%
Table 3 Next Generation Wearable or Smartphone Compatible Personal Sensors
Communications Node Lifetime/ Battery Cost Accuracy
CitiSense Bluetooth (WT12 module) 5.23 days of continuous sampling using 7200 mWh Li-ion battery
Currently $1000 per unit (Equipment costs $500) ± 6 - 10%
Sensorcon Sensordrone
Bluetooth 2.1 and 4.0 for Android 2.2 and Bluetooth 4.0 for iOS
Rechargeable Lithium polymer battery (can last hours/weeks)
$199 ± 10%
AirCasting Air Monitor Bluetooth (235) NA ACAM components $180 ; Casing $90 NA
Speck and GPSpeck NA NA $99 NA

45
Good Neighbour Campaigns - Toronto Environmental Alliance
Good Neighbour Campaigns (GNCs) have been used for over a decade by the Ohio Citizen Action group. These campaigns foster relationships between community members and local industry, improving lines of communication and breaking down barriers that impede communication between industrial neighbours and community members. In the Greater Toronto and Hamilton area, the Toronto Environmental Alliance (TEA) has used GNCs to improve relationships and living conditions for communities and industry in several locations across the region.
Where necessary, TEA will coordinate additional air quality or odour monitoring around point sources. This was the case during the Atlantic Packaging GNC in Toronto, where the Ontario Ministry of the Environment and Climate Change undertook a five day mobile air quality monitoring study around Atlantic Packaging’s Scarborough facility. Using a Trace Atmospheric Gas Analyzer (TAGA) device, they measured for Total Reduced Sulphur, Hydrogen Sulphide, and Volatile Organic Compounds (VOCs), determining that there were no evident health impacts and only a slight potential for odour issues. As part of their Odour Audit, Atlantic Packaging hired consultants to sample VOCs, confirming that previously reported figures were indeed correct. Through the GNC project, hexachlorobenze testing was also carried out on the TORBED incinerator stacks, demonstrating that emissions, at 1g/year were well below what was previously modeled and reported to the National Pollutant Release Inventory (263g/year).
4.5 Summary
There currently exists a range of new and innovative monitoring networks that are being studied at an academic level. Many of these involve the creation of specific sensors for individual pollutants. How these networks could be broadened to cover entire neighbourhoods or even urban areas remains to be seen. However, there exists a rapid rate of advancement in research, and it will be a matter of time before this is reflected in market availability of new monitoring products. Concurrently, social and private enterprises have resulted in a considerable array of new monitoring technologies making it to market. There exists great variation in the costs of these monitors, from under $100, to $9000. Similarly, there exists a great range in the degree of precision offered by these monitors. Careful consideration must be given when deciding on the trade-off between precision (which comes at a higher cost), and greater spatial coverage.
Complementing the increased availability and affordability of monitoring equipment, there has been a proliferation of smartphone based apps to assist health agencies in disseminating messaging to their populations. Governments and health providers will be tasked with responding to this proliferation of information and outreach. As soon as these technologies become more widely tested and available, they may offer community organizations more opportunities to conduct their own monitoring to gather evidence in support of local health and environmental concerns.
To validate and respond to this occurrence, health units such as Toronto Public Health will require access to such equipment in order to help in investigating local concerns and complaints, track changes in air quality associated with various projects and pollution prevention efforts, and to validate predictions from air quality modelling efforts as well as

46
measurements that may be collected by the community. Being proactive on this front, at its meeting of April 28, 2014, the Toronto Board of Health recommended that the City of Toronto, including Toronto Public Health, convene a series of roundtables to design a collaborative air monitoring strategy for Toronto. This report has sought to present the current state of knowledge around monitoring in the GTHA to serve as a primer for roundtables to commence in early 2015.
5 References
Akbari H, Pomerantz M, Taha H (2001) Cool surfaces and shade trees to reduce energy use and improve air quality in urban areas. Solar Energy 3: 295-310
Brook RD et al. (2004). Air pollution and cardiovascular disease: a statement for healthcare professionals from the Expert Panel on Population and Prevention Science of the American Heart Association. Circulation. Vol. 109: 2655-2671
Brook RD et al. (2010). Particulate Matter, Air Pollution and Cardiovascular Disease: An Update to the Scientific Statement from the American Heart Association. Circulation. Vol. 121: 2331-2378Brown JS, Bateson TF, McDonnell WF.2008. Effects of exposure to 0.06 ppm ozone on FEV1 in humans: a secondary analysis of existing data. Environmental Health Perspectives 116, 1023-1026.
Brown, J. S., Bateson, T. F., & McDonnell, W. F. (2008). Effects of exposure to 0.06 ppm ozone on FEV1 in humans: a secondary analysis of existing data. Environ Health Perspect, 116(8), 1023-1026.
Brugge D, Durant and Rioux, (2007). Near-highway pollutants in motor vehicle exhaust: A review of epidemiological evidence of cardiac and pulmonary health risk, Environmental Health. No. 6. August.
Canadian Medical Association (2008). No Breathing Room: National Illness Costs of Air Pollution. Canadian Medical Association, Ottawa, 2008.
California Air Resources Board (CARB) and California Environmental Protection Agency (CalEPA). (1997). Air Quality and Land Use Handbook: A Community Health Perspective.
Clark, L. P., Millet, D. B., & Marshall, J. D. (2014). National patterns in environmental injustice and inequality: outdoor NO2 air pollution in the United States. PloS one, 9(4), e94431.
Environmental Protection Agency (2014) Risk Assessment for Toxic Air Pollutants: A Citizen’s Guide. http://www.epa.gov/ttn/atw/3_90_024.html
Environment Canada (2015). National Pollutant Release Inventory http://www.ec.gc.ca/inrp-npri/default.asp?lang=En&n=4A577BB9-1
Finkelstein, Murray M., Michael Jerrett, and Malcolm R. Sears(2004). "Traffic air pollution and mortality rate advancement periods." American Journal of Epidemiology 160.2 : 173-177.
Finkelstein, Murray M., Michael Jerrett, and Malcolm R. Sears (2005). "Environmental inequality and circulatory disease mortality gradients." Journal of Epidemiology and Community Health 59.6: 481-487.
Frank L and Chapman J. (2004). Integrating Travel Behaviour and Urban Form Data to Address Transportation and Air Quality Problems in Atlanta. Final Report to the Georgia Department of Transportation and Georgia Regional Transportation Authority. GDOT Research Project No. 9819, Task Order 97-13. April 2004.
Frank L, J Sallis, T Conway, J Chapman, B Saelens and W Bachman. (2005). Many Pathways from Land Use to Health: Associations between Neighbourhood Walkability and Active Transportation, Body Mass Index and Air Quality. Journal of the American Planning Association. Vol. 72. No.1.
Fung, K. Y., Khan, S., Krewski, D., & Chen, Y. (2006). Association between air pollution and multiple respiratory hospitalizations among the elderly in Vancouver, Canada. Inhalation toxicology, 18(13), 1005-1011.
Gauderman, WJ, et al. (2004). The effect of air pollution on lung development from 10 to 18 years of age. The New England Journal of Medicine. Vol 351(11): 1057-1067.
Golder Associates (2011) An All Sources Cumulative Air Quality Impact Study of South Riverdale-Leslieville-Beaches. Report created for the City of Toronto. Toronto, 2011.
Hankey, S, J Marshall, M Brauer. (2011). Health Impacts of the Built Environment: Within-urban Variability in Physical Inactivity, Air Pollution, and Ischemic Heart Disease Mortality. Environmental Health Perspectives. October 2011. National Institute of Environmental Health Sciences
Séguin, J., Berry, P., Bouchet, V., Clarke, K. L., Furgal, C., Environmental, I., & MacIver, D. (2008). Human health in a changing climate: a Canadian assessment of vulnerabilities and adaptive capacity. Human Health in a Changing Climate.
Health Effects Institute (HEI). (2010). Traffic-Related Air Pollution: A Critical Review of the Literature on Emissions, Exposure, and Health Effects. A Special Report of the HEI Panel on the Health Effect of Traffic-Related Air Pollution. Special Report 17.
Jerrett, Michael, et al. (2008) "Traffic-related air pollution and asthma onset in children: a prospective cohort study with individual exposure measurement." Environ Health Perspect 116.10: 1433-1438.

47
Jerrett, Michael, et al. (2009) "A cohort study of traffic-related air pollution and mortality in Toronto, Ontario, Canada." Environ Health Perspect 117.5: 772-7.
Judek, Stan, Barry Jessiman, David Stieb. (2004).Estimated Number of Excess Deaths in Canada Due to Air Pollution. Air Health Effects Division, Health Canada, and Robert Vet, Meteorological Services of Canada, Environment Canada.
Lo, C. P., & Quattrochi, D. A. (2003). Land-use and land-cover change, urban heat island phenomenon, and health implications: A remote sensing approach. Photogrammetric Engineering & Remote Sensing, 69, 1053–1063
Marsh and Grossa (2002). Environmental Geography: Science, Land Use, and Earth Systems. 2nd ed. Wiley and Sons, New York. Ontario Ministry of the Environment and Climate Change (MOECC). 2012. Air Quality in Ontario Report for 2010. Ontario Medical Association (1998). The Health Effects of Ground-Level Ozone, Acid Aerosols & Particulate Matter. Toronto:
Ontario Medical Association (1998). Ontario Medical Association (2005). The Illness Costs of Air Pollution: 2005-2026 Health & Economic Damage Estimates.
Toronto: Ontario Medical Association, June 2005. Ontario Medical Association (2010) Local Premature Smog Deaths in Ontario
https://www.oma.org/HealthPromotion/Smog/Pages/LocalPrematureSmogDeaths.aspx Perrotta & Associates (2010). Brief Review: Using Air Monitoring as a Tool to Assess & Address Local Airsheds & Micro-
Environments in Ontario. Report for the Environmental Commissioners Office. Toronto, 2010. Perrotta, K (2012) Traffic Corridors, Air Pollution Human Health. Creating Healthy and Sustainable Environments (CHASE),
January 25th
, 2012. Pope 3rd, C. A., Hansen, M. L., Long, R. W., Nielsen, K. R., Eatough, N. L., Wilson, W. E., & Eatough, D. J. (2004). Ambient
particulate air pollution, heart rate variability, and blood markers of inflammation in a panel of elderly subjects. Environmental health perspectives, 112(3), 339.
PPIC (2008) Air Quality Planning and California’s Changing Climate. Part of a larger PPIC study, Preparing California for a Changing Climate. Other reports in this collection are available at http://www.ppic.org/main/publication.asp?i=755.
Raub, J. A., Mathieu-Nolf, M., Hampson, N. B., & Thom, S. R. (2000). Carbon monoxide poisoning—a public health perspective. Toxicology, 145(1), 1-14.
Rosenlund, M., Forastiere, F., Porta, D., De Sario, M., Badaloni, C., & Perucci, C. A. (2009). Traffic-related air pollution in relation to respiratory symptoms, allergic sensitisation and lung function in schoolchildren. Thorax, 64(7), 573-580.
Samet, J.M., Dominici, F. et al. (2000). Fine Particulate Air Pollution and Mortality in 20 U.S. Cities, 1987-1994, New England Journal of Medicine. Vol 343, No.24.
Senes Consulting (2012). Toronto’s Future Weather & Climate Driver Study. Report for the City of Toronto. Toronto, 2012. Stieb, David et al. (2005). Estimating the Public Health Burden Attributable to Air Pollution: An Illustration Using the
Development of an Alternative Air Quality Index. Journal of Toxicology and Environmental Health. Part A. 68: 1275-1288. Authors with Healthy Environments and Consumer Safety Branch, Health Canada, and Meteorological Service of Canada.
Szyszkowicz, Mieczyslaw. "Air pollution and ED visits for chest pain." The American journal of emergency medicine 27.2 (2009) Taha, H., Douglas, S., Haney, J., (1994). The UAM Sensitivity Analysis: The August 26-28 1987 Oxidant Episode.In Analysis of
Energy Efficiency and Air Quality in the South Coast Air Basin – Phase II" Lawrence Berkeley Laboratory Report LBL-35728, Berkeley, CA.
Toronto Public Health (2014). Path to Healthier Air: Toronto Air Pollution Burden of Illness Update. Technical Report. April 2014 Toronto Public Heath (2004). Air pollution burden of illness Toronto : 2004 summary. Toronto: City of Toronto, 2004. U.S. Environmental Protection Agency (US EPA). (2004). Air Quality Criteria for Particulate Matter. October 2004. Villeneuve, P. J., Burnett, R. T., Shi, Y., Krewski, D., Goldberg, M. S., Hertzman, C., ... & Brook, J. (2003). A time-series study of air
pollution, socioeconomic status, and mortality in Vancouver, Canada. Journal of Exposure Science and Environmental Epidemiology, 13(6), 427-435.
Walcek, C.J., Yuan, H., (1995). Calculated influence of temperature-related factors on ozone formation rates in the lower troposphere. Journal of Applied Meteorology 34, 1056-1069
Wang, A., and Brauer, M. (2014). Review of Next Generation Monitors for Air Pollution. Report prepared for Environment Canada, Gatineau, Quebec. March, 2014.
Weng, Q. and Yang, S. (2006) Urban Air Pollution Patterns, Land Use and Thermal Landscape: An Examination of the Linkage Using GIS. Environmental Monitoring and Assessment (2006) 117: 463–489WHO, 2012
WHO International Agency for Cancer Research (2013) Outdoor Air Pollution a leading environmental cause of cancer deaths. IARC Press Release 221. 17 October 2013.
World Health Organization (WHO). (2005). Health Effects of Transport-Related Air Pollution. Denmark: WHO. 2005 WHO (2014). Ambient (outdoor) air quality and health. Fact Sheet No. 313, update March 2014
http://www.who.int/mediacentre/factsheets/fs313/en/ Yoshikado, H., & Tsuchida, M. (1996). High Levels of Winter Air Pollution under the Influence of the Urban Heat Island along the
Shore of Tokyo Bay. Journal of Applied Meteorology , 35, 1804-1813. Yu C, Hien W N, (2006). Thermal benefits of City Parks. Energy and Buildings, 38(2): 105–120. Zeka A, Zanobetti A, Schwartz J. (2006) Individual-level modifiers of the effects of particulate matter on daily mortality. Am J
Epidemiol;163:849–59. Zimirou, Denis, et al. (1998) "Time-series analysis of air pollution and cause specific mortality." Epidemiology 9.5: 495-503.