cointegrating midas regressions and a midas test · cointegrating midas regressions and a midas...
TRANSCRIPT

Cointegrating MiDaS Regressions and a MiDaS Test
J. Isaac Miller1,2
Department of Economics, University of Missouri118 Professional Building, Columbia, Missouri 65211, USA
Abstract
This paper introduces cointegrating mixed data sampling (CoMiDaS) regressions, gener-alizing nonlinear MiDaS regressions in the extant literature. Under a linear mixed-frequencydata-generating process, MiDaS regressions provide a parsimoniously parameterized nonlin-ear alternative when the linear forecasting model is over-parameterized and may be infeasi-ble. In spite of potential correlation of the error term both serially and with the regressors,I find that nonlinear least squares consistently estimates the minimum mean-squared fore-cast error parameter vector. The exact asymptotic distribution of the difference may benon-standard. I propose a novel testing strategy for nonlinear MiDaS and CoMiDaS regres-sions against a general but possibly infeasible linear alternative. An empirical applicationto nowcasting global real economic activity using monthly covariates illustrates the utilityof the approach.
[This paper was substantially revised and updated as “Mixed-frequencyCointegrating Regressions with Parsimonious Distributed Lag Structures.”The interest reader is referred to that version, available as WP 12-11 in theworking paper series of the Economics Department at Missouri and posted in
August 2012.]
First draft: April 15, 2011Current draft: February 8, 2012
JEL Classification: C12, C13, C22
Key words and phrases: cointegration, mixed-frequency series, mixed data sampling
1Correspondence: [email protected] draft was prepared for submission to the 2012 North American Summer Meeting of the Econometric
Society and the 2012 SMU-ESSEC Symposium on Empirical Finance and Financial Econometrics. Theauthor is grateful to Eric Ghysels, Peter Schmidt, Jeff Wooldridge, and other participants of the 2011NBER-NSF Time Series Conference, the 2011 meeting of the Midwest Econometrics Group, seminars atUNC-Chapel Hill and Michigan State, and a colloquium at Missouri for constructive feedback. The authoracknowledges financial support from the Economic & Policy Analysis Research Center at the University ofMissouri and excellent reseach assistance from April Li. The usual caveat applies.

1
1. Introduction
Since the introduction of nonlinearly specified mixed data sampling (MiDaS) regressionsby Ghysels et al. (2004) and Ghysels et al. (2007), the MiDaS methodology has beenadopted for a variety of applied and empirical topics in economics and finance, particularlyfor the purposes of forecasting – e.g., Ghysels and Wright (2009), Armesto et al. (2010),and Andreou et al. (2010b). The proliferation of empirical applications of MiDaS fore-casting models include primarily output – e.g., Tay (2007), Clements and Galvao (2008,2009), Hogrefe (2008), Benjanuvatra (2009), Frale and Montefort (2010), Marcellino andSchumacher (2010), and Kuzin et al. (2011). Another common application of MiDaS isto modeling volatility – e.g., Ghysels et al. (2006), Alper et al. (2008), Ghysels et al.(2009), Chen and Ghysels (2010), and Ghysels and Valkanov (2010). Also, MiDaS forecast-ing models have been applied to study the effects of high-frequency monetary policy shocks(Armesto et al., 2009, Francis et al., 2010), inflation (Montefort and Moretti, 2010), andthe risk-return trade-off (Ghysels et al. 2005).
The principal advantage of the parsimonious nonlinear autoregressive distributed lag(ADL) specification provided by the MiDaS approach lies in allowing regressors measuredat a much higher frequency than the regressand. In particular, if the high-low frequencyratio exceeds the number of low frequency observations – e.g., 50 years of weekly data – alinear ADL regression is infeasible. Adding regressors exacerbates this problem. For a lowerratio, such a model may be feasible but simply not parsimonious. The MiDaS specificationoffers a trade-off. The gain from a reduction in the dimension of the parameter space maybe quite large. In the extreme, an infeasible model becomes feasible. More generally, anefficiency gain is possible. The price paid may be inconsistency from neglected nonlinearity,if the MiDaS specification does not nest or at least approximate the data-generating process(DGP).
This paper aims for three important contributions to the existing MiDaS literature. Iintroduce cointegrating MiDaS (CoMiDaS) regressions, which nest stationary MiDaS re-gressions as a special case. The generalization allows for the possibility of stochastic trendscommon to the time series in the model. Cointegration in mixed-frequency and closelyrelated temporally aggregated models has been studied extensively. Such studies includeGranger (1990), Gomez and Maravall (1994), Granger and Siklos (1995), Marcellino (1999),Haug (2002), Chambers (2003, 2009, 2010), Pons and Sanso (2005), Chambers and McCrorie(2007), Seong et al. (2007), and Miller (2010, 2011). The mixed-frequency framework ofGhysels et al. (2004) does not allow for the possibility of stochastic trends. On the otherhand, some authors who have worked with macroeconomic series believed to contain unitroots but with unique stochastic trends, such as Clements and Galvao (2008), have takenfirst differences. The CoMiDaS regressions I introduce nests both of these cases. The sta-tistical analysis allows for the possibility of any number of trends, with these two cases asthe extremes.
Second, I allow for the realistic possibility that the error term is correlated both seriallyand with the regressors. Although this allowance is somewhat standard for models withI(1) series, since estimators may still be consistent, I allow correlation with both I(1) andI(0) regressors. Such correlation causes inconsistency in estimating the parameters of the
2
DGP. However, since MiDaS regressions are often used in forecasting, a more appropriateoutcome is to minimize mean-squared forecast error (MSFE) or a similar loss function.3 Ishow that even with such correlation, the MiDaS specification may consistently estimatethe minimum MSFE parameter vector within the class of models nested by the MiDaSspecification and assuming a MiDaS DGP, as is assumed by Ghysels et al. (2004), Andreouet al. (2010a), inter alia.
The extension of the MiDaS framework in these two directions provides a justificationfor the MiDaS approach taken by previous authors, but develops a broader framework onwhich to base further analysis.
Third, I propose a novel test of the MiDaS null against a more general alternative. Likethose of Andreou et al. (2010a), the proposed test is for in-sample rather than out-of-samplefit. Their tests posit a specific weighting scheme nested by the MiDaS specification as thenull, with a maintained hypothesis that the DGP is nested by the MiDaS specificationunder both the null and the alternative. In contrast, I make this assumption only underthe null. If estimating the linear ADL model is feasible (m is small), a likelihood ratio testsimilar to that proposed for ADL models by Godfrey and Poskitt (1975) could be used totest the MiDaS null.4 If estimating the linear ADL model is infeasible, which is preciselythe case in which one would expect the most gain from the parsimonious specification, theGodfrey-Poskitt test is infeasible.
The test I propose is feasible in either case. Specifically, I base the test on a traditionalvariable addition test (Wu, 1973), where the variables added are arbitrary linear combina-tions of the high-frequency regressors. Although one of the tests proposed by Andreou etal. (2010a) is also a variable addition test, it has a different null and requires m to be smallenough for the linear ADL estimator to be feasible. Whereas both their tests with MiDaSalternatives are useful for testing one MiDaS specification against another, my proposedtest, like that of Godfrey and Poskitt (1975), is useful for distinguishing a general MiDaSspecification from a more general DGP with linear ADL structure.
The remainder of the paper is structured along the following lines. I outline the basiccointegrating MiDaS regressions in Section 2 and present a somewhat more general coin-tegrating regression with nonlinearity in the regression coefficients. I derive the differencebetween the NLS estimator and the minimum MSFE parameter vector. In section 3, Ishow the consistency of the regression coefficients and of the deep parameters underlyingthese coefficients to the analogous minimum MSFE parameters. I derive the asymptoticdistributions of the respective differences, which may be Gaussian or nonstandard underalternative assumptions. I then introduce the proposed test, evaluating both its asymptoticdistribution and small sample performance in Section 4. In Section 5, I present an illustra-tive application to forecasting global real economic activity, and I conclude with Section 6.An appendix contains proofs of the theoretical results.
3Clements and Hendry (1995) and Christofferson and Diebold (1998) suggested alternative measures forforecasts from a cointegrated system, but I consider forecasts from only a single cointegrating regression.
4The Godfrey-Poskitt results are derived using an Almon lag – rather than exponential Almon lag –specification. Similar results may hold for the exponential specification.
3
2. CoMiDaS Regressions
Consider the task of forecasting the change in a macroeconomic series observed at a lowfrequency, using lags of the same series, several series observed at a higher frequency duringthe previous low-frequency period, and perhaps some additional regressors observed at theprevious low-frequency period. In levels, such a forecasting regression may be written as
yt+1 =∑p
k=1ρkyt+1−k + ϕ′wt + β′
∑m−1
k=0Πk+1x
(m)t−k/m + εt+1, (1)
where the superscript (m) denotes the higher frequency – specifically, m times the lowerfrequency, and Πs is a diagonal matrix of unknown weights. The weight structure may differacross regressors series, but for expositional simplicity I assume that all regressor series areobserved at the same frequency.
As an example, the best forecast of an annual series may use an annual average (averageor flat sampling) of each monthly regressor, in which case the optimal weights would be1/m for each of these high-frequency regressors. End-of-period sampling (a special case ofselective or skip sampling), provides another example. That case assigns a unit to the firstweight and zeros to the remaining weights.
Subtracting yt from both sides and manipulating x(m)t−k/m under the assumption that
∑m−1k=0 Πk+1 = I allows an error correction representation
4yt+1 =(
ρ∗yt + ϕ′wt + β′xt)
− ρ∗ (L)4yt − β′Π(L)4(1/m)x(m)t + εt+1, (2)
where ρ∗ ≡∑p
k=1 ρk − 1, ρ∗ (z) ≡∑p−1
k=1
∑ps=k+1 ρsz
k−1 for p ≥ 2 and ρ∗ (z) = 0 for p = 1,
and where Π (z) ≡∑m−2
k=0
∑m−1s=k+1Πs+1z
k/m. I use the notation 4(1/m) to denote a high-
frequency difference, and I drop the superscript (m) from β′x(m)t to signify that this term
includes only low-frequency observations of the high-frequency regressors.The above models are not parsimonious. For m sufficiently large, they may not even be
feasible. Ghysels et al. (2004) proposed MiDaS regressions, featuring an ADL with parsimo-nious nonlinear specification to overcome the infeasibility. Under such a specification, theweight matrices Πk are parameterized by γ, so that Π(z; γ) ≡
∑m−2k=0
∑m−1s=k+1Πs+1 (γ) z
k/m.The MiDaS forecasting regression becomes
yt+1 =∑p
k=1ρkyt+1−k + ϕ′wt + β′
∑m−1
k=0Πk+1(γ)x
(m)t−k/m + ηt+1 (3)
in levels, or
4yt+1 =(
ρ∗yt + ϕ′wt + β′xt)
− ρ∗ (L)4yt − β′Π(L; γ)4(1/m)x(m)t + ηt+1 (4)
in differences, under this parameterization. The former is more similar to the I(0) MiDaSregression of Ghysels et al. (2004), while the latter is more similar to the I(1) MiDaSregression of Clements and Galvao (2008). When both low-frequency and high-frequencyregressors contain a mix of I(0) and I(1) series, the CoMiDaS regression
4yt+1 =(
ρ∗yt + ϕ′
1w1t + β′1x1t)
+ ϕ′
0w0t + β′0x0t (5)
− ρ∗ (L)4yt − β′Π(L; γ)4(1/m)x(m)t + ηt+1,

4
where the subscripts 0 and 1 denote the order of integration, generalizes that in (4). AsAndreou et al. (2010a) noted, all of the terms with I(1) regressors are linear in parameters.
Since the weight matrices (Πs) are parameterized directly, there is no practical differencebetween defining the lag polynomial in (3), (4), and (5) except that the latter two imposethat the weights sum to unity, resulting in m − 1 rather than m weight matrices. Typicalnonlinear weight specifications impose this restriction anyway.
The lag structure most commonly employed in the MiDaS literature is the exponentialAlmon lag, modified from Almon (1965). For the first diagonal of the weight matrix, theexponential Almon polynomial may be written as
π1,s (γ) zs/m =
exp(γ1s+ γ2s2)
∑mj=1 exp(γ1j + γ2j2)
zs/m,
and the remaining diagonals are similar. The remaining diagonals may depend on γ1 andγ2, if the weight structure is assumed to be the same for all regressor series, or they maydepend on additional pairs of parameter.
The literature posits alternative lag specifications, but the exponential Almon lag is em-ployed for its flexibility in mimicking reasonable economic assumptions about the relation-ship between the low- and high-frequency data. For example, if the regressand is observedat the lower frequency due to average sampling and is cointegrated with the regressors, thenChambers (2003) and Miller (2011) showed that average sampling the regressors is mostefficient. The exponential Almon lag achieves this for γ1 = γ2 = 0. If instead the optimalscheme is thought to be end-of-period sampling, then the exponential Almon lag providesan adequate approximation by setting, γ = (−5,−5) for m = 12, say. In the cointegratingcase, Miller (2011) showed that matching the aggregation scheme of the regressors to thatof the regressand is efficient in the absence of correlation of the error with the regressors.Aggregating the regressors directly is more parsimonious than using a MiDaS approach,but would be inappropriate when the regressand aggregation scheme is unknown. The ex-ponential Almon lag can take other shapes, assigning more weights to middle observationsif, perhaps, seasonality is a concern.
2.1. Generalized Specification
As with a typical I(0) error-correction model, in order for the CoMiDaS regression to bewell-specified, there are three possibilities. Either all series are I(0), some series are I(1) butno cointegrating relationships exist, (ρ∗, ϕ′
1, β′
1)′ = 0, or some series are I(1) but at least
one cointegrating relationship exists, ρ∗yt + ϕ′w1t + β′x1t ∼ I(0).To simplify notation, let (p1t) denote the n1 unique common stochastic trends of the
I(1) vector (yt, w′
1t, x′
1t)′ in (5), and let (p0t) denote an n0 series containing both the I(0)
regressors and any cointegrating combinations of the I(1) regressors. The regression hasn = n1 + n0 regressors: the number of stochastic trends of the I(1) series, plus the numberof cointegrating combinations of the I(1) series, plus the number of stationary covariates. Aunivariate high-frequency (xt) spawns m regressors, but no more than one stochastic trend.Such a stochastic trend may be shared with (yt) and (wt). Note that n1 = 0 if all seriesare stationary, but that n0 = 0 cannot hold, except in the case of selective sampling, or

5
in the trivial case of no mixed frequencies. In other words, even when all high-frequencyregressors are I(1), there will generally be I(0) terms in (2), (4), and (5) due to the errorcorrection representation.
The regression may be rewritten as
4yt+1 = θ′1p1t + g′0 (θ) p0t + ηt+1 (6)
where θg×1 = (ρ∗, ϕ′
1, β′
1, ρ∗
1, ..., ρ∗
p, ϕ′
0, β′
0, γ′)′ is an element of the parameter space Θ ⊆ R
g
and g0 (θ) is a vector of linear and nonlinear functions. I refer to the models in (3)-(6) asCoMiDaS regressions or CoMiDaS models.
If the model contains any unit roots, θ1 must be zero, because the cointegrating com-binations of (yt, w
′
1t, x′
1t)′ are in (p0t) rather than (p1t). However, the dimension n1 of θ1
varies depending on the number of unit roots. To allow for their presence, but since thestochastic trends are latent, I do not assume θ1 to be zero in estimation, and I estimateall n coefficients. In other words, I do not impose a unit root. Nor do I impose a certainnumber of trends. Although determining the number of trends may be desirable in certainapplications, it is not necessary in the present analysis.5
Imposing a unit root when the DGP does not contain one is clearly not desirable.Clements and Hendry (1995) suggested not imposing a unit root, but Christofferson andDiebold (1998) found that this leads to weaker forecasts when the DGP contains one.Hansen (2010) recently suggested averaging forecasts from models in which a unit root isimposed and not imposed when the smallest root of the DGP is uncertain but thought tobe near unity.
Aside from potential unit roots, there is a major difficulty to overcome in analyzingthe statistical properties of an estimator of θ using (6): potential correlation of (εt) bothserially and with the regressors. Although it is well-known that such correlations pose noproblem in the consistent estimation of the cointegrating vectors in a linear model, theeffects on forecasting and on coefficients of I(0) regressors under a nonlinear specificationare not obvious. I show that such correlation is not problematic for consistently estimatingthe minimum MSFE parameter vector in either I(0) or I(1) cases.
In order to analyze the statistical properties of an NLS estimator of the CoMiDaSregression in (6), I consider a more general model, which allows for nonlinearity in thecoefficients of all terms. The linear model in (2) may be written as very simply as
4yt+1 = p′tα+ εt+1, (7)
where pt = (p′0t, p′
1t)′. I assume that the DGP is linear, so that the minimum MSFE forecast
of 4yt+1 is given by E [4yt+1|Ft] = p′tα + E [εt+1|Ft]. I make a realistic allowance for theerror sequence to be correlated serially and with both the I(0) and I(1) regressors, so thatE [εt+1|Ft] 6= 0 in general.
As described above, forecasts are made using a general nonlinear model
4yt+1 = p′tg(θ) + ηt+1. (8)
5See Marcellino (1999) and Haug (2002) for discussions of such tests when the low-frequency series istemporally aggregated.
6
I define the space G ⊆ Rn such that g : Θ 7→ G, where n is the number of regressors, as
above.I assume that
[N1] there exists θ ∈ Θ such that g(θ) = α,
so that the nonlinear model nests the linear DGP. Otherwise, there is a latent term inthe residual stemming from the nonlinear approximation. Correlation of this term withthe regressors may generate bias in the forecasts, and it is not obvious that such bias issufficiently small to be offset by the efficiency gain from the parsimonious specification.Although my proposed test can provide evidence for or against the nonlinear specificationby allowing a general linear alternative, like Andreou et al. (2010a), I do not address thisdifficulty in the asymptotic analysis of the estimators.
I consider (8) to be the model estimated henceforth. The CoMiDaS regression of interestin (6) is a special – but important – case, with g(θ) = (g′0 (θ) , θ
′
1)′.
2.2. Minimum MSFE Parameter Vector and NLS Estimation
The MSFE using the model in (8) may be written as
Q (θ) = E(E[εt+1 − p′t(g(θ)− α)|Ft])2
by substituting (7). The first-order condition is
0 =∂g′(θ)
∂θ(M(g(θ)− α)−N),
where M ≡ Eptp′
t and N ≡ Eptεt+1. M and N may be partitioned as
M =
[
M00 M01
M10 M11
]
=
[
Σpp ∆p1 + o (1)∆′
p1 + o (1) TΩ11 + o (T )
]
, and
N =
[
N0
N1
]
=
[
σpεδ′ε1 + o (1)
]
,
where Σpp ≡ Ep0tp′
0t, ∆p1 ≡∑
∞
k=0Ep0t4p′
1,t−k, δε1 ≡∑
∞
k=0Eεt+14p′
1,t−k, and Ω11 =∑
∞
k=−∞E4p1t4p
′
1,t−k.6 The remainder terms come from
∑
∞
k=T+1Ep0t4p′
1,t−k, etc.I assume that
[A1] M11 −M10M−100 M10 is nonsingular for n1 > 0 and for any T , and that
[A2] Σpp is nonsingular,
6With I(1) series, the moment matrix M is a function of T . However, I suppress the argument to reservethe notation MT for sample moment matrices below.

7
which are sufficient to ensure the invertibility of M . As T → ∞, Assumption [A1] requiresonly that Ω11 is nonsingular, since T−1(M11 −M10M
−100 M10) = Ω11 + op (1). I maintain
[A1] to ensure that M is invertible for any sample size. Assumption [A2] does not placeany unreasonable restrictions on the high-frequency regressors. If the increments of theseregressors are perfectly correlated, as in the case with interpolated series, then there is noinformation gain from including the high-frequency increments. In that case, the incrementsmay be dropped, retaining only the levels (xt) observed at the lower frequency.
Under the additional assumptions that
[N2] ∂gi(θ)/∂θ exists and is bounded in a neighborhood of θmin for i = 1, . . . , n and that
[N3] g(θmin) ∈ int(G),
a solution to the minimization problem is given by g(θmin)− α = M−1N . The vector θmin
is the minimum MSFE parameter vector of the nonlinear model in (8). If the error is amartingale difference sequence (an mds) with respect to (Ft), then N = 0 and p′tα givesthe optimal forecast. Deviations from N = 0 may occur because of correlation between theerror and regressors.
NLS is a natural estimator for forecasting with a nonlinear model. The NLS objectivefunction may be written as
QT (θ) =1
2
∑
t(εt+1 − p′t(g(θ)− α))2,
which has a first-order condition of
0 = T∂g′(θ)
∂θ(MT (g(θ)− α)−NT ),
where MT ≡ T−1∑
t ptp′
t and NT ≡ T−1∑
t ptεt+1. A solution is given by g(θNLS) − α =M−1
T NT , similarly to g(θmin).
The difference g(θNLS) − g(θmin) may be written as M−1T PT , where PT ≡ (NT −N) −
(MT −M)M−1N . This difference reveals the extent to which the NLS estimator minimizesMSFE, which is the aim of the next section.
3. Asymptotic Properties of the NLS Estimator
In order to carefully analyze the NLS estimator of θ in (8), I introduce additional notationand rely on additional assumptions. Let bt ≡ (εt+1, p
′
0t,4p′
1t)′ denote the n+ 1 stationary
components of the DGP in (7), where (p0t) and (p1t) are the I(0) and I(1) regressors re-spectively. Defining b0t ≡ (εt+1, p
′
0t)′ and b1t ≡ 4p1t allows a useful alternative partition
bt = (b′0t, b′
1t)′. In the ensuing discussion, the partition vt = (v′0t, v
′
1t)′ is conformable with
(b′0t, b′
1t)′.
I assume that
[A3] bt =∑
∞
s=0Ψsvt−s where∑
∞
k=0 s ‖Ψs‖ <∞, and that

8
[A4] (vt) is iid with finite second and fourth moment matrices, and with zero third momentmatrix.
These assumptions allow multivariate versions of the LLN, CLT, and IP of Phillips andSolo (1992). Assumption [A3] is quite general, allowing correlation serially and across series,which applies to both the error, the I(0) regressors, and first-differences of the I(1) regressors.The cases of iid and I(0) autoregressive regressors considered by Andreou et al. (2010a) isa special case, up to the assumption on the third moment. The symmetry condition is notessential, but makes the distributions below more tractable. As it turns out, when the erroris iid, as Andreou et al. (2010a) assume, asymmetry may be allowed.7
The main asymptotic results below should hold under more general assumptions, suchas those for weakly dependent heterogeneous processes considered by Davidson (1994), interalia. Such a generalization would allow for ARCH in both the regressors, as the third caseconsidered by Andreou et al. (2010a), and in the error term, for example.
The analogy between the MiDaS regressions in (4)-(6) and that of the more generalmodel in (8) requires some additional explanation in light of Assumption [A3]. The matricesΨs need not be square, in order to allow for the possibility of common innovations. In
particular, (4xt) and (4(1/m)x(m)t ) have common high-frequency innovations. For example,
letting vt ≡ (v(2)t , v
(2)t−1/2), (4xt) has innovations of (vt), while (4(1/2)x
(2)t ) has innovations
of (v(2)t ).
An invariance principle holds under Assumptions [A3] and [A4], such that T−1/2∑[Tr]
t=1 bt ≡Bn (r) → B (r) with B ≡ BM(Ω). B = (B′
0, B′
1)′ may be partitioned as above. The variance
Ω = ∆′ +Σ+∆ may be partitioned as
Ω =
ω2ε ωεp ωε1
ωpε Ωpp Ωp1
ω1ε Ω1p Ω11
or Ω =
[
Ω00 Ω01
Ω10 Ω11
]
similarly to (bt). In other words, Ω10 = (ω1ε,Ω1p), etc. Subscripts on the components Σand ∆ denote the same partition, and the variances and covariances Σpp, ∆p1, Ω11, σpε, andδε1 are the same as those introduced in the previous section. As noted above, Ω11 > 0 dueto Assumption [A1], but this assumption does not rule out cointegration of (yt, w
′
1t, x′
1t)′ in
(5), because the cointegrating combinations are contained in (p0t).All of the asymptotics in this paper are low-frequency asymptotics, but these may be
derived from a high-frequency DGP. Chambers (2003) derived low-frequency asymptoticsfrom a DGP defined by stocks and flows in continuous time using particular aggregationsschemes. Miller (2011) derived low-frequency asymptotics from a high-frequency DGP usinga general aggregation scheme that may include the MiDaS lag polynomials considered here.
3.1. Consistency
Of primary concern is the consistency of the coefficient vector g(θNLS) to g(θmin), ratherthan that of θNLS to the deep parameter vector θmin, since the coefficient vector may becompared directly with that of the linear DGP.
7See the last part of the proof of Lemma A1.

9
The following lemma establishes consistency of the coefficient estimates.
Theorem 1. Under Assumptions [A1]-[A4] and [N1]-[N3], g(θNLS) →p g(θmin) as T →∞. Moreover, defining the partition g(θ) = (g′0(θ), g
′
1(θ))′ such that g0(θ) and g1(θ) corre-
spond to the I(0) and I(1) regressors respectively, g1(θNLS) = g1(θmin) +Op(T−1).
The result is more robust than the consistency result of Andreou et al. (2010a) in thesense that both I(0) and I(1) regressors are allowed and in the sense that consistency tothe minimum MSFE parameter vector does not require (εt+1,Ft) to be an mds. The errormay be correlated both serially and with the regressors. The second part of the resultestablishes superconsistency for the coefficients corresponding to the I(1) regressors. Ofcourse, g1(θmin) = θ1,min in the CoMiDaS regression in (6).
The additional assumption that
[N3’] g−1 (θ) is continuous at θmin and θmin ∈ int(Θ)
allows consistency of the NLS estimator of the deep parameter vector θ.
Corollary 2. Under Assumptions [A1]-[A4], [N1]-[N2], and [N3’], θNLS →p θmin
as T → ∞.
Note that since Θ is a subset of the real line that need not be compact or closed, a limitingsolution of ±∞ is still an interior solution as long as the derivative of g (θ) is zero at thatlimit. In other words, g(θ) may have a horizontal asymptote. This allowance is important,since the exponential Almon lag may best approximate particular weighting schemes as γ1or γ2 approach ±∞. For example, end-of-period sampling is approximated as γ2 → −∞.
3.2. Asymptotic Distributions
For the purpose of forecasting, the limiting distribution of g(θNLS) − g(θmin) is sufficientto establish the asymptotic difference between an actual forecast and the minimum MSFEforecast. To the extent that inference about the deep parameters is desirable, the limitingdistribution of θNLS − θmin is also useful.
When first and second derivatives are taken with respect to g rather than θ, the gradientand Hessian reduce to JT (g) ≡ T (MT (g(θ)− α)−NT ) and HT ≡ TMT . Note that whenevaluated at g(θmin), JT = −TPT . Define n × n diagonal the normalization matrix νT ≡diag(T 1/2In0
, T In1). Further, define
H ≡
[
Σpp 00
∫
B1B′
1
]
and J ≡
[
(E′ ⊗ κ′)N (0,Ξ)∫
B1dB′
0κ− (∫
B1B′
1Ω−111 − I)ζ
]
,
where Ξ ≡ E[b0tb′
0t⊗ b0tb′
0t]−E[b0t⊗ b0t]E[b′0t⊗ b′
0t], κ ≡ (1,−N ′
0Σ−1pp )
′ is an (n0+1)-vector,ζ ≡ (N ′
1−N ′
0Σ−1pp ∆p1)
′ is an n1-vector, and E′ is the unitary matrix that selects all but the
first row of the following matrix of n0 + 1 rows.Using these definitions, the following theorem holds.

10
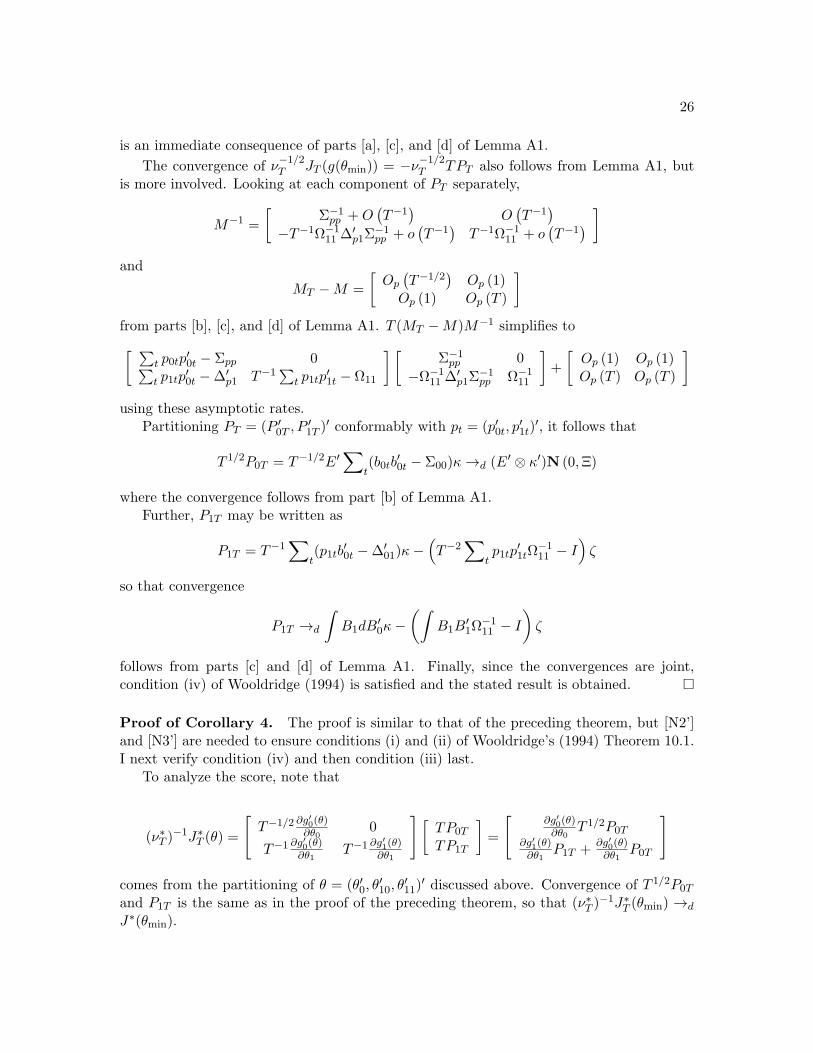
Theorem 3. Under Assumptions [A1]-[A4] and [N1]-[N3],
νT (g(θNLS)− g(θmin)) →d H−1J
as T → ∞.
The asymptotic rates are as expected, but this n×1 distribution is quite nonstandard when(εt+1) is correlated serially and with the regressors. Normality holds for the coefficients ofthe I(0) regressors, however the variance is exacerbated by deviations from Ep0tεt+1 = 0.
In the special case in which (εt+1) is uncorrelated with the regressors, N = 0 and then0 × (n0 + 1)2 matrix (E′ ⊗ κ′) becomes a matrix that selects rows (n0 + 1)j + 1, forj = 1, . . . , n0, of the subsequent matrix of (n0+1)2 rows. Since Ξ is an (n0+1)2× (n0+1)2
matrix of Kronecker products, some algebra shows that the rows and columns of Ξ selectedare E[ε2t+1p0tp
′
0t]−E[εt+1p0t]E[εt+1p′
0t], which simplifies to σ2εΣpp under the uncorrelatednessassumption.
If, moreover, the model contains no I(1) regressors, the limiting distribution H−1J
reduces to σεΣ−1/2pp N(0, I) when N = 0. In other words, when all of the regressors are sta-
tionary, the error term is ideal, and the MiDaS specification nests the underlying DGP, theNLS estimator of the coefficients – not of the deep parameters, which may enter nonlinearly– has the same asymptotic distribution as the LS estimator of the linear model.
If, on the other hand, the model contains no I(0) regressors, the limiting distributionH−1J reduces to σε(
∫
B1B′
1)−1/2N(0, I) when N = 0. This mixed normal distribution
validates hypothesis testing using standard critical values.Since CoMiDaS models may contain I(1) regressors but almost always contain I(0)
regressors, the limiting distribution is generally σεH−1/2N(0, I), a vector containing both
normal and mixed normal subvectors. These results are sensible in this special case, butTheorem 3 is much more broadly applicable.
Obtaining the exact asymptotic distribution of the NLS estimator θNLS of the deepparameters is more involved, because the derivative structure is much more complicated.
I assume that
[N2’] the third derivative matrix of gi(θ) exists for i = 1, . . . , n, and ∂gi(θ)/∂θ∂θ′ is bounded
in a neighborhood of θmin,
and define
J∗
T (θ) ≡ T (∂g′(θ)/∂θ)(MT (g(θ)− α)−NT ), and
H∗
T (θ) ≡ T (∂g′(θ)/∂θ)MT (∂g(θ)/∂θ′) + T ((MT (g(θ)− α)−NT )
′ ⊗ I)(∂vec(
∂g′(θ)/∂θ)
/∂θ′)
to be the gradient vector and Hessian matrix with respect to θ. Again, these simplify atθmin, since MT (g(θmin)− α)−NT = PT .
I do not assume that the parameters involved in the coefficients on the I(0) regressorsare distinct from those involved in the coefficients on the I(1) regressors. In particular, thecoefficient β1 in (5) is common to both. Recalling that θ ⊆ R
g and G ⊆ Rn, ∂g′(θ)/∂θ
is a g × n matrix. The n × n matrix MT may be partitioned into four blocks: a block

11
with products of only I(0) regressors, a block with products of only I(1) regressors, and twooff-diagonal blocks with only cross-products of I(0) and I(1) regressors.
Sort and partition θ = (θ′0, θ′
10, θ′
11)′, so that θ0 are g0 parameters only in terms with
I(0) regressors – e.g., γ in the weight functions above, θ10 are parameters in both termswith I(0) regressors and terms with I(1) regressors – e.g., β1 in (5), and θ11 are parametersonly in terms with I(1) regressors – e.g., ρ∗ in (5). Let g1 ≡ g − g0, so that g1 denotes thenumber of parameters in all terms with I(1) regressors: the rows of (θ′10, θ
′
11)′.
The g × g matrix (∂g′(θ)/∂θ)MT (∂g(θ)/∂θ′) may be partitioned into four blocks: a
g0 × g0 block with terms consisting of products of only I(0) regressors, two off-diagonalblocks with terms consisting either of products of only I(0) regressors or cross-products ofI(0) and I(1) regressors, but no products of only I(1) regressors, and a g1 × g1 block withterms consisting of products of only I(1) regressors, products of only I(0) regressors, andcross-products.
Conformably with these blocks, define
G (θ) ≡
[
∂g0(θ)/∂θ′
0 00 ∂g1(θ)/∂θ
′
1
]
,
and define the g × g diagonal normalization matrix ν∗T ≡ diag(T 1/2Ig0 , T Ig1). Finally,define J∗(θ) ≡ G′(θ)J and H∗(θ) ≡ G′(θ)HG(θ). The following corollary holds using thesedefinitions.
Corollary 4. Under Assumptions [A1]-[A4], [N1], and [N2’]-[N3’],
ν∗T (θNLS − θmin) →d H∗(θmin)
−1J∗(θmin)
as T → ∞.
This distribution is g-dimensional, in contrast to the much less parsimonious n-dimensionaldistribution of the preceding theorem.
Again, it is instructive to consider the special case of N = 0, in which (εt+1) is un-correlated with the regressors. The distribution simplifies to σεH
∗(θmin)−1/2N(0, I) in the
same way as above. And again, this distribution is a vector of normal and mixed normalsubvectors. In the case of only I(0) regressors, this may be written as
σε((∂g′
0(θ)/∂θ0|θ=θmin)Σpp(∂g(θ0)/∂θ
′
0|θ=θmin))−1/2N(0, I)
which is analogous to results in Section 3.2 of Andreou et al. (2010a).8,9 Corollary 4 is morewidely applicable than their results, however.
8The variance of βNLS alone may be further isolated by conditioning on the remaining estimators inθNLS , as in line (3.4) of their paper.
9Even this special case generalizes the results Andreou et al. (2010a) in the sense that serial correlationof the error is still allowed, as long as the regressors are strictly exogeneous.

12
4. Testing for MiDaS and CoMiDaS
Mixed-frequency cointegrating regressions do not require a nonlinear MiDaS specificationwhen the regressand has been average sampled. Chambers (2003) and Miller (2011) showedthat the regressors should also be average sampled for maximum efficiency in that case,unless any of the series exhibit substantial seasonality, which may introduce inefficiencyin estimating the long-run relationship. This recommendation holds regardless of whetheror not the series are stocks or flows. When the regressand has been sampled differently– e.g., selectively sampled – the most efficient sampling method for the regressors whenN = 0 is to match that of the regressand (Miller, 2011). However, Miller (2011) showedthat efficiency gains are possible by exploiting serial correlation in the error term whenN 6= 0 and the regressand aggregation scheme is known. In this case, or with unknownregressand aggregation scheme, or with I(0) series, and especially when the linear model isover-parameterized or infeasible, a (Co)MiDaS specification is sensible.
Andreou et al. (2010a) propose several tests of particular weighting schemes such asthose mentioned above against alternatives of general nonlinear MiDaS specifications un-der the maintained hypotheses of no error correlation and that the MiDaS specificationnests both the null and alternative. Using my notation, N = 0 under both their null andalternative. Because of the (mixed) normality in the CoMiDaS framework when N = 0,their testing strategy should also be valid for CoMiDaS models with strictly exogenous I(1)regressors.
The CoMiDaS alternative is useful to reject specific nested nulls, such as average sam-pling. However, a CoMiDaS null is more useful if the validity of the nonlinear specificationis questionable. The difficulty in testing for CoMiDaS against a general linear alterna-tive lies in infeasibility of estimating the alternative or of calculating the score when m islarge. Unfortunately, this difficulty rules out traditional Wald, likelihood ratio, and La-grange multiplier tests, such as the LR test proposed by Godfrey and Poskitt (1975) for anon-exponential Almon lag structure.
4.1. Restricted Minimum MSFE Parameter Vector and NLS Estimation
For the subsequent test, a restricted minimum MSFE parameter vector and a restrictednonlinear estimator are useful. In this case, Assumption [N1] is violated, except under thenull that the restricted and unrestricted estimators are equal. Let θ∗ ≡ minθ∈Θ ‖g(θ)− α‖and τ∗ ≡ α − g(θ∗). The norm of the vector τ∗ reflects a lower bound on the differenceg(θ)−α, based on both the functional form g used and the underlying coefficients, but noton the choice parameter vector θ. I assume that
[N1’] τ∗ exists and is unique
for identification. Note that in any CoMiDaS regression, τ∗,i = 0 for all i corresponding tothe I(1) regressors in (5), since CoMiDaS regressions are linear in these parameters.
The null that a particular MiDaS specification nests the DGP is equivalent to ‖τ∗‖ = 0,in which case Assumption [N1] holds and all of the above asymptotics are valid. Thealternative that the MiDaS specification does not nest the DGP is equivalent to ‖τ∗‖ > 0.

13
Of course, a rejection of the null may be a rejection of a particular lag structure, ratherthan a rejection of nonlinearity in general.
A Lagrangian objective function for the minimum MSFE vector,
Q (θ) = E(E[εt+1 − p′t(g(θ)− α)|Ft])2 + 2λ′(g(θ)− α− τ∗),
assigns a vector of Lagrange multipliers λ to the vector of constraints that |g(θ)− α| > |τ∗|.10
The first-order conditions are
0 = (∂g′(θ)/∂θ)(M(g(θ)− α)−N + λ) and
0 = g(θ)− α− τ∗,
so thatτ∗ = g(θmin)− α =M−1(N − λ)
at the minimum. Under the null that ‖τ∗‖ = 0, λ = N , which is zero only if N = 0.The NLS estimator under the same restriction has a Lagrangian given by
QT (θ) =1
2
∑
t(εt+1 − p′t(g(θ)− α))2 + Tλ′T (g(θ)− α− τ∗).
which has similar first-order conditions, so that
τ∗ = g(θNLS)− α =M−1T (NT − λT ) (9)
at the minimum.
4.2. A MiDaS Variable Addition Test
I propose a novel strategy to test the MiDaS null, based on possible neglected nonlinearityin the estimated series of residuals (ηt+1). Consider a simplified (Co)MiDaS regression,
yt+1 = p′tw(γ)β + ηt+1 (10)
with DGP given byyt+1 = p′twβ + εt+1 (11)
where w(γ) is a weight vector and β is univariate – i.e., a single high-frequency series drivesm regressors. Additional regressors in (3) add unnecessary expositional complexity fortesting a single polynomial. The testing procedure would be exactly the same in that case.
The vector pt may be viewed either as a vector of high-frequency regressors, as in (3), oras a single high-frequency regressor followed by high-frequency differences, as in (4). Notethat w(γ)β corresponds to g(θ) in (8) and elsewhere above, while wβ corresponds to α in(7) and elsewhere above. The nonlinear model nests the linear model only under the null.
The NLS residual series is
ηt+1 = εt+1 − p′t(w(γ)β − wβ), (12)
10To form the Lagrangian, let the sign of each element λi of λ be positive if gi(θ)−αi > τ∗,i and negativeif gi(θ)− αi < τ∗,i, so that the second term of the objective function is non-negative for minimization.

14
where the NLS subscript is omitted from the estimators for brevity. The second term of (12)differs from zero asymptotically for two possible reasons. Either N 6= 0, so that NLS doesnot consistently estimate wβ, which is not wminβmin in that case, or else the null is not true,in which case w(γ) does not nest w and inconsistency results from neglected nonlinearity. Ifonly the first reason is true – the null still holds – then the deviation is exactly offset by thecorrelation of (εt+1) with (pt), so that
∑
t ηt+1pt equals zero up to numerical approximationerror.
If the second is true – the null does not hold – then the deviation of (w(γ)β − wβ)from zero may be picked up by an ancillary regression. Regressing (ηt+1) onto (pt) is notparsimonious and may be infeasible. Regressing (ηt+1) onto (p′tw(γ)) is feasible, but suffersfrom an endogeneity bias, since (p′tw(γ)) is correlated with (εt+1). A solution is offered by aWu-type variable addition test (Wu, 1973). Regressing (ηt+1) onto (p′tw(γ)) should captureall of the correlation between (εt+1) and (pt), as well as estimation error in (w(γ)β − wβ)from that correlation. (εt+1) should not be correlated with any other linear combinationof (pt). The remaining error in this ancillary regression stems from neglected nonlinearityunder the alternative. So, controlling for (p′tw(γ)), (ηt+1) should not be correlated withany other linear combination of (pt) under the null, but should be correlated under thealternative.
Let pt = p′tw(γ) denote the estimated linear combination of high-frequency regressorsusing NLS and let W denote an m× q matrix of q other arbitrary linear combinations. Theproposed test is based on the regression
ηt+1 = ptς0 + p′tWς1 + et. (13)
A null of ς1 = 0 coincides with a MiDaS null – i.e., that (10) nests (11). Letting F denotean F-test with this null, qF or an alternative test of ς1 = 0 may be used to test for MiDaS.
The fitted series (pt) is included to ensure that estimates of ς1 pick up only variationsin (p′tW ) orthogonal to (pt). Such variations increase the power of the test. To ensuresufficient power, one may either choose multiple combinations in W , or run a preliminaryregression of (pt) onto (p′tW ). A lower R2 in this preliminary regression is desirable toincrease power. However, keeping in mind that both the regressand and regressors of sucha preliminary regression are linear combinations of the same high-frequency series, an R2
near unity should be expected.In the sense of latent omitted variables, my proposed test shares some similarities with
the Wu-type test proposed by Andreou et al. (2010a). However, it differs substantially.Most importantly, their test is designed with a null of a specific aggregation scheme nestedby MiDaS against an alternative of a more general MiDaS structure. They do not consider aDGPmore general than a MiDaS regression. Second, they usem high-frequency instrumentsrather than linear combinations of the high-frequency regressors. Their IV test is infeasiblewhen m is large relative to the sample size – precisely when the parsimonious MiDaSspecification is most useful.
The following proposition cements the easily conjectured asymptotic χ2 distribution ofthe proposed test statistic in most cases.

15
Proposition 5. Let pt = (xt,4(1/m)x
(m)t , ...,4(1/m)x
(m)t−(m−1)/m)′ in (10) and (11) and
q < m. Under Assumptions [A1]-[A4], [N1’], and [N2]-[N3], the limiting distribution of the(Co)MiDaS variable addition test statistic qF coincides with a χ2
q distribution when either
[a] (xt) is I(0), or
[b] (xt) is I(1) and strictly exogenous and (εt+1,Ft) is an mds,
as T → ∞.
Note that the asymptotic distribution of the test is robust to correlation of the regressorsand error term in the I(0) case, but not the I(1) case.
In the I(1) case, the error must be an mds sequence uncorrelated with the regressor atall lags. If the mds assumption is violated, it may be possible to construct a Wald test witha long-run variance estimator instead of the contemporaneous variance estimator of thetraditional F-test, along the lines discussed by Park and Phillips (1988). If the exogeneityassumption is violated, it may be possible to correct for the resulting non-normality alongthe lines of Phillips and Hansen (1990) or Park (1992). However, variance estimation inthese cases would be inconsistent due to correlation of the error with the I(0) regressors,further complicating the test and its limit.
Fortunately, the violation occurs in only one of the (q + 1) elements of the regressorvector. When the number of variables added in the variable addition test is large, thenon-normality of the single element may be diluted by the normality of the remainingq elements, so that the chi-squared distribution is a rough approximation to the actualdistribution, which would involve stochastic integrals and nuisance parameters similar tothe limit in Theorem 3.
The model and DGP in (10) and (11) are simple, but the principles of the test extendeasily. For more complicated (Co)MiDaS models such as that in (5), the MiDaS specifica-tions for each high-frequency regressor may be tested jointly or separately, depending on thedesired null. The exact testing strategy depends on the parametric modeling assumptionsunderlying the nonlinear weight specification. The limiting distribution may be generalizedfrom Proposition 5.
4.3. Small-Sample Performance of the Test
I perform simulations of the DGP in (11) to evaluate size and power properties of theproposed test using several nulls and alternatives. I set m = 12, as would be the case withan annual regressand and monthly regressor, and I consider T = 25, 50, 100. If T representsyears in the sample, thenmT represents months in the sample. All of the asymptotics aboveare as T → ∞, so the sample sizes here are quite small but realistic for macroeconomicseries.
I consider weights generated by 12 DGPs consisting of 6 nulls and 6 alternatives. Thenull models nest the MiDaS specification in (10), using an exponential Almon lag with γequal to (0, 0), (−5,−5), (1, 1), (−0.5, 0.04), (0.5,−0.04), and (0.005, 0.02), labeled H0(j)with j = 1, ..., 6. The first of these is simply a flat aggregation scheme characteristic of

16
Figure 1: Three null weighting schemes and six alternative weighting schemes. Solid lines represent
the DGP, while dashed lines represent the closest approximation to the alternative DGPs using an
exponential Almon lag.
average sampling. The second two assign unit weights to the first high-frequency regressorand the last high-frequency regressor, respectively, and zero to the remaining high-frequencyregressors, characteristic of selective sampling.
The last three are illustrated in the top panels of Figure 1. Specifically, H0(4) as-signs more weight to the high-frequency regressors near the beginning and end of the low-frequency interval, H0(5) assigns more to those in the middle, and H0(6) assigns a gentlyincreasing weight structure moving from the end to the beginning.
The bottom six panels of Figure 1 show six alternatives not nested by the exponentialAlmon lag. These panels also show the best fit curve, in the sense of minθ∈Θ ‖g(θ)− α‖,using the exponential Almon function. A higher-order exponential Almon lag could betterapproximate some of these alternatives. Because the point of this exercise is to demonstratethe power of the test, only the second-order exponential Almon lag described in Section 2 isemployed. Table 1 shows the weighting schemes for the six alternatives, labeled HA(j) with

17
j = 1, ..., 6. The table shows raw weights w∗, with actual weights set to ws = w∗
s/∑12
i=1w∗
i .
Table 1: Alternative Weighting Schemes
w∗
1 w∗
2 w∗
3 w∗
4 w∗
5 w∗
6 w∗
7 w∗
8 w∗
9 w∗
10 w∗
11 w∗
12
HA(1) 1 2 4 8 16 32 32 16 8 4 2 1HA(2) 0.90 0.91 0.92 0.93 0.94 0.95 0.95 0.94 0.93 0.92 0.91 0.90
HA(3) 1 1 1 1/2 1/2 1/2 1/4 1/4 1/4 1/2 1/2 1/2HA(4) 32 72 102 92 82 72 62 52 42 32 22 12
HA(5) 30 31 32 42 32 31 32 42 32 31 30 30
HA(6) 30 31 32 30 31 32 30 31 32 30 31 32
HA(1) is intuitively similar to H0(5), but with a more precipitous and less smooth peakin the middle. HA(2) is intuitively similar to H0(4) but flatter. Note that the exponen-tial Almon function almost nests HA(2). HA(3) shows a quarterly pattern, if m = 12 isinterpreted as months, with more weight given to the last quarter (smallest index). Thisweighting scheme might be reasonable for seasonal data in which the relationship modeledholds better during, say, a high-volume transaction season. HA(4) shows a sharp seasonalspike occurring at a time other than the ends or middle of the low-frequency period, andHA(5) shows a bimodal weighting scheme. Finally, for a shorter cycle within each quarter,say, HA(6) shows a repeating quarterly pattern.
These various null and alternative weighting schemes serve two purposes. I use each toillustrate size and power of the MiDaS IV test. I use the rest as instruments. That is, the qcolumns ofW are the 11 linear combinations other than the one used in the DGP. Omittingthe one used in the DGP rules out collinearity with (zt) – especially for the null models.
Letting u(m)t = (ε
(m)t+1, x
(m)t ) and
A =
[
0 00 %
]
and var($t) =
[
1 aa 1
]
,
I consider a high-frequency DGP given by u(m)t = Au
(m)t−1 +$t for % = 0, 1 and a = 0, 1/2.
As such, the regressor is I(%) and may or may not be correlated with the error term. I setβ = 10, and perform each simulation 10, 000 times.

18
Table 2: Size and Power of the MiDaS Variable Addition Test
I(0) Regressors I(1) Regressors
a = 0 1/2 0 1/2
T = 25 50 100 25 50 100 25 50 100 25 50 100
H0(1) 0.10 0.04 0.03 0.10 0.05 0.03 0.09 0.04 0.03 0.12 0.09 0.12H0(2) 0.16 0.09 0.06 0.15 0.09 0.07 0.16 0.09 0.06 0.46 0.75 0.98H0(3) 0.16 0.09 0.07 0.15 0.09 0.06 0.16 0.09 0.07 0.15 0.08 0.06H0(4) 0.10 0.05 0.03 0.10 0.04 0.03 0.09 0.05 0.03 0.15 0.14 0.26H0(5) 0.10 0.04 0.03 0.10 0.05 0.03 0.10 0.04 0.03 0.10 0.05 0.05H0(6) 0.10 0.04 0.03 0.09 0.04 0.03 0.10 0.05 0.03 0.10 0.06 0.07
HA(1) 0.90 1.00 1.00 0.97 1.00 1.00 0.94 1.00 1.00 0.98 1.00 1.00HA(2) 0.22 0.31 0.64 0.28 0.46 0.84 0.22 0.33 0.67 0.31 0.54 0.90HA(3) 1.00 1.00 1.00 1.00 1.00 1.00 1.00 1.00 1.00 1.00 1.00 1.00HA(4) 1.00 1.00 1.00 1.00 1.00 1.00 1.00 1.00 1.00 1.00 1.00 1.00HA(5) 1.00 1.00 1.00 1.00 1.00 1.00 1.00 1.00 1.00 1.00 1.00 1.00HA(6) 1.00 1.00 1.00 1.00 1.00 1.00 1.00 1.00 1.00 1.00 1.00 1.00
Table 2 shows percentages of rejections using a test with a nominal size of 0.05. Theseare size under the six nulls and power against the six alternatives. The test appears to beextremely powerful against all of the alternatives except HA(2) – even at the small samplesize of 25. Recall from Figure 1 that the exponential Almon lag approximates HA(2)quite well, so no significant power should be expected against that alternative. Imposingthe Almon structure should not change the fit substantially, so a rejection might not bedesirable.
Compared to a nominal size of 0.05, the test appears to be undersized for many of thenulls with a sample size as small as 50. For a sample size of 25, size distortion is morenoticeable. None of the sizes appear larger than 0.10 for T ≥ 50, except in cases with anI(1) regressor correlated with the error term, which are not covered by Proposition 5.
Nevertheless, even in cases with an I(1) regressor correlated with the error term, sizedistortion is not always discernible. The proof of Proposition 5 suggests that non-normalityis only problematic for the single I(1) regressor in (pt). The remaining m− 1 regressors areI(0), and estimators of the corresponding coefficients are asymptotically normal, even withsuch correlation. The numerical results suggest that the normality of the I(0) regressorsmay in some sense dilute the non-normality of the single I(1) regressor. The case withthe most size distortion occurs under H0(2), a null that assigns a unit weight to the firstregressor, which is I(1), but zero weights to the remaining I(0) regressors. As the estimatedmodel approximates the null model, more weight is given to the asymptotically non-normalcoefficient estimates than to the asymptotically normal coefficient estimates. Similar intu-ition holds for H0(4), where relatively more weight is given to the first regressor, though thedistortion is less dramatic. Asymptotic normality is also violated under the remaining fournulls when a 6= 0, but the weight given to the asymptotically non-normal coefficient estimateis small enough and the limiting distribution is close enough to a chi-squared distribution

19
that the size distortion does not appear to be substantial.
5. An Application to Nowcasting Economic Activity
To illustrate the utility of CoMiDaS regressions, I consider a simple exercise of nowcastingannual log global real economic activity (RGDP) using past RGDP and high-frequencycovariates measured over the same period.
A major factor of production in any modern economy is energy, and such economies arehighly dependent on hydrocarbons and their substitutes. Oil use is particularly prevalentand its price naturally affects that of other energy sources. Although demand for and supplyof oil in the United States were major movers of oil prices before the 1970’s, the OPECera changed the landscape of oil supply in the 1970’s and into the 1980’s. By 1985-86, themarket power of OPEC collapsed. Moreover, in the last few decades the rise of demand inemerging economies, such as China, has fueled large demand increases. With a relativelyinelastic supply of oil in both short- and long-run senses, demand has become an importantdriver of price. Hotelling (1931) provided theoretical models for the price of an exhaustibleresource, such as oil. His perfect competition model provides a basis for a linear trend in thelog of prices. Under the more realistic assumption of imperfect competition, Hotelling notedthe importance of demand in determining price. Moreover, a number of recent papers haveemphasized the role of demand in determining oil prices – e.g., Barsky and Kilian (2004),Kilian (2008, 2009), and Hamilton (2009).
Hamilton (2009) noted the stability of the relationship between US real GDP and US oilconsumption over time. Extrapolating such a relationship to other developed and developingeconomies, and since oil is a factor production in global output and is traded globally, globalreal economic activity is a reasonable proxy for oil demand. Miller and Ni (2011) also madethis argument, noting empirical evidence supporting cointegration of log real oil prices(ROIL) with RGDP since 1986, but with a common stochastic trend fluctuating arounddifferent linear trends.
Another type of series that may be tied to global real economic activity is an index forinternational maritime shipping rates, such as the one constructed by Kilian (2009). Hispurpose for creating this index was quite different – he used a shipping index as a proxy foroil demand, later found to be cointegrated with oil prices by He et al. (2010). As noted byKlovland (2002) and others, maritime shipping is linked with economic activity.11 In thislight, such an index may be viewed as a leading indicator of economic activity. The BalticDry Index (BDI or RBDI for log real BDI) is one such index.
It is not surprising that once the logs of these series are linearly detrended12 the series are
11Klovland’s (2002) analysis focused on pre-WW1 data. Using more recent data from the WorldBank <http://data.worldbank.org> and UNCTAD <http://unctadstat.unctad.org>, international tradeaccounted for roughly 21% of world GDP in 2009.
12Since even the nonlinear-in-parameters MiDaS model is still linear in data, detrending is a logical firststep for dealing with a model that contains such a trend. I do not specifically allow for deterministic trendsin the econometric specification above, since the asymptotic distributions would contain additional nuisanceparameters from these trends. In spite of the nuisance parameters, all of the qualitative results should holdwith the addition of general trends of polynomial asymptotic order.

20
highly correlated. However, they are observed at different frequencies. Although RGDPmay be a demand proxy for ROIL and RBDI, the latter two are measured much morefrequently and accurately. Therefore, it is reasonable to use the informational content fromROIL and RBDI to try to predict RGDP.
No assumptions about the direction of causality need to made – nor should they be.Endogeneity may be expected in forecasting any of them using any of the others. Since thespecification above allows for the error to be correlated with the regressors, endogeneityis not problematic from an econometric point of view. To highlight even more clearly therobustness of the model for forecasting, I adopt a suboptimal modeling strategy of notexplicitly modeling lags of the indices in previous years, nor lags of the regressand beyondthe previous year. The error structure may therefore be correlated both serially and withthe regressors.
The model I estimate is adapted from (3) as
yt = δ′ct + ρyt−1 + β′∑m−1
k=0Πk+1(γ)x
(m)t−k/m + ηt,
where ct = (1, t)′ and ρ is not restricted to unity. Rolling back the indices on the errorterm and regressand for nowcasting rather than forecasting poses no econometric problem,since endogeneity is allowed. The diagonal weight matrix Πs is 2×2 with diagonal elementsπ1,s(γ1, γ2) and π2,s(γ3, γ4).
I use annual RGDP from 1985-2008 (T = 24) and monthly ROIL and RBDI over thesame period (m = 12).13 As a nowcasting exercise, I conduct one-step ahead forecasts ofRGDP using lagged RGDP and contemporaneous RBDI and ROIL for 2001 through 2008.The smallest sample therefore has T1 = 16, while the largest has T1 = 23. Note that withT = 24, m = 12, and two high-frequency regressors, a linear ADL model, with 29 parame-ters, or 27 after the identifying restriction, would be infeasible. Average sampling reducesthe parameters to 5, while using the two exponential Almon lag polynomials describedabove leaves 9.
Since the coefficients of the lag polynomial are exponential in their parameters, I restrictthe parameter space of γ to the hypercube bounded by (−5, 1) using a piecewise logisticfunction with each piece having equal derivatives at zero. These bounds were chosen so asnot to restrict the weighting schemes for m = 12. There is no numerical difference – up torounding error – between, say, (γ1, γ2) = (−5,−5) and (γ1, γ2) = (−6,−5). The monotonictransformation of the parameter space mutes the numerical sensitivity of the algorithm,providing more stable parameter estimates.
With such a small sample in mind, the number of instruments for the test should bekept to a minimal number, while still providing disparate weighting schemes. I choose threeinstruments – using weighting schemes described byH0(5), HA(5), andHA(6) above – basedon diversity. I conduct tests on each of the two lag polynomials separately.
13The global real GDP series used in this study is from Angus Maddison’s historical statistics(Maddison, 2010). Real oil price and real shipping rate series are created by dividing the West TexasIntermediate spot oil price series and the Baltic Dry Index by the US producer price index (all commodities).I take logs of the resulting series.

21
44
46
48
50
52
54
Real GDP (1990 Trillion GK$, solid)
One-step AR(1) Forecasts (dashed)
95% Confidence band (dotted)
36
38
40
42
2000 2001 2002 2003 2004 2005 2006 2007 2008
44
46
48
50
52
54
Real GDP (1990 Trillion GK$, solid)
One-step AR(1) + CoMiDaS Nowcasts (dashed)
95% Confidence band (dotted)
36
38
40
42
2000 2001 2002 2003 2004 2005 2006 2007 2008
Figure 2: (a) RGDP target and one-step AR(1) forecasts, and (b) RGDP target and one-step AR(1)
plus CoMiDaS nowcasts.
Table 3: Estimation of γ and VAT Results
RBDI ROIL
Subsample γ1 γ2 VAT γ3 γ4 VAT
1985-00 −0.00000154 −0.00001770 2.06 −0.00000007 −0.00000246 21.131985-01 −0.00000025 −0.00000658 2.10 −0.00000043 −0.00000280 18.271985-02 −0.00000082 −0.00001051 1.71 −0.00000011 −0.00000061 16.251985-03 −0.00007397 −0.00090516 1.44 0.00000046 0.00005264 7.301985-04 −0.02267300 −0.28054330 0.29 −0.00067434 0.00130722 4.181985-05 −0.00010143 −0.00129093 0.85 −0.00000433 −0.00003896 6.221985-06 −0.00000212 −0.00002778 0.61 −0.00000006 −0.00000060 6.581985-07 −0.00000092 −0.00001092 1.25 0.00000017 0.00000200 4.77
Table 3 summarizes the results of estimation and testing. The deep parameter vector γis estimated to be very close to zero and slightly negative for most of subsamples and lag

22
-0.5
0.0
0.5
1.0
1.5
2.0
Deviations from Real GDP (1990 Trillion GK$) of ...
One-step AR(1) Forecasts (triangles)
One-step AR(1) + CoMiDaS Nowcasts (squares)
-2.0
-1.5
-1.0
-0.5
2000 2001 2002 2003 2004 2005 2006 2007 2008
Figure 3: Deviations of one-step AR(1) forecasts and AR(1) plus CoMiDaS nowcasts from RGDP.
polynomials. This result suggests a nearly flat weighting scheme, with slightly more empha-sis on recent RBDI and ROIL. In other words, shipping rates and oil prices in December areslightly more influential than those in January for nowcasting RGDP. This result is sensiblein light of the results of Chambers (2003) and Miller (2011), which suggest that averagesampling of the regressors is most efficient when the regressand is aggregated in the sameway and the regression is cointegrating.
Compared to a χ23 critical value of 7.81 at 5% significance, I cannot reject the MiDaS null
for any of the subsamples for RBDI and most for ROIL. Non-rejection provides evidencesupporting the adequacy of CoMiDaS specification.14 In light of the simulation results inTable 2, some size distortion is to be expected, since the series are most likely I(1) andcointegrated, but the regressor is not strictly exogenous. Since the weights are estimatedto be close to flat – i.e., H0(1) , the size distortion is not likely to be severe.
Finally, Figures 2 and 3 show the CoMiDaS nowcasts and simple AR(1) forecasts for2001-08, compared to the target expressed in trillions of 1990 Geary-Khamis dollars. 95%confidence bands were calculated using a simple bootstrap, which should be conservativelywide if serial correlation is present. The CoMiDaS nowcasts evidently track the targetmore closely than the AR(1) forecasts until 2007, when both forecasts overshoot the target.Overshooting in 2007 could result from revision of the 2007 RGDP datum following theglobal recession that began in late 2007. The difference in 2008 becomes clear, as theAR(1) forecast continues to overshoot, while that of the CoMiDaS nowcast corrects for therecession. The correction comes from a precipitous drop in ROIL and RBDI that did notoccur until 2008.
14I cannot reject a null of flat aggregation against MiDaS, either, using an LR test similar to the LM testof Andreou et al. (2010a). Results not shown.

23
6. Concluding Remarks
The MiDaS specification introduced by Ghysels et al. (2004) provides a very useful parsimo-nious specification for regression and forecasting using high-frequency regressors. Asymp-totic analyses by Ghysels and his coauthors support a range of mixed-frequency models forwhich the nonlinear ADL specification may be useful. This paper broadens this range sub-stantially by introducing CoMiDaS regressions, allowing for the possibility of cointegrationof series that contain unit roots. Moreover, the asymptotic analysis allows for the possibilityof correlation of the error term serially and with both I(1) and I(0) regressors. In this light,my results promote the MiDaS approach to mixed-frequency time series by extending thevalidity of the approach.
Further, I present a simple variable addition test of the MiDaS null against a moregeneral ADL specification. The test is feasible even when the number of high-frequencyregressors is large relative to the low-frequency sample size, which is precisely when theMiDaS specification is most useful. Both asymptotic and simulated results suggest thatthe test suffers very little size distortion in most cases, while enjoying substantial power insamples as small as T = 25.
An application to nowcasting global real economic activity using a lag and using con-temporaneous real oil prices and an index of real maritime shipping prices illustrates theutility of CoMiDaS regressions and of the proposed MiDaS variable addition test.
Appendix A: Proofs of the Theoretical Results
The following ancillary lemma collects results to make the ensuing proofs more tractable.
Lemma A1. Under Assumptions [A3]-[A4] and for an arbitrary (n0 + 1)-vector a withfinite norm,
[a] T−1∑
t(b0tb′
0t − Σ00)a→p 0
[b] T−1/2∑
t(b0tb′
0t − Σ00)a→d (In0+1 ⊗ a′)N (0,Ξ),
[c] T−1∑
t p1tb′
0t →d
∫
B1dB′
0 +∆′
01, and
[d] T−2∑
t p1tp′
1t →d
∫
B1B′
1.
The convergences in parts [b]-[d] are joint, but the limiting distribution in [b] is independentof those in parts [c] and [d].
Proof of Lemma A1. Proofs of parts [a] and [b] for the univariate case are given byTheorems 3.7 and 3.8 of Phillips and Solo (1992). By Assumption [A3], the vector b0tb
′
0tamay be written as
∑∞
i=0Ψiv0,t−iv
′
0,t−iΨ′
ia+∑∞
r=1
∑∞
i=0Ψiv0,t−iv
′
0,t−i−rΨ′
i+ra
+∑∞
r=1
∑∞
i=0Ψi+rv0,t−i−rv
′
0,t−iΨ′
ia,
24
where (v0,t) is an mds with respect to (Ft−1). This expression is
b0tb′
0ta = (I ⊗ a′)Ξ00(L)w00,t + (I ⊗ a′)∑∞
r=1(Ξ0r(L)w0r,t + Ξr0(L)wr0,t),
using the matrix polynomial Ξrs(z) ≡∑
∞
k=0(Ψk+r ⊗Ψk+s)zk and wrs,t ≡ (v0,t−r ⊗ v0,t−s).
Similarly to Phillips and Solo (1992), a Beveridge-Nelson decomposition (Beveridge andNelson, 1981) may be applied to the matrix polynomial Ξrs(z), so that Ξrs(z) = Ξrs (1) −(1− z) Ξrs (z), where Ξrs (z) =
∑
∞
i=0
∑
∞
j=i+1(Ψj+r ⊗ Ψj+s)zi. Subtracting Eb0tb
′
0ta =(I ⊗ a′)Ξ00(1)Ew00,t and adding across t shows that the summation in parts [a] and [b] is
(I ⊗ a′)∑
t
[
Ξ00(1)(w00,t −Ew00,t) +∑∞
r=1(Ξ0r(1)w0r,t + Ξr0(1)wr0,t)
]
(14)
− (I ⊗ a′)∑
t
[
Ξ00(L)4w00,t +∑∞
r=1(Ξ0r(L)4w0r,t + Ξr0(L)4wr0,t)
]
,
and the leading term in square brackets drives the asymptotic results.Under Assumptions [A3]-[A4] the LLN and CLT for variances of Phillips and Solo (1992)
apply directly for elements of wrs,t that are squares of single elements of vt. The general-ization of their asymptotics to multivariate series requires generalizing the LLN and CLTto covariances. I present only a sketch of the proof, since the details are tedious but followin a straightforward manner from Phillips and Solo (1992).
The matrix Ξ in the limiting variance of the CLT is the same as that defined in Section3. Specifically,
Ξ ≡ E[b0tb′
0t ⊗ b0tb′
0t]−E[b0t ⊗ b0t]E[b′0t ⊗ b′0t]
= Ξ00(1)K00Ξ′
00(1) +∑∞
r=1Ξ0r(1)K0•Ξ
′
0r(1) + Ξr0(1)K0•Ξ′
r0(1)
+ Ξ0r(1)K•0Ξ′
r0(1) + Ξr0(1)K•0Ξ′
0r(1)
where
K00 ≡ E[v0tv′
0t ⊗ v0tv′
0t]−E[v0t ⊗ v0t]E[v′0t ⊗ v′0t]
K0• ≡ E[v0tv′
0t ⊗ v0t−•v′
0,t−•]
K•0 ≡ E[v0,t−•v′
0t ⊗ v0tv′
0,t−•]
are time-invariant by assumption, so that • is just a placeholder.A sufficient condition that Phillips and Solo (1992) employ is that
∑
∞
s=1 sψ2s < ∞.
For the multivariate case, a representation element of the matrix (Ψi+r ⊗ Ψi+s) may bewritten as ψjk,i+rψuv,i+s, such that Ψi+r = [ψjk,i+r] and Ψi+s = [ψuv,i+s]. The mul-tivariate generalization is straightforward under the analogous sufficient condition that∑
∞
s=0 s |ψjk,sψuv,s| <∞. Note that
∑∞
s=0s |ψjk,sψuv,s| ≤
∑∞
s=0smax
j,k|ψjk,s|
2 ≤∑∞
s=0smax
j,k|ψjk,s| ≤
∑∞
s=0s ‖Ψs‖
which is finite under Assumption [A3]. The last equality follows from one of the relationshipsbetween matrix norms presented by Lutkepohl (1996, pg. 111), for example. Similarly to

25
Phillips and Solo (1992), the second square-bracketed term of (14) may be shown to beop
(
T 1/2)
, so that it may be ignored in both parts [a] and [b]. The limiting variance in part[b] follows directly from the variance of the square-bracketed expression in the first term of(14).
The proofs of parts [c] and [d] follow from standard asymptotic arguments using theinvariance principle of Phillips and Solo (1992).
Finally, the joint convergence and independence of the limiting distribution in part [b]from those in [c] and [d] follows along logic similar to that of Chang et al. (2001). The joint
convergence follows from the convergence of T−1/2∑[Tr]
t=1 bt under the stated assumptions.Moreover, the leading term of (14) is a martingale under Assumption [A4], so that E[((v0,t⊗v0,t) − E[v0,t ⊗ v0,t])v
′
s] = 0 for s 6= t. For s = t, the equality holds if the third momentmatrix of (vt) is zero. Since this expected value is zero, the limiting distribution in part[b] is uncorrelated with the limiting Brownian motion B (r) in parts [c] and [d]. Normalitythen implies independence.
Proof of Theorem 1. As noted above, Assumptions [A1]-[A2] and [N1]-[N3] are sufficientto write the difference g(θNLS)−g(θmin) asM
−1T PT , with PT = (NT −N)−(MT −M)M−1N
as defined above. Using parts [a] and [c] of Lemma A1, NT −N is op (1) for I(0) regressorsand Op (1) for I(1) regressors. Using part [a], [c], and [d], MT −M is op (1) for productsof I(0) regressors, Op (T ) for products of I(1) regressors, and Op (1) for cross-products ofI(0) and I(1) regressors. M is O (1) for products of I(0) regressors and cross-products, butO (T ) for products of I(1) regressors. As a result, M−1 is O (1) in the upper left block, butO(
T−1)
in all other blocks. Since N is O (1), the entire second term of PT is op (1) forrows corresponding to the the I(0) regressors and Op (1) for those of the I(1) regressors, sothat the respective rows of PT itself are op (1) and Op (1). Finally, similarly to M−1, M−1
T
is Op (1) for products of I(0) regressors, but Op
(
T−1)
for products of I(1) regressors andcross-products, which gives the result.
Proof of Corollary 2. The consistency in Theorem 1 is sufficient for the proof of thecorollary, if g (θ) is continuous at θmin, as I assume, and if θmin such that the first-ordercondition of the MSFE minimization problem is satisfied. Assumptions [N1]-[N2] and [N3’]are sufficient for the latter.
Proof of Theorem 3. I employ the Wooldridge conditions for the proof of his Theorem10.1 (Wooldridge, 1994, pg. 2711). Conditions (i)-(iii) of Wooldridge (1994) are satisfiedby Assumption [N3] and by construction of QT (θ) – in particular by the linearity of theCoMiDaS regression in g.
It only remains to show the joint convergence of
(ν−1/2T HT (g(θmin))ν
−1/2T , ν
−1/2T JT (g(θmin))).
The convergence of
ν−1/2T HT (g(θmin))ν
−1/2T = ν
−1/2T TMT ν
−1/2T →d H
26
is an immediate consequence of parts [a], [c], and [d] of Lemma A1.
The convergence of ν−1/2T JT (g(θmin)) = −ν
−1/2T TPT also follows from Lemma A1, but
is more involved. Looking at each component of PT separately,
M−1 =
[
Σ−1pp +O
(
T−1)
O(
T−1)
−T−1Ω−111 ∆
′
p1Σ−1pp + o
(
T−1)
T−1Ω−111 + o
(
T−1)
]
and
MT −M =
[
Op
(
T−1/2)
Op (1)Op (1) Op (T )
]
from parts [b], [c], and [d] of Lemma A1. T (MT −M)M−1 simplifies to
[ ∑
t p0tp′
0t − Σpp 0∑
t p1tp′
0t −∆′
p1 T−1∑
t p1tp′
1t − Ω11
] [
Σ−1pp 0
−Ω−111 ∆
′
p1Σ−1pp Ω−1
11
]
+
[
Op (1) Op (1)Op (T ) Op (T )
]
using these asymptotic rates.Partitioning PT = (P ′
0T , P′
1T )′ conformably with pt = (p′0t, p
′
1t)′, it follows that
T 1/2P0T = T−1/2E′∑
t(b0tb
′
0t − Σ00)κ→d (E′ ⊗ κ′)N (0,Ξ)
where the convergence follows from part [b] of Lemma A1.Further, P1T may be written as
P1T = T−1∑
t(p1tb
′
0t −∆′
01)κ−(
T−2∑
tp1tp
′
1tΩ−111 − I
)
ζ
so that convergence
P1T →d
∫
B1dB′
0κ−
(∫
B1B′
1Ω−111 − I
)
ζ
follows from parts [c] and [d] of Lemma A1. Finally, since the convergences are joint,condition (iv) of Wooldridge (1994) is satisfied and the stated result is obtained.
Proof of Corollary 4. The proof is similar to that of the preceding theorem, but [N2’]and [N3’] are needed to ensure conditions (i) and (ii) of Wooldridge’s (1994) Theorem 10.1.I next verify condition (iv) and then condition (iii) last.
To analyze the score, note that
(ν∗T )−1J∗
T (θ) =
[
T−1/2 ∂g′
0(θ)
∂θ00
T−1 ∂g′
0(θ)
∂θ1T−1 ∂g
′
1(θ)
∂θ1
]
[
TP0T
TP1T
]
=
[
∂g′0(θ)
∂θ0T 1/2P0T
∂g′1(θ)
∂θ1P1T +
∂g′0(θ)
∂θ1P0T
]
comes from the partitioning of θ = (θ′0, θ′
10, θ′
11)′ discussed above. Convergence of T 1/2P0T
and P1T is the same as in the proof of the preceding theorem, so that (ν∗T )−1J∗
T (θmin) →d
J∗(θmin).

27
The first term of the Hessian (ν∗T )−1(∂g′(θ)/∂θ)TMT (∂g(θ)/∂θ
′)(ν∗T )−1 is
∂g′0(θ)
∂θ0M00,T
∂g0(θ)∂θ′
0
0
0∂g′
1(θ)
∂θ1T−1M11,T
∂g1(θ)∂θ′
1
+Op
(
T−1/2)
using parts [a] and [c] of Lemma A1. The limiting distribution H(θmin) at θmin then followsfrom parts [a] and [d]. To show that the remaining term is negligible, note that (TP ′
T ⊗ I)is a g × gn matrix
The ng × g matrix of second derivatives ∂vec (∂g(θ)′/∂θ) /∂θ′ has only zeros in theblock consisting of the last ng1 rows and first g0 columns, due to the partitioning of θ =(θ′0, θ
′
10, θ′
11)′. Scaling by (ν∗T )
−1 allows
(∂vec(
∂g′(θ)/∂θ)
/∂θ′)(ν∗T )−1 =
[
T−1/2V00(θ) T−1V01(θ)0 T−1V11(θ)
]
,
where the matrices V00(θ) (ng0 × g0), V11(θ) (ng1 × g1), and V01(θ) (ng0 × g1) are definedby the second derivatives. Further, (TP ′
T ⊗ I) may be written as
(TP ′
T ⊗ I) =[
(TP ′
0T ⊗ Ig) (TP ′
1T ⊗ Ig)]
,
so that (TP ′
T ⊗ I)(∂vec (∂g′(θ)/∂θ) /∂θ′)(ν∗T )−1 is
[
(T 1/2P ′
0T ⊗ Ig)V00(θ) (P ′
0T ⊗ Ig)V01(θ) + (P ′
1T ⊗ Ig)V11(θ)]
,
which is Op (1) from the previous theorem. Premultiplying by (ν∗T )−1 renders the entire term
Op
(
T−1/2)
, so that it is asymptotically negligible. Condition (iv) of Wooldridge (1994) isthus satisfied.
Finally, condition (iii) requires that an increasing sequence µT exists, such that µT (ν∗
T )−1 →
0 andmaxθ∈ΘT
∥
∥µ−1T (HT (θmin)−HT (θ∗))µ
−1T
∥
∥ = op (1) , (15)
where ΘT ≡ θ∗ ∈ Θ : ||µT (θ∗ − θmin)|| ≤ 1 is a sequence of shrinking neighborhoods ofθmin.
The matrix inside the norm in (15) is
µ−1T (h′(θmin)TMTh(θmin)− h′(θ∗)TMTh(θ∗))µ
−1T (16)
− µ−1T
(
(T ((g(θmin)− α)′MT −N ′
T )⊗ I)k(θmin)−(T ((g(θ∗)− α)′MT −N ′
T )⊗ I)k(θ∗)
)
µ−1T ,
where h(θ) ≡ ∂g(θ)/∂θ′ and k(θ) ≡ ∂vec(∂g′(θ)/∂θ)/∂θ′. Condition (iii) requires that thereexists a sequence (µT ) such that (16) is op (1).
Similarly to Chang et al. (2009), let µT = (ν∗T )1−δ and θ∗ = θmin+(ν∗T )
1−δ for arbitrarilysmall δ > 0. Moreover, let
g(θ∗) = g(θmin) +R0, h(θ∗) = h(θmin) +R1, and k(θ∗) = k(θmin) +R2 (17)

28
with R0, R1, and R2 defined as conformable vectors or matrices. The elements of each ofthese are at most Op(T
−1/2+δ/2) from the mean value theorem and the existence of thirdderivatives of g(θ) assumed by [N2’].
The first term of (16) may be written as
(ν∗T )δ−1(h′(θmin)TMTR1 +R′
1TMTh(θmin) +R′
1TMTR′
1)(ν∗
T )δ−1
by expanding h′(θ∗)TMTh(θ∗) using (17). Since R1 is no larger than O(T−1/2+δ/2), νδT isno larger than O(T δ), and from the convergence of the first term of the Hessian above, theentire first term of (16) is no larger than Op
(
T−1/2+5δ/2)
. There exists some small δ > 0such that this is op (1).
The second term of (16) may be written as
(ν∗T )δ−1((TPT ⊗ I)R2 + (R′
0TMT ⊗ I) (k(θmin) +R2))(ν∗
T )δ−1
using (17). By the same logic, this term is also op (1), so that (15) and, consequently,condition (iii) of Wooldridge (1994) are satisfied.
Proof of Proposition 5. Rewriting (13) as ηt+1 = p′tW∗ς + et, an F-test of the whole
regression takes the form qF = T (ς − ς)′W ∗′MTW∗(ς − ς)/σ2e , where ς is the least squares
estimator of ς and σ2e is the usual variance estimator of (et). The distribution for a test onthe subvector ς1 is based on that for the whole regression, but with reduced rank.
The least squares estimator may be written as ς = (W ∗′MTW∗)−1W ∗′λT using the
restricted estimator in (9) and the NLS residuals in (12). Furthermore, λT − λ may bewritten as
λT − λ = (NT −N)− (MT −M)(g(θNLS)− α)−M(g(θNLS)− α− τ∗),
using the restricted estimator and the minimum MSFE parameter vector. When optimizedproperly, the second term becomes (MT −M)τ∗ and the third term becomes zero. Thecoefficient ς is equal to
ς = (W ∗′MW ∗)−1W ∗′N − (W ∗′MW ∗)−1W ∗′M(w(θmin)βmin − wβ)) = (W ∗′MW ∗)−1W ∗′λ
using the minimum MSFE parameter vector. Subtracting ς from ς yields
ς − ς = (W ∗′MTW∗)−1W ∗′((NT −N)− (MT −M)ξ)
after some algebra, where ξ ≡ τ∗ +W ∗(W ∗′MW ∗)−1W ∗′λ.Consider the case of part [a] with only I(0) regressors. Using the definitions of MT and
NT , the above expression may be further rewritten as
ς − ς = (W ∗′MTW∗)−1W ∗′E′
(
T−1/2∑
t(b0tb
′
0t − Σ00))
κ
with κ = (1,−ξ′)′. Using this notation, it is clear that
T 1/2(ς − ς) →d (W ∗′ΣppW∗)−1W ∗′(E′ ⊗ κ′)N (0,Ξ)

29
by part [b] of Lemma A1. In order to show the chi-squared distribution, the exact varianceis necessary. Some rather tedious but straightforward algebra using standard results forfourth moments of multivariate normal distributions shows that
(E′ ⊗ κ′)Ξ(E ⊗ κ) = (σ2ε + ξ′Σppξ − 2ξ′σpε)Σpp + (σpε − Σppξ)(σpε − Σppξ)′
Under the null, τ∗ = 0 and λ = N = σpε, so that
W ∗′(E′ ⊗ κ′)Ξ(E ⊗ κ)W ∗ = (σ2ε − σεpW∗(W ∗′ΣppW
∗)−1W ∗′σpε)W∗′ΣppW
∗
and the asymptotic variance of the estimator is therefore
(σ2ε − σεpW∗(W ∗′ΣppW
∗)−1W ∗′σpε)(W∗′ΣppW
∗)−1.
To get a chi-squared distribution, the first factor must equal the probability limit of σ2e .The estimator σ2e is equal to
σ2e = T−1∑
te2t = T−1
∑
t
(
εt+1 − p′tM−1T (NT − λT )− p′tW
∗(W ∗′MTW∗)−1W ∗′λT
)2
using the expression for ς above and the restricted estimator in (9). Expanding the squareyields
σ2e = T−1∑
tε2t+1 −N ′
TM−1T NT + λ′T (M
−1T −W ∗(W ∗′MTW
∗)−1W ∗′)λT . (18)
Under the null, the probability limit is in fact σ2e = σ2ε − σεpW∗(W ∗′ΣppW
∗)−1W ∗′σpε.Finally, the degrees of freedom of the limiting chi-squared distribution for the whole
regression comes from the rank q + 1 of W ∗′ΣppW∗. The degrees of freedom for the test of
the subvector ς1 comes from the difference in rank between W ∗′ΣppW∗ and w′Σppw, which
is q. This completes the proof of part [a].More generally, the n-vector (pt) is assumed to be partitioned into I(0) and I(1) com-
ponents, but W ∗′ takes q + 1 linear combinations defined by the q variables added. Theselinear combinations are themselves cointegrated regressors, and may be handled along thelines of Park and Phillips (1989). Define a (q+1)× (q+1) orthogonal matrix A = (A0, A1)such that AA′ = I and such that A′
0W∗′pt ≡ z0t ∼ I(0) and A′
1W∗′pt ≡ z1t. These matrices
rotate the regressor space so that the first component lies in the span of the (m − 1)-dimensional cointegrating space and the second lies in the unidimensional space orthogonalto the cointegrating space.
Much of the notation used in the remainder of the proof is recycled from Section 3,with the difference being the rotation. I redefine bt ≡ (εt+1, z
′
0t,4z1t)′ as a (q + 2)-vector,
b0t ≡ (εt+1, z′
0t)′, and b1t ≡ 4z1t, so that the limiting variance from an invariance principle
using (bt) is
Ω =
ω2ε ωεz ωε1
ωzε Ωzz ωz1
ω1ε ω1z ω11
or Ω =
[
Ω00 Ω01
Ω10 Ω11
]
in place of Ω in Section 3. All of the relevant variances in this proof are partitioned in thesame way. Brownian motions are redefined accordingly.

30
I redefine the normalization matrix νT ≡ diag(T 1/2Iq, T ) to be a (q+1)×(q+1) diagonalmatrix. I redefine κ ≡ (1,−λ∗′0 Σ
−1zz )
′ as a (q + 1)-vector, ζ ≡ (λ∗1 − δ′z1Σ−1zz λ
∗
0) as a scalar,where λ∗ ≡ A′W ∗′λ is a (q + 1)-vector partitioned as λ∗ = (λ∗′0 , λ
∗
1)′. I redefine E′ as the
unitary matrix that selects all but the first row of the following matrix of (q + 1) rows.In part [b], there is at least one I(0) combination of (W ∗′pt) – i.e., z0t 6= 0. The estimator
may be written asνTA
′(ς − ς) = H−1T JT
where HT ≡ ν−1T AW ∗′TMTW
∗A′ν−1T and JT ≡ ν−1
T A′W ∗′T ((NT − N) − (MT −M)ξ) areredefined from Section 3 with
ξ ≡ τ∗ +W ∗A(A′W ∗′MW ∗A)−1λ∗
redefined from part [a] of this proof. Under the null, τ∗ = 0 and
HT =
[
T−1∑
t z0tz′
0t T−3/2∑
t z0tz1tT−3/2
∑
t z1tz′
0t T−2∑
t z21t
]
→d
[
Σzz 00
∫
B21
]
≡ H,
and
JT =
[
J0TJ1T
]
→d
[
A′
0W∗′(E′ ⊗ κ′)N (0,Ξ)
∫
B1dB′
0κ− (∫
B21ω
−111 − 1)ζ
]
≡ J,
where
J0T ≡ T−1/2E′∑
t(b0tb
′
0t − Σ00)κ
J1T ≡ T−1∑
t(z1tb
′
0t − δ′01)κ+ T−2∑
t(z21tω
−111 − T )ζ
using some algebra and limits along the same lines as the proof of Theorem 3. The variancematrix Ξ is defined exactly as in Section 3.
The test statistic may be rewritten as
qF = (ς − ς)′AνT ν−1T A′W ∗′TMTW
∗Aν−1T νTA
′(ς − ς)/σ2e
and it follows from above that νTA′(ς − ς) →d H
−1J and ν−1T A′W ∗′TMTW
∗Aν−1T →d H.
In order for J to be a multivariate normal vector, the I(1) regressor must be strictly ex-ogenous. This assumption implies that the I(0) regressors, defined by first differences of theI(1) regressor, are also strictly exogenous. However, I do not assume the I(0) regressors tobe strictly exogenous. This allowance serves two purposes: (i) it leaves open the possibilityfor additional I(0) regressors, and, more importantly, (ii) it shows that only one element ofthe multivariate normal vector is not robust to the assumption.
The variance of the first q elements of J is given by A′
0W∗′(E′ ⊗ κ′)Ξ(E ⊗ κ)W ∗A0 =
(σ2ε − σεzΣ−1zz σzε)Σzz along exactly the same lines as the proof of part [a]. (This reduces
to σ2εΣzz when the I(0) regressors are strictly exogenous.) The covariances of each ofthese elements with the remaining element of J is zero from the independence in LemmaA1. Under the assumptions of both strict exogeneity and that the error sequence is anmds, the distribution of the last element of J reduces to σε(
∫
B21)
1/2N(0, 1). Under theseassumptions, σ2ε − σεzΣ
−1zz σzε = σ2ε , so that the distribution of J is σεH
1/2N(0, 1).

31
The asymptotics for σ2e are similar to part [a]. Under the null, λT = NT , so that inN ′
TW∗(W ∗′MTW
∗)−1W ∗′NT is the second term of (18). This term may be rewritten as
T 1/2N ′
TW∗Aν−1
T (ν−1T A′W ∗′TMTW
∗Aν−1T )−1ν−1
T A′W ∗′T 1/2NT
and it is clear that ν−1T A′W ∗′TMTW
∗Aν−1T →d H as above. The remaining factors,
ν−1T A′W ∗′T 1/2NT and its transpose, have limits consisting of σzε and σεz as the first qrows and columns, respectively, with the single remaining element of each being zero.These zeros eliminate the last row and column of H, so that the result is σ2e →p σ2ε −σεpW
∗A0(A′
0W∗′ΣppW
∗A0)−1A′
0W∗′σpε, or more simply σ2ε since σεp = 0 under these as-
sumptions. The degrees of freedom of the chi-squared limit follows similarly to that in part[a].
Appendix B: Proofs of LLN and CLT for Covariances
(This appendix is not intended for publication and is included to support my claim in LemmaA1. I closely follow results and proofs of Phillips and Solo, 1992, pp. 978-980 and 990-993,contributing only by extending their results to covariances, a necessity for the multivariateextension. Phillips and Solo covered autocovariances, but not general covariances.)
A representative element of the matrix polynomial Ξrs(z) may be written as crs(z) =∑
∞
i=0 ψjk,i+rψuv,i+szk, so that a representative element of the vector in (14), up to premul-
tiplication by (I ⊗ a′), is
∑
tξυtξut =
∑
t
[
c00(1)(υtut − συu) + υtuct−1 + utυ
ct−1
]
(19)
−∑
t
[
(1− L) ζ00,t +∑∞
r=1(1− L) ζ0r,t +
∑∞
r=1(1− L) ζr0,t
]
where συu ≡ E[υtut], c is defined relative to c in the same way as Ξ is defined relativeto Ξ, ut and υt are arbitrary scalar elements of v0,t, u
ct−1 ≡
∑
∞
r=1 c0r (1)ut−r, υct−1 ≡
∑
∞
r=1 cr0 (1) υt−r, and ζrs,t ≡ crs (L) υt−rut−s.The autocovariance structure of (ξυt) and (ξut) defined above is such that E [ξυtξu,t−k] =
συuck0 (1) and E [ξutξυ,t−k] = σuυc0k (1). Variances of (υct−1) and (uct−1) are σ
2υ
∑
∞
r=1 c2r0 (1)
and σ2u∑
∞
r=1 c20r (1). I denote these by σ2υc and σ2uc and note that they are finite by As-
sumptions [A3] and [A4] and an obvious substitution in the proof of Lemma 3.6 of Phillipsand Solo (1992). Similarly, the covariances of these series, σ2uυc = σuv
∑
∞
r=1 c0r (1) cr0 (1) isalso finite under these assumptions.
The following Lemma is completely analogous to Lemma 5.9 of Phillips and Solo (1992).
Lemma B1. Under Assumptions [A3]-[A4], E(∑
∞
r=1 ζ0r,T )2,E(
∑
∞
r=1 ζr0,T )2 <∞.
Proof of Lemma B1. I prove only the first result and appeal to symmetry for the second.Note that
E(∑∞
r=1ζ0r,T )
2 =∑∞
r=1
∑∞
i=0
∑∞
r′=1
∑∞
i′=0c0r,ic0r′,i′E[υT−iυT−i′uT−i−ruT−i′−r′ ],
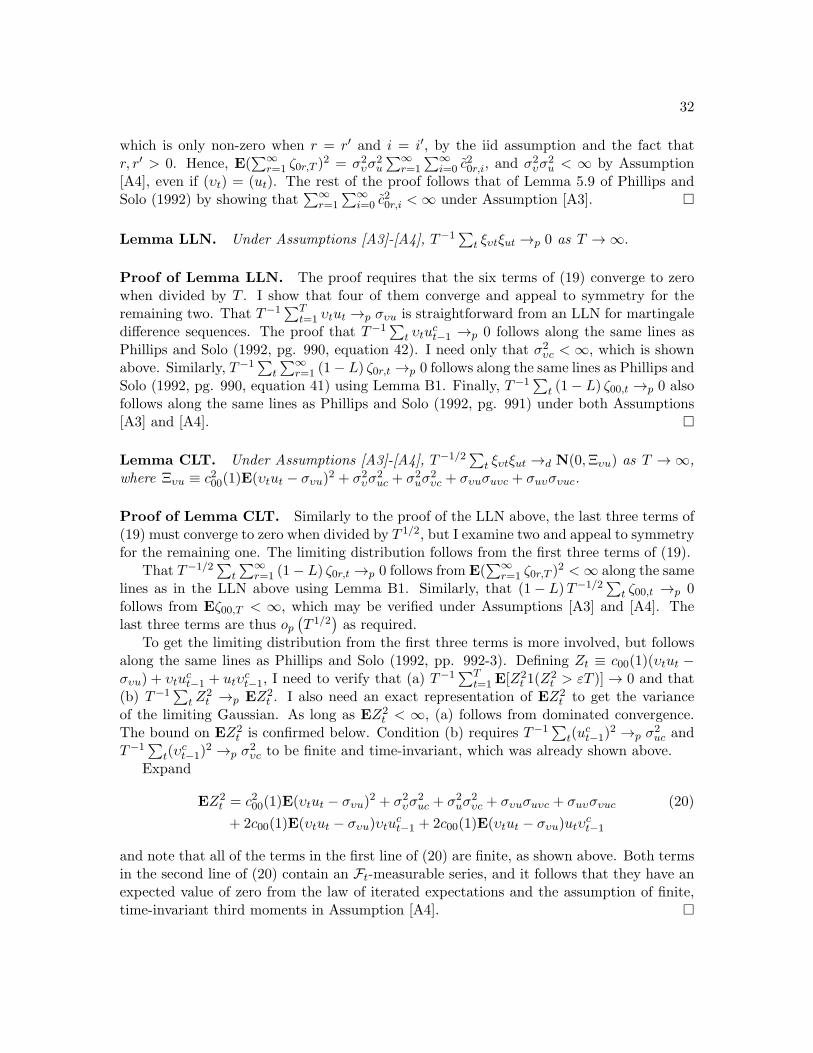
32
which is only non-zero when r = r′ and i = i′, by the iid assumption and the fact thatr, r′ > 0. Hence, E(
∑
∞
r=1 ζ0r,T )2 = σ2υσ
2u
∑
∞
r=1
∑
∞
i=0 c20r,i, and σ2υσ
2u < ∞ by Assumption
[A4], even if (υt) = (ut). The rest of the proof follows that of Lemma 5.9 of Phillips andSolo (1992) by showing that
∑
∞
r=1
∑
∞
i=0 c20r,i <∞ under Assumption [A3].
Lemma LLN. Under Assumptions [A3]-[A4], T−1∑
t ξυtξut →p 0 as T → ∞.
Proof of Lemma LLN. The proof requires that the six terms of (19) converge to zerowhen divided by T . I show that four of them converge and appeal to symmetry for theremaining two. That T−1
∑Tt=1 υtut →p συu is straightforward from an LLN for martingale
difference sequences. The proof that T−1∑
t υtuct−1 →p 0 follows along the same lines as
Phillips and Solo (1992, pg. 990, equation 42). I need only that σ2υc < ∞, which is shownabove. Similarly, T−1
∑
t
∑
∞
r=1 (1− L) ζ0r,t →p 0 follows along the same lines as Phillips andSolo (1992, pg. 990, equation 41) using Lemma B1. Finally, T−1
∑
t (1− L) ζ00,t →p 0 alsofollows along the same lines as Phillips and Solo (1992, pg. 991) under both Assumptions[A3] and [A4].
Lemma CLT. Under Assumptions [A3]-[A4], T−1/2∑
t ξυtξut →d N(0,Ξυu) as T → ∞,where Ξυu ≡ c200(1)E(υtut − συu)
2 + σ2υσ2uc + σ2uσ
2υc + συuσuυc + σuυσυuc.
Proof of Lemma CLT. Similarly to the proof of the LLN above, the last three terms of(19) must converge to zero when divided by T 1/2, but I examine two and appeal to symmetryfor the remaining one. The limiting distribution follows from the first three terms of (19).
That T−1/2∑
t
∑
∞
r=1 (1− L) ζ0r,t →p 0 follows from E(∑
∞
r=1 ζ0r,T )2 <∞ along the same
lines as in the LLN above using Lemma B1. Similarly, that (1− L)T−1/2∑
t ζ00,t →p 0follows from Eζ00,T < ∞, which may be verified under Assumptions [A3] and [A4]. Thelast three terms are thus op
(
T 1/2)
as required.To get the limiting distribution from the first three terms is more involved, but follows
along the same lines as Phillips and Solo (1992, pp. 992-3). Defining Zt ≡ c00(1)(υtut −συu) + υtu
ct−1 + utυ
ct−1, I need to verify that (a) T−1
∑Tt=1E[Z2
t 1(Z2t > εT )] → 0 and that
(b) T−1∑
t Z2t →p EZ2
t . I also need an exact representation of EZ2t to get the variance
of the limiting Gaussian. As long as EZ2t < ∞, (a) follows from dominated convergence.
The bound on EZ2t is confirmed below. Condition (b) requires T−1
∑
t(uct−1)
2 →p σ2uc and
T−1∑
t(υct−1)
2 →p σ2υc to be finite and time-invariant, which was already shown above.
Expand
EZ2t = c200(1)E(υtut − συu)
2 + σ2υσ2uc + σ2uσ
2υc + συuσuυc + σuυσυuc (20)
+ 2c00(1)E(υtut − συu)υtuct−1 + 2c00(1)E(υtut − συu)utυ
ct−1
and note that all of the terms in the first line of (20) are finite, as shown above. Both termsin the second line of (20) contain an Ft-measurable series, and it follows that they have anexpected value of zero from the law of iterated expectations and the assumption of finite,time-invariant third moments in Assumption [A4].

33
The last step in the generalization is to extend the univariate covariance in Lemma CLTto the multivariate variance Ξ in Lemma A1. The matrix K00 consists of elements of theform E(υ1tu1t − συu)(υ2tu2t − συu). The scalar limit theory above considers explicitly thecase of υ1t = υ2t and u1t = u2t, but there is no loss of generality for different elementsυ1t, υ2t, u1t, u2t of the vector v0t. Since crs(z) =
∑
∞
i=0 ψjk,i+rψuv,i+szk was chosen for arbi-
trary j, k, u, v, it may represent any element of Ξrs(z) ≡∑
∞
k=0(Ψk+r ⊗Ψk+s)zk. Extending
to cross-products with other elements of Ξrs(z) would simply require c00(1)d00(1) in placeof c00 (1) in the variance above, where drs(z) would have exactly the same properties ascrs(z). Thus, the multivariate extension for the first term of Ξυu in Lemma CLT has avariance of Ξ00(1)K00Ξ
′
00(1).The second and third terms of Ξυu in Lemma CLT are σ2υσ
2u
∑
∞
r=1 c20r (1) and σ
2uσ
2υ
∑
∞
r=1
c2r0 (1) using the variances preceding Lemma B1. The multivariate extension of these termsto
∑
∞
r=1 Ξ0r(1)K0•Ξ′
0r(1) + Ξr0(1)K0•Ξ′
r0(1) follows along the same lines as the first term.For υ1t 6= υ2t and u1t 6= u2t, covariances would replace the variances σ2υ and σ2u for cross-products, but these are finite since the variances are finite. They are incorporated in K0•
by its definition.Finally, the last terms of Ξυu in Lemma CLT may be written as
συuσuυ∑∞
r=1c0r (1) cr0 (1) + σuυσυu
∑∞
r=1cr0 (1) c0r (1)
using the covariances preceding Lemma B1. The multivariate extension simply requiresdrs(z) again and different (finite) covariances in place of συu and σuυ for υ1t 6= υ2t andu1t 6= u2t. All of these covariances are incorporated in K•0.
References
Almon, S. (1965). “The Distributed Lag Between Capital Appropriations and Expendi-tures,” Econometrica 33, 178-196.
Alper, C.E., S. Fendoglu, and B. Saltoglu (2008) “Forecasting Stock Market VolatilitiesUsing MIDAS Regressions: An Application to the Emerging Markets,” MPRA PaperNo. 7460.
Andreou, E., E. Ghysels, and A. Kourtellos (2009). “Should Macroeconomic ForecastersUse Daily Financial Data and How?” Department of Economics, University of NorthCarolina, mimeo.
Andreou, E., E. Ghysels, and A. Kourtellos (2010a). “Regression Models with MixedSampling Frequencies,” Journal of Econometrics 158, 246-261.
Andreou, E., E. Ghysels, and A. Kourtellos (2010b). “Forecasting with Mixed-frequencyData,” Department of Economics, University of North Carolina, mimeo.
Armesto, M.T., R. Hernandez-Murillo, M.T. Owyang, and J. Piger (2009). “Measuringthe Information Content of the Beige Book: A Mixed Data Sampling Approach,”Journal of Money, Credit and Banking 41, 35-55.

34
Armesto, M.T., K.M. Engemann, and M.T. Owyang (2010). “Forecasting with MixedFrequencies,” Federal Reserve Bank of St. Louis Review 92, 521-536.
Bai, J., E. Ghysels, and J.H. Wright (2010). “State Space Models and MIDAS Regres-sions,” Department of Economics, University of North Carolina, mimeo.
Barsky, R.B. and L. Kilian (2004). “Oil and the Macroeconomy Since the 1970’s,” Journalof Economic Perspectives 18, 115-134.
Benjanuvatra, S. (2009). “A Real-Time Comparison of Mixed-Frequency Models for Pre-dicting GDP,” University of York, mimeo.
Beveridge, S. and C.R. Nelson (1981). “A New Approach to Decomposition of EconomicTime Series into Permanent and Transitory Components with Particular Attention toMeasurement of the ‘Business Cycle’,” Journal of Monetary Economics 7, 151-174.
Chambers, M.J. (2003). “The Asymptotic Efficiency of Cointegration Estimators underTemporal Aggregation,” Econometric Theory 19, 49-77.
Chambers, M.J. (2009). “Discrete Time Representations of Cointegrated Continuous-TimeModels with Mixed Sample Data,” Econometric Theory 25, 1030-1049.
Chambers, M.J. (2010). “Cointegration and Sampling Frequency,” Econometrics Journal,forthcoming.
Chambers, M.J. and J.R. McCrorie (2007). “Frequency Domain Estimation of TemporallyAggregated Gaussian Cointegrated Systems,” Journal of Econometrics 136, 1-29.
Chang, Y., J.Y. Park, and P.C.B. Phillips (2001). “Nonlinear Econometrics Models withCointegrated and Deterministically Trending Regressors,” The Econometrics Journal4, 1-36.
Chang, Y., J.I. Miller, and J.Y. Park (2009). “Extracting a Common Stochastic Trend:Theory with Some Applications,” Journal of Econometrics 150, 231-247.
Chen, X. and E. Ghysels (2010). “News – Good or Bad – and Its Impact on VolatilityPredictions over Multiple Horizons,” The Review of Financial Studies 24, 46-81.
Christofferson, P.F. and F.X. Diebold (1998). “Cointegration and Long-Horizon Forecast-ing,” Journal of Business and Economic Statistics 16, 450-458.
Clements, M.P. and A. Galvao (2008). “Macroeconomic Forecasting with Mixed-frequencyData: Forecasting Output Growth in the United States,” Journal of Business andEconomic Statistics 26, 546–554.
Clements, M.P. and A. Galvao (2009). “Forecasting US Output Growth Using LeadingIndicators: An Appraisal Using MIDAS Models,” Journal of Applied Econometrics24, 1187–1206.
35
Clements, M.P. and D.F. Hendry (1995). “Forecasting in Cointegrated Systems,” Journalof Applied Econometrics 10, 127-146.
Davidson, J. (1994). Stochastic Limit Theory: An Introduction for Econometricians. Ox-ford: Oxford University Press.
Frale, C. and L. Montefort (2010). “FaMIDAS: A Mixed Frequency Factor Model withMIDAS structure,” Working Paper 788, Banca D’Italia.
Francis, N.R., E. Ghysels, and M.T. Owyang (2010). “The Low-Frequency Impact ofDaily Monetary Policy Shocks,” Working Paper 2011-009A, Federal Reserve Bank ofSt. Louis.
Ghysels, E., A. Rubia, and R. Valkanov (2009). “Multi-period Forecasts of Volatility:Direct, Iterated, and Mixed-data Approaches,” Department of Economics, Universityof North Carolina, mimeo.
Ghysels, E., P. Santa-Clara, and R. Valkanov (2004). “The MIDAS Touch: Mixed DataSampling Regression Models,” CIRANO Working Paper 2004s-20.
Ghysels, E., P. Santa-Clara, and R. Valkanov (2005). “There Is a Risk-return TradeoffAfter All,” Journal of Financial Economics 76, 509-548.
Ghysels, E., P. Santa-Clara, and R. Valkanov (2006). “Predicting Volatility: Getting theMost Out of Return Data Sampled at Different Frequencies,” Journal of Econometrics131, 59-95.
Ghysels, E., A. Sinko, and R. Valkanov (2007). “MIDAS Regressions: Further Results andNew Directions,” Econometric Reviews 26, 53-90.
Ghysels, E. and R. Valkanov (2010). “Forecasting Volatility with MIDAS,” in VolatilityModels and Their Applications, L. Bauwens, C. Hafner, and S. Laurent, eds. NewYork: Wiley, 1-23.
Ghysels, E. and J. Wright (2009). “Forecasting Professional Forecasters,” Journal of Busi-ness and Economic Statistics, 27, 504-516.
Godfrey, L.G. and D.S. Poskitt (1975). “Testing the Restrictions of the Almon Lag Tech-nique,” Journal of the American Statistical Association 70, 105-108.
Gomez, V. and A. Maravall (1994). “Estimation, Prediction, and Interpolation for Non-stationary Series with the Kalman Filter,” Journal of the American Statistical Asso-ciation 89, 611-24.
Granger, C.W.J. (1990). “Aggregation of Time-series Variables: A Survey,” in Disag-gregation in Econometric Modelling, T. Barker and M.H. Pesaran, eds. New York:Routledge, 17-34.

36
Granger, C.W.J. and P.R. Siklos (1995), “Systematic Sampling, Temporal Aggregation,Seasonal Adjustment, and Cointegration: Theory and Evidence,” Journal of Econo-metrics 66, 357-369.
Hamilton, J.D. (2009). “Causes and Consequences of the Oil Shock of 2007-08,” BrookingsPapers on Economic Activity 1, Spring, 215-261.
Hansen, B.E. (2010). “Averaging Estimators for Autoregressions with a Near Unit Root,”Journal of Econometrics 158, 142 155.
Haug, A.A. (2002). “Temporal Aggregation and the Power of Cointegration Tests: aMonte Carlo Study,” Oxford Bulletin of Economics and Statistics 64, 399-412.
He, Y., S. Wang, and K.K. Lai (2010). “Global Economic Activity and Crude Oil Prices:A Cointegration Analysis,” Energy Economics 32, 868-876.
Hogrefe, J. (2008). “Forecasting Data Revisions of GDP: A Mixed Frequency Approach,”Advances in Statistical Analysis 92, 271-296.
Kilian, L. (2008). “Exogenous Oil Supply Shocks: How Big Are They and How MuchDo They Matter for the U.S. Economy?” The Review of Economics and Statistics 90,216-240.
Kilian, L. (2009). “Not All Oil Price Shocks Are Alike: Disentangling Demand and SupplyShocks in the Crude Oil Market,” American Economic Review 99, 1053-1069.
Klovland, J.T. (2002). “Business Cycles, Commodity Prices, and Shipping Freight Rates:Some Evidence from the Pre-WWI Period,” SNF Report 48/02, Norwegian School ofEconomics and Business Administration.
Kuzin, V., M. Marcellino, and C. Schumacher (2011). “MIDAS vs. Mixed-frequency VAR:Nowcasting GDP in the Euro Area,” International Journal of Forecasting 27, 529-542.
Lutkepohl, H. (1996). Handbook of Matrices. New York: John Wiley & Sons.
Maddison, A. (2010). “Statistics on World Population, GDP and Per Capita GDP,1-2008 AD,” Groningen Growth and Development Centre, Groningen University,http://www.ggdc.net/Maddison.
Marcellino, M. (1999). “Some Consequences of Temporal Aggregation in Empirical Anal-ysis,” Journal of Business and Economic Statistics 17, 129-136.
Marcellino, M. and C. Schumacher (2010). “Factor-MIDAS for Now- and Forecastingwith Ragged-edge Data: A Model Comparison for German GDP,” Oxford Bulletin ofEconomics and Statistics 72, 518-550.
Miller, J.I. (2010). “Cointegrating Regressions with Messy Regressors and an Applicationto Mixed-frequency Series,” Journal of Time Series Analysis 31, 255-277.

37
Miller, J.I. (2011). “Conditionally Efficient Estimation of Long-run Relationships Us-ing Mixed-frequency Time Series,” Department of Economics, University of Missouri,mimeo.
Miller, J.I. and S. Ni (2011). “Long-Term Oil Price Forecasts: A New Perspective on Oiland the Macroeconomy,” Macroeconomic Dynamics, forthcoming.
Montefort, L. and G. Moretti (2010). “Real Time Forecasts of Inflation: The Role ofFinancial Variables,” Working Paper 767, Banca D’Italia.
Park, J.Y. (1992). “Canonical Cointegrating Regressions,” Econometrica 60, 119-43.
Park, J.Y. and P.C.B. Phillips (1988). “Statistical Inference in Regressions with IntegratedProcesses: Part 1,” Econometric Theory 4, 468-497.
Park, J.Y. and P.C.B. Phillips (1989). “Statistical Inference in Regressions with IntegratedProcesses: Part 2,” Econometric Theory 5, 95-131.
Phillips, P.C.B. and B.E. Hansen (1990). “Statistical Inference in Instrumental VariablesRegression with I(1) Processes,” The Review of Economic Studies 57, 99-125.
Phillips, P.C.B. and V. Solo (1992). “Asymptotics for Linear Processes,” Annals of Statis-tics 20, 971-1001.
Pons, G. and A. Sanso (2005). “Estimation of Cointegrating Vectors with Time SeriesMeasured at Different Periodicity,” Econometric Theory 21, 735-56.
Seong, B., S.K. Ahn, and P.A. Zadrozny (2007). “Cointegration Analysis with Mixed-Frequency Data,” CESifo Working Paper No. 1939.
Tay, A.S. (2007). “Financial Variables as Predictors of Real Output Growth,” School ofEconomics and Social Sciences, Singapore Management University, mimeo.
Wooldridge, J.M. (1994). “Estimation and Inference for Dependent Processes,” in Hand-book of Econometrics, Vol. IV, R.F. Engle and D.L. McFadden, eds. Amsterdam:Elsevier, 2639-738.
Wu, D.-M. (1973). “Alternative Tests of Independence between Stochastic Regressors andDisturbances,” Econometrica 41, 733-750.