cognizant technology solutions -...
TRANSCRIPT

Copyright © 2015 Cognizant
Role of Test Manager at Crossroads?
Sreeram Gopalakrishnan, Associate Director, QE&A Practice
Cognizant Technology Solutions
PNSQC - October 2015

www.cognizant.com
Copyright © 2015 Cognizant 2
Digital Revolution
Continuous Delivery
Specialization & Consolidation
• By 2020, connected devices will touch 50 billion
• By 2017, 35% of enterprise applications will be hosted on cloud
• 64% of the testing in new development projects relates to big data, mobile and cloud
Market consolidation will displace up to 20% of the Top-100 IT service providers
Most organizations prefer external service providers for QA in a co-managed model, over purely in-house or fully-outsourced models
• Amazon deploys code every 12th
second, and Facebook, every half-day
• By 2016, DevOps will move from being “niche” to “mainstream”
• By 2016, 25% of the Top-2000 global firms will adopt DevOps
Source:
The World of IT Today

www.cognizant.com
Copyright © 2015 Cognizant 3
LEAN & TRANSFORMATIONAL
OPTIMIZE
TRANSFORM
“ Repositioning QA to be a diffused, value-enhancing & future-ready component of IT and Business, without impacting speed-to-market and cost priorities ”
Reduce QA Costs to sub-20% levels
Attain Test Effectivenessof 95%+
Increase Speed to Market by 20% or more
Is QA adding value
Is cost of quality too high
Is QA too archaic for the
complex technologies
Is QA too functional-focused vs
UX-focused
Is QA too slow for the go-to-
market demands
How to optimize and transform QA on-the-fly, without impact to projects
Leading-edge technology adoption
The
CIO
Questions
What It Means To QA

www.cognizant.com
Copyright © 2015 Cognizant 4
1990s Early 2000s 2005-2015 2015+
VA
LUE
OF
TEST
ING
Adjunct To Development Important Phase In SDLC Strategic To IT OrganizationDiffused Engineering Phase Driving Business Assurance
Afterthought
Left to the less skilled,
lower paid
Few tools and little
automation
No management visibility
/ involvement
Key to good quality
software
Planned and monitored
as a phase
Explosion of tools, but no
tool strategy
Management
involvement rudimentary
Own budget, clear
leadership and ownership
High visibility to executive
management
Integrated test activities,
tool selection
Focus on customer
experience
Automation of all wait-
times
End-to-end integrated
tool sets and delivery
platforms enabling
continuous delivery
How Has Testing Evolved …..

www.cognizant.com
Copyright © 2015 Cognizant 5
Traditional Model: • Manage testing schedules, resources, costs, risks.• Integration left to project/program manager.• Technology management & governance secondary.
Agile Model:• Test management diffused into project• Self organizing, role blurring, skill diversification in teams• Educate and coach testers on Agile culture
Next Generation Model ??
How Has Test Manager Evolved

www.cognizant.com
Copyright © 2015 Cognizant 6
Test Manager @ Crossroads ???
Technology
Balanced Scorecard
Earned Value Management
Transformation
Production Support
QMO
Partner alliances

www.cognizant.com
Copyright © 2015 Cognizant 7
The New Paradigm
Value Management
QA Delivery Mgmt
Technology CoE Function Leads
Executive Leadership
Project Team

www.cognizant.com
Copyright © 2015 Cognizant 8
Technology Evangelization
WHAT
• Document- & process-based improvements are inadequate for the technological complexities
• Speed to market priorities call for technology adoption in projects on the fly
• Value progression from analysis to synthesis
• Being an expert and a trusted advisor on a technology area
• Socialize and gather critical mass of support within an organization for use of the technology
• Connect with industry and discover innovative to uses of the technology to solve problems

www.cognizant.com
Copyright © 2015 Cognizant 9
Problem Identification Pattern Analysis Solution Evaluation Proof of Concept
Roadmap for AdoptionSocialization of ChangeValue Analysis Implementation
End-to-end food chain of technology adoption from conceptualization to implementation
Technology Evangelization Framework

www.cognizant.com
Copyright © 2015 Cognizant 10
The QA Landscape …
95SAP & Non-SAP
applications across 8 LOB’s
500ESB-based
interfaces
8 integrated test
landscapes
200 web services
10 middleware
protocols
25application dev
vendors
12releases per
year
280testers at onsite &
offshore
… & The Challenges
Out of 95 key applications, ~30 shared across multiple landscapes
Environment Conflicts
16% environment related defects
Environment Stability
2-6 weeks of waitfor environments
Environment Delays
8 integrated test landscapes, higher maintenance
Environment Maintenance
80% of defects detected in SIT or later
Late Defect Detection
Static stubs with low scalability and customizability
Ineffective Static Stubs
Constraints for early and tier specific performance testing
PT ScheduleOverruns
Case Study on SV: Problem Identification & Pattern Analysis

www.cognizant.com
Copyright © 2015 Cognizant 11
QA ENV GAPS
EFFICIENT SIT
EARLY INTEGRATED SYSTEM TEST
TIER BENCHMARKING
AUTOMATION INTEGRATION
Landscape gap analysisRigorous feasibility analysis
Key Tasks
Inventory ESB & WS interfacesPrioritize scope by release
Socialize SV to Dev teamsPrioritize scope by release
Analyze blueprint and isolate tiersVirtualize WS & interfaces
Identify support applications in e2e flowsIntegrate virtual services, customize framework
7 environments – Q113 environments – YTD
41 services – Q178 services – YTD
3 projects – YTD10% - projected in Q3, Q4
Web application areas like eCom, Loyalty
20% of the 700 automated e2e flows
Scope Benefits
$ 800K YTD projected
$ 750K YTD projected
35% defect shift-left1-2 weeks of ST schedule saving
1-2 weeks of PT schedule saving
35% faster execution of automated e2e flows
Success Factors
Env/Infra team support
Release approach
Leadership supportChange management
Dev team supportChange management
Socialization of benefits with functional test teams
Skilled resource pool
Case Study on SV: Solution Evaluation

www.cognizant.com
Copyright © 2015 Cognizant 12
0
200000
400000
600000
800000
1000000
1200000
1400000
Sep '14 Oct '14 Nov '14 Dec '14 Jan '15 Feb '15 Mar '15 Apr '15 May '15 Jun '15 Jul '15 Aug '15 Sep '15 Oct '15 Nov '15 Dec '15
Breakeven Analysis
Total Cost Cog QA Savings Total Savings
Break even is expected on Aug 2015
Case Study on SV: Solution Evaluation (ROI Analysis)

www.cognizant.com
Copyright © 2015 Cognizant 13
Inception2014 Q4 Quick Wins2015 Q1, Q2
3% SIT efficiencies$ 400K infra cost saving
Mid-Term2015 Q3, Q4
3% SIT efficiencies$ 400K infra cost avoidance
10% PT schedule saving25% FUT DRE increase
Long-Term2016 +
6% SIT efficiencies50% FUT DRE increase
Enable EPT, TDM, Dev-Ops
SVScopeSIT RT
QA Environment
PT FUT
Dev Unit Test
Automation TDM• Generate test data • Trace paths and table
relationships to build TDM scripts
• SV integrated with automation scripts
• Early integrated FUT• Integrated Dev
environment for FUT
• Tier-level benchmarking• Simulation of interfaces
• Early Performance Testing
• Eliminate non-critical environment dependencies for E2E regression
• Early SIT through virtualization of impacted
interfaces/components
Dev-Ops • Environment gap redressal• Enabler for landscape
rationalization
• Early Component Integration Test
• Testing of components/web-services
• Integrate with CI tool
Case Study on SV: Innovative Usages & Roadmap

www.cognizant.com
Copyright © 2015 Cognizant 14
Case Study on SV: Value AnalysisMeasure Metric / KPI Values Target
SV Utilization
SV Transaction CountCumulative: 2165 Last 30 days: 1225
Not applicable
% Utilization of servicesPeriod 3: 29% (8 VS out of total 28)
Quarter 1: 51% (21 VS out of total 41)30% - for each period70% - for each quarter
% Projects leveraging SVQ1 (Jan – Mar): 10% (3 out of 27)
April: 5% (1 out of 21)
Q1: N/AQ2: 5%
Q3: 10%Q4: 25%
Early Defect Detection
Early Defect DetectionNot applicable for Q1
Q1 & Q2 2015 -Evolve the FUT DRE Baseline
Q3 & Q4 2015 - Start themeasurement
SV Delivery Productivity
SV Delivery Productivity Q1 2015: 41 services (82% of plan)
Q1: 50 ServicesQ2: 50 ServicesQ3: 50 ServicesQ1: 25 Services
Applications Provisioned
Applications Provisioned through SV
13 Applications Not applicable

www.cognizant.com
Copyright © 2015 Cognizant 15
• Maximum risk for a program is at the points of integration of multiple disciplines
• Integrating and influencing the multiple functions outside QA is vital to engineer quality across the lifecycle
Why Multi-Function Integration?

www.cognizant.com
Copyright © 2015 Cognizant 16
QA
Project Mgmt
Application Dev
PMO & QMO
Op
eration
sCh
ange
M
gmt
Release Mgmt
Infrastru
cture
Sup
po
rt
Business Integration
Infr
a D
esig
n
& C
apac
ity
Multi-Function Integration Scope
www.cognizant.com
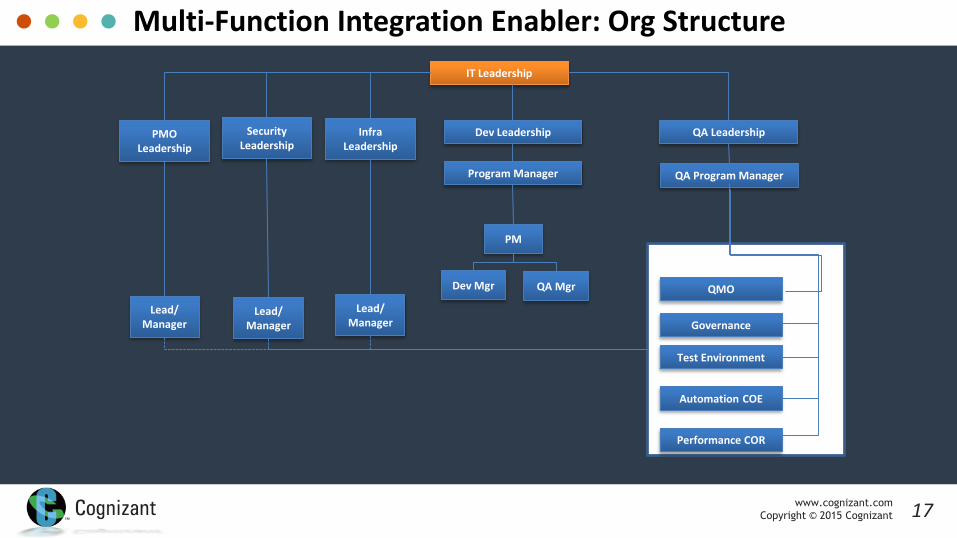
Copyright © 2015 Cognizant 17
IT Leadership
Dev Leadership
Program Manager
QA Leadership
QA Program Manager
QMO
Governance
Test Environment
Automation COE
Performance COR
PMO Leadership
Security Leadership
Infra Leadership
Lead/ Manager
Lead/ Manager
Lead/ Manager
PM
Dev Mgr QA Mgr
Multi-Function Integration Enabler: Org Structure

www.cognizant.com
Copyright © 2015 Cognizant 18
OperationsInsight
Audit
Assessment
TransformationConstruction
Leadership
Governance
Key Constituents
GovernanceDirection
Standards
Accountability
TRANSFORMATION & ENGINEERING OFFICE
(TEO)GOVERNANCE OPERATIONS
QUALITY MANAGEMENT OFFICE (QMO)
STEERING COMMITTEE
TEST DELIVERY OFFICE
PROJECT CPROJECT A PROJECT B
Stakeholder Management
Strategic Planning
Financial & Operational Performance
Participate & Collaborate
Advisory Board
Test Manager
Multi-Function Integration Enabler: QMO

www.cognizant.com
Copyright © 2015 Cognizant 19
• In this role the test manager has to
manage the value realization from QA’s
operational and strategic initiatives
• The role focuses on the balance between
quality, speed and cost, assuring
maximum value and alignment with the
organization's objectives
Value Management

www.cognizant.com
Copyright © 2015 Cognizant 20
Balance Scorecard Technique of
Value AlignmentOrganization’s Strategic Intent
IT Objectives
QA Objectives
Strategic Initiatives
Operations
Continuous Improvements
Metrics & Measures
Value Management – Balanced Scorecard
Provides strategic feedback and learning
Align key performance measures with strategy at all levels of an organization.
Facilitates communication and understanding of
business goals and strategies
Value management can be performed through the use of the balanced scorecard technique, whereby the organization's strategic objectives are translated into tactical and operational objectives.

www.cognizant.com
Copyright © 2015 Cognizant 21
ERP complete and fully adopted including decommissioning of legacy applications
Best IT organization – 1.2% of revenue; quality delivery with updated infrastructure
Resilient, stable technology – 40% reduction in major incidents
Cost savings delivered through creative IT solutions – $250M
$500M in top line growth delivered through innovative IT solutions
A
B
C
D
E
Reduce MI’s and other
production incidents by 20%
50% Reqmt & Design defects to be
contained before Test phase
Achieve QA EVM of 80%+
Achieve customer satisfaction score of
85%
Manage overall QA cost within 25%
Achieve transformational and managed innovation
savings of 5M+
Achieve 25% more cross-skilling and up-skilling of associates
Enable increase in number of project and
incident releases by 20%
Achieve best-in-class QA maturity level of
3.3
A
C B
DB DB C B
CBADB
DB
IT Objectives QA Objectives
Balanced Scorecard: Align QA and IT Objectives

www.cognizant.com
Copyright © 2015 Cognizant 2222
Automation, Tools & Innovation
Strategic Initiatives
People Excellence
Governance of QA and SDLC phases
Process Improvements
& Gap Redressal
Increase Regression Automation
Tools & Accelerators
Automated Env Dashboard
Scope control & CR process Shift Left: Reqmt &Design Reviews
PM – QAPM Integration EVM Tracking
Release Mgmt Strategy & Tool Change Mgmt Process
Infrastructure Testing Mobile Test Lab
Environment Virtualization Shift Left: EPT & Perf Engineering
G1:Enhanced R&R Programs G2: Increase Certified Associates
•Reduce scope changes and schedule / budget overruns•Minimize overlaps or shortening of test phases•Avoid misalignment of Project and QA status reporting•Achieve EVM of 80%+
•Code deployments as per release calendar•Reduce MI’s related to deployments, batch and change control
•Reduce wait time for environment code refreshes•Minimize regression defect leakage into production•More throughput due to quicker defect resolution
•Better regression coverage thru increased automation•Reduce environment defects thru proactive monitoring of connectivity using automated dashboard
•Lower automation development cost thru accelerators•Reduce tool license costs thru use of open source or alternatives
•Reduce QA environment & infrastructure costs thru SV•Increase quality and decrease performance failures by building performance into design
•Reduce MI’s related to infrastructure•Lesser cost and quicker speed to market thru use of mobile lab
•Motivated & multi-tower trained QA team•Increased Utilization•Quick induction for new joinees
Transformational
Foundational
Tool License Cost Rationalization
I II III
IV V VI
VII VIII IX
I II III
IV V VI
VII VIII IX
I II III
IV V VI
VII VIII IX
I II III
IV V VI
VII VIII IX
I II III
IV V VI
VII VIII IX
Optimisation
Code Freeze & Core Regression Autosys & Batch Testing
Defect Age Improvement
Expand ADPART usage
Innovative Pricing Models
G3: Increase Cross-Skilling
Innovation
Agile Testing
Objectives Themes Initiatives Outcomes
Independently owned and driven by Cognizant
Client owned, with Cognizant collaboration
Balanced Scorecard: Break Down Objectives Into Initiatives

www.cognizant.com
Copyright © 2015 Cognizant 2323
24Independently owned and driven by Cognizant
Loblaw owned, with Cognizant collaborationPlan / Design / PoC BAUImplement Stabilize / Transition
Balanced Scorecard: Schedule & Track Progress
Initiatives tracked and reported regularly at executive level

www.cognizant.com
Copyright © 2015 Cognizant 24
To Conclude …
Test Manager’s role is undergoing some interesting but veryessential changes
Technological Innovation, Integration and Value Managementare the emerging dimensions
Any questions, comments or thoughts ?
You can also email: [email protected]

Copyright © 2015 Cognizant
Thank You