cognitive neuropsychology analysis and interpretation of serial position...
TRANSCRIPT

PLEASE SCROLL DOWN FOR ARTICLE
This article was downloaded by: [Harvard College]On: 17 February 2011Access details: Access Details: [subscription number 917861759]Publisher Psychology PressInforma Ltd Registered in England and Wales Registered Number: 1072954 Registered office: Mortimer House, 37-41 Mortimer Street, London W1T 3JH, UK
Cognitive NeuropsychologyPublication details, including instructions for authors and subscription information:http://www.informaworld.com/smpp/title~content=t713659042
Analysis and interpretation of serial position dataAndrew Olsona; Cristina Romanib; Alfonso Caramazzacd
a University of Birmingham, Birmingham, UK b University of Aston, Birmingham, UK c CognitiveNeuropsychology Laboratory, Harvard University, Cambridge, MA, USA d Center for Mind/BrainSciences, University of Trento, Trento, Italy
First published on: 23 August 2010
To cite this Article Olson, Andrew , Romani, Cristina and Caramazza, Alfonso(2010) 'Analysis and interpretation of serialposition data', Cognitive Neuropsychology, 27: 2, 134 — 151, First published on: 23 August 2010 (iFirst)To link to this Article: DOI: 10.1080/02643294.2010.504580URL: http://dx.doi.org/10.1080/02643294.2010.504580
Full terms and conditions of use: http://www.informaworld.com/terms-and-conditions-of-access.pdf
This article may be used for research, teaching and private study purposes. Any substantial orsystematic reproduction, re-distribution, re-selling, loan or sub-licensing, systematic supply ordistribution in any form to anyone is expressly forbidden.
The publisher does not give any warranty express or implied or make any representation that the contentswill be complete or accurate or up to date. The accuracy of any instructions, formulae and drug dosesshould be independently verified with primary sources. The publisher shall not be liable for any loss,actions, claims, proceedings, demand or costs or damages whatsoever or howsoever caused arising directlyor indirectly in connection with or arising out of the use of this material.

Analysis and interpretation of serial position data
Andrew OlsonUniversity of Birmingham, Birmingham, UK
Cristina RomaniUniversity of Aston, Birmingham, UK
Alfonso CaramazzaCognitive Neuropsychology Laboratory, Harvard University, Cambridge, MA, USA, and Center for Mind/Brain Sciences,
University of Trento, Trento, Italy
The representation of serial position in sequences is an important topic in a variety of cognitiveareas including the domains of language, memory, and motor control. In the neuropsychologicalliterature, serial position data have often been normalized across different lengths, and an improvedprocedure for this has recently been reported by Machtynger and Shallice (2009). Effects of lengthand a U-shaped normalized serial position curve have been criteria for identifying working memorydeficits. We present simulations and analyses to illustrate some of the issues that arise when relat-ing serial position data to specific theories. We show that critical distinctions are often difficult tomake based on normalized data. We suggest that curves for different lengths are best presented intheir raw form and that binomial regression can be used to answer specific questions about theeffects of length, position, and linear or nonlinear shape that are critical to making theoreticaldistinctions.
Keywords: Serial position; Short-term memory; Graphemic buffer; Dysgraphia; Spelling.
The organization of serial behaviour has been a topicof interest to psychologists since at least Lashley’sseminal paper (Lashley, 1951). Organizing behav-iour in time is important in many differentdomains, including speech (e.g., Acheson &MacDonald, 2009; Gupta, Lipinski, Abbs, & Lin,2005; Page, Madge, Cumming, & Norris, 2007),spelling (e.g., Caramazza, Miceli, Villa, &Romani, 1987; Glasspool & Houghton, 2005;Goldberg & Rapp, 2008; Wing & Baddeley,1980), short-term memory (e.g., Atkinson &
Shiffrin, 1971; Brown, Preece, & Hulme, 2000;Burgess & Hitch, 1999; Henson, 1998b;Lewandowsky, 1999; Lewandowsky & Murdock,1989; Murdock, 1968; Page & Norris, 1998; andmany others), perception (e.g., Mason, 1982;Tydgat & Grainger, 2009), motor control (Agam,Bullock, & Sekuler, 2005), and executive function(Schneider & Logan, 2005). Systematic changes inaccuracy across position is an important kind ofdata reported from empirical studies in these areas,and computational models of the same data typically
Correspondence should be addressed to Andrew Olson, Department of Psychology, University of Birmingham, Birmingham
B15 2TT, UK (E-mail: [email protected]).
134 # 2010 Psychology Press, an imprint of the Taylor & Francis Group, an Informa business
http://www.psypress.com/cogneuropsychology DOI:10.1080/02643294.2010.504580
COGNITIVE NEUROPSYCHOLOGY, 2010, 27 (2), 134– 151
Downloaded By: [Harvard College] At: 16:15 17 February 2011

fit serial position curves in the process of showingthat they give an adequate account of the empiricalresults.
We are interested, here, in how data from serialposition curves are summarized and analysed.Summary measures are critical when confrontingtheories and data in order to focus on critical differ-ences in complex results. Summary measures inevi-tably trade off simplicity and loss of information.What is critical is that the summary measure pre-serves the information that is necessary for con-fronting theories. Our starting point is themethod for summarizing data from serial positioncurves that were originally reported by Wing andBaddeley (1980) in their study of handwritten spel-ling errors. This type of analysis has been widelyapplied in studies of errors made by aphasic patientsin spelling and in speech (e.g., Buchwald & Rapp,2004, 2006; Caramazza, Papagno, & Ruml, 2000;Cipolotti, Bird, Glasspool, & Shallice, 2004;Cotelli, Abutalebi, Zorzi, & Cappa, 2003;Croisile & Hibert, 1998; Gagnon & Schwartz,1997; Kay & Hanley, 1991; Neils, Roeltgen, &Greer, 1995; Papagno & Girelli, 2005; Schwartz,Wilshire, Gagnon, & Polansky, 2004; Ward &Romani, 1998). Recently, Machtynger and Shallice(2009) showed that there are some systematic distor-tions of the serial position curve that the Wing andBaddeley method can introduce (see also accompa-nying response Wing & Baddeley, 2009), and theysuggested an alternative method that we have alsoused in a study of spelling errors made by deaf partici-pants and speech errors made by aphasic patients(Olson, 1995; Olson & Caramazza, 1999).
We discuss dimensions that are important forconfronting serial position data—that is, datathat report accuracy at each position for items ofdifferent lengths—with theories that describehow position information is represented andmaintained. Our goal is to illustrate some of thecomplexity involved in relating theoretical dimen-sions like capacity and interference to differences inlength and serial position in empirical data. Westart by defining dimensions that distinguishdifferent theories of serial behaviour. We showthat these dimensions do create differences inserial position data, but that the relationships
cannot be read directly from the raw data, andthey would often be lost through normalization.Finally, we illustrate some alternative analysesthat can be used to relate serial position data totheories.
Serial position data have been examined mostclosely for tasks thought to involve a workingmemory component. These include, in particular,studies of serial learning or recall (e.g., Healy,1974; Henson, 1999; Nairne, 1991; Robinson &Brown, 1926; and many others), but also, in theneuropsychological literature, studies of the gra-phemic and phonological buffers (Caramazza,Miceli, & Villa, 1986; Caramazza et al., 1987;Schiller, Greenhall, Shelton, & Caramazza,2001; Shallice, Rumiati, & Zadini, 2000; Ward& Romani, 1998). Theoretically, a workingmemory system should have capacity limitations.Empirically, it has repeatedly been found thatinitial and final positions are recalled better thanmedial positions in short-term memory tasks.These two observations have been combined, inthe neuropsychological literature, to produce cri-teria considered diagnostic (among others) for anoutput buffer: There should be effects of lengthand a U-shaped function of accuracy across pos-ition (Caramazza et al., 1987).
The association between these effects and thecharacteristics of working memory is perfectlyreasonable, but their reification as diagnostic cri-teria also poses certain problems: The connectionbetween these effects and mechanisms ofworking memory is neither completely diagnosticnor simple. Nonetheless, these two dimensionsremain fundamental to our discussion. We areinterested in the source of effects of lengthbecause of the connection between length effectsand capacity limits, and we are interested in differ-ences in accuracy for different serial positionsbecause of the connection between serial positioneffects and either interference or short- andlong-term contributions to serial production.
Critical dimensions—length effects
Working memory should have capacity limitations.Capacity, in the everyday sense, is an absolute limit.
COGNITIVE NEUROPSYCHOLOGY, 2010, 27 (2) 135
SERIAL POSITION DATA
Downloaded By: [Harvard College] At: 16:15 17 February 2011

Items within the capacity of the system can be pro-cessed, but anything above the capacity limit willfail. However, in short-term memory experiments,it is the items from the middle of the list, not themost recent items, that are hard to remember. Anabsolute limit could still create this serial positionfunction if initial items are well retained, and themost recent items are added to the end of amemory buffer, overwriting items from themiddle of the list as they are added (Phillips,Shiffrin, & Atkinson, 1967).
A capacity limit, however, could be manifested inmore than one way. It could also involve a reductionin processing efficiency for all items. Under thisdefinition, addition of any items above some limit(which can be as low as a single item) makes allitems in the buffer more difficult to process. Animportant prediction, which is common to both ofthese capacity limits, is that serial position curvesfor longer stimuli should be vertically displacedfrom the curves for shorter stimuli. Shorter stimulishould have an advantage across all (or nearly all)positions. This definition of capacity allows us todistinguish effects of capacity from effects of pos-ition in our analyses below.
We have said that length effects should be pro-duced by capacity limits, but the reverse is notexclusively true. In other words, a significanteffect of length in an analysis does not unambigu-ously indicate a capacity limit. This is because notonly capacity limitations produce length effects.In fact, a constant probability of error at each pos-ition will produce length effects in the number ofwhole sequences correct (item ¼ letter, sequence¼ whole words, in the buffer context, or item ¼word, sequence ¼ whole lists, in the short-termmemory context). The p(sequence correct) ¼p(item correct)sequence length, so that with p(itemcorrect) ¼ .9, p(sequence correct) ¼ .73, .66, .59,.53, .48 for lengths 3–7. Thus, the number ofsequences correct is not particularly diagnosticof capacity limitations. For a decline with lengthto indicate a capacity limit, the decline mustexceed the decline predicted by a constantprobability of error. We have previously calledthis a super length effect (Romani, Olson, Ward, &Ercolani, 2002).
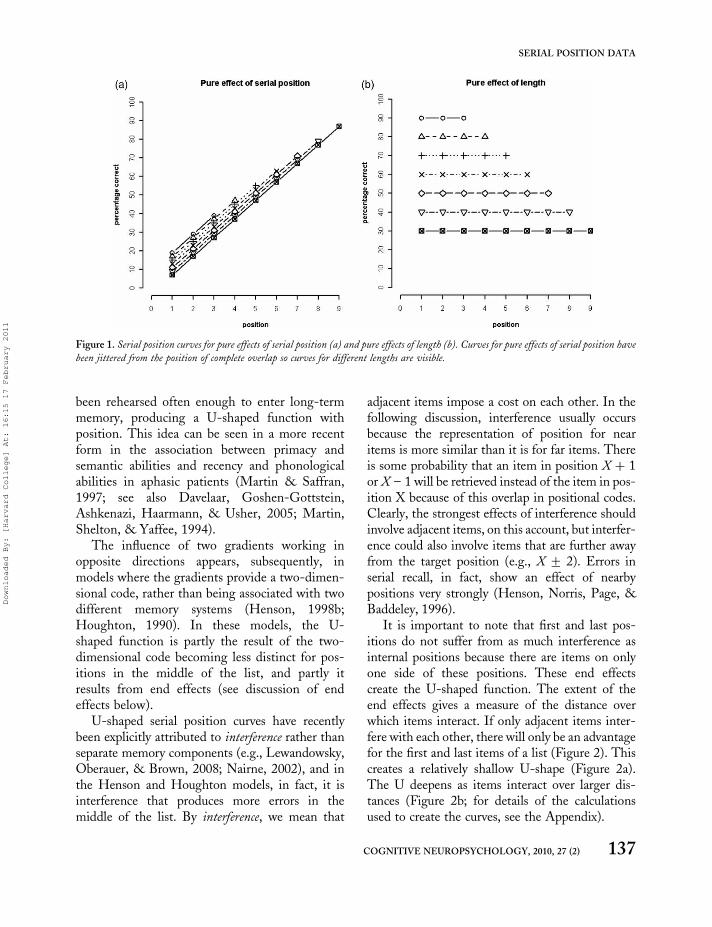
A more sensitive measure of a length effect is tocount the probability of error at each position (orthe probability that items are preserved; seeOlson, Romani, & Halloran, 2007). Even if weconsider the probability that items are correct ateach position, however, pure effects of position,which we would not associate with a capacitylimitation, can produce length effects. By pureeffects of position, we mean that the probabilitythat an item is correct—p(item correct)—changes with position, but that the probabilitycorrect for any given position is not different forsequences of different lengths (see Figure 1a).Pure effects of position produce length effectswhen the probability correct declines with positionbecause longer sequences have later positionswhere the probability correct continues to godown, giving a lower average p(correct) for thewhole string. Pure effects of length, instead, willbe found when the probability of error does notchange with position (so there are no positioneffects), but longer sequences have higher ratesof error at all positions (see Figure 1b). Theseare particularly diagnostic of capacity limitations,and we present an example of how a limitationin capacity in an implemented model producesexactly this kind of pure effect of length below.
Critical dimensions—nonlinear serialposition effects
Better performance at the beginning and end of aword or list has been repeatedly observed in serialrecall and also in patients with hypothesized pho-nological or graphemic buffer impairments(Caramazza et al., 1987; Healy, 1974; Murdock,1968; Shallice et al., 2000). In the short-termmemory literature the advantage for early items(the primacy effect) has been thought to occurbecause early items can be rehearsed oftenenough to enter long-term memory, where theyare protected from decay. The advantage forrecent items (the recency effect), instead, occursbecause information in a short-term memorystore decays over time (Atkinson & Shiffrin,1971). Items in the middle of the list suffer morefrom decay than do the final items, but have not
136 COGNITIVE NEUROPSYCHOLOGY, 2010, 27 (2)
OLSON, ROMANI, CARAMAZZA
Downloaded By: [Harvard College] At: 16:15 17 February 2011
been rehearsed often enough to enter long-termmemory, producing a U-shaped function withposition. This idea can be seen in a more recentform in the association between primacy andsemantic abilities and recency and phonologicalabilities in aphasic patients (Martin & Saffran,1997; see also Davelaar, Goshen-Gottstein,Ashkenazi, Haarmann, & Usher, 2005; Martin,Shelton, & Yaffee, 1994).
The influence of two gradients working inopposite directions appears, subsequently, inmodels where the gradients provide a two-dimen-sional code, rather than being associated with twodifferent memory systems (Henson, 1998b;Houghton, 1990). In these models, the U-shaped function is partly the result of the two-dimensional code becoming less distinct for pos-itions in the middle of the list, and partly itresults from end effects (see discussion of endeffects below).
U-shaped serial position curves have recentlybeen explicitly attributed to interference rather thanseparate memory components (e.g., Lewandowsky,Oberauer, & Brown, 2008; Nairne, 2002), and inthe Henson and Houghton models, in fact, it isinterference that produces more errors in themiddle of the list. By interference, we mean that
adjacent items impose a cost on each other. In thefollowing discussion, interference usually occursbecause the representation of position for nearitems is more similar than it is for far items. Thereis some probability that an item in position X þ 1or X – 1 will be retrieved instead of the item in pos-ition X because of this overlap in positional codes.Clearly, the strongest effects of interference shouldinvolve adjacent items, on this account, but interfer-ence could also involve items that are further awayfrom the target position (e.g., X + 2). Errors inserial recall, in fact, show an effect of nearbypositions very strongly (Henson, Norris, Page, &Baddeley, 1996).
It is important to note that first and last pos-itions do not suffer from as much interference asinternal positions because there are items on onlyone side of these positions. These end effectscreate the U-shaped function. The extent of theend effects gives a measure of the distance overwhich items interact. If only adjacent items inter-fere with each other, there will only be an advantagefor the first and last items of a list (Figure 2). Thiscreates a relatively shallow U-shape (Figure 2a).The U deepens as items interact over larger dis-tances (Figure 2b; for details of the calculationsused to create the curves, see the Appendix).
Figure 1. Serial position curves for pure effects of serial position (a) and pure effects of length (b). Curves for pure effects of serial position have
been jittered from the position of complete overlap so curves for different lengths are visible.
COGNITIVE NEUROPSYCHOLOGY, 2010, 27 (2) 137
SERIAL POSITION DATA
Downloaded By: [Harvard College] At: 16:15 17 February 2011

As was the case for length, measuring the shapeof the serial position curve in practice is more com-plicated than specifying the shape in theory. Theshape that the curve assumes in empirical data isinfluenced by several factors, including any biasagainst producing items more than once (e.g.,after an anticipation error), the tendency foranticipations to precipitate reciprocal persevera-tions, and the method used to score errors. Weillustrate these factors below.
The dynamics of production that influence whathappens after an error has been made can changethe shape of the serial position function. Modelsmaking use of interference and end effects oftenassume, as an implementational detail, that oncean item has been produced, it is inhibited anddoes not have the possibility to be producedagain. If the Position 3 item is produced early inPosition 2 it cannot be produced again inPosition 3 (Brown et al., 2000; Burgess & Hitch,1999; Farrell & Lewandowsky, 2002; Henson,1998b; Page & Norris, 1998). This prohibitionagainst repeating responses is justified based ondata that show that participants in serial recalltasks are reluctant to repeat items, even when thisis necessary for correct recall (Henson, 1998a).
The prohibition influences the form of the serialposition curve because an item produced too earlynecessarily creates an error in two positions—theposition where the item was produced early andthe position where it should have been produced,but now can no longer occur. This effect of errorscan accumulate. If Item 3 is produced too early,Items 2 and 4, both errors, may be the onlycompetitors for Position 3. If Item 4 is producedin Position 3, this creates another error atPosition 4. The important consequence for theshape of the serial position function is that it hasa clear primacy gradient but the recency portionof the curve is reduced (Figure 3a), or eliminated(Figure 3b). When nonfinal responses producethe final position too early, this, by necessity, alsocreates an error in the final position. The amountby which the recency effect is reduced dependson how probable it is that Item 4 is produced, asopposed to Item 2, once Item 3 has been producedtoo early.
The recency effect reappears if, after an antici-pation error, there is a high probability that a reci-procal perseveration error will create a swap. Whenthis is the case, the final position is less likely to getproduced as part of a set of related errors (i.e., errors
Figure 2. U-shaped serial position curves generated by interference. In (a), the probability of an item being reported in the correct position, X,
is .4, and the probability of an item from position X – 1 or X þ 1 being reported instead of X is .3. In (b), the probability of an item being
reported in the correct position X, is .4. The probability of X þ 1, X – 1, or X þ 2, X – 2 being reported instead of X is .2 and .1,
respectively.
138 COGNITIVE NEUROPSYCHOLOGY, 2010, 27 (2)
OLSON, ROMANI, CARAMAZZA
Downloaded By: [Harvard College] At: 16:15 17 February 2011
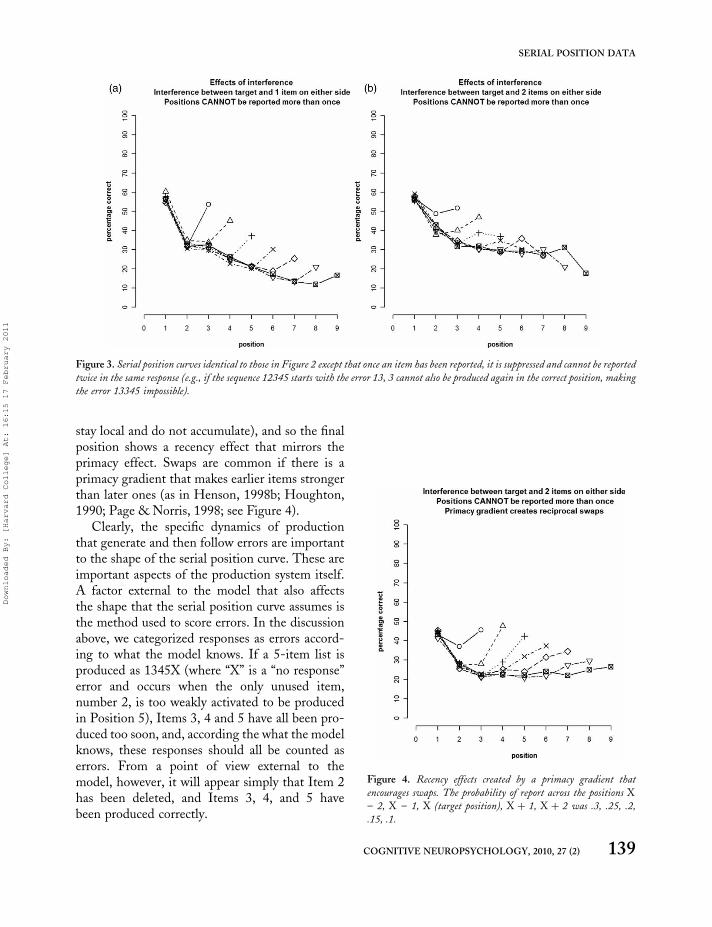
stay local and do not accumulate), and so the finalposition shows a recency effect that mirrors theprimacy effect. Swaps are common if there is aprimacy gradient that makes earlier items strongerthan later ones (as in Henson, 1998b; Houghton,1990; Page & Norris, 1998; see Figure 4).
Clearly, the specific dynamics of productionthat generate and then follow errors are importantto the shape of the serial position curve. These areimportant aspects of the production system itself.A factor external to the model that also affectsthe shape that the serial position curve assumes isthe method used to score errors. In the discussionabove, we categorized responses as errors accord-ing to what the model knows. If a 5-item list isproduced as 1345X (where “X” is a “no response”error and occurs when the only unused item,number 2, is too weakly activated to be producedin Position 5), Items 3, 4 and 5 have all been pro-duced too soon, and, according the what the modelknows, these responses should all be counted aserrors. From a point of view external to themodel, however, it will appear simply that Item 2has been deleted, and Items 3, 4, and 5 havebeen produced correctly.
Figure 3. Serial position curves identical to those in Figure 2 except that once an item has been reported, it is suppressed and cannot be reported
twice in the same response (e.g., if the sequence 12345 starts with the error 13, 3 cannot also be produced again in the correct position, making
the error 13345 impossible).
Figure 4. Recency effects created by a primacy gradient that
encourages swaps. The probability of report across the positions X
– 2, X – 1, X (target position), X þ 1, X þ 2 was .3, .25, .2,
.15, .1.
COGNITIVE NEUROPSYCHOLOGY, 2010, 27 (2) 139
SERIAL POSITION DATA
Downloaded By: [Harvard College] At: 16:15 17 February 2011

A natural method of scoring assumes that thesmallest number of changes possible created theerror or that the largest possible number of itemsare in the correct position. Finding the longestincreasing subsequence in a sequence of numbersimplements this scoring procedure (see limits tothis method in Tichy, 1984). If we rescore thesequences from Figure 3b from the point of viewof a naı̈ve observer using an algorithm for thelongest increasing subsequence (Gusfield, 1997),there is no primacy portion of the curve and astrong recency portion (Figure 5). The reason forstronger recency effects is clear from the example.Items that the model produces too early will some-times be counted as correct by a longest increasingsubstring algorithm. If we use a stricter criterion,however, and count items as correct only whenthey are in the correct numerical slot, the primacy
and recency portions of the curve will have theshape we plotted in Figure 3b. Which criterion isactually “correct” is not possible to determinefrom outside the model. If the omission ofPosition 2 was a true deletion, and the otheritems were produced in their correct positions,then the first scoring procedure reflects the actualset of errors. If Positions 3, 4, and 5 were all pro-duced early, and then Position 2 could not be pro-duced, then the second procedure reflects the actualset of errors. What we have shown is that any onescoring procedure does not necessarily producethe set of transformations that actually turned thetarget into the response and that the shape of theserial position curve depends, in part, on thescoring procedure.1 For the purposes of theorytesting, what is important is that simulationmodel data and empirical data are scored usingthe same procedure.
The effects we have outlined in this section areespecially important when a substantial portion oferrors are exchanges (as in serial recall; e.g.,Henson, 1998b) and, to some extent, when itemsdo not often appear more than once in a response.Understanding how the shape and position ofserial position curves can be created by effects ofcapacity, edge effects, interference, and scoring isimportant, however, because factoring theseeffects is necessary to relate serial position curvesto theories and because, as Farrell andLewandowsky (2002) note, the factors we havedescribed here can often be responsible for theshape of serial position curves rather than mechan-isms that are more prominent in the models them-selves (e.g., oscillations in the case of OSCAR;Brown et al., 2000).
In this section, we have seen that theoreticallyimportant factors like capacity limits, the presenceand spread of interference, and the suppression ofprevious responses influence the position andshape of serial position curves. In the following
Figure 5. The serial position curve that results when sequences from
the model that produced Figure 3b are scored from the point of view
of a naı̈ve observer (rather than from a model-internal point of
view). Scoring uses the longest increasing subsequence.
1 This is a concrete example of a situation long recognized in the computer science literature devoted to matching text patterns
(see algorithms for Levenshtein or edit distance, e.g., Gusfield, 1997). Reconstruction of the changes that produce a response from a
target cannot be done with certainty. Since an infinite number of transformations are possible, any one can only be assigned a value
that indicates its likelihood, and scoring errors is an optimization problem that involves picking the changes that are most likely to
have occurred given the target and response.
140 COGNITIVE NEUROPSYCHOLOGY, 2010, 27 (2)
OLSON, ROMANI, CARAMAZZA
Downloaded By: [Harvard College] At: 16:15 17 February 2011

section we examine what happens to critical infor-mation from serial responses when data are nor-malized. Initially, we do this using theoreticalexamples. We show, however, that our theoreticalconcerns also apply to implemented models and/or existing data. Finally, we discuss alternativesfor analysing serial position data given the com-plexities we have outlined.
Normalized data and critical dimensions
Critical dimensions we have identified in thediscussion above include the effect of length inde-pendent of position, and the form of nonlinearposition effects determined by primacy andrecency. Are these critical dimensions representedin normalized data?
Clearly, effects of length and position cannotbe distinguished using normalized data.Normalization collapses data from differentlengths and positions onto a single curve. Thevertical displacement between curves that is criticalfor measuring length effects is eliminated.
Normalized data are more successful in charac-terizing the shape of the serial position curve overposition, but here, too, there are factors to beaware of. Determining whether or not recency
effects are present and exactly how many itemsare advantaged cannot be guaranteed based onnormalized data. Substantial recency effects thatincrease with length but are restricted to a singleitem produce a serial position curve (Figure 6a)that is very similar to the serial position curve pro-duced when a decline in performance with positionslows at later positions but there are no recencyeffects (Figure 6b). The similarity of the curvesin Figures 6a and b are the consequence of com-pressing the number of positions in the longestsequences into fewer normalized positions, as hastypically been the case in analyses that followWing and Baddeley’s (1980) approach. In thecase we illustrate here, up to nine positions werecollapsed to five normalized positions.
Differentiating single-item recency effects fromeffects that extend over more items is also difficultusing normalized data. Figure 7 illustrates normal-ized curves for recency effects that involve one andtwo items. The extent of the recency effect in thenormalized curves does depend on the extent ofthe recency effect in the data, but it also dependson the number of positions that the data arenormalized to. Normalizing to more positionsextends the recency effect for the same unstandar-dized data.
Figure 6. Normalized serial position curves (in black) for (a) one-item recency that increases with position and (b) no recency, but accelerating
primacy effect. Unstandardized serial position curves are in grey.
COGNITIVE NEUROPSYCHOLOGY, 2010, 27 (2) 141
SERIAL POSITION DATA
Downloaded By: [Harvard College] At: 16:15 17 February 2011

Critical dimensions in implemented modelsand empirical data
These illustrations using hypothetical data call intoquestion the utility of normalizing data when dis-tinguishing critical factors in ordered productiontasks, but are these factors important in actualmodels of ordered production? Below we presentseveral examples using implemented models and/or empirical data to show that the dimensionsthat we have identified as critical really do showvariation of the kind we have described above, andwe suggest that using normalized data may not bethe best way of confronting theories and data.
Capacity
Our first illustration involves two different ways ofcoding position that have both been used in theliterature (Glasspool, Shallice, & Cipolotti, 2006;Page & Norris, 1998). One model shows clearcapacity limits and the other clear positioneffects. We show that the capacity-limited modelproduces vertically displaced serial positioncurves, and the model with clear position effectsbut no capacity limit (in the range we explore)produces serial position effects without vertically
displaced curves for different lengths. Bothmodels will produce effects of length and U-shaped serial position curves when the data arestandardized, so the presence or absence of theseeffects does not distinguish them. Characteristicsof their unstandardized serial position curves do,however, allow the important aspects of thesemodels to be distinguished.
Our first model codes serial position with aseries of Gaussian curves that are spread over alimited number of coding units (in our case 100).This approach is similar to the serial positionunits that are used by Glasspool et al. (2006) intheir model of the graphemic buffer. The positionunits are part of a system that accomplishes letterproduction (in spelling) by using an associativememory to produce individual letters in a wordin the proper order based on a whole word inputand a changing set of position codes. In theshort-term memory literature, Henson has calledthese models “positional theories,” and they havea variety of implementations (Brown et al., 2000;Burgess & Hitch, 1999; Conrad, 1965; Lee &Estes, 1977). In our particular implementation,when a smaller number of positions needs to beencoded, the Gaussian curves are broader, andthey become increasingly narrow as more positions
Figure 7. Normalized serial position curves (in black) for (a) one-item recency effects and (b) two-item recency effects.
142 COGNITIVE NEUROPSYCHOLOGY, 2010, 27 (2)
OLSON, ROMANI, CARAMAZZA
Downloaded By: [Harvard College] At: 16:15 17 February 2011

need to be distinguished (Figure 8; this methodwas chosen to maximize the stability and redun-dancy of the codes for each length, but othercoding schemes, e.g., Gaussian codes with asingle width, produce the same critical outcomes).We assume that errors are made when noise shiftsthe position codes on the encoding units (i.e.,noise shifts the Gaussian peaks left or rightalong the set of encoding units). The noisy pos-ition code produced by the model is comparedwith the noise-free codes for each position. Thissimulates the effect of passing a noisy positioncode to the associative memory we describedabove (as in Glasspool et al., 2006). The positionthat produces the largest dot product of noisyand noise-free codes is assumed to be the positionreported by the associative memory.
The width of the noise distribution does notchange as different length items are encoded bythe model. For this reason, noise more stronglyaffects the positional codes for longer items,which are more crowded together than shorteritems. In addition, the code for the initial positioncan only be confused with items to the right (andconversely, the final position with items to theleft), making initial and final positions less proneto transposition errors. The data reported hereassume that positions are not inhibited once
produced (i.e., they can be produced again), andthey are scored according to what the modelknows, since, for the moment, we are interestedin how the model functions without other limit-ations and not how it compares to empirical data.
Results for 1,000 simulated trials at each lengthare shown in Figure 9. The noise distribution for
Figure 8. Gaussian position codes using 100 units to code (a) 3 positions and (b) 9 positions. Position codes are narrower when coding more
positions over the same number of units.
Figure 9. Results from 1,000 trials at each length coding position
with noisy Gaussian position codes. Noise shifted the position of
Gaussian distributions right or left. Noise had a mean of 0 and a
standard deviation of 5 units.
COGNITIVE NEUROPSYCHOLOGY, 2010, 27 (2) 143
SERIAL POSITION DATA
Downloaded By: [Harvard College] At: 16:15 17 February 2011

these trials has a mean of 0 and a standard devi-ation of 5 units. There are evident end effects forthe first and last positions, creating U-shaped pos-ition curves. Curves for shorter items are abovethose for longer items. This pure effect of lengthresults from filling the capacity of the memorysystem. As positional codes for longer lengthsbecome more crowded, they are more easily con-fused at every position. Aside from the endeffects, there are no effects of serial position.Interior positions are equally susceptible to error.
A contrasting model that produces effects ofserial position but not length is a simplifiedversion of Page and Norris’s (1998) PrimacyModel. This model assumes there is a primacy gra-dient that orders items. Early items in a sequenceare more highly activated than later items. Ateach point when an item needs to be produced,the model chooses the item that is most stronglyactive and then suppresses it so that it cannot bereactivated (following Page and Norris’s assump-tions). In addition, the overall level of activationslowly decays over time, so that the constantdecrease of activation between items gets smalleras time goes on. Noise is added to the activationvalues to simulate transposition errors.
Figure 10 shows the results of 1,000 simulatedtrials at each length. Activation values started at 1and decreased by 0.1 for each position. All acti-vations decayed by e20.2 as each item was produced.Added noise had a mean of 0 and a standard devi-ation of 0.05. In this range, where production isrelatively accurate for early positions, there islittle or no indication of capacity effects, but accu-racy decreases with position in accordance with theprimacy gradient. The lack of capacity effects is notsurprising. As long as the difference between itemsalong the gradient remains relatively robust,capacity is not a limiting factor. If activationdecay were stronger, bringing all items closertogether, or if noise were greater, capacity wouldbecome a more evident factor, as would be appro-priate for intuitions about how the model operates(i.e., it is not capacity limited until codes becomeincreasingly confusable). In the data we presenthere, there is a recency effect limited to a singleitem, which occurs because transpositions tend to
be reciprocal as a result of the primacy gradient(see discussion above), and the last item can onlyexchange with the item to its left.
These two models, based on existing theories,illustrate that different ways of representing pos-ition can produce essentially pure effects of pos-ition and pure effects of length and that thesedifferences in the models can be distinguished inthe raw serial position curves. The importantdifferences would be obscured, however, if we nor-malized the data prior to analysis. We now turn toproblems related to measuring the presence ofabsence of nonlinearity (the U shape) in serialposition data.
Nonlinearity
The presence of the U-shape in the serial positioncurve has been considered diagnostic of a responsebuffer in the neuropsychological literature and is avery common feature of short-term memory data(Murdock, 1968). There are also, however,neuropsychological patients who make errorsinvolving single segments but do not show theimprovement in performance for final items(Glasspool et al., 2006; Romani, Galluzzi, &
Figure 10. Results from 1,000 trials at each length from a
simplified primacy model (based on Page & Norris, 1998).
144 COGNITIVE NEUROPSYCHOLOGY, 2010, 27 (2)
OLSON, ROMANI, CARAMAZZA
Downloaded By: [Harvard College] At: 16:15 17 February 2011

Olson, in press; Schiller et al., 2001; Ward &Romani, 1998). Ward and Romani attributedthis pattern to a separate locus, involving weakeractivation of temporary representations from thelexical level. They argued for this source basedon stronger effects of frequency and imageabilityand based on a substantial number of lexical substi-tution and semantic errors. Glasspool et al. (2006)called this pattern a “Type B” graphemic bufferdisorder, but, like Ward and Romani (1998),they attributed the pattern to degraded input tothe buffer level.
Based on the similarity between the U-shapedfunction for slips of the pen (Wing & Baddeley,1980) and the error function of patients, Schilleret al. (2001) argued that the U-shaped functionis the result of noisy input to the buffer thatexacerbates the normal pattern, and the lineardecline represents damage to the buffer itself.Despite some differences in interpretation, whatall of these authors agree on is that some patientsshow improvement with the final units of asequence (the U-shaped serial position function),and others do not, and that this difference is theor-etically important.
We have already noted that normalized serialposition curves for data with substantial advan-tages for final items and curves for data withoutfinal-item advantages can be very similar. Severalfactors influence the presence and strength of non-linearity in the normalized curve.
One factor is the consistency of shape for shortand long curves. If they do not share the sameshape, the normalized data will be a mixture ofthe long and short curves. As we have seenabove, if advantages for final items only emergestrongly in longer stimuli, and the normalizedserial position curve is based on fewer positionsthan there are in the long stimuli, recency effectsfor longer items can be masked by shorter items(the converse would also hold, if the U-shapewere present only for shorter items). This may bea particular worry for stimulus sets where shorteritems outnumber longer items, as could naturallyarise in data sampling different word lengths, butwhere word length is not specifically controlled.Another way in which different shapes could
emerge in word-based tasks is as a result of struc-tural factors. If, for example, a U-shaped functionoperated over syllables rather than words, or ifvowels and consonants had systematically differenterror rates, curves for long and short words wouldbe expected to differ. If consonants were selectivelypreserved in responses, curves for short words,which in English are likely to have consonantinitial and final portions, would produce a singleU, while curves for longer words, which wouldbe likely to have a consonant in the middle ofthe item, would producing a double U shape.The normalized data would have a single bowedshape, masking the informative heterogeneity ofthe underlying curves.
A second factor is the number of positions thatdata are normalized to. U-shaped data that arenormalized to more positions will be more clearlynonlinear than data normalized to fewer positions.This is a simple consequence of the number ofpoints available to describe the curve. The issueis important when nonlinearity is statisticallytested based on normalized data. One way oftesting the degree of curvature would be to fit anequation that has linear and quadratic componentsto the normalized curve and to use the significanceof the quadratic component as a test of nonlinear-ity. Table 1 shows the significance of the quadraticcomponent when the data displayed in Figure 6aare normalized to different lengths. As thenumber of points increases, the significance ofthe quadratic term increases.
The number of points that curves are normal-ized to is also important if the extent of the
Table 1. Significance of the quadratic component when the data
from Figure 6a are normalized to different lengths
Number of
normalized positions
t value
for quadratic term p
5 2.63 .12
6 2.87 .06
7 3.24 .03
8 3.56 .02
9 3.90 .008
Note: Larger numbers of normalized points result in a clearer
quadratic component.
COGNITIVE NEUROPSYCHOLOGY, 2010, 27 (2) 145
SERIAL POSITION DATA
Downloaded By: [Harvard College] At: 16:15 17 February 2011

initial or final advantage is theoretically important.For example, the degree of interference determinesthe extent of the initial and final advantage wheninterference is the primary factor that produces aU-shape. Interference confined to a single itemon either side of the intended position producesprimacy/recency effects for only a single initial orfinal item. Interference that extends over moreitems allows the initial/final advantage to extendfurther from the ends of the curve (in a modestway). Interference, by itself, can only produce sym-metrical end effects. Other sources of a U-shapedfunction, a primacy gradient (Page & Norris,1998), opposing gradients (Henson, 1998b;Houghton, 1990), or structurally differentmemory systems (Atkinson & Shiffrin, 1971),can predict asymmetric and/or more extensiveadvantages for initial and/or final items. Whendata are normalized, however, the number ofpoints that are advantaged at the beginning orend of a curve depends as much on the numberof normalized positions as it does on the numberof positions that are advantaged in the raw data.When the extent of initial or final effects is theor-etically important, this is best measured usingunstandardized data.
In this section we have seen that theoreticallyimportant aspects of serial position curves cannotalways be recovered unambiguously from normal-ized data. The match between theory and data canbe more easily judged based on the raw serial pos-ition curves for each length.
One major appeal for normalizing serialposition is that it simplifies presentation and analy-sis. If we abandon normalization, can effects oflength, position, and linearity be tested in a trans-parent and reliable, but reasonably straightforward,way? We present some options for analysis in thenext section.
Analysis of serial position data
Analysis of raw serial position curves for differentlengths can be done without too much difficultyusing binomial regression. This is the good news.The bad news is that there is often no simplerecipe that relates a particular serial position
shape or location to a theoretical model. We haveseen, for example, that the method of scoring cansubstantially change the shape of serial positioncurves. What is important is that results from atheoretical model be developed under the same cri-teria as the actual data when model and data arecompared. (We might want to score sequences bystopping at the first error, or by using the longestset of items in the right relative order. We wouldnot want to score model results using modelinternal criteria, which in our example abovewould be closest to stopping at the first error, butthen use the longest set of items in the right relativeorder for participant data.)
We illustrate binomial regression methodsusing the data from the simplified primacy modeland the Gaussian coding model that we presentedabove (Figures 9 and 10). As we have shown, theprimacy model produces position effects but noteffects of length, and the Gaussian coding modelproduces length effects but not position effects.Both models have clear end effects.
When preparing data for analysis, an item’sordinal position, the stimulus length, and a binarycode that indicates whether or not that positionwas preserved in the response must be coded.These data are predicted by a binomial regressionmodel that has terms for length and position.Statistically evaluating length and position effects,however, can be complicated by end effects. Theadvantage for initial and final positions in a three-item sequence is much greater than the advantagein a nine-item sequence because initial and finalpositions make up two thirds of the data whenlength ¼ 3 and two ninths of the data whenlength ¼ 9. This can produce a length effect evenif medial positions show no difference with length.For example, the data from the primacy model(Figure 9) produce both length and positioneffects if end effects are not accounted for (model:correct ¼ length þ position; length, z ¼ –3.46, p, .001; position, z ¼ –15.0, p , .001). One wayto test for effects of length and position that arenot artefacts of end effects is to use dummy variablesthat code 1 for initial position and 0 otherwise and 1for final position and 0 otherwise and to includethese terms in the model. This allows initial and
146 COGNITIVE NEUROPSYCHOLOGY, 2010, 27 (2)
OLSON, ROMANI, CARAMAZZA
Downloaded By: [Harvard College] At: 16:15 17 February 2011

final positions to be fitted independently of medialpositions. If we reanalyse data from the primacyand Gaussian coding models using the modelcorrect ¼ length þ position þ initial þ final, theprimacy model shows clear effects of position butnot length (length, z ¼ 0.371, p ¼ .71; position, z¼ –12.7, p , .001), and the Gaussian codingmodel shows clear effects of length but not position(length, z ¼ –9.86, p , .001; position, z ¼ 0.175,p ¼ .861).
The method to choose for evaluating nonli-nearity depends on the kind of nonlinearity thatneeds to be evaluated. If the expectation is thatthere will be advantages for only initial and/orfinal positions, dummy coding, as we did above,can be used, and the significance of the terms forinitial and final positions can be reported. Forexample, the effects of initial and final positionin the Gaussian coding model are clear using thismethod (initial, z ¼ 6.77, p , .001; final, z ¼6.70, p , .001). If the initial and/or final advan-tage extends over more positions, comparingquadratic and linear models of the data may bemore appropriate. If the quadratic term in amodel of the general class correct ¼ length þ pos-ition þ position2 is significant, this indicates areliable nonlinearity.
As is always the case, statistical significance isnot a direct indicator of theoretical significance.The magnitude of the nonlinearity is important.A small, but significant, nonlinearity, may be lessimportant than a more substantial nonlinearitythat has the same level of significance. In general,it is worth paying attention to the value of the coef-ficients generated by the model. For example, thecoefficients for initial and final positions in theGaussian coding model are .965 and .952. Thisshows us that the initial and final advantages aresymmetrical, which is theoretically significant.
What do the parameters .965 and .952 mean,however, in terms of percentage error, which isthe measure we are interested in? The binomialregression model is based on a logistic function,so the change in probability of error as the par-ameters change is not constant over the rangemodelled. This makes coefficients from logisticmodels more complicated to interpret than the
parameters of linear models. An easy approxi-mation to the rate of change in the probability oferror for a unit change in a parameter value,however, is given by B � p � (1 – p) where B isthe coefficient we are interested in, and p is theaverage proportion of items correct (Agresti,2002). Taking the initial parameter from above(.965) and the average proportion correct (about.75) leads us to expect a primacy advantage ofabout .965 � .75 � .25 ¼ .18, or 18%, which isa bit of an overestimate (12% is the mean valuefrom the data), but shows that the difference issubstantial.
Here, the end effect is something that can beread fairly easily from the data (taking theaverage primacy advantage over all lengths).Evaluating the size of the end effect may bemore critical and less clear when the end effectand some other effect, like a primacy gradient,overlap, as is the case in the primacy model.Binomial regression will help separate thegeneral downward trend that affects all positionsfrom any exaggerated decline that affects onlythe initial position. In this situation, the formulaillustrated above is helpful. Separating end effectsand other effects that depend on position isespecially informative when the expectation isthat end effects will be symmetrical for initialand final positions.
In general, we advocate presenting serial pos-ition data in their raw form. When the data havesystematic structure they are not difficult to inter-pret, and when the structure is not systematic thisshould be a warning about the stability of any con-clusions drawn from them. We suggest thatspecific theoretical questions can be statisticallyexplored using binomial regression. In the neurop-sychological context, theoretical development hasprogressed to the stage where simple classificationof patients, for example, as buffer patients or not,can give way to an exploration of the more specificproperties of a deficit that produces segmentalerrors, and analytic tools are available to supportthis enterprise. Specific mathematical models ofshort-term memory have been very useful,already, for directing empirical work in that area(Botvinick & Plaut, 2006; Brown et al., 2000;
COGNITIVE NEUROPSYCHOLOGY, 2010, 27 (2) 147
SERIAL POSITION DATA
Downloaded By: [Harvard College] At: 16:15 17 February 2011

Burgess & Hitch, 1999; Henson, 1998b;Murdock, 1993; Nairne, 1990; Page & Norris,1998), and normalized data are less commonlyreported for short-term memory studies. Heretoo, however, the links between the mechanismsresponsible for effects and the effects themselvescould sometimes be more transparent (as Farrell& Lewandowsky, 2002, note). Of course, withpatients it is important to interpret serial positiondata in the context of the patient’s more generalpattern of performance (e.g., number of lexical orsemantic errors, effects of frequency and image-ability, etc.), and our focus here should not distractfrom that important point.
When specific quantifiable models are to be con-trasted, perhaps the best method of approachingthe problem is to formalize the models statisticallyand produce likelihood estimates for the data basedon the models. Then, formal model selection pro-cedures (see Burnham & Anderson, 2002) can beused to decide whether any one model gives aclearly superior account of the data. It is importantto note that this approach does not produce a binarydecision about a “winning” model. Instead the levelof support for each model is quantified, which isappropriate, and signals when the data do notclearly distinguish between models. Describingthis process, however, is beyond the scope of thepresent article.
DISCUSSION
Although our starting point has been to examinethe effects of normalizing serial position data, oureventual aim has been broader. We have illustratedsome of the complexity involved in relating serialposition data to underlying theories. There areseveral important issues that we have highlighted.The differing theoretical roles of capacity and inter-ference or capacity and short- and long-term con-tributions to memory mean that length andposition effects need to be distinguished and evalu-ated. Capacity limitations produce vertical displa-cements between curves for different lengths,while position effects create overlapping curvesfor different lengths, but systematic changes with
position. Since normalizing collapses data fromdifferent lengths, length and position effectscannot be distinguished using normalized data.Normalized data often preserve the general shapeof serial position curves, but critical informationlike the extent of the recency portion (if any) willnot be preserved in a way that is independent ofthe parameters used to normalize the data.Likewise, statistical tests based on normalizeddata are also problematic. Both the shape of thecurve and the significance of any nonlinearitydepends on both the data and the number of pos-itions used in the normalization procedure. Whencomparing data from quantitative models andempirical data it is important to match scoring pro-cedures, since different scoring procedures (e.g.,model internal vs. model external) can have sub-stantial effects on the shape of the serial positioncurve. Finally, serial position information shouldnot be used in isolation from the surroundingempirical context. In patient studies, for example,the types of error that patients make and thefactors that influence their performance should beconsidered along with serial position data.
Does normalization ever have a role based onthese considerations? Normalized data may beuseful when what is needed is a compactsummary of the serial position pattern, when thenormalized pattern accurately reflects the under-lying data and when a detailed match betweenspecific theories and the data is not at issue.
If we need to make judgements that havespecific theoretical consequences, like whether amemory buffer is involved in a pattern of errors,we would suggest theoretical and analytic develop-ments allow us to go beyond the resolution thatnormalized data allow. Graphing serial positioncurves for different lengths is somewhat morecomplex than presenting a single normalizedcurve, but the general shape is usually recogniz-able, and raw data preserve detail that is theoreti-cally important.
Binomial regression allows specific hypothesisabout the influence of length, position, and shapeto be tested. Specific quantitative models in thisarea often make predictions about the grossshape of serial position data that are similar and
148 COGNITIVE NEUROPSYCHOLOGY, 2010, 27 (2)
OLSON, ROMANI, CARAMAZZA
Downloaded By: [Harvard College] At: 16:15 17 February 2011

will be hard to distinguish at a general level. Thesemodels may still, however, be distinguishablebased on more detailed comparisons. When thelikelihood of data given the models can be quanti-fied, this presents a powerful way to contrastmodels. We are optimistic that, in the context ofa dialogue between quantitative theories andempirical data, data from serial position curveswill continue to be informative as they areapplied to the questions that Lashley (1951)raised over 50 years ago.
Manuscript received day month year
Revised manuscript received day month year
Revised manuscript accepted 18 May 2010
First published online 23 August 2010
REFERENCES
Acheson, D. J., & MacDonald, M. C. (2009). Twistingtongues and memories: Explorations of the relation-ship between language production and verbalworking memory. Journal of Memory and Language,60, 329–350.
Agam, Y., Bullock, D., & Sekuler, R. (2005). Imitatingunfamiliar sequences of connected linear motions.Journal of Neurophysiology, 94, 2832–2843.
Agresti, A. 2002. Categorical data analysis. Hoboken, NJ:John Wiley & Sons.
Atkinson, R. C., & Shiffrin, R. M. (1971). Control ofshort-term memory. Scientific American, 225, 82–90.
Botvinick, M. M., & Plaut, D. C. (2006). Short-termmemory for serial order: A recurrent neuralnetwork model. Psychological Review, 113, 201–233.
Brown, G. D. A., Preece, T., & Hulme, C. (2000).Oscillator-based memory for serial order.Psychological Review, 107, 127–181.
Buchwald, A., & Rapp, B. (2004). Rethinking the gra-phemic buffer? Brain and Language, 91, 100–101.
Buchwald, A., & Rapp, B. (2006). Consonants andvowels in orthographic representations. Cognitive
Neuropsychology, 23, 308–337.Burgess, N., & Hitch, G. J. (1999). Memory for serial
order: A network model of the phonological loopand its timing. Psychological Review, 106, 551–581.
Burnham, K. P., & Anderson, D. R. (2002). Model selec-
tion and multimodel inference: A practical information-
theoretic approach (2nd ed.). New York: Springer.
Caramazza, A., Miceli, G., & Villa, G. (1986). The roleof the (output) phonological buffer in reading,writing, and repetition. Cognitive Neuropsychology,3, 37–76.
Caramazza, A., Miceli, G., Villa, G., & Romani, C.(1987). The role of the graphemic buffer in spel-ling—evidence from a case of acquired dysgraphia.Cognition, 26, 59–85.
Caramazza, A., Papagno, C., & Ruml, W. (2000). Theselective impairment of phonological processing inspeech production. Brain and Language, 75,
428–450.Cipolotti, L., Bird, C. M., Glasspool, D. W., & Shallice,
T. (2004). The impact of deep dysgraphia on graphe-mic buffer disorders. Neurocase, 10, 405–419.
Conrad, R. (1965). Order error in immediate recall ofsequences. Journal of Verbal Learning and Verbal
Behavior, 4, 161–169.Cotelli, M., Abutalebi, J., Zorzi, M., & Cappa, S. F.
(2003). Vowels in the buffer: A case study ofacquired dysgraphia with selective vowel substi-tutions. Cognitive Neuropsychology, 20, 99–114.
Croisile, B., & Hibert, O. (1998). Spatial or afferentagraphia without left-sided neglect. Aphasiology, 12,
147–159.Davelaar, E. J., Goshen-Gottstein, Y., Ashkenazi, A.,
Haarmann, H. J., & Usher, M. (2005). The demiseof short-term memory revisited: Empirical and com-putational investigations of recency effects.Psychological Review, 112, 3–42.
Farrell, S., & Lewandowsky, S. (2002). An endogenousdistributed model of ordering in serial recall.Psychonomic Bulletin & Review, 9, 59–79.
Gagnon, D. A., & Schwartz, M. F. (1997). Serial pos-ition effects in aphasics’ neologisms. Brain and
Language, 60, 87–89.Glasspool, D. W., & Houghton, G. (2005). Serial order
and consonant-vowel structure in a graphemicoutput buffer model. Brain and Language, 94,
304–330.Glasspool, D. W., Shallice, T., & Cipolotti, L. (2006).
Towards a unified process model for graphemicbuffer disorder and deep dysgraphia. Cognitive
Neuropsychology, 23, 479–512.Goldberg, A. M., & Rapp, B. (2008). Is compound
chaining the serial-order mechanism of spelling? Asimple recurrent network investigation. Cognitive
Neuropsychology, 25, 218–255.Gupta, P., Lipinski, J., Abbs, B., & Lin, P. H. (2005).
Serial position effects in nonword repetition.Journal of Memory and Language, 53, 141–162.
COGNITIVE NEUROPSYCHOLOGY, 2010, 27 (2) 149
SERIAL POSITION DATA
Downloaded By: [Harvard College] At: 16:15 17 February 2011
Gusfield, D. (1997). Algorithms on strings, trees, and
sequences: Computer science and computational biology.Cambridge, UK: Cambridge University Press.
Healy, A. F. (1974). Separating item from order infor-mation in short-term-memory. Journal of Verbal
Learning and Verbal Behavior, 13, 644–655.Henson, R. N. A. (1998a). Item repetition in short-term
memory: Ranschburg repeated. Journal of
Experimental Psychology: Learning Memory and
Cognition, 24, 1162–1181.Henson, R. N. A. (1998b). Short-term memory for
serial order: The start–end model. Cognitive
Psychology, 36, 73–137.Henson, R. N. A. (1999). Positional information in
short-term memory: Relative or absolute? Memory
& Cognition, 27, 915–927.Henson, R. N. A., Norris, D. G., Page, M. P. A., &
Baddeley, A. D. (1996). Unchained memory: Errorpatterns rule out chaining models of immediate serialrecall. Quarterly Journal of Experimental Psychology
Section A: Human Experimental Psychology, 49, 80–115.Houghton, G. (1990). The problem of serial order: A
neural network model of sequence learning andrecall. In R. Dale, C. Mellish, & M. Zock (Eds.),Current research in natural language generation.London: Academic Press.
Kay, J., & Hanley, R. (1991). Simultaneous form per-ception and serial letter recognition in a case ofletter-by-letter reading. Cognitive Neuropsychology,8, 249–273.
Lashley, K. S. (1951). The problem of serial order in be-havior. In L. A. Jeffress (Ed.), Cerebral mechanisms in
behavior (pp. 112–131). New York: John Wiley andSons.
Lee, C. L., & Estes, W. K. (1977). Order and positionin primary memory for letter strings. Journal of Verbal
Learning and Verbal Behavior, 16, 395–418.Lewandowsky, S. (1999). Redintegration and response
suppression in serial recall: A dynamic networkmodel. International Journal of Psychology, 34,
434–446.Lewandowsky, S., & Murdock, B. B. (1989). Memory
for serial order. Psychological Review, 96, 25–57.Lewandowsky, S., Oberauer, K., & Brown, G. D. A.
(2008). No temporal decay in verbal short-termmemory. Trends in Cognitive Sciences, 13, 120–126.
Machtynger, J., & Shallice, T. (2009). Normalizing serialposition analyses: The Proportional Accountabilityalgorithm. Cognitive Neuropsychology, 26, 217–222.
Martin, N., & Saffran, E. M. (1997). Language andauditory-verbal short-term memory impairments:
Evidence for common underlying processes.Cognitive Neuropsychology, 14, 641–682.
Martin, R. C., Shelton, J. R., & Yaffee, L. S. (1994).Language processing and working-memory—neu-ropsychological evidence for separate phonologicaland semantic capacities. Journal of Memory and
Language, 33, 83–111.Mason, M. (1982). Recognition time for letters and
non-letters—effects of serial position, array size,and processing order. Journal of Experimental
Psychology: Human Perception and Performance, 8,
724–738.Murdock, B. B. (1968). Serial order effects in short-
term memory. Journal of Experimental Psychology
Monographs, 76(4, Pt. 2), 1–15.Murdock, B. B. (1993). Todam2—a model for the storage
and retrieval of item, associative, and serial-order infor-mation. Psychological Review, 100, 183–203.
Nairne, J. S. (1990). A feature model of immediatememory. Memory & Cognition, 18, 251–269.
Nairne, J. S. (1991). Positional uncertainty in long-term-memory. Memory & Cognition, 19, 332–340.
Nairne, J. S. (2002). Remembering over the short term:The case against the standard model. Annual Review
of Psychology, 53, 53–81.Neils, J., Roeltgen, D. P., & Greer, A. (1995). Spelling
and attention in early Alzheimers-disease—evidencefor impairment of the graphemic buffer. Brain and
Language, 49, 241–262.Olson, A. C. (1995). Syllables, letter frequency and sound:
Orthographic structure in deaf reading and spelling,Unpublished PhD thesis, The Johns HopkinsUniversity, Baltimore, MD, USA.
Olson, A. C., & Caramazza, A. (1999). Orthographicstructure and deaf spelling errors: Syllables, letter fre-quency and speech. Quarterly Journal of Experimental
Psychology, 57A, 385–417.Olson, A. C., Romani, C., & Halloran, L. (2007).
Localizing the deficit in a case of jargonaphasia.Cognitive Neuropsychology, 24, 211–238.
Page, M. P. A., Madge, A., Cumming, N., & Norris, D.G. (2007). Speech errors and the phonological simi-larity effect in short-term memory: Evidencesuggesting a common locus. Journal of Memory and
Language, 56, 49–64.Page, M. P. A., & Norris, D. (1998). The primacy
model: A new model of immediate serial recall.Psychological Review, 105, 761–781.
Papagno, C., & Girelli, L. (2005). Writing through thephonological buffer: A case of progressive writingdisorder. Neuropsychologia, 43, 1277–1287.
150 COGNITIVE NEUROPSYCHOLOGY, 2010, 27 (2)
OLSON, ROMANI, CARAMAZZA
Downloaded By: [Harvard College] At: 16:15 17 February 2011
Phillips, J. L., Shiffrin, R. M., & Atkinson, R. C. (1967).Effects of list length on short-term memory. Journal of
Verbal Learning and Verbal Behavior, 6, 303–311.Robinson, E. S., & Brown, M. A. (1926). Effect of serial
position upon memorization. American Journal of
Psychology, 37, 538–552.Romani, C., Galluzzi, C., & Olson, A. (in press).
Phonological-lexical activation: A lexical componentor an output buffer? Evidence from aphasic errors.Cortex.
Romani, C., Olson, A., Ward, J., & Ercolani, M. G.(2002). Formal lexical paragraphias in a single casestudy: How “masterpiece” can become “misterpie-man” and “curiosity” “suretoy”. Brain and Language,83, 300–334.
Schiller, N. O., Greenhall, J. A., Shelton, J. R., &Caramazza, A. (2001). Serial order effects in spellingerrors: Evidence from two dysgraphic patients.Neurocase, 7, 1–14.
Schneider, D. W., & Logan, G. D. (2005). Modeling taskswitching without switching tasks: A short-termpriming account of explicitly cued performance.Journal of Experimental Psychology: General, 134,
343–367.
Schwartz, M. F., Wilshire, C. E., Gagnon, D. A., &Polansky, M. (2004). Origins of nonword phonolo-gical errors in aphasic picture naming. Cognitive
Neuropsychology, 21, 159–186.Shallice, T., Rumiati, R. I., & Zadini, A. (2000). The
selective impairment of the phonological outputbuffer. Cognitive Neuropsychology, 17, 517–546.
Tichy, W. F. (1984). The string-to-string correctionproblem with block moves. ACM Transactions on
Computer Systems, 2, 309–321.Tydgat, I., & Grainger, J. (2009). Serial position effects
in the identification of letters, digits, and symbols.Journal of Experimental Psychology: Human
Perception and Performance, 35, 480–498.Ward, J., & Romani, C. (1998). Serial position effects
and lexical activation in spelling: Evidence from asingle case study. Neurocase, 4, 189–206.
Wing, A. M., & Baddeley, A. D. (1980). Spelling errors
in handwriting: A corpus and a distributional analysis.London: Academic Press.
Wing, A. M., & Baddeley, A. D. (2009). Rightingerrors in writing errors: The Wing and Baddeley(1980) spelling error corpus revisited. Cognitive
Neuropsychology, 26, 223–226.
APPENDIX
Calculations used for the simple inferencemodel
We assume that interference is created between adjacent pos-
itions because position codes are similar, but that this simi-
larity decreases with distance. This means, for example, that
when the second item in a sequence needs to be produced,
there is some probability that the first or third item will be
produced instead, but it is less likely that the fourth item
will be produced. To put concrete numbers to these terms,
when we assumed interference between adjacent items only,
Position 2 had a probability of .4 of being produced correctly,
and Positions 1 and 3 had a probability of .3 each of being
produced instead. To implement this, we used a template of
probabilities that we moved across the sequence. The template
for adjacent-only interference was .3, .4, .3, and the template
for interference extending across 2 positions was .1, .2, .4, .2,
.1 (the correct position is in bold). Where the template went
beyond the beginning or end of a list it was normalized. For
example, in Position 1, an error to the left is not possible, so
the probabilities of .4 for the first position and .3 for the
second position were normalized to probabilities of .4/.7 ¼
.57 and .3/.7 ¼ .43. Using the probabilities generated by
our templates, we “rolled the dice” and produced the item
indicated by the template. We generated 1,000 Monte Carlo
trials at each position for each sequence length to produce
Figures 2a and 2b. Note that normalizing the probabilities
in the way we did produces a shallower U-shaped function
than would be produced if probabilities were simply “piled
up” at the ends of the list so that the probability of producing
Position 1 correctly was .7, and the probability of producing
Position 2 was .3 when the template was .3, .4, .3. This is
also a plausible account of end effects. The point is that
both of these assumptions produce U-shaped functions with
position, and the shape of the U depends on the distance
over which position codes interfere due to similarity. To
produce Figure 3, positions that had already been produced
could not be produced again, and probabilities were normal-
ized over positions that were still candidates for production.
COGNITIVE NEUROPSYCHOLOGY, 2010, 27 (2) 151
SERIAL POSITION DATA
Downloaded By: [Harvard College] At: 16:15 17 February 2011