codemotion milan 2015 alerts overload
TRANSCRIPT

MILAN 20/21.11.2015
Alert overload: How to adopt a
microservices architecture without being
overwhelmed with noise
Sarah Wells - Financial Times
@sarahjwells


Microservices make it worse

microservices (n,pl): an efficient device for
transforming business problems into distributed
transaction problems
@drsnooks

You have a lot more systems

45 microservices

45 microservices
3 environments

45 microservices
3 environments
2 instances for each service

45 microservices
3 environments
2 instances for each service
20 checks per service

45 microservices
3 environments
2 instances for each service
20 checks per service
running every 5 minutes

> 1,500,000 system checks
per day

Over 19,000 system
monitoring alerts in 50 days

Over 19,000 system
monitoring alerts in 50 days
An average of 380 per day

Functional monitoring is also an issue

12,745 response time/error
alerts in 50 days

12,745 response time/error
alerts
An average of 255 per day

Why so many?


http://devopsreactions.tumblr.com/post/122408751191/alerts-when-an-outage-starts

How can you make it better?

Quick starts: attack your problem
See our EngineRoom blog for more:
http://bit.ly/1PP7uQQ

1 2 3

Think about monitoring from the start
1

It's the business functionality you care about


1

2
1

3
1
2

4
1
2
3

We care about whether published content made it to us

When people call our APIs, we care about speed

… we also care about errors

But it's the end-to-end that matters
https://www.flickr.com/photos/robef/16537786315/

You only want an alert where you need to take
action

If you just want information, create a dashboard or report

Make sure you can't miss an alert

Make the alert great
http://www.thestickerfactory.co.uk/

Build your system with support in mind

Transaction ids tie all microservices together


Healthchecks tell you whether a service is OK
GET http://{service}/__health

Healthchecks tell you whether a service is OK
GET http://{service}/__health
returns 200 if the service can run the healthcheck

Healthchecks tell you whether a service is OK
GET http://{service}/__health
returns 200 if the service can run the healthcheck
each check will return "ok": true or "ok": false


Synthetic requests tell you about problems early
https://www.flickr.com/photos/jted/5448635109

Use the right tools for the job
2

There are basic tools you need

FT Platform: An internal PaaS

Service monitoring (e.g. Nagios)
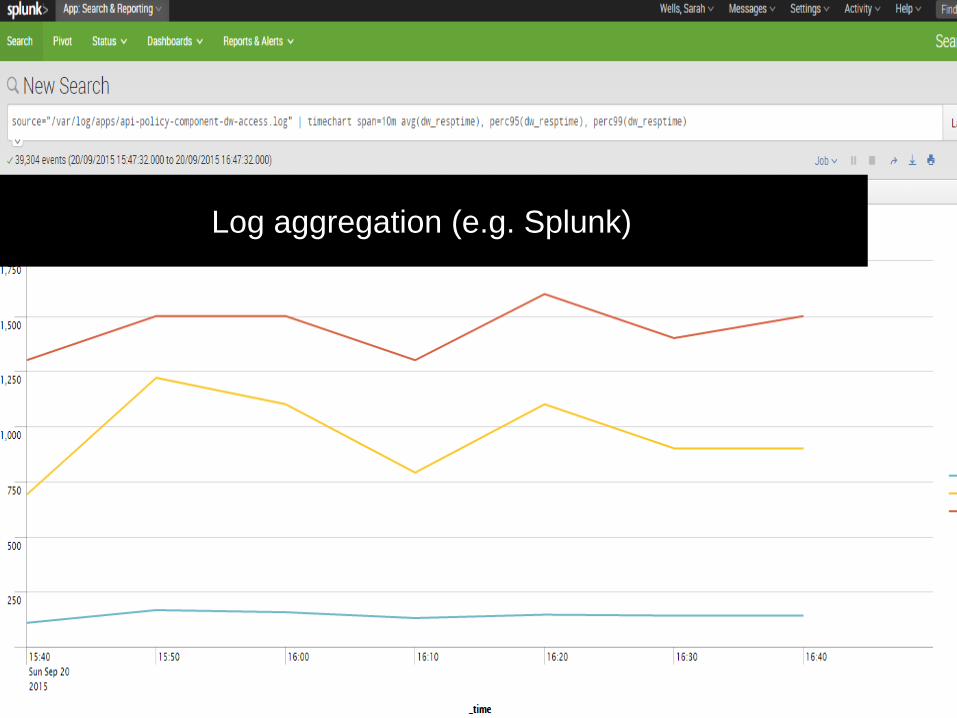
Log aggregation (e.g. Splunk)

Graphing (e.g. Graphite/Grafana)

metrics:
reporters:
- type: graphite
frequency: 1 minute
durationUnit: milliseconds
rateUnit: seconds
host: <%= @graphite.host %>
port: 2003
prefix: content.<%= @config_env %>.api-policy-component.<%=
scope.lookupvar('::hostname') %>


Real time error analysis (e.g. Sentry)

Build other tools to support you


"I imagine most people do exactly
what I do - create a google filter to
send all Nagios emails straight to the
bin"

"Our screens have a viewing angle of
about 10 degrees"

"Our screens have a viewing angle of
about 10 degrees"
"It never seems to show the page I
want"


Dashing


Nagios chart
Built by Simon Gibbs
@simonjgibbs


Use the right communication channel

It's not email
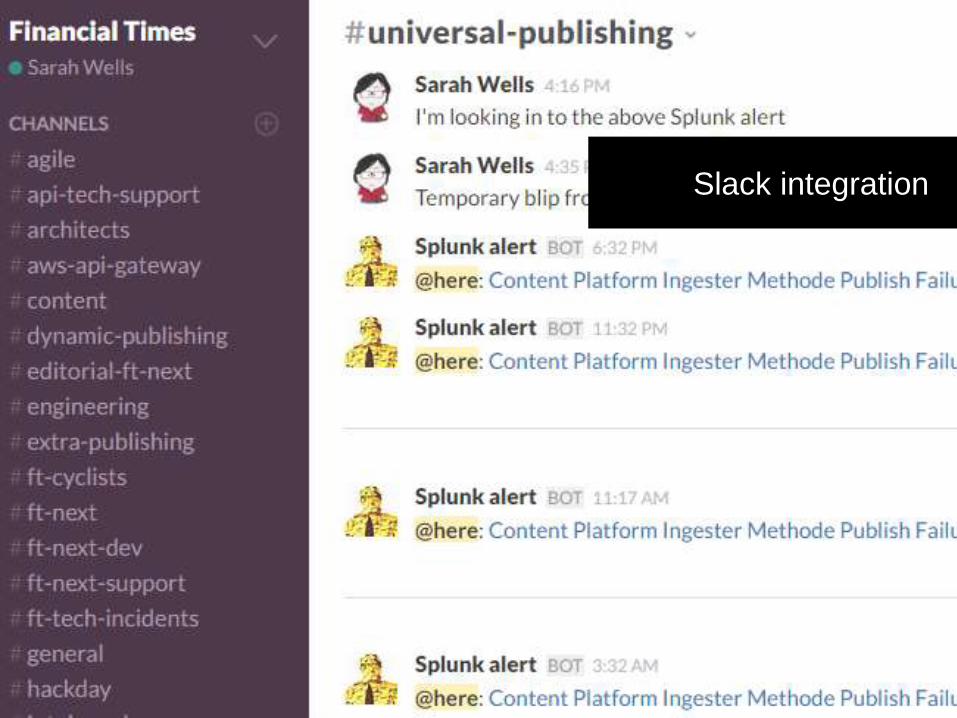
Slack integration


Radiators everywhere

Cultivate your alerts
3

Review the alerts you get

If it isn't
helpful, make
sure you don't
get sent it
again


Splunk Alert: PROD - MethodeAPIResponseTime5MAlert
Business Impact
The methode api server is slow responding to requests.
This might result in articles not getting published to the new
content platform or publishing requests timing out.
...

Splunk Alert: PROD - MethodeAPIResponseTime5MAlert
Business Impact
The methode api server is slow responding to requests.
This might result in articles not getting published to the new
content platform or publishing requests timing out.
...

…
Technical Impact
The server is experiencing service degradation because of
network latency, high publishing load, high bandwidth
utilization, excessive memory or cpu usage on the VM. This
might result in failure to publish articles to the new content
platform.

Splunk Alert: PROD Content Platform Ingester Methode
Publish Failures Alert
There has been one or more publish failures to the
Universal Publishing Platform. The UUIDs are listed below.
Please see the run book for more information.
_time transaction_id uuid
Mon Oct 12 07:43:54 2015 tid_pbueyqnsqe a56a2698-6e90-11e5-8608-a0853fb4e1fe

When you didn't get an alert

What would have told you about this?


Setting up an alert is part of fixing the problem
✔ code
✔ test
alerts

System boundaries are more difficult
Severin.stalder [CC BY-SA 3.0
(http://creativecommons.org/licenses/by-sa/3.0)], via
Wikimedia Commons

Make sure you would know if an alert stopped
working

Add a unit test
public void shouldIncludeTriggerWordsForPublishFailureAlertInSplunk() {
…
}

Deliberately break things

Chaos snail

The thing that sends you alerts need to be up and running
https://www.flickr.com/photos/davidmasters/2564786205/

What's happened to our alerts?

We turned off ALL emails from
system monitoring

Our two most important alerts
come in via our team slack
channel

We have dashboards for
our read APIs in Grafana

To summarise...

Build microservices

1 2 3

About technology at the FT:
Look us up on Stack Overflow
http://bit.ly/1H3eXVe
Read our blog
http://engineroom.ft.com/

The FT on github
https://github.com/Financial-Times/
https://github.com/ftlabs

Thank you!

Questions?