cockpit display of traffic information (cdti) assisted ... · pdf filecockpit display of...
TRANSCRIPT

Cockpit Display of Traffic Information (CDTI)
Assisted Visual Separation (CAVS)
Benefits Analysis Report
Federal Aviation Administration, American Airlines and Aviation Communication & Surveillance Systems, LLC NextGen Project
Initial Release
May 4, 2016
Surveillance and Broadcast Services (SBS) Program Office
Federal Aviation Administration

FAA / AAL / ACSS NextGen Project CAVS Benefits Analysis Report
Record of Revisions
Revision Date Description of Change N/A 5/4/16 Initial Release
Page 2

FAA / AAL / ACSS NextGen Project CAVS Benefits Analysis Report
Table of Contents 1 Executive Summary ................................................................................................................ 8
1.1 Pilot Surveys on the Use of the CDTI ........................................................................ 8 1.2 Informal Pilot Discussions on CAVS ......................................................................... 8 1.3 CAVS Benefits Analysis ............................................................................................ 9
1.3.1 Time Between Consecutive Arrivals Analysis Results ................................ 10 1.3.2 Time / Distance Flown from 25nm Radius to Runway Analysis Results .... 10 1.3.3 Fix-to-Runway Analysis Results .................................................................. 11
1.4 Analysis Limitations ................................................................................................. 13 2 Application Overviews ......................................................................................................... 14
2.1 Phase 1: Situational Awareness / CDTI Familiarization Overview ......................... 15 2.2 Phase 2: CAVS Application Overview .................................................................... 16
3 Operator Assessment ............................................................................................................ 17 3.1 Pilot Surveys on Use of the CDTI ............................................................................ 17 3.2 Pilot Feedback Discussions on CAVS ..................................................................... 18
4 Analysis Objectives .............................................................................................................. 20 5 Benefits Analysis .................................................................................................................. 21
5.1 General Benefits Analysis Process ........................................................................... 21 5.2 Benefits Metrics ........................................................................................................ 21 5.3 Benefits Data and Data Sources ............................................................................... 21
5.3.1 Enhanced Traffic Management System (ETMS) ......................................... 21 5.3.2 Compliance Monitor (CM) ........................................................................... 22 5.3.3 Aviation System Performance Metrics (ASPM) .......................................... 22 5.3.4 Flight Crew Comments Sheets ..................................................................... 22 5.3.5 SafeRoute ..................................................................................................... 22 5.3.6 Flight Operations Quality Assurance (FOQA) ............................................. 22
5.4 Data Analysis Periods and Methodologies ............................................................... 22 5.5 Situational Awareness Benefits Review ................................................................... 24 5.6 CAVS Queuing Model Benefits Estimate ................................................................ 24 5.7 CAVS Benefits Analysis .......................................................................................... 24
5.7.1 Time Between Consecutive Arrivals ............................................................ 25 5.7.2 Time / Distance Flown from 25nm Radius to Runway ................................ 26 5.7.3 Fix-to-Runway Analysis ............................................................................... 27
5.8 Analysis Limitations ................................................................................................. 32
Page 3

FAA / AAL / ACSS NextGen Project CAVS Benefits Analysis Report
List of Figures Figure 2-1. Captain’s EFB, a CDTI and the AGD ..................................................................... 15
Figure 3-1. Number of Pilot Surveys Received .......................................................................... 17
Figure 5-1. General Benefits Analysis Process .......................................................................... 21
Figure 5-2. CM Data Analysis Periods ....................................................................................... 23
Figure 5-3. Example of the "East" Approaches on JIIMS Arrival to 27R ................................. 28
Figure 5-4. Example of the "West" Approaches on BOJID Arrival to 27R ............................... 29
Figure 5-5. Flights Used in Analysis .......................................................................................... 30
Figure 5-6. Flights Used for CAVS Proxy ................................................................................. 31
Page 4

FAA / AAL / ACSS NextGen Project CAVS Benefits Analysis Report
List of Tables Table 1. Time Between Consecutive Arrivals Conditions: Time Period Comparison ............... 10
Table 2. Time Between Consecutive Arrivals Conditions: Operator Flights Comparison ........ 10
Table 3. Time / Distance Flown from 25nm Radius to Runway Conditions; Time Period Comparison ............................................................................................................. 11
Table 4. Time / Distance Flown from 25nm Radius to Runway Conditions; Operator Flights Comparison ............................................................................................................. 11
Table 5. Time / Distance Flown Fix-to-Runway Conditions; Non-CAVS Flight Ops vs. CAVS Flight Ops ................................................................................................................ 12
Table 6. Time / Distance Flown Fix-to-Runway Conditions; CAVS + Coupled Below 9000’ Comparison ............................................................................................................. 13
Table 7. Number of PHL Arrival Pairs Used in Analysis: By Period and Weather Conditions 25
Table 8. Average Time Between Arrivals For All Flights in VMC and MMC ......................... 25
Table 9. Average Time Between Arrivals: Non-AAL A330s vs. AAL A330s in MMC ........... 26
Table 10. Time Flown from 25nm Radius to Runway for All Flights: VMC and MMC .......... 26
Table 11. Time Flown from 25nm Radius to Runway for AAL A330s: VMC and MMC ........ 27
Table 12. Time Flown from 25nm Radius to Runway CAVS: Non-AAL A330s vs. AAL A330s in VMC and MMC .................................................................................................. 27
Table 13. Non-CAVS Flight Ops vs. CAVS Flight Ops: VMC, MMC and IMC...................... 30
Table 14. Non-CAVS Flight Ops vs. CAVS Flight Ops: Deteriorating Weather Conditions ... 31
Table 15: Not CAVS+Coupled<9K' vs. CAVS+Coupled<9K': VMC, MMC, IMC ................. 32
Table 16. Not CAVS / Coupled <9K' vs. CAVS / Coupled < 9K': Ceiling and Visibility All .. 32
Table 17. Average Time Between Arrivals in VMC and MMC ................................................ 47
Table 18. Average Time Between Arrivals: Non-AAL A330s vs. AAL A330s in MMC ......... 47
Table 19. Time/Distance Flown from 25nm Radius to Runway: All Flights in VMC and MMC ................................................................................................................................. 48
Table 20. Time/Distance Flown from 25nm Radius to Runway: AAL A330s in VMC and MMC ....................................................................................................................... 48
Page 5

FAA / AAL / ACSS NextGen Project CAVS Benefits Analysis Report
Table 21. Time/Distance Flown from 25nm Radius to Runway CAVS: Non-AAL A330s vs. AAL A330s in VMC and MMC ............................................................................. 48
Table 22. Time/Distance Flown from Fix-to-Runway, Non-CAVS vs. CAVS: Deteriorating Weather where Ceiling Varies and Visibility All ................................................... 49
Table 23. Time/Distance Flown from Fix-to-Runway, Non-CAVS vs. CAVS: Deteriorating Weather where Ceiling All and Visibility Varies ................................................... 50
Table 24. Time/Distance Flown from Fix-to-Runway, Non-CAVS vs. CAVS: Deteriorating Weather where Ceiling Varies and Visibility Varies .............................................. 51
Table 25. Time/Distance Flown from Fix-to-Runway, Non-CAVS vs. CAVS: VMC, MMC & IMC ......................................................................................................................... 52
Table 26. Time/Distance Flown from Fix-to-Runway, Not CAVS+Coupled <9K' vs. CAVS+Coupled <9K': Ceiling All and Visibility All ............................................. 52
Table 27. Time/Distance Flown from Fix-to-Runway, Not CAVS+Coupled <9K' vs. CAVS+Coupled <9K': VMC, MMC and IMC ....................................................... 52
Page 6

FAA / AAL / ACSS NextGen Project CAVS Benefits Analysis Report
List of Appendixes Appendix A. Reference Documents ........................................................................................... 34
Appendix B. Glossary ................................................................................................................ 35
Appendix C. Abbreviations ........................................................................................................ 36
Appendix D. Flight Crew Comment Sheet ................................................................................. 37
Appendix E. Pilot Survey Summaries ........................................................................................ 40
Appendix F. Data and Data Sources ........................................................................................... 45
Appendix G. Data Analysis Mann-Whitney Test Summaries .................................................... 47
Appendix H. PHL Airport Diagram ........................................................................................... 53
Appendix I. BOJID ONE and JIIMS TWO RNAV Arrivals ..................................................... 54
Page 7

FAA / AAL / ACSS NextGen Project CAVS Benefits Analysis Report
1 EXECUTIVE SUMMARY
Since January 13, 2009, the Federal Aviation Administration (FAA), American Airlines (at the time, US Airways), and Aviation Communication & Surveillance Systems (ACSS) have been conducting a Next Generation Air Transportation System (NextGen) Project implementing Automatic Dependent Surveillance – Broadcast (ADS-B) concepts and applications on American Airlines (AAL) A330 aircraft operating in and out of Philadelphia International Airport (PHL).
The project consists of three overlapping phases:
1) In Phase 1, American Airlines flight crews began using a Cockpit Display of Traffic Information (CDTI) for improved situational awareness and to familiarize American Airlines’ flight crews with ADS-B traffic symbology, display controls, etc. Phase 1 flight operations began on July 10, 2013.
2) In Phase 2, American Airlines introduced the CDTI Assisted Visual Separation (CAVS) application into their A330 arrival operations. Phase 2 flight operations began on May 20, 2014.
3) Phase 3 implements the Merging and Spacing (M&S) application into their A330 arrival operations. Phase 3 data collection is ongoing and will be analyzed at a future date.
This report focuses on Phase 1 and 2 results; specifically, the paper-based pilot surveys on their use of the CDTI, pilot feedback discussions on CAVS, and the benefits analysis using data collected during Phase 1 and Phase 2 flight operations.
1.1 Pilot Surveys on the Use of the CDTI The pilot surveys on the CDTI, although limited, were generally very positive with the following observations:
• The CDTI was often used in all phases of flight, with most uses occurring in Taxi and Arrival phases.
• Traffic situational awareness was very positively impacted. • Flight operations were slightly to very positively impacted. • Workload was generally not impacted. • CDTI information was consistent with Air Traffic Control (ATC) and visual
information. • During half of the flights ATC was contacted, mainly for altitude changes. • Most pilots found the CDTI easy to interpret and use. • Problems consisted of non-optimal CDTI location and one instance where the database
was out of date.
1.2 Informal Pilot Discussions on CAVS Volpe held informal discussions with 25 American Airlines A330 pilots [5] on their use of CAVS approximately six months after CAVS approval. Although many of the pilots did not select an aircraft with which to perform CAVS, one pilot noted that the display allowed him to
Page 8

FAA / AAL / ACSS NextGen Project CAVS Benefits Analysis Report
make quicker, yet confident, responses when following traffic. Outside of the CAVS procedure, pilots also found several uses for the ADS-B display and report using the traffic display to:
• Call the aircraft ahead, above, or below them using the displayed call sign to inquire about ride quality.
• Make more informed requests of ATC. Route changes and altitude requests have a greater chance of being approved when no conflicting traffic can be identified on the ADS-B-based CDTI.
• Identify a path for emergency descent in the event of an engine outage. • See who might be ahead of them in Customs. While this might appear to be trivial, it
actually has both practical and operational implications. If a large aircraft is ahead, then the lines in customs will be longer. Long wait times in customs lines result in disgruntled passengers and contribute to increased chances of missed connections. Depending on the circumstances crews might request an altitude with less headwind or increase their speed, attempting to arrive before the other aircraft.
1.3 CAVS Benefits Analysis Benefits analysis consisted of three analysis types: 1) Time Between Consecutive Arrivals, 2) Time/Distance Flown from 25nm Radius to Runway, and 3) Fix-to-Runway.
The analyses looked for an improvement in time flown based on time periods (e.g., before and after CAVS flight operations began) and/or aircraft equipage (e.g., CAVS equipped and not CAVS equipped), depending on the analysis. Although most analyses also calculated the change in distance flown, the report focuses on changes in time flown as a time savings is much more easily translated into an improvement in operational efficiency versus an improvement in distance flown.
Each analysis used data from flights that arrived during the peak arrival period at PHL of 12:45 – 18:45 local time, only. Each analysis looked for improvements in each metric under weather conditions in which CAVS might be of most use (e.g., Instrument Meteorological Conditions (IMC), Marginal Meteorological Conditions (MMC)1, deteriorating weather conditions2). Analysis was also conducted using flights arriving in Visual Meteorological Conditions (VMC).
A test for statistical significance3 was performed on the results of each analysis. Results were also reported if “approaching significance”.4
1MMC is defined as visibility >= 5 statute miles (sm) and ceiling 2000 ft. – 3000 ft. Above Ground Level (AGL) 2 Visibility varies between 3 – 7 sm and ceiling varies between 2000 – 6000 ft. AGL. 3Statistical significance (or a statistically significant result) is attained when a p-value (calculated probability) is less than the significance level (denoted α, alpha). The p-value of less than alpha indicates strong evidence that the results of the sample were not arrived at by chance. For the CAVS Benefits analysis, Mann-Whitney tests were performed where α = 0.05 (a 5% significance level). 4 Approaching significance is defined as 0.05 < p < 0.10. Although not statistically significant, p values within this range may become statistically significant with additional data sets.
Page 9
FAA / AAL / ACSS NextGen Project CAVS Benefits Analysis Report
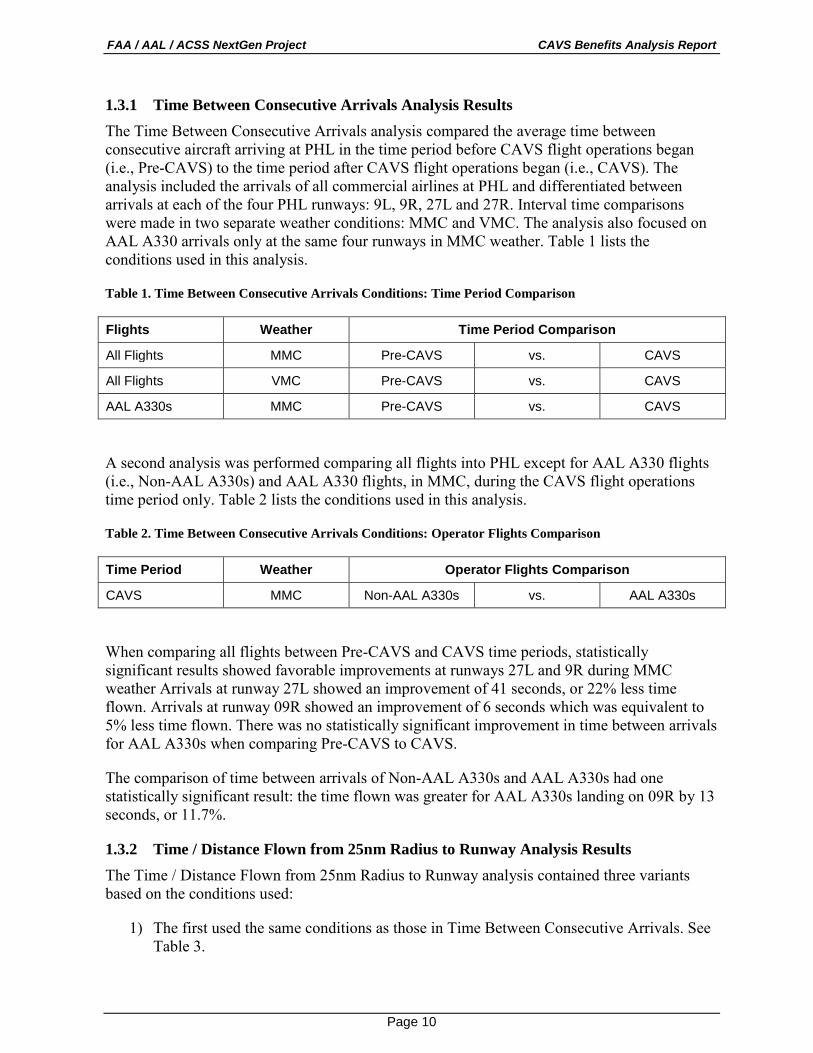
1.3.1 Time Between Consecutive Arrivals Analysis Results The Time Between Consecutive Arrivals analysis compared the average time between consecutive aircraft arriving at PHL in the time period before CAVS flight operations began (i.e., Pre-CAVS) to the time period after CAVS flight operations began (i.e., CAVS). The analysis included the arrivals of all commercial airlines at PHL and differentiated between arrivals at each of the four PHL runways: 9L, 9R, 27L and 27R. Interval time comparisons were made in two separate weather conditions: MMC and VMC. The analysis also focused on AAL A330 arrivals only at the same four runways in MMC weather. Table 1 lists the conditions used in this analysis.
Table 1. Time Between Consecutive Arrivals Conditions: Time Period Comparison
Flights Weather Time Period Comparison
All Flights MMC Pre-CAVS vs. CAVS
All Flights VMC Pre-CAVS vs. CAVS
AAL A330s MMC Pre-CAVS vs. CAVS
A second analysis was performed comparing all flights into PHL except for AAL A330 flights (i.e., Non-AAL A330s) and AAL A330 flights, in MMC, during the CAVS flight operations time period only. Table 2 lists the conditions used in this analysis.
Table 2. Time Between Consecutive Arrivals Conditions: Operator Flights Comparison
Time Period Weather Operator Flights Comparison
CAVS MMC Non-AAL A330s vs. AAL A330s
When comparing all flights between Pre-CAVS and CAVS time periods, statistically significant results showed favorable improvements at runways 27L and 9R during MMC weather Arrivals at runway 27L showed an improvement of 41 seconds, or 22% less time flown. Arrivals at runway 09R showed an improvement of 6 seconds which was equivalent to 5% less time flown. There was no statistically significant improvement in time between arrivals for AAL A330s when comparing Pre-CAVS to CAVS.
The comparison of time between arrivals of Non-AAL A330s and AAL A330s had one statistically significant result: the time flown was greater for AAL A330s landing on 09R by 13 seconds, or 11.7%.
1.3.2 Time / Distance Flown from 25nm Radius to Runway Analysis Results The Time / Distance Flown from 25nm Radius to Runway analysis contained three variants based on the conditions used:
1) The first used the same conditions as those in Time Between Consecutive Arrivals. See Table 3.
Page 10

FAA / AAL / ACSS NextGen Project CAVS Benefits Analysis Report
2) The second also used the same conditions as Time Between Consecutive Arrivals except it was limited to AAL’s A330 arrivals only. See Table 3.
3) The third was a comparison between all flights into PHL except for AAL A330 flights (i.e., non-AAL A330s) and AAL A330 flights, in VMC and MMC, during the CAVS flight operations time period only. See Table 4.
The second and third analyses did not differentiate between AAL A330s equipped with CAVS and those not equipped with CAVS. Therefore, all AAL A330s (not just equipped aircraft) were used in both the Pre-CAVS and CAVS time periods.
Table 3. Time / Distance Flown from 25nm Radius to Runway Conditions; Time Period Comparison
Flights Weather Time Period Comparison
All Flights MMC Pre-CAVS vs. CAVS
All Flights VMC Pre-CAVS vs. CAVS
AAL A330s MMC Pre-CAVS vs. CAVS
AAL A330s VMC Pre-CAVS vs. CAVS
Table 4. Time / Distance Flown from 25nm Radius to Runway Conditions; Operator Flights Comparison
Time Period Weather Operator Flights Comparison
CAVS MMC Non-AAL A330s vs. AAL A330s
CAVS VMC Non-AAL A330s vs. AAL A330s
The analysis of time flown from a 25nm radius for all flights in MMC (Pre-CAVS vs. CAVS) had mixed results with two direction / runway pairs yielding positive statistically significant results (flights arriving from the East and landing on 27L (East 27L) or on 27R (East 27R)), one pair yielding a positive approaching significance result (West 27R) and two pairs yielding negative statistically significant results (East 09R and West 09R).
There were no statistically significant improvements when comparing the time flown of AAL A330s flights during the Pre-CAVS period and CAVS period. However, there was one set of conditions for which the difference in time flown for AAL A330s arrivals was positive and approached significance, at East 27R in MMC.
Time flown for AAL A330 flights showed statistically significant improvement over all other operator flights in the CAVS period, both in MMC and VMC weather. In MMC arrivals at East 27R and West 27R showed improvement of 14% and 28% in time flown, respectively.
1.3.3 Fix-to-Runway Analysis Results The Fix-to-Runway analysis used a variety of conditions when comparing time and distance flown from a crossed arrival-fix on the flight path to the runway for American Airlines A330.
Page 11

FAA / AAL / ACSS NextGen Project CAVS Benefits Analysis Report
Unlike the previous analyses, the Fix-to-Runway analysis is limited to only AAL A330 flights but differentiates between American Airlines A330s equipped with CAVS and those not equipped with CAVS. The analysis groups the flights as follows:
• Non-CAVS Flight Ops refers to arrivals performed during the Pre-CAVS time period (i.e., before May 20, 2014) by any AAL A330 (CAVS-equipped and not CAVS-equipped), and arrivals performed during the CAVS time period (i.e., on or after May 20, 2014) by any AAL A330 not equipped with CAVS.
• CAVS Flight Ops refers to arrivals performed during the CAVS time period by AAL CAVS-equipped A330s, only.
The analysis differentiated between arrivals at each of the four PHL runways: 9L, 9R, 27L and 27R. The comparisons were made in MMC, IMC, VMC, deteriorating weather conditions, and all weather conditions. Table 5 shows the conditions used in this analysis.
Table 5. Time / Distance Flown Fix-to-Runway Conditions; Non-CAVS Flight Ops vs. CAVS Flight Ops
Flights Weather Time Period Aircraft Time
Period Aircraft
AAL A330s MMC
Pre-CAVS All AAL A330s vs. CAVS Equipped AAL A330s
CAVS Non-equipped AAL A330s
AAL A330s IMC
Pre-CAVS All AAL A330s vs. CAVS Equipped AAL A330s
CAVS Non-equipped AAL A330s
AAL A330s VMC
Pre-CAVS All AAL A330s vs. CAVS Equipped AAL A330s
CAVS Non-equipped AAL A330s
AAL A330s
Deterior-ating
Pre-CAVS All AAL A330s vs. CAVS Equipped AAL A330s
CAVS Non-equipped AAL A330s
AAL A330s All
Pre-CAVS All AAL A330s vs. CAVS Equipped AAL A330s
CAVS Non-equipped AAL A330s
In MMC weather CHEAZ-09R showed an improvement in time flown of approximately 8% and in IMC weather WOJIK-27R showed an improvement in time flown of approximately 6%. Note that both of these statistical results were “approaching significance”.
In deteriorating weather conditions there were three Fix-to-Runway results that were statistically significant or approaching significance, all of which were positive indicating an improvement from the Non-CAVS Flight Ops to CAVS Flight Ops periods. The improvements in time flown ranged from 7% to 11.9%. In general, improvements were more apparent when ceiling conditions worsened.
A second Fix-to-Runway analysis was completed using only American Airlines CAVS-equipped A330 arrivals for the CAVS time period. It analyzed the same metrics for AAL A330
Page 12

FAA / AAL / ACSS NextGen Project CAVS Benefits Analysis Report
flights during which the flight crews used the CAVS application and the flights were coupled5 below 9000' compared to AAL A330 flights where the CAVS application was not used or it was used but the flight did not remain coupled below 9000'. Flights coupled below 9000' served as a proxy for potential CAVS approaches, since confirmation of all CAVS approaches (via pilot surveys) were not available. See Table 6 for the conditions used in this analysis.
Table 6. Time / Distance Flown Fix-to-Runway Conditions; CAVS + Coupled Below 9000’ Comparison
Flights Weather Time Period CAVS / Coupled Comparison
Equipped AAL A330s MMC CAVS
Not CAVS+Coupled<9K' vs. CAVS+Coupled<9K'
Equipped AAL A330s IMC CAVS
Not CAVS+Coupled<9K' vs. CAVS+Coupled<9K'
Equipped AAL A330s VMC CAVS
Not CAVS+Coupled<9K' vs. CAVS+Coupled<9K'
Equipped AAL A330s Deteriorating CAVS
Not CAVS+Coupled<9K' vs. CAVS+Coupled<9K'
Equipped AAL A330s All CAVS
Not CAVS+Coupled+9K' vs. CAVS+Coupled<9K'
When comparing Not CAVS+Coupled <9K' to CAVS+Coupled <9K' in VMC, MMC and IMC, only one fix pair was statistically significant: PSOUT-27R showed an improvement in time flown of over 12% in VMC weather.
No comparisons of fix pairs in deteriorating weather conditions were statistically significant.
One fix pairs’ analysis of time flown in all weather conditions was statistically significant and positive; PSOUT-27R showed an improvement of almost 13%.
1.4 Analysis Limitations While the benefits analyses did result in some improvements in the metrics measured, they were more limited than anticipated. This was likely due to several factors including:
• Limited number of potential CAVS flights. • Limited ability to identify when CAVS was used by AAL flight crews. • Activities resulting from the American Airlines/US Airways merger (e.g., contract
negotiations, schedule integration) limiting the focus placed on performing CAVS operations
5 When performing CAVS, the flight crew of the CAVS-equipped aircraft “couples” to the aircraft it is following (i.e., preceding aircraft) so that the onboard system displays information needed for the CAVS procedure including the preceding aircraft flight ID, differential ground speed of the two aircraft, and the distance to the preceding aircraft. DO-317B, Minimum Operational Performance Standards (MOPS) for Aircraft Surveillance Applications (ASA) System, refers to the preceding aircraft as designated traffic when performing CAVS.
Page 13

FAA / AAL / ACSS NextGen Project CAVS Benefits Analysis Report
2 APPLICATION OVERVIEWS
In order to perform the tasks outlined in this project, American Airlines equipped a portion of their A330 fleet with the following:
• Two Class 3 Electronic Flight Bags (EFB) that host the CDTI application and interface with the traffic computer. The captain’s EFB display is shown in the top of Figure 2-1, just above the captain’s sidestick.
• CDTI hosted on the EFB providing integrated display of ADS-B and TCAS Traffic, CDTI and CAVS application controls, and ADS-B In system status and advisory messages. A sample CDTI screen is shown in the bottom left of Figure 2-1.
• Auxiliary Guidance Display (AGD) providing speed guidance, distance to coupled traffic, differential ground speed, and visual caution/warning alerts/advisory annunciators. The AGD is shown in the bottom right of Figure 2-1.
Page 14

FAA / AAL / ACSS NextGen Project CAVS Benefits Analysis Report
Figure 2-1. Captain’s EFB, a CDTI and the AGD
2.1 Phase 1: Situational Awareness / CDTI Familiarization Overview Cockpit Display of Traffic Information (CDTI) technology was added to the aircraft enhancing the flight crews’ awareness of surrounding traffic while airborne and on or near the surface area. During Phase 1 flight crews became familiar with the location and use of the two CDTI displays. It is expected that the familiarization will improve the crew’s situational awareness since other visually identified ADS-B equipped aircraft can be correlated to ADS-B aircraft
Page 15

FAA / AAL / ACSS NextGen Project CAVS Benefits Analysis Report
shown on the CDTI, enabling crews to smoothly transition over to the CDTI (Cockpit Display of Traffic Information) Assisted Visual Separation (CAVS) application use in Phase 2.
2.2 Phase 2: CAVS Application Overview CDTI (Cockpit Display of Traffic Information) Assisted Visual Separation (CAVS) [3] is a procedure in which controllers assign, and pilots accept, separation responsibility from another aircraft on a visual approach in a manner similar to visual separation today in order to achieve an operational advantage in the National Airspace System (NAS). ADS-B is the underlying technology being utilized; therefore, the aircraft performing the CAVS operation must have ADS-B In capability with an appropriate CDTI. Furthermore, the Traffic to Follow (TTF) must have ADS-B Out capability.
The concept of CAVS mirrors visual separation as known today, augmented with appropriate cockpit displays that provide a more complete set of information about the TTF aircraft than can be derived from out the window contact. Because CAVS is a visual separation procedure, the pilots are responsible for determining and maintaining safe separation from the assigned TTF aircraft. CAVS enables pilots to accept separation responsibility from other aircraft with the aid of a CDTI. In CAVS the flight crew is allowed to use the information provided by the CDTI for the TTF, after visual TTF acquisition and correlation on the CDTI, in addition to or as a substitute for out the window information. Therefore, once the TTF has been acquired by correlating the traffic on the CDTI, with a visual acquisition of the traffic out-the-window, CAVS can continue through the use of the traffic display (i.e., CDTI) when the traffic out-the-window is no longer immediately visible. The CDTI will aid in situational awareness, provide the pilots with the ability to more readily and more positively identify traffic to follow, and to help maintain visual separation requirements during day and night Visual Meteorological Conditions (VMC).
Page 16

FAA / AAL / ACSS NextGen Project CAVS Benefits Analysis Report
3 OPERATOR ASSESSMENT
3.1 Pilot Surveys on Use of the CDTI Pilot surveys can be utilized to provide valuable insights into operations including frequency of use, when and how the CDTI was used, impact on situational awareness, impact on workload, etc. Unfortunately, pilot surveys can also be difficult to collect, especially paper-based ones.
American Airlines provided paper-based surveys to pilots on the CDTI-equipped A330s requesting voluntary feedback in three areas: 1) General use of the CDTI, 2) In-Trial Procedure (ITP), and 3) Surface Area Movement Manager (SAMM). The following will address only the first area, General use of the CDTI.
From October 2013 through October 2015 only 13 surveys were collected, with the majority collected in the early months (see Figure 3-1). The decline in collected surveys was expected, and perhaps exacerbated by activities associated with the US Airways/American Airlines merger.
Figure 3-1. Number of Pilot Surveys Received
Although only 13 surveys were received (see Appendix E for survey summaries), some general observations can be made.
• The CDTI was often used in all phases of flight, with most uses occurring in Taxi and Arrival phases.
• Traffic situational awareness was very positively impacted. • Flight operations were slightly to very positively impacted. • Workload was generally not impacted. • CDTI information was consistent with ATC and visual information. • During half of the flights ATC was contacted, mainly for altitude changes; flight crews
had a better awareness of available altitudes by using the CDTI. • Most pilots found the CDTI easy to interpret and use.
Page 17

FAA / AAL / ACSS NextGen Project CAVS Benefits Analysis Report
• Problems consisted of non-optimal CDTI location and one instance where the database was out of date.
Given the difficulty in collecting paper surveys, American Airlines has been working to implement a version of the survey into an electronic format via their pilot iPads. This was completed in early 2016.
3.2 Pilot Feedback Discussions on CAVS After approximately six months of CAVS operations Allied Pilots Association (APA) organized informal discussions with pilots that American Airlines hosted at their Flight Operations Office at PHL on December 1 and 2, 2014. The goals of these discussions were to solicit feedback on if and how the pilots were using the display, determine if they had ever completed a CAVS approach (i.e., a visual approach that would have been cancelled had the aircraft not been equipped), and describe what they see as benefits and limitations of the display. The APA representative approached pilots who were arriving from, or departing to, an international destination on CAVS-equipped A330 aircraft.
A total of 25 pilots (three of whom were First Officers) provided feedback to the APA representatives and three human factors specialists over the two-day period (all were present for each discussion). Conversations began with asking pilots if they use the display; and if so, for what purposes. If they had used the display, pilots were asked:
• Have you used it on approach to capture an aircraft to follow? • Would you have had to cancel the visual approach if you weren’t using CAVS?
Pilots were then invited to offer any other comments on the display or its uses, and recommendations for improvements to the equipment or training. The only other questions asked followed from the comments offered. The results of these discussions shed light on actions that might maximize the benefits of an ADS-B-based CDTI.
While only a few of the pilots said they had coupled with another aircraft, none of them had experienced conditions that would have involved losing sight of the lead aircraft and continuing the approach with CAVS. That did not mean, however, that the display afforded no benefits on visual approaches. One pilot said he is quick to report the airport in sight, but hesitates to report the aircraft (to follow) in sight until he has double-checked for accuracy; the display allows him to make a quicker, yet confident, response.
Outside of the CAVS procedure, pilots found several uses for the ADS-B display. Pilots reported using the traffic display to:
• Call the aircraft ahead, above, or below them using the displayed call sign to inquire about ride quality.
• Make more informed requests of ATC. Route changes and altitude requests have a greater chance of being approved when no conflicting traffic can be identified on the ADS-B-based CDTI.
• Identify a path for emergency descent in the event of an engine outage. • See who might be ahead of them in Customs. While this might appear to be trivial, it
actually has both practical and operational implications. If a large aircraft is ahead, then
Page 18
FAA / AAL / ACSS NextGen Project CAVS Benefits Analysis Report
the lines in customs will be longer. Long wait times in customs lines result in disgruntled passengers and contribute to increased chances of missed connections. Depending on the circumstances crews might request an altitude with less headwind or increase their speed, attempting to arrive before the other aircraft.
Page 19

FAA / AAL / ACSS NextGen Project CAVS Benefits Analysis Report
4 ANALYSIS OBJECTIVES
Following are the primary objectives used for developing the benefits analysis report:
• As appropriate, use the same data and benefits analysis methods as used in the ADS-B Benefits Basis of Estimate. [1]
• Determine if the estimated benefits are realized during American Airlines’ flight operations at PHL.
• Tailor the benefits analysis to American Airlines by using their operations and cost data, where applicable.
• Use more than one benefits analysis methodology since the benefits may not be apparent in just one method due to the small number of equipped aircraft and the differences between how flight operations are described in the ADS-B Benefits Basis of Estimate versus those at PHL.
• Ensure that flights on which the applications were used can be identified by using more than one set of data and data sources.
• Protect any data or information considered sensitive by the project participants (e.g., FOQA data for US Airline Pilots Association (USAPA)).
• Collect data that supports performance analysis of ADS-B Out and the ADS-B In applications, as needed.
Page 20

FAA / AAL / ACSS NextGen Project CAVS Benefits Analysis Report
5 BENEFITS ANALYSIS
5.1 General Benefits Analysis Process A major goal of the project is to determine and evaluate the benefits associated with each phase. The general approach includes identifying the desired new capability or procedure, determining required changes to the current operations, identifying the underlying metrics, and estimating and/or measuring the resulting benefits. See Figure 5-1 for process summary.
Figure 5-1. General Benefits Analysis Process
Once the metrics were identified the project determined the best methods by which to measure each metric and the potential sources of the data needed for each metric. The project then focused on a handful of measurement methods based on the availability of data, and performed the required analysis.
5.2 Benefits Metrics The benefits of CAVS are expected to be derived by flight crews being able to maintain a visual approach in marginal conditions such as deteriorating weather conditions or conditions in which a flight crew’s visibility is impaired by bright sunlight, haze or nighttime operations. Also, flight crews using new cockpit technologies, like the CDTI, can perform more efficient visual approaches while maintaining current safety standards. With the proper data, the resulting improvements may be measured in reduced flight time, fuel burn, and carbon emissions. These operational improvements may also be measured in a reduction in delays or overall delay times and perhaps in terms of increases in airport capacity.
This project focused on measuring improvements related to flight time, or time flown. One analysis measured the change in the interval of time between consecutive flights at the arrival runways. The other analyses measured the change in time flown from a fixed distance to the end of the arrival runway and the change in time flown from a fix on the arrival path to the end of the arrival runway. The change in distance flown was also measured with the results captured in Appendix G.
5.3 Benefits Data and Data Sources Analysis of CAVS performance required the use of several data sources, depending on the analysis required. Data sources included Enhanced Traffic Management System, Compliance Monitor, Aviation System Performance Metrics, Flight Crew Comments Sheets, SafeRoute, and Flight Operations Quality Assurance.
5.3.1 Enhanced Traffic Management System (ETMS) ETMS data is maintained by the FAA and contains track data for specific flights such as altitude, latitude, longitude, and time. ETMS data was used to determine the time between consecutive arrivals at PHL and the time / distance flown from a 25nm radius to PHL.
Page 21

FAA / AAL / ACSS NextGen Project CAVS Benefits Analysis Report
5.3.2 Compliance Monitor (CM) CM data consists of various flight parameters captured by the FAA’s ADS-B system including date, time of arrival (into PHL), aircraft ICAO address, aircraft ID, and several parameters at various points on the flight path such as time, aircraft latitude and longitude. CM data was used when measuring the time and distance flown by American Airlines A330s between fixes on their arrival paths and the runway.
5.3.3 Aviation System Performance Metrics (ASPM) FAA’s ASPM database contains weather data, airport arrival and departure rates (at 15-minute intervals), airport runway configurations, delays, cancellations and arrival/departure rates. ASPM data was used for selecting arrivals in ETMS based on the weather conditions at PHL (e.g., VMC, MMC). ASPM data was also used to determine the weather conditions at PHL for flights contained in the Compliance Monitor data.
5.3.4 Flight Crew Comments Sheets Flight crew comments sheets were available for flight crews to provide feedback on the use of the CDTI and CAVS. They were originally intended to be the primary means of identifying flights during which a flight crew member used CAVS so those flights could be identified in the CM data.
5.3.5 SafeRoute ACSS SafeRoute6 data was also used for identifying flights on which CAVS was potentially performed. SafeRoute data are parameters recorded by the Traffic Alert Collision and Avoidance System (TCAS) surveillance processor including parameters related to surrounding ADS-B traffic, the host aircraft and the SafeRoute applications.
5.3.6 Flight Operations Quality Assurance (FOQA) American Airlines’ Flight Operations Quality Assurance (FOQA) was initially utilized, but was discarded in favor of the Compliance Monitor data as the CM data contained fewer errors and was easier to correlate with weather conditions than the FOQA data.
5.4 Data Analysis Periods and Methodologies There are a handful of dates and timeframes that determine how the various data are categorized.
• New PHL RNAV arrivals were issued effective June 1, 2012, changing the arrival patterns into PHL. Therefore, data collected June 1, 2012 through September 30, 2015 was used in the analysis.
• CAVS flight operations began on May 20, 2014. • Per the terms of their agreement with the FAA, American Airlines equipped twenty of
twenty-four A330s between July 2013 and May 2015.
6 SafeRouteTM refers to ACSS’ suite of ADS-B In applications that includes CAVS, M&S, Surface Area Movement Management (SAMM), and In-Trail Procedures (ITP).
Page 22

FAA / AAL / ACSS NextGen Project CAVS Benefits Analysis Report
Analyses using ETMS data do not differentiate between aircraft equipped with CAVS and aircraft not equipped with CAVS, using arrival data from non-AAL flights and from flights of AAL aircraft not equipped with CAVS. Therefore, all arrivals performed between June 1, 2012 and May 31, 2014 are categorized in the “Pre-CAVS” time period while the remaining are categorized as being in the “CAVS” time period. Reference sections 1.3.1and 1.3.2.
Analyses using CM data uses data only from AAL A330s and they do differentiate between AAL A330s equipped with CAVS and AAL A330s not equipped with CAVS. Therefore, arrivals performed before May 20, 2014 by any AAL A330, CAVS-equipped and not CAVS-equipped, are categorized as Non-CAVS Flight Ops. Arrivals performed on May 20, 2014 or later by any AAL A330 not equipped with CAVS are also categorized as Non-CAVS Flight Ops. Arrivals performed on May 20, 2014 or later by CAVS-equipped aircraft are categorized as CAVS Flight Ops. Figure 5-2 shows the Non-CAVS Flight Ops period, CAVS equipage date, and the CAVS Flight Ops period for each of AAL A330 aircraft.
Figure 5-2. CM Data Analysis Periods
Each analysis used data from flights that arrived during the peak arrival period at PHL of 12:45 – 18:45 local time, only. Each analysis looked for improvements in each metric under different weather conditions (e.g., VMC, MMC).
Because a majority of the data was not Gaussian (i.e., normally distributed) a Mann-Whitney test was performed for determining if the results were statistically significant.
Page 23
FAA / AAL / ACSS NextGen Project CAVS Benefits Analysis Report
5.5 Situational Awareness Benefits Review Unlike CAVS, no measurable benefits were anticipated during the Situation Awareness phase. This assumption was confirmed by a preliminary review comparing the data from three different periods: Pre-CDTI install, Post-CDTI install, and CAVS. The three time periods are equivalent to the time before CAVS Equipage, the time between CAVS Equipage and before CAVS Flight Ops, and the time after CAVS Flight Ops, respectively, in Figure 5-2. This review (not shown) indicated no improvements between the Pre-CDTI install and Post-CDTI install periods. Improvements were found between the Pre-CDTI install and CAVS periods however a comprehensive analysis could not be performed between the periods of concern as there was not enough data in each period for the comparative analyses.
5.6 CAVS Queuing Model Benefits Estimate CAVS benefits at PHL were originally estimated with the queuing model used in the SBS Benefits Basis of Estimate [1] to be used as a “target” for comparison. However, the queuing model was not used in the analysis reported here because several of the model assumptions were too different for the results to be relevant (e.g., ADS-B equipage rates are lower than anticipated, CAVS installs were delayed, CAVS usage was not routine).
In the future, an updated queuing model, more aligned with current conditions, may prove to be valuable.
5.7 CAVS Benefits Analysis Benefits analysis consisted of three analysis types: 1) Time Between Consecutive Arrivals, 2) Time/Distance Flown from 25nm Radius to Runway, and 3) Fix-to-Runway.
The analyses looked for an improvement in time flown based on time periods (e.g., before and after CAVS flight operations began) and/or aircraft equipage (e.g., CAVS equipped and not CAVS equipped), depending on the analysis. Although most analyses also calculated the change in distance flown, the report focuses on changes in time flown as a time savings is much more easily translated into an improvement in operational efficiency versus an improvement in distance flown.
Each analysis used data from flights that arrived during the peak arrival period at PHL of 12:45 – 18:45 local time. Each analysis looked for improvements in each metric under weather conditions in which CAVS might be of most use (e.g., IMC, MMC, deteriorating weather). Analysis was also conducted using flights arriving in Visual Meteorological Conditions (VMC).
Comparisons of less than 10 data points were discarded due to the inherent variability found in the flight paths as a result of ATC intervention (directs, etc.). Mann-Whitney tests were performed on the remaining results to determine if outcomes were “statistically significant” (probability that the result is from a random occurrence is less than 5%) or “approaching significance” (probability that the result is from a random occurrence is between 5-10%).
Page 24

FAA / AAL / ACSS NextGen Project CAVS Benefits Analysis Report
5.7.1 Time Between Consecutive Arrivals ASPM data was used to identify blocks of time in which the weather was either VMC or MMC during the peak period of 12:45-18:45 local time. The average time between arrival aircraft to the runway was calculated using FAA ETMS data from flights arriving in those blocks of time. This resulted in data covering 274 hours over 65 days, or approximately 9,400 data points (i.e., pairs of PHL arrivals) from June 2012 -– Sept 2015. The data points are distributed into Pre-CAVS (June 2012 – Apr 2014) and CAVS (May 2014 – Sep 2015) and are classified by the weather (VMC or MMC).
The analysis focused on runways 9L, 9R, 27L, and 27R (see Appendix H); however, 9L is not included in the results because of the limited number of flights. Approximately 1,200 data points were excluded by eliminating consecutive arrival pairs whose spacing was greater than 4 minutes 26 seconds7 accounting for instances where CAVS would have no impact. See Table 7 for the distribution of arrival pairs.
Table 7. Number of PHL Arrival Pairs Used in Analysis: By Period and Weather Conditions
Flights Weather Pre-CAVS CAVS All VMC 2,777 2,443 All MMC 1,872 987 AAL A330s MMC 114 76 Non-AAL A330s MMC 1,758 911
Table 8 contains the statistically significant results for all flights in each weather condition / runway combination (if available) in the Pre-CAVS versus CAVS comparison. There were no statistically significant results when comparing time between arrivals for AAL A330 in MMC weather. See Appendix G for complete test results.
Table 8. Average Time Between Arrivals For All Flights in VMC and MMC
Pre-CAVS CAVS Difference (Positive = Improvement)
Statistically Significant?
Flights Weather Runway Data Points
Avg Flight Time (mm:ss)
Data Points
Avg Flight Time (mm:ss)
Avg Flight Time (mm:ss)
Avg Flight Time (%) Avg Flight Time
All MMC 27L 18 3:02 17 2:21 00:41 22.5% Y All MMC 09R 1437 1:58 630 1:52 00:06 5.1% Y
As is evident from the table, the average time between arrivals decreased between the Pre-CAVS and CAVS periods for runways 27L and 09R during MMC. In fact, the time between arrivals also improved for runway 27R during MMC (not shown above) although the results were not statistically significant at 95% significance level.
Table 9 contains the statistically significant results when comparing the time between arrivals for Non-AAL A330 flights and AAL A330 flights in the CAVS time period.
7 Assumes a 10nm separation at 135 knots.
Page 25

FAA / AAL / ACSS NextGen Project CAVS Benefits Analysis Report
Table 9. Average Time Between Arrivals: Non-AAL A330s vs. AAL A330s in MMC
Non-AAL A330s AAL A330s Difference (Positive = Improvement)
Statistically Significant?
Time Period Weather Runway Data
Points Avg Flight Time
(mm:ss) Data
Points Avg Flight Time
(mm:ss) Avg Flight Time
(mm:ss) Avg Flight Time (%) Avg Flight Time
CAVS MMC 09R 579 1:51 61 2:04 (00:13) (11.7%) Y
Time flown for AAL A330 flights showed a statistically significant decline over all other flights in the CAVS Flight Ops period in MMC weather at runway 09R.
5.7.2 Time / Distance Flown from 25nm Radius to Runway Similar to an estimating method used by the Surveillance and Broadcast Services (SBS) Benefits Basis of Estimate, the same ETMS data was used to calculate the average time flown and distance flown from a 25nm radius to a single point at PHL. Again, the analysis focused on runways 9L, 9R, 27L, and 27R (however 9L is not included because of lack of flights) during peak traffic periods and the results are categorized based on weather conditions at the time as well as the direction from which the flight is approaching PHL (East or West). The analysis included three comparisons: (1) flights of all operators between the two time periods, (2) flights of AAL A330s between the two time periods, and (3) flights of all operators to AAL A330s during the CAVS Flight Ops period, only (see Table 3 and Table 4). To reduce clutter the following tables contain results for Time Flown, only. See Appendix G for complete test results.
Per Table 10 the time flown by all operators in VMC was not improved in any direction / runway combination and improved at three of five direction / runway combinations in MMC.
Table 10. Time Flown from 25nm Radius to Runway for All Flights: VMC and MMC
Pre-CAVS CAVS Difference (Positive = Improvement)
Statistically Significant?
Weather Direction & Runway
Data Points
Avg Flight Time (mm:ss)
Data Points
Avg Flight Time (mm:ss)
Avg Flight Time (mm:ss)
Avg Flight Time (%) Avg Flight Time
VMC West 27R 910 16:52 875 17:02 (00:11) (1.0%) Y VMC East 09R 295 15:04 114 15:23 (00:19) (2.1%) Y VMC West 09R 343 12:29 116 14:00 (01:31) (12.2%) Y MMC East 27L 41 10:44 31 08:58 01:46 16.4% Y MMC East 27R 259 16:53 220 15:04 01:49 10.8% Y MMC West 27R 182 17:40 154 16:51 00:49 4.6% N* MMC East 09R 792 16:12 373 17:12 (01:00) (6.2%) Y MMC West 09R 704 14:38 279 15:41 (01:03) (7.2%) Y
* Approaching Significance
There were no statistically significant improvements when comparing the time flown of AAL A330s flights during the Pre-CAVS period and CAVS period. However, for AAL A330s arrivals at East 27R in MMC, the difference in time flown was positive and approached statistical significance. See
Page 26

FAA / AAL / ACSS NextGen Project CAVS Benefits Analysis Report
Table 11.
Page 27

FAA / AAL / ACSS NextGen Project CAVS Benefits Analysis Report
Table 11. Time Flown from 25nm Radius to Runway for AAL A330s: VMC and MMC
Pre-CAVS CAVS Difference (Positive = Improvement)
Statistically Significant?
Weather Direction & Runway
Data Points
Avg Flight Time (mm:ss)
Data Points
Avg Flight Time (mm:ss)
Avg Flight Time (mm:ss)
Avg Flight Time (%) Avg Flight Time
MMC East 27R 31 16:14 25 13:05 03:09 19.4% N* * Approaching Significance
Time flown for AAL A330 flights showed statistically significant improvement over all other flights in the CAVS Flight Ops period, both in VMC and MMC weather.
Table 12 summarizes the statistically significant findings.
Table 12. Time Flown from 25nm Radius to Runway CAVS: Non-AAL A330s vs. AAL A330s in VMC and MMC
Non-AAL A330s AAL A330s Difference (Positive = Improvement)
Statistically Significant?
Weather Direction & Runway
Data Points
Avg Flight Time (mm:ss)
Data Points
Avg Flight Time (mm:ss)
Avg Flight Time (mm:ss)
Avg Flight Time (%) Avg Flight Time
VMC East 27R 1226 13:42 148 12:49 00:52 6.4% Y VMC West 27R 850 17:06 25 14:59 02:07 12.4% Y MMC East 27R 195 15:19 25 13:05 02:14 14.6% Y
5.7.3 Fix-to-Runway Analysis Using CM data, two sets of analysis on approximately 12,800 American Airline A330 flights were performed on arrivals into PHL: Non-CAVS Flight Ops vs. CAVS Flight Ops and AAL non-coupled vs. AAL-coupled below 9000'. Flights with holding patterns or delay vectors were removed from the analysis as CAVS would not reduce their usage and they were considered outliers. Only flights that arrived during the peak period of 12:45 – 18:45 local time were used in the analysis. Each analysis examined the average time and distances from various approach fixes to various runways. Based on the available data the analysis focused specifically on the following fix-to-runway pairs in their respective RNAV arrivals (see Appendix I for approach charts):
• JIIMS TWO o CHEAZ-09R, STAYK-09R, PSOUT-27R, WOJIK-27R
• BOJID ONE o EXPRS-09R, KYILL-09R, EYRIE-27R, and HIFAL-27R
In addition, the arrivals in PHL were further divided between two approach directions: East and West. East refers to flights primarily coming from the east, heading north towards PHL (see Figure 5-3). West refers to flights primarily coming from the west, heading south towards PHL (see Figure 5-4).
Page 28

FAA / AAL / ACSS NextGen Project CAVS Benefits Analysis Report
Figure 5-3. Example of the "East" Approaches on JIIMS Arrival to 27R
Page 29

FAA / AAL / ACSS NextGen Project CAVS Benefits Analysis Report
Figure 5-4. Example of the "West" Approaches on BOJID Arrival to 27R
5.7.3.1 Non-CAVS Flight Ops vs. CAVS Flight Ops
The average time and distance were calculated from selected fix-to-runway scenarios in various ceiling and visibility weather conditions at PHL to determine if potential benefits were apparent when comparing Non-CAVS Flight Ops to the CAVS Flight Ops. Each fix-to-runway analysis was run through three weather conditions, VMC, MMC and IMC, as well as through various weather scenarios where ceiling and visibility were adjusted. The resulting differences (positive and negative) between the Non-CAVS Flight Ops period and CAVS Flight Ops period were then tabulated. Figure 5-5 shows the distribution of flights in the analysis based on Non-CAVS Flights Ops, CAVS Flight Ops and weather condition (VMC, MMC, IMC).
Page 30

FAA / AAL / ACSS NextGen Project CAVS Benefits Analysis Report
Figure 5-5. Flights Used in Analysis
Comparisons of less than 10 data points were discarded due to the inherent variability found in the flight paths as a result of ATC intervention (directs, etc.). Mann-Whitney tests were performed on the remaining results to determine if outcomes were “statistically significant” (probability that the result is from a random occurrence is less than 5%) or “approaching significance” (probability that the result is from a random occurrence is between 5-10%). To reduce clutter the following tables contain results for Time Flown only. See Appendix G for complete test results for Time Flown and Distance Flown.
In VMC weather EXPRS-09R, KYILL-09R and EYRIE-27R were found to have worsening results from the Non-CAVS Flight Ops to the CAVS Flight Ops case. However, in MMC and IMC weather CHEAZ-09R and WOJIK-27R, respectively, showed positive results. Note that the latter two were “approaching significance” (see Table 13).
Table 13. Non-CAVS Flight Ops vs. CAVS Flight Ops: VMC, MMC and IMC
Non-CAVS Flight Ops CAVS Flight Ops Difference (Positive = Improvement)
Statistically Significant?
Weather Fix Pair Data Points
Avg Flight Time (mm:ss)
Data Points
Avg Flight Time (mm:ss)
Avg Flight Time (mm:ss)
Avg Flight Time (%) Avg Flight Time
MMC CHEAZ-09R 57 10:39 31 09:46 00:53 8.3% N* IMC WOJIK-27R 46 13:04 57 12:16 00:48 6.1% N* VMC EXPRS-09R 73 07:39 62 08:41 (01:02) (13.4%) Y VMC KYILL-09R 41 10:06 39 11:39 (01:33) (15.3%) Y VMC EYRIE-27R 401 08:19 207 08:48 (00:29) (5.7%) Y
*Approaching significance
In deteriorating weather conditions all statistically significant and approaching significance results were positive, indicating an improvement from the Non-CAVS Flight Ops to the CAVS Flight Ops case (see Table 14).
Flights Kept in Analysis 12,805
Flights Arrived During Peak
8,507
Non-CAVS Flight Ops
4,895
VMC 3,627
MMC 118
IMC 483
CAVS Flight Ops
3,612
VMC 2,861
MMC 100
IMC 369
Page 31

FAA / AAL / ACSS NextGen Project CAVS Benefits Analysis Report
Table 14. Non-CAVS Flight Ops vs. CAVS Flight Ops: Deteriorating Weather Conditions
Non-CAVS Flight Ops CAVS Flight Ops Difference
(Positive = Improvement) Statistically Significant?
Ceiling Visibility Fix Pair Data Points
Avg Flight Time (mm:ss)
Data Points
Avg Flight Time (mm:ss)
Avg Flight Time (mm:ss)
Avg Flight Time (%) Avg Flight Time
<=2200 All WOJIK-27R 45 13:04 49 12:09 00:55 7.0% Y <=3000 <=5 WOJIK-27R 32 13:14 24 12:01 01:12 9.1% N* <=6000 All HIFAL-27R 46 11:30 22 10:09 01:22 11.9% Y
*Approaching significance
5.7.3.2 Not CAVS+Coupled below 9000' vs. CAVS+Coupled below 9000'
This analysis uses SafeRoute data to identify flights where CAVS was “coupled” on the SafeRoute application page and the coupling included altitudes below 9000'. Coupled flights only occurred for AAL PHL arrivals after CAVS flight operations began on May 20, 2014. These flights are compared to all other AAL A330 flights flown after May 20, 2014 for which SafeRoute data was available, or those not-coupled below 9000'. Note that the Not CAVS+Coupled below 9000' category contains flights designated as CAVS and coupled only above 9000', flights designated as M&S, and flights that were not coupled at all. Figure 5-6 shows the distribution of flights in the analysis for which SafeRoute data available, those that were during CAVS flight operations and kept in analysis, those that arrived during the peak period, and their coupled status.
Figure 5-6. Flights Used for CAVS Proxy
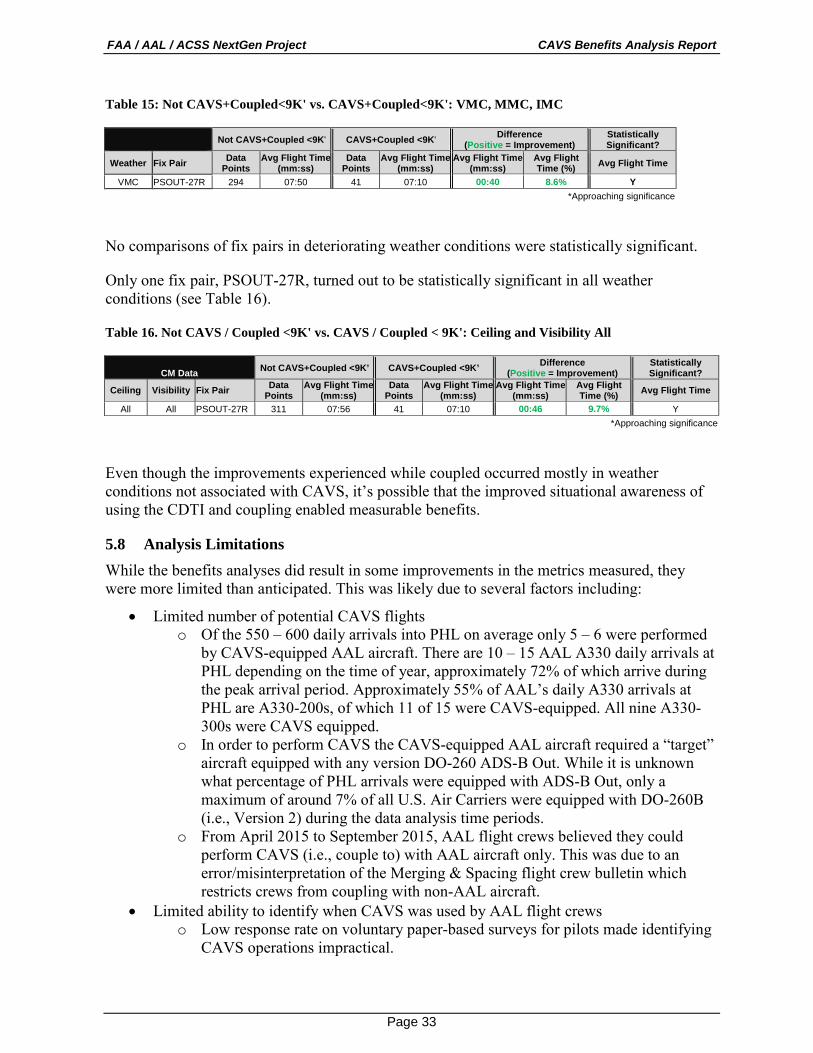
When comparing Not CAVS+Coupled <9K' to CAVS+Coupled <9K' in VMC, MMC and IMC, only one fix pair was statistically significant; PSOUT-27R was positive in VMC (see Table 15). Very few arrivals in CAVS Flight Ops were identified as coupled below 9000' (2% - 3%), reducing the likelihood of having sufficient data for comparisons in MMC or IMC, which occur less often than VMC.
Flights with SafeRoute Data
1,472
Flights Kept in Analysis
1,338
Flights Arrived During Peak
904
Not CAVS+Coupled<9K'
819
VMC 733
MMC 24
IMC 62
CAVS+Coupled<9K'
85
VMC 78
MMC 1
IMC 6
Page 32
FAA / AAL / ACSS NextGen Project CAVS Benefits Analysis Report
Table 15: Not CAVS+Coupled<9K' vs. CAVS+Coupled<9K': VMC, MMC, IMC
Not CAVS+Coupled <9K' CAVS+Coupled <9K' Difference (Positive = Improvement)
Statistically Significant?
Weather Fix Pair Data Points
Avg Flight Time (mm:ss)
Data Points
Avg Flight Time (mm:ss)
Avg Flight Time (mm:ss)
Avg Flight Time (%) Avg Flight Time
VMC PSOUT-27R 294 07:50 41 07:10 00:40 8.6% Y *Approaching significance
No comparisons of fix pairs in deteriorating weather conditions were statistically significant.
Only one fix pair, PSOUT-27R, turned out to be statistically significant in all weather conditions (see Table 16).
Table 16. Not CAVS / Coupled <9K' vs. CAVS / Coupled < 9K': Ceiling and Visibility All
CM Data Not CAVS+Coupled <9K’ CAVS+Coupled <9K’ Difference (Positive = Improvement)
Statistically Significant?
Ceiling Visibility Fix Pair Data Points
Avg Flight Time (mm:ss)
Data Points
Avg Flight Time (mm:ss)
Avg Flight Time (mm:ss)
Avg Flight Time (%) Avg Flight Time
All All PSOUT-27R 311 07:56 41 07:10 00:46 9.7% Y *Approaching significance
Even though the improvements experienced while coupled occurred mostly in weather conditions not associated with CAVS, it’s possible that the improved situational awareness of using the CDTI and coupling enabled measurable benefits.
5.8 Analysis Limitations While the benefits analyses did result in some improvements in the metrics measured, they were more limited than anticipated. This was likely due to several factors including:
• Limited number of potential CAVS flights o Of the 550 – 600 daily arrivals into PHL on average only 5 – 6 were performed
by CAVS-equipped AAL aircraft. There are 10 – 15 AAL A330 daily arrivals at PHL depending on the time of year, approximately 72% of which arrive during the peak arrival period. Approximately 55% of AAL’s daily A330 arrivals at PHL are A330-200s, of which 11 of 15 were CAVS-equipped. All nine A330-300s were CAVS equipped.
o In order to perform CAVS the CAVS-equipped AAL aircraft required a “target” aircraft equipped with any version DO-260 ADS-B Out. While it is unknown what percentage of PHL arrivals were equipped with ADS-B Out, only a maximum of around 7% of all U.S. Air Carriers were equipped with DO-260B (i.e., Version 2) during the data analysis time periods.
o From April 2015 to September 2015, AAL flight crews believed they could perform CAVS (i.e., couple to) with AAL aircraft only. This was due to an error/misinterpretation of the Merging & Spacing flight crew bulletin which restricts crews from coupling with non-AAL aircraft.
• Limited ability to identify when CAVS was used by AAL flight crews o Low response rate on voluntary paper-based surveys for pilots made identifying
CAVS operations impractical.
Page 33
FAA / AAL / ACSS NextGen Project CAVS Benefits Analysis Report
o SafeRoute data was available on approximately 25% of the flights in the CAVS Flight Ops period. Of those, approximately 85 flights were identified as potential CAVS flights (i.e., coupled below 9000') during the peak arrival period. The amount of SafeRoute data collected was limited due to the collection process not fully starting until after CAVS flight operations began as well as some of the SafeRoute data being overwritten when the compact flash cards remained on an aircraft too long.
• The American Airlines/US Airways merger, which became effective on March 27, 2013, may have been a “distraction” to performing CAVS operations
o Crew contracts were renegotiated o Management priorities may have been refocused
• The Time / Distance Flown from 25nm Radius to the Runway analysis does not differentiate between aircraft equipped with CAVS and aircraft not equipped with CAVS. Therefore, all AAL A330s (not just equipped aircraft) were used in the CAVS time period. This could lead to underestimating the impact of CAVS.
Page 34

FAA / AAL / ACSS NextGen Project CAVS Benefits Analysis Report
Appendix A. Reference Documents [1] Surveillance and Broadcast Services Benefits Basis of Estimate, August 2007, FAA
[2] Phasing Plan and Operational Description for Interval Management into PHL, Version 1.0, October 16, 2009, FAA
[3] CAVS Application Description, Version 1.0, June 19, 2012, American Airlines
[4] Merging and Spacing (M&S) Familiarization into PHL Application Description, Version 3.0, July 13, 2012, FAA
[5] Human Factors Considerations for Cockpit Display of Traffic Information (CDTI) – Assisted Visual Separation (CAVS), January 8, 2015, USDOT Volpe National Transportation Systems Center
[6] Data Collection and Benefits Analysis Plan, July 22, 2013, FAA
Page 35

FAA / AAL / ACSS NextGen Project CAVS Benefits Analysis Report
Appendix B. Glossary
Couple A function in the CAVS application. When performing CAVS, the flight crew of the CAVS-equipped aircraft “couples” to the aircraft it is following (i.e., preceding aircraft) so that the onboard system displays information needed for the CAVS procedure including the preceding aircraft flight ID, differential ground speed of the two aircraft, and the distance to the preceding aircraft. DO-317B, Minimum Operational Performance Standards (MOPS) for Aircraft Surveillance Applications (ASA) System, refers to the preceding aircraft as designated traffic when performing CAVS.
Delay Vector A method used by air traffic controllers to space and sequence flights to the arrival runway in congested airspace. In this analysis these took the form of “loops” in the arrival aircraft’s flight path.
Deteriorating Weather Conditions
For the purpose of this report, meteorological conditions expressed in terms of visibility and ceiling where visibility varies between 3 – 7 statute miles and ceiling varies between 2000 – 6000 feet AGL.
Instrument Meteorological Conditions (IMC)
The meteorological conditions expressed in terms of visibility, distance from cloud, and ceiling, less than the minima specified for visual meteorological conditions (VMC). For these analyses IMC conditions are visibility less than 5 statute miles or ceiling less than 2000 feet.
Marginal Meteorological Conditions (MMC)
The meteorological conditions expressed in terms of visibility, distance from cloud, and ceiling in which use of the CDTI for situational awareness or the use of CAVS may increase visual approaches. For these analyses MMC conditions are visibility greater than or equal to 5 statute miles and ceiling greater than or equal to 2000 feet or less than 3000 feet.
Peak Arrival Period The period of time during which arrivals into Philadelphia International Airport (PHL) are at their highest levels. For these analyses peak arrival period is 1245 to 1845 local time.
Visual Meteorological Conditions (VMC)
The meteorological conditions expressed in terms of visibility, distance from cloud, and ceiling equal to or better than specified minima. For these analyses VMC conditions are visibility greater than or equal to 5 statute miles and ceiling greater than or equal 3000 feet.
Page 36

FAA / AAL / ACSS NextGen Project CAVS Benefits Analysis Report
Appendix C. Abbreviations AAL American Airlines ADS-B Automatic Dependent Surveillance – Broadcast AGL Above Ground Level APA Allied Pilots Association ASA Aircraft Surveillance Applications ASG Assigned Spacing Goal ASPM Aviation System Performance Metrics ATC Air Traffic Control CAVS CDTI Assisted Visual Separation CDTI Cockpit Display of Traffic Information CM Compliance Monitor ETMS Enhanced Traffic Management System FAA Federal Aviation Administration FOQA Flight Operations Quality Assurance ICAO International Civil Aviation Organization IMC Instrument Meteorological Conditions ITP In-Trail Procedure M&S Merging and Spacing MMC Marginal Meteorological Conditions MOPS Minimum Operational Performance Standards NAS National Airspace System NextGen Next Generation Air Transportation System PHL Philadelphia International Airport SAMM Surface Area Movement Management SBS Surveillance and Broadcast Services sm statute miles SRMD Safety Risk Management Document TCAS Traffic Alert and Collision Avoidance System TTF Traffic To Follow USAPA US Airline Pilots Association VMC Visual Meteorological Conditions
Page 37

FAA / AAL / ACSS NextGen Project CAVS Benefits Analysis Report
Appendix D. Flight Crew Comment Sheet Note: The Flight Crew Comment Sheet also contains questions on the ADS-B In application In-Trail Procedures (ITP). ITP is outside the scope of the Project, but was included in an effort to consolidate the comment sheets of separate American Airlines projects.
US AIRWAYS TRAFFIC DISPLAY (CDTI) PILOT DEBRIEF FORM (VERSION 0.22) This questionnaire supports data collection on the use of CDTI and associated procedures. Your cooperation in filling out this form after each flight will assist evaluation and improvement of the equipment, procedure, and training. The information contained herein will not be released to the public in a manner which allows the identification of US Airways’ flight crews.
Date (DD/MM/YY): _____/ _____/_____ Flight Number: ____________ Aircraft: A330-200 A330-300 Number of flights you have used CDTI: ______________
General use of the CDTI 1. How often did you use the CDTI during the flight?
Never Rarely Sometimes Often Very often
2. During what phase of flight did you use the CDTI? (check all that apply) Taxi Departure En route Approach Arrival
3. How did the CDTI impact your traffic situational awareness?
Very negatively Slightly negatively No change Slightly positively Very positively
Comments (specify possible influencing factors, e.g., visual conditions, airport runway configuration, traffic density, partial display of surrounding traffic): ________________________________________________________________________________________________________________________________________________________________________
4. How did the CDTI impact the flight operations? (e.g., safety, awareness of flight level changes, etc.) Very negatively Slightly negatively No change Slightly positively Very positively
Comments: ____________________________________________________________________________________ ____________________________________________________________________________________
5. How did the CDTI impact your workload? (specify possible influencing factors, e.g., phase of flight, weather
conditions, partial display of surrounding traffic, airspace characteristics, traffic density, etc.) Very negatively Slightly negatively No change Slightly positively Very positively
Comments: ____________________________________________________________________________________ ____________________________________________________________________________________
6. Information provided by the CDTI was consistent with ATC and visual information.
Strongly disagree Disagree Neutral Agree Strongly agree Comments: ____________________________________________________________________________________ ____________________________________________________________________________________
7. Did you ask ATC for information based on the CDTI? YES NO
Each Pilot: Please place a completed form in the FDML. Maintenance: COMAIL to Ron Thomas PHX-FTC-FSS.
Page 38

FAA / AAL / ACSS NextGen Project CAVS Benefits Analysis Report
If YES, what (e.g., clearance request, information on traffic, etc.): ________________________________________________________________________________________________________________________________________________________________________
8. Was the CDTI easy to interpret and use? (e.g., displayed information, traffic selection/highlighting, display setting)
Easy Manageable, but could be improved Difficult
Comments: ____________________________________________________________________________________ ____________________________________________________________________________________
9. Did you experience any problems while using the CDTI? YES NO
Comments (description of condition/problem): _____________________________________________________________________________________ _____________________________________________________________________________________
10. Please provide any additional benefits or concerns regarding the CDTI and its use:
______________________________________________________________________________________________________________________________________________________________________________
In-Trail Procedure (ITP) -- skip any questions that are not applicable 11. Was an ITP requested?
YES NO (Reason: _____________________________________________________)
12. If YES, why? (check all that apply) Altitude change based on the Operational Flight Plan More fuel-efficient flight level Weather (e.g., turbulence or thunderstorms) Other ________________________________________________________________________________
13. Was the ITP request approved?
YES NO
If YES, how long did it take to receive the ITP clearance once requested? Less than 2 minutes Between 2 and 5 minutes Greater than 5 minutes
If NO, was it clear to you why the ITP request was not approved? NO YES (If YES, why: ___________________________________________)
Comments: ________________________________________________________________________________________________________________________________________________________________________________________ 14. Please rate the difficulty/ease of identifying ITP opportunities:
Easy Manageable, but could be improved Difficult Didn’t try 15. Please rate the difficulty/ease of CPDLC communication with ATC about the ITP:
Easy Manageable, but could be improved Difficult Didn’t try
16. Please rate the difficulty/ease of executing the flight level change on the CDTI: Easy Manageable, but could be improved Difficult Didn’t try
17. Please describe the nature of any difficulties with identifying ITP opportunities, communicating with ATC
about the ITP, executing the flight level change or any other problems experienced. ______________________________________________________________________________________________________________________________________________________________________________
Page 39

FAA / AAL / ACSS NextGen Project CAVS Benefits Analysis Report
18. Any other general comments/concerns on the ITP (including training, CRM)? _______________________________________________________________________________________ _______________________________________________________________________________________
Surface Area Movement Manager (SAMM) 19. Airport(s) (4-letter ICAO ID) where SAMM was used: KPHL KCLT Other:_____ 20. Your position: Captain (PF) First Officer (PM) 21. Was surface moving map available? YES NO
22. Conditions? Day VMC Day IMC Night IMC 23. How familiar were you with the taxi route? Not familiar Somewhat familiar Very familiar 24. How often did you refer to the surface moving map display? Not much Somewhat Frequently
25. How did SAMM impact your taxi/traffic situational awareness?
Very negatively Slightly negatively No change Slightly positively Very positively Comments: ______________________________________________________________________________________________________________________________________________________________________________
26. How did SAMM impact your workload? (specify possible influencing factors, e.g., weather conditions, partial display of surrounding traffic, traffic density, etc.) Very negatively Slightly negatively No change Slightly positively Very positively
27. Please note any errors seen and/or any other general comments/concerns using SAMM during taxi. ______________________________________________________________________________________________________________________________________________________________________________
Page 40

FAA / AAL / ACSS NextGen Project CAVS Benefits Analysis Report
Appendix E. Pilot Survey Summaries
Question 1
Question 2
Never Rarely Sometimes Often Very oftenRating
AverageResponse
Count0 0 7 4 2 3.62 13
130
How often did you use the CDTI during the flight?
Answer Options
answered questionskipped question
Page 41

FAA / AAL / ACSS NextGen Project CAVS Benefits Analysis Report
Question 3
Very negatively
Slightly negatively
No changeSlightly
positivelyVery
positivelyRating
AverageResponse
Count0 0 0 4 8 4.67 12
312
1skipped question
How did the CDTI impact your traffic situational awareness?
Answer Options
Comments (specify possible influencing factors, e.g., visual conditions, airport runway configuration, traffic density, partial answered question
Number ResponseComments (specify possible influencing factors, e.g., visual conditions, airport runway configuration, traffic density, partial display of surrounding traffic):
1 Very positively Planning for climb on tracks.2 Very positively Taxi surrounding aircraft3 Slightly positively Position of screen not good for taxi use by capt.
Page 42

FAA / AAL / ACSS NextGen Project CAVS Benefits Analysis Report
Question 4
Question 5
Question 6
Very negatively
Slightly negatively
No changeSlightly
positivelyVery
positivelyRating
AverageResponse
Count0 0 0 6 7 4.54 13
113
0skipped question
How did the CDTI impact the flight operations?
Answer Options
Comments:answered question
Number Response Comments:
1 Slightly positively Got us a higher alt.
Very negatively
Slightly negatively
No changeSlightly
positivelyVery
positivelyRating
AverageResponse
Count0 1 10 1 1 3.15 13
113
0skipped question
How did the CDTI impact your workload?
Answer Options
Comments:answered question
Number Response Comments:
1 Slightly negatively More work, but not necessarily bad.
Strongly disagree
Disagree Neutral AgreeStrongly
agreeRating
AverageResponse
Count0 0 0 6 6 4.50 12
012
1skipped question
Information provided by the CDTI was consistent with ATC and visual information.
Answer Options
Comments:answered question
Page 43

FAA / AAL / ACSS NextGen Project CAVS Benefits Analysis Report
Question 7
Question 8
Response Percent
Response Count
50.0% 650.0% 6
612
1skipped question
No
Did you ask ATC for information based on the CDTI?
answered question
Yes
If YES, what (e.g., clearance request, information on traffic, etc.):
Answer Options
Number If YES, what (e.g., clearance request, information on traffic, etc.):1 Climb to 390 on track.2 Altitude change request
3Asked for ride reports of A/C on our route ahead of us - we could see their flight ID's and asked what kind of rides they were getting.
4 ITP Climb5 Requested alt change FL380 to FL400.6 Requested a ITP climb from F380 to 400. Worked great.
EasyManageable, but
could be improvedDifficult
Rating Average
Response Count
10 2 1 1.31 131
130skipped question
Was the CDTI easy to interpret and use?
Answer Options
Comments:answered question
Number Response Comments:
1 Difficult But I am new at this.
Page 44

FAA / AAL / ACSS NextGen Project CAVS Benefits Analysis Report
Question 9
Question 10
Response Percent
Response Count
15.4% 284.6% 11
213
0skipped question
No
Did you experience any problems while using the CDTI?
answered question
Yes
Comments (description of condition/problem):
Answer Options
Number Response Comments (description of condition/problem):1 Yes Location2 Yes Database out of date. Be nice to have up to date database.
Response Count
11
12
Please provide any additional benefits or concerns regarding the CDTI and its use:
Answer Options
answered questionskipped question
Number Response Text1 The position (mount) of the EFB unfortunately is very poor, and will undoubtedly limit pilot use/data collection - especially
for SAMM - during this study.
Page 45

FAA / AAL / ACSS NextGen Project CAVS Benefits Analysis Report
Appendix F. Data and Data Sources
Enhanced Traffic Management System (ETMS) Data Enhanced Traffic Management System Counts (ETMSC) is an FAA-maintained database designed to provide information on traffic counts by airport or by city pair for various data groupings such as aircraft type or by hour of the day. ETMSC source data are created when pilots file flight plans and/or when flights are detected by the National Airspace System (NAS), usually via RADAR. ETMSC data used in the benefits analysis include track data for specific flights such as altitude, latitude, longitude, and time.
Compliance Monitor (CM) Data Compliance Monitor is an FAA-maintained system which consists of various flight parameters captured by the FAA’s ADS-B system. This data includes date, time of arrival (into PHL), aircraft ICAO address, aircraft ID, and several parameters at various points on the flight path such as time, aircraft latitude and longitude.
Aviation System Performance Metrics (ASPM) Data ASPM is an FAA-maintained database. ASPM data falls into two categories: flight data containing information on individual flight performance and airport data containing information on airport efficiency. Data comes from ARINC’s Out-Off-On-In (OOOI), ETMS, US Department of Transportation’s Aviation’s Airline Service Quality Survey (ASQP), weather data, airport arrival and departure rates (15-minute interval), airport runway configurations, delays, cancellations and arrival/departure rates.
American Airlines Flight Operations Quality Assurance (FOQA) Data FOQA is a voluntary safety program designed to improve aviation safety through the proactive use of flight-recorded data. Data is used to identify and correct deficiencies in all areas of flight operations. FOQA data is comprised of various parameters such as the date, engine parameters, control input, fuel burn, speed, longitude, latitude, and surface positions. American Airlines’ Flight Operations Quality Assurance (FOQA) was initially utilized, but was discarded in favor of the Compliance Monitor data as the CM data contained fewer errors and was easier to correlate with weather conditions than the FOQA data.
Flight Crew Comment Sheets Flight crew comments sheets were provided to each flight crew of properly equipped A330 aircraft. The comment sheets asked specific questions regarding CDTI usage during each flight and flights during which CAVS was conducted. Questions included both objective (e.g., flight date, flight number) and subjective measures (e.g., ease of use, workload impact). The flight crew manually filled in the appropriate data on the comment sheet. See Appendix D for example comment sheet. Similar to FOQA data protections, flight crew comments sheets were de-identified prior to submitting to the FAA for analysis.
Page 46
FAA / AAL / ACSS NextGen Project CAVS Benefits Analysis Report
SafeRoute Data SafeRoute data refers to parameters recorded by the Traffic Alert Collision and Avoidance System (TCAS) surveillance processor including parameters related to surrounding ADS-B traffic, the host aircraft and the SafeRoute applications. SafeRoute data was used to identify flights on which CAVS was used, for generating the CAVS Parameters of Interest files and for supplementing the flight crew comment sheets by identifying the FOQA data file associated with each CAVS flight. Similarly, the same process was followed for M&S application data resulting in the generation of the M&S Parameter of Interest files. Parameters for CAVS and M&S include flight arrival date/time, ownship latitude, ownship longitude, aircraft speed, traffic latitude, traffic longitude, range to traffic, spacing interval, etc. Similar to FOQA data protections, SafeRoute data was de-identified prior to providing to the FAA.
Page 47

FAA / AAL / ACSS NextGen Project CAVS Benefits Analysis Report
Appendix G. Data Analysis Mann-Whitney Test Summaries Table 17. Average Time Between Arrivals in VMC and MMC
Pre-CAVS CAVS Difference
(Positive = Improvement) Statistically Significant?
Flights Weather Runway Data Points
Avg Flight Time (mm:ss)
Data Points
Avg Flight Time (mm:ss)
Avg Flight Time (mm:ss)
Avg Flight Time (%) Avg Flight Time
All VMC 27L 158 2:35 184 2:36 (00:01) (0.6%) N All VMC 27R 2009 2:02 2034 1:59 00:03 2.5% N All VMC 09R 610 1:55 225 1:56 (00:01) (0.9%) N All MMC 27L 18 3:02 17 2:21 00:41 22.5% Y All MMC 27R 417 2:02 340 1:59 00:03 2.5% N All MMC 09R 1437 1:58 630 1:52 00:06 5.1% Y
AAL A330s MMC 27R 32 2:01 25 2:13 (00:12) (9.90%) N AAL A330s MMC 09R 80 2:01 51 2:04 (00:03) (2.40%) N
*Approaching significance
Table 18. Average Time Between Arrivals: Non-AAL A330s vs. AAL A330s in MMC
Non-AAL A330s AAL A330s Difference (Positive = Improvement)
Statistically Significant?
Time Period Weather Runway Data
Points Avg Flight Time
(mm:ss) Data
Points Avg Flight Time
(mm:ss) Avg Flight Time
(mm:ss) Avg Flight Time (%) Avg Flight Time
CAVS MMC 09R 579 1:51 61 2:04 (00:13) (11.7%) Y CAVS MMC 27R 315 1:58 25 2:13 (00:15) (12.70%) N
*Approaching significance
Page 48

FAA / AAL / ACSS NextGen Project CAVS Benefits Analysis Report
Table 19. Time/Distance Flown from 25nm Radius to Runway: All Flights in VMC and MMC
Pre-CAVS CAVS Difference
(Positive = Improvement) Statistically Significant?
Weather Direction & Runway
Data Points
Avg Flight Time (mm:ss)
Avg Distance Flown (nm)
Data Points
Avg Flight Time (mm:ss)
Avg Distance Flown (nm)
Avg Flight Time (mm:ss)
Avg Distance Flown (nm)
Avg Flight Time
Avg Distance Flown
VMC East 27L 304 09:13 29.69 272 09:27 30.5 (00:14) (0.77) N N VMC West 27L 176 14:23 47.49 213 13:49 46.7 00:35 0.79 N N VMC East 27R 1308 13:34 45.01 1374 13:36 45.5 (00:02) (0.53) N N VMC West 27R 910 16:52 56.53 875 17:02 58.4 (00:11) (1.83) Y Y VMC East 09R 295 15:04 47.92 114 15:23 50.6 (00:19) (2.64) Y Y VMC West 09R 343 12:29 38.93 116 14:00 48.3 (01:31) (9.40) Y Y MMC East 27L 41 10:44 33.62 31 08:58 27.7 01:46 5.94 Y Y MMC West 27L 32 14:08 46.52 26 15:24 49.0 (01:16) (2.48) N N MMC East 27R 259 16:53 54.39 220 15:04 48.9 01:49 5.47 Y Y MMC West 27R 182 17:40 58.82 154 16:51 56.1 00:49 2.70 N* Y MMC East 09R 792 16:12 52.26 373 17:12 54.6 (01:00) (2.34) Y Y MMC West 09R 704 14:38 45.94 279 15:41 48.0 (01:03) (2.06) Y Y
*Approaching significance
Table 20. Time/Distance Flown from 25nm Radius to Runway: AAL A330s in VMC and MMC
Pre-CAVS CAVS Difference
(Positive = Improvement) Statistically Significant?
Weather Direction & Runway
Data Points
Avg Flight Time (mm:ss)
Avg Distance Flown (nm)
Data Points
Avg Flight Time (mm:ss)
Avg Distance Flown (nm)
Avg Flight Time (mm:ss)
Avg Distance Flown (nm)
Avg Flight Time
Avg Distance Flown
VMC East 27R 100 13:23 44.31 148 12:49 42.8 00:34 1.53 N N VMC West 27R 36 12:52 44.69 25 14:59 57.8 (02:07) (13.09) N N VMC East 09R 25 14:57 49.98 16 16:08 53.7 (01:10) (3.75) N N VMC West 09R 13 14:44 46.78 2 17:06 60.2 (02:21) (13.46) N N MMC East 27R 31 16:14 52.89 25 13:05 43.3 03:09 9.58 N* N MMC West 27R 5 14:05 48.28 5 12:15 43.6 01:50 4.65 N N MMC East 09R 75 16:58 56.09 50 16:08 54.2 00:50 1.87 N N
*Approaching significance
Table 21. Time/Distance Flown from 25nm Radius to Runway CAVS: Non-AAL A330s vs. AAL A330s in VMC and MMC
Non-AAL A330s AAL A330s Difference
(Positive = Improvement) Statistically Significant?
Weather Direction & Runway
Data Points
Avg Flight Time (mm:ss)
Avg Distance Flown (nm)
Data Points
Avg Flight Time (mm:ss)
Avg Distance Flown (nm)
Avg Flight Time (mm:ss)
Avg Distance Flown (nm)
Avg Flight Time
Avg Distance Flown
VMC East 27R 1226 13:42 45.87 148 12:49 42.8 00:52 3.09 Y Y VMC West 27R 850 17:06 58.37 25 14:59 57.8 02:07 0.60 Y Y VMC East 09R 98 15:16 50.05 16 16:08 53.7 (00:52) (3.68) N Y MMC East 27R 195 15:19 49.64 25 13:05 43.3 02:14 6.33 Y Y MMC East 09R 323 17:22 54.66 50 16:08 54.2 01:14 0.44 N N
*Approaching significance
Page 49

FAA / AAL / ACSS NextGen Project CAVS Benefits Analysis Report
Table 22. Time/Distance Flown from Fix-to-Runway, Non-CAVS vs. CAVS: Deteriorating Weather where Ceiling Varies and Visibility All
Non-CAVS Flight Ops CAVS Flight Ops Difference
(Positive = Improvement) Statistically Significant?
Ceiling Visibility Fix Pair Data Points
Avg Flight Time (mm:ss)
Avg Distance Flown (nm)
Data Points
Avg Flight Time (mm:ss)
Avg Distance Flown (nm)
Avg Flight Time (mm:ss)
Avg Distance Flown (nm)
Avg Flight Time
Avg Distance Flown
<=6000 All CHEAZ-09R 287 10:14 29.42 192 10:06 29.4 00:08 (0.02) N N <=5000 All CHEAZ-09R 275 10:18 29.61 176 09:57 28.9 00:21 0.66 N N <=4000 All CHEAZ-09R 242 10:26 29.86 150 10:13 29.5 00:14 0.35 N N <=3000 All CHEAZ-09R 196 10:41 30.48 112 10:19 29.6 00:22 0.86 N N <=2200 All CHEAZ-09R 152 10:49 30.85 83 10:30 29.9 00:19 0.91 N N <=6000 All STAYK-09R 308 08:36 24.13 189 08:28 23.9 00:08 0.23 N N <=5000 All STAYK-09R 289 08:39 24.25 173 08:19 23.4 00:21 0.86 N N <=4000 All STAYK-09R 255 08:47 24.52 149 08:30 23.8 00:18 0.76 N N <=3000 All STAYK-09R 217 08:53 24.77 118 08:26 23.5 00:27 1.28 N N <=2200 All STAYK-09R 171 09:03 25.29 89 08:30 23.5 00:33 1.79 N N* <=6000 All PSOUT-27R 326 08:29 23.38 245 08:24 23.2 00:05 0.20 N N <=5000 All PSOUT-27R 254 08:42 23.90 204 08:25 23.1 00:17 0.79 N N <=4000 All PSOUT-27R 166 08:59 24.65 136 08:44 23.8 00:15 0.81 N N <=3000 All PSOUT-27R 103 09:26 25.66 79 09:32 25.8 (00:06) (0.11) N N <=2200 All PSOUT-27R 62 10:17 27.77 55 10:13 27.3 00:04 0.51 N N <=6000 All WOJIK-27R 192 11:19 32.98 159 11:05 32.4 00:14 0.56 N N <=5000 All WOJIK-27R 160 11:30 33.55 135 11:08 32.5 00:22 1.07 N N <=4000 All WOJIK-27R 105 11:51 34.44 101 11:22 33.0 00:30 1.42 N N <=3000 All WOJIK-27R 65 12:28 35.95 65 11:55 34.3 00:34 1.60 N N <=2200 All WOJIK-27R 45 13:04 37.57 49 12:09 34.7 00:55 2.84 Y Y <=6000 All EXPRS-09R 64 08:22 23.24 37 08:52 25.3 (00:30) (2.04) N N <=5000 All EXPRS-09R 56 08:36 23.94 35 09:01 25.7 (00:25) (1.78) N N <=4000 All EXPRS-09R 42 09:00 24.83 28 08:56 25.3 00:05 (0.46) N N <=3000 All EXPRS-09R 38 09:05 25.10 19 08:55 25.0 00:09 0.08 N N <=2200 All EXPRS-09R 29 09:37 26.53 16 09:09 25.5 00:28 1.06 N N <=6000 All KYILL-09R 33 11:09 31.89 23 11:52 34.7 (00:43) (2.81) N N <=5000 All KYILL-09R 30 11:26 32.78 22 11:40 34.2 (00:14) (1.41) N N <=4000 All KYILL-09R 24 11:47 33.71 17 11:39 33.8 00:09 (0.09) N N <=3000 All KYILL-09R 23 11:50 33.80 11 11:46 33.6 00:04 0.15 N N <=2200 All KYILL-09R 19 12:19 34.88 10 11:54 33.9 00:25 0.98 N N <=6000 All EYRIE-27R 74 09:28 26.86 34 08:47 24.6 00:40 2.21 N N <=5000 All EYRIE-27R 56 09:42 27.51 18 09:30 27.0 00:11 0.49 N N <=4000 All EYRIE-27R 21 10:28 29.31 13 09:54 27.8 00:34 1.47 N N <=6000 All HIFAL-27R 46 11:30 33.67 22 10:09 29.6 01:22 4.04 Y Y <=5000 All HIFAL-27R 32 11:40 34.19 12 10:52 31.9 00:47 2.29 N N <=4000 All HIFAL-27R 16 11:38 33.67 11 11:02 32.2 00:36 1.44 N N
*Approaching significance
Page 50
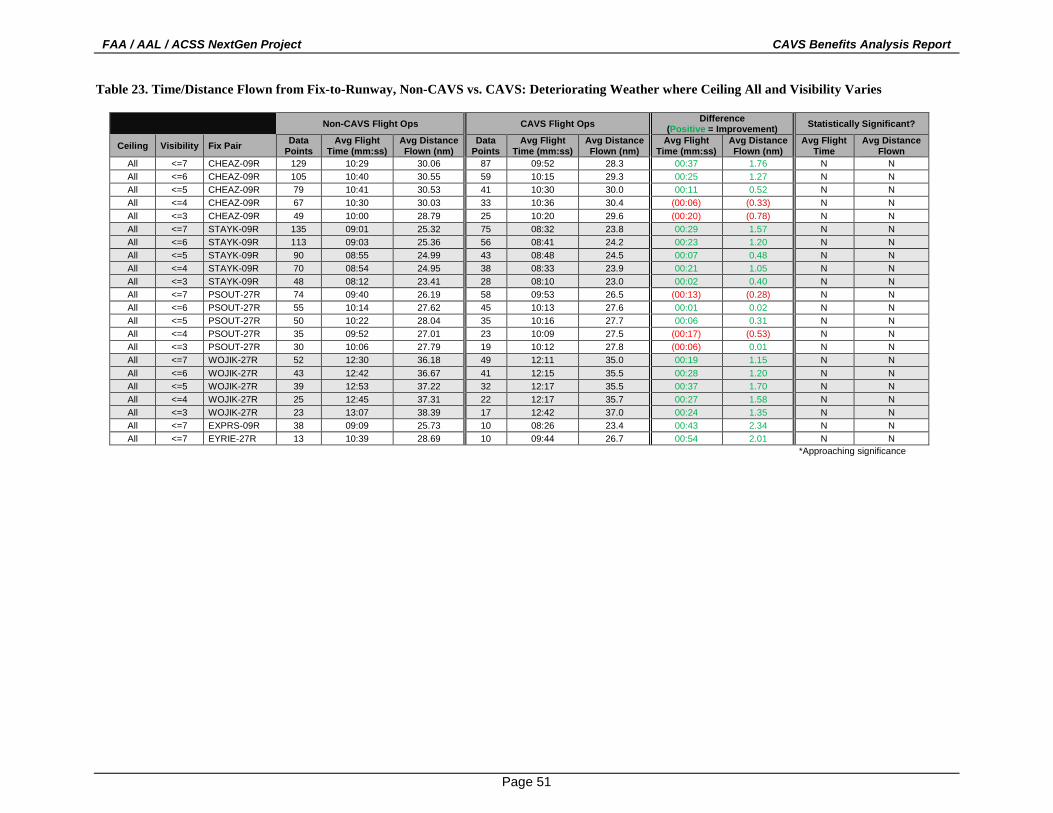
FAA / AAL / ACSS NextGen Project CAVS Benefits Analysis Report
Table 23. Time/Distance Flown from Fix-to-Runway, Non-CAVS vs. CAVS: Deteriorating Weather where Ceiling All and Visibility Varies
Non-CAVS Flight Ops CAVS Flight Ops Difference
(Positive = Improvement) Statistically Significant?
Ceiling Visibility Fix Pair Data Points
Avg Flight Time (mm:ss)
Avg Distance Flown (nm)
Data Points
Avg Flight Time (mm:ss)
Avg Distance Flown (nm)
Avg Flight Time (mm:ss)
Avg Distance Flown (nm)
Avg Flight Time
Avg Distance Flown
All <=7 CHEAZ-09R 129 10:29 30.06 87 09:52 28.3 00:37 1.76 N N All <=6 CHEAZ-09R 105 10:40 30.55 59 10:15 29.3 00:25 1.27 N N All <=5 CHEAZ-09R 79 10:41 30.53 41 10:30 30.0 00:11 0.52 N N All <=4 CHEAZ-09R 67 10:30 30.03 33 10:36 30.4 (00:06) (0.33) N N All <=3 CHEAZ-09R 49 10:00 28.79 25 10:20 29.6 (00:20) (0.78) N N All <=7 STAYK-09R 135 09:01 25.32 75 08:32 23.8 00:29 1.57 N N All <=6 STAYK-09R 113 09:03 25.36 56 08:41 24.2 00:23 1.20 N N All <=5 STAYK-09R 90 08:55 24.99 43 08:48 24.5 00:07 0.48 N N All <=4 STAYK-09R 70 08:54 24.95 38 08:33 23.9 00:21 1.05 N N All <=3 STAYK-09R 48 08:12 23.41 28 08:10 23.0 00:02 0.40 N N All <=7 PSOUT-27R 74 09:40 26.19 58 09:53 26.5 (00:13) (0.28) N N All <=6 PSOUT-27R 55 10:14 27.62 45 10:13 27.6 00:01 0.02 N N All <=5 PSOUT-27R 50 10:22 28.04 35 10:16 27.7 00:06 0.31 N N All <=4 PSOUT-27R 35 09:52 27.01 23 10:09 27.5 (00:17) (0.53) N N All <=3 PSOUT-27R 30 10:06 27.79 19 10:12 27.8 (00:06) 0.01 N N All <=7 WOJIK-27R 52 12:30 36.18 49 12:11 35.0 00:19 1.15 N N All <=6 WOJIK-27R 43 12:42 36.67 41 12:15 35.5 00:28 1.20 N N All <=5 WOJIK-27R 39 12:53 37.22 32 12:17 35.5 00:37 1.70 N N All <=4 WOJIK-27R 25 12:45 37.31 22 12:17 35.7 00:27 1.58 N N All <=3 WOJIK-27R 23 13:07 38.39 17 12:42 37.0 00:24 1.35 N N All <=7 EXPRS-09R 38 09:09 25.73 10 08:26 23.4 00:43 2.34 N N All <=7 EYRIE-27R 13 10:39 28.69 10 09:44 26.7 00:54 2.01 N N
*Approaching significance
Page 51

FAA / AAL / ACSS NextGen Project CAVS Benefits Analysis Report
Table 24. Time/Distance Flown from Fix-to-Runway, Non-CAVS vs. CAVS: Deteriorating Weather where Ceiling Varies and Visibility Varies
Non-CAVS Flight Ops CAVS Flight Ops Difference
(Positive = Improvement) Statistically Significant?
Ceiling Visibility Fix Pair Data Points
Avg Flight Time (mm:ss)
Avg Distance Flown (nm)
Data Points
Avg Flight Time (mm:ss)
Avg Distance Flown (nm)
Avg Flight Time (mm:ss)
Avg Distance Flown (nm)
Avg Flight Time
Avg Distance Flown
<=5000 <=5 CHEAZ-09R 73 10:53 31.10 38 10:37 30.3 00:16 0.78 N N <=4000 <=5 CHEAZ-09R 72 10:49 30.85 36 10:44 30.6 00:04 0.24 N N <=3000 <=5 CHEAZ-09R 69 10:53 31.03 36 10:44 30.6 00:08 0.43 N N <=5000 <=4 CHEAZ-09R 62 10:41 30.56 31 10:40 30.5 00:01 0.04 N N <=4000 <=4 CHEAZ-09R 61 10:36 30.26 31 10:40 30.5 (00:04) (0.27) N N <=3000 <=4 CHEAZ-09R 58 10:40 30.44 31 10:40 30.5 (00:00) (0.09) N N <=5000 <=3 CHEAZ-09R 45 10:10 29.30 23 10:25 29.7 (00:15) (0.42) N N <=4000 <=3 CHEAZ-09R 45 10:10 29.30 23 10:25 29.7 (00:15) (0.42) N N <=3000 <=3 CHEAZ-09R 42 10:14 29.49 23 10:25 29.7 (00:11) (0.23) N N <=5000 <=5 STAYK-09R 81 09:07 25.46 41 08:52 24.7 00:15 0.74 N N <=4000 <=5 STAYK-09R 80 09:04 25.25 40 08:55 24.8 00:08 0.43 N N <=3000 <=5 STAYK-09R 77 09:08 25.45 40 08:55 24.8 00:12 0.63 N N <=5000 <=4 STAYK-09R 64 09:02 25.26 36 08:37 24.1 00:25 1.17 N N <=4000 <=4 STAYK-09R 63 08:57 24.99 36 08:37 24.1 00:20 0.91 N N <=3000 <=4 STAYK-09R 61 08:59 25.14 36 08:37 24.1 00:22 1.05 N N <=5000 <=3 STAYK-09R 45 08:10 23.30 26 08:14 23.2 (00:05) 0.10 N N <=4000 <=3 STAYK-09R 45 08:10 23.30 26 08:14 23.2 (00:05) 0.10 N N <=3000 <=3 STAYK-09R 43 08:11 23.43 26 08:14 23.2 (00:04) 0.23 N N <=5000 <=5 PSOUT-27R 49 10:17 27.84 30 10:18 27.8 (00:02) 0.06 N N <=4000 <=5 PSOUT-27R 47 10:24 28.16 30 10:18 27.8 00:05 0.39 N N <=3000 <=5 PSOUT-27R 44 10:32 28.48 26 10:23 27.9 00:09 0.56 N N <=5000 <=4 PSOUT-27R 35 09:52 27.01 18 10:11 27.6 (00:19) (0.55) N N <=4000 <=4 PSOUT-27R 35 09:52 27.01 18 10:11 27.6 (00:19) (0.55) N N <=3000 <=4 PSOUT-27R 33 10:02 27.49 14 10:17 27.8 (00:15) (0.29) N N <=5000 <=3 PSOUT-27R 30 10:06 27.79 15 10:21 28.2 (00:15) (0.37) N N <=4000 <=3 PSOUT-27R 30 10:06 27.79 15 10:21 28.2 (00:15) (0.37) N N <=3000 <=3 PSOUT-27R 29 10:12 28.08 11 10:33 28.6 (00:21) (0.57) N N <=5000 <=5 WOJIK-27R 38 12:48 37.01 27 12:04 34.8 00:44 2.20 N N <=4000 <=5 WOJIK-27R 36 12:59 37.55 27 12:04 34.8 00:56 2.74 N N <=3000 <=5 WOJIK-27R 32 13:14 38.21 24 12:01 34.6 01:12 3.63 N* N* <=4000 <=4 WOJIK-27R 25 12:45 37.31 17 11:58 34.7 00:47 2.64 N N <=3000 <=4 WOJIK-27R 23 13:05 38.29 14 11:52 34.3 01:12 4.02 N N <=5000 <=3 WOJIK-27R 23 13:07 38.39 13 12:29 36.3 00:38 2.09 N N <=4000 <=3 WOJIK-27R 23 13:07 38.39 13 12:29 36.3 00:38 2.09 N N <=3000 <=3 WOJIK-27R 22 13:17 38.93 10 12:31 36.2 00:47 2.71 N N
*Approaching significance
Page 52

FAA / AAL / ACSS NextGen Project CAVS Benefits Analysis Report
Table 25. Time/Distance Flown from Fix-to-Runway, Non-CAVS vs. CAVS: VMC, MMC & IMC
Non-CAVS Flight Ops CAVS Flight Ops Difference
(Positive = Improvement) Statistically Significant?
Wx Fix Pair Data Points
Avg Flight Time (mm:ss)
Avg Distance Flown (nm)
Data Points
Avg Flight Time (mm:ss)
Avg Distance Flown (nm)
Avg Flight Time (mm:ss)
Avg Distance Flown (nm)
Avg Flight Time
Avg Distance Flown
VMC CHEAZ-09R 305 08:53 26.00 241 09:05 26.9 (00:12) (0.86) N N MMC CHEAZ-09R 57 10:39 30.34 31 09:46 28.3 00:53 2.04 N* N IMC CHEAZ-09R 148 10:38 30.35 83 10:31 30.1 00:07 0.28 N N VMC STAYK-09R 276 07:56 22.63 216 07:58 22.8 (00:02) (0.12) N N MMC STAYK-09R 59 08:41 23.95 31 08:08 22.9 00:33 1.06 N N IMC STAYK-09R 167 08:55 25.00 89 08:31 23.6 00:24 1.37 N N VMC PSOUT-27R 1453 07:41 21.33 1110 07:46 21.8 (00:05) (0.47) N Y MMC PSOUT-27R 43 07:53 21.65 25 07:55 22.2 (00:03) (0.52) N N IMC PSOUT-27R 62 10:26 28.24 63 10:14 27.4 00:12 0.83 N N VMC WOJIK-27R 875 10:07 29.86 722 10:08 30.1 (00:01) (0.25) N N MMC WOJIK-27R 21 10:49 31.32 16 11:10 33.2 (00:21) (1.85) N N IMC WOJIK-27R 46 13:04 37.64 57 12:16 35.2 00:48 2.40 N* Y VMC EXPRS-09R 73 07:39 21.72 62 08:41 25.2 (01:02) (3.44) Y Y IMC EXPRS-09R 36 09:32 26.56 16 09:09 25.5 00:23 1.09 N N VMC KYILL-09R 41 10:06 29.65 39 11:39 34.7 (01:33) (5.06) Y Y IMC KYILL-09R 21 12:08 34.57 10 11:54 33.9 00:14 0.67 N N VMC EYRIE-27R 401 08:19 23.62 207 08:48 25.1 (00:29) (1.48) Y Y VMC HIFAL-27R 239 10:22 30.48 131 10:40 31.5 (00:17) (0.99) N N
*Approaching significance
Table 26. Time/Distance Flown from Fix-to-Runway, Not CAVS+Coupled <9K' vs. CAVS+Coupled <9K': Ceiling All and Visibility All
Not CAVS+Coupled <9K' CAVS+Coupled <9K' Difference
(Positive = Improvement) Statistically Significant?
Ceiling Visibility Fix Pair Data Points
Avg Flight Time (mm:ss)
Avg Distance Flown (nm)
Data Points
Avg Flight Time (mm:ss)
Avg Distance Flown (nm)
Avg Flight Time (mm:ss)
Avg Distance Flown (nm)
Avg Flight Time
Avg Distance Flown
All All CHEAZ-09R 107 09:19 27.37 11 09:38 28.4 (00:19) (1.05) N N All All STAYK-09R 98 08:10 23.29 12 07:39 21.7 00:31 1.59 N N All All PSOUT-27R 311 07:56 22.16 41 07:10 19.9 00:46 2.26 Y Y All All WOJIK-27R 218 10:19 30.58 23 09:34 28.4 00:45 2.18 N N
*Approaching significance
Table 27. Time/Distance Flown from Fix-to-Runway, Not CAVS+Coupled <9K' vs. CAVS+Coupled <9K': VMC, MMC and IMC
Not CAVS+Coupled <9K' CAVS+Coupled <9K' Difference
(Positive = Improvement) Statistically Significant?
Wx Fix Pair Data Points
Avg Flight Time (mm:ss)
Avg Distance Flown (nm)
Data Points
Avg Flight Time (mm:ss)
Avg Distance Flown (nm)
Avg Flight Time (mm:ss)
Avg Distance Flown (nm)
Avg Flight Time
Avg Distance Flown
VMC PSOUT-27R 294 07:50 21.95 41 07:10 19.9 00:40 2.06 Y Y VMC WOJIK-27R 205 10:14 30.37 23 09:34 28.4 00:39 1.97 N N
*Approaching significance
Page 53

FAA / AAL / ACSS NextGen Project CAVS Benefits Analysis Report
Appendix H. PHL Airport Diagram
Page 54

FAA / AAL / ACSS NextGen Project CAVS Benefits Analysis Report
Appendix I. BOJID ONE and JIIMS TWO RNAV Arrivals
Page 55

FAA / AAL / ACSS NextGen Project CAVS Benefits Analysis Report
Page 56