coastal communities under threat: comparing property and
TRANSCRIPT

1
Coastal Communities under Threat: Comparing Property and Social
Exposure
Michal Lichter* and Daniel Felsenstein
Department of Geography, Hebrew University of Jerusalem
* corresponding author: [email protected]

2
Coastal Communities under Threat: Comparing Property and Social
Exposure
Abstract: we examine the threat to coastal communities from sea level rise and extreme
flooding. A distinction is drawn between the exposure of the physical property base of a
community and its social composition. We investigate whether any correspondence exists
between these two dimensions of vulnerability and whether it holds for both small and
large communities. Flood scenarios along the Israeli coast are defined and we and look at
the resultant property and exposure patterns in communities at different flooding
increments. Results are presented for three select inundation increments. Using
comparative and graphic methods, we analyze exposure rankings for different
communities and property and social exposure at the intra-urban level. We use break point
analysis to trace the evolution of community exposure at different flooding increments. We
conclude with some cautionary policy implications with respect to opportunities for change in
highly exposed communities in the wake of extreme flooding.
Keywords: exposure, sea-level rise; Israeli coast, vulnerability index, extreme flooding

3
INTRODUCTION
Vulnerability of coastal communities is an issue high on the agenda of urban planners, disaster
management specialists and appointed public officials. ‘Vulnerability’ is an intangible concept
that has been defined in several ways (Fussel and Klein, 2005). Socio-economic vulnerability is
commonly acknowledged as encompassing both the physical-capital fabric of the community and
also its social composition. Often these two dimensions are integrated to generate a composite
index (Clark et al., 1998; Cutter et al., 2003; Chakraborty et al., 2005; Wood et al., 2010;
Martinich et al, 2013). This homogenization, while serving operational and policy interests may
however be smoke-screening subtle distinctions between property and population exposure. This
paper treats them separately grounded in the belief that they represent complementary sides of the
vulnerability coin. We analyze the exposure to flood risk of both the physical-property base of
coastal communities and their social base, along the Mediterranean coast of Israel. The physical-
property exposure of a community reflects its wealth foundation. This is capitalized in the value
of capital stock of residential properties at risk. Social exposure which is comprised of the
aggregate characteristics of the population at risk denotes the human composition of threatened
communities. Despite the tendency to assume an association between property and social
exposure, there does not need to be any a-priori correlation between the two. For example, we can
envisage a case of physically disabled people living in highly valuable sea-front residences or
alternatively of highly skilled graduate students living in cheap accommodation in flood prone
zones.
The aim of this paper is to test whether there is any correspondence between these two
dimensions of exposure: are communities with high property exposure also socially vulnerable?
Does this correlation hold for large and small communities? What does this mean for community
resilience? The rationale for distinguishing between these two aspects is that policy implications

4
may be very different. In coastal communities where property exposure is high but social
vulnerability is low, policy prescriptions may point to in-situ coastal protections and efforts to
preserve community coherence through deepening capital investment. Alternatively, in
communities where social composition is highly vulnerable and property exposure is low due to
low level of investment and value, policy solutions may point to more stringent regulatory
practice or even relocation.
This paper proceeds as follows. In the next section we review the literature on vulnerability
indices paying special attention to proxies for property and social exposure and composite
indicators of vulnerability. We then proceed to describe the method of analysis. This involves
delimiting the flood increments and comparing property and social exposure for coastal local
authorities at different flood levels. The data analysis that underpins this exercise is outlined in
the following section and particular attention is paid to the allocation of data to buildings in order
to create micro level property and exposure data. We conclude with some policy implications
arising from the analysis. These caution against over-exuberant public policy experiments in
highly exposed communities often under the guise of promoting community revitalization in the
aftermath of extreme flooding events.
LITERATURE REVIEW
Adaptation and planning for future sea-level rise (SLR) and extreme coastal flooding (EF) is a
cardinal issue for coastal management and climate change economics due to its significant future
costs and inherent complexities. Different physical landscapes (ie coastal landforms or real estate
properties) and different societal structures may require different physical and social adaptation
strategies. These strategies cover a vast realm of possible pre and post event efforts and may

5
include hard coastal protection, elevation of property, beach nourishment and coastal stabilization
techniques such as vegetation stabilization. But they can also include retreat options, evacuation
management plans, personal household preparation and future development regulations (ie
setback lines etc.). In any event, effective response necessitates a good understanding of those
communities who might be disproportionately affected either because their property is highly
exposed or because their relative loss is higher and therefore their ability to cope is lower.
In considering adaptation and planning strategies, the uncertainties of exposure are compounded.
Uncertainties in predicting the magnitude of future SLR (Willis and Church, 2012) and to an even
greater extent future EF (Woodworth and Blackman, 2004; Vilibić et al. 2012), make planning
for the unknown future a precarious task. Additionally, the difficulties in projecting future
resources and property value add further uncertainty (Neumann et al., 2011). Coastal
management and adaptation planning may take place at different spatial scales requiring different
decision support systems and varied inputs in terms of the information and analyses on which
they rely. Equipping decision makers and coastal planners with comprehensive information to
assist and support future adaptation is a critical step in risk analysis. This entails complex analysis
of both physical, property and socio-economic data. Risk is often defined either as simply the
probability of occurrence of a hazard or in combination with its consequences or outcome
(Brooks et al. 2005, Brouwer et al. 2007, Clark et al. 1998, Cutter 2003). Consequently, the same
hazard might not yield the same consequences given a different set of conditions. Assessing the
vulnerability (physical, environmental, biological, socio-economic) of a study unit helps in
identifying the plausible consequences and outcomes and therefore in the assessment of the risk
in the broader sense of the term.
Studies concerning property vulnerability often deal with the retreat-protect dilemma in a cost-
benefit framework, weighing the costs of adaptation against the value of the properties for

6
protection (Nicholls et al., 2008; Neumann et al., 2010, 2011). Analyses of property at risk can
also help to delineate the areas where properties are located and estimate the feasibility and
optimization of that protection. Nicholls et al. (2008) demonstrate that by focusing protection
efforts on just small fractions of the global coastline, displacement of a large share of the coastal
population can be avoided. Others deal with estimating the reduced value of properties located in
a flood plain or a hazardous zone (Harrison et al., 2001; Bin et al., 2008) and the effect that EF
has on property value (Bin and Polasky, 2004). The latter suggest that extreme flooding might
render the population in the flooded zone even more vulnerable or at least less wealthy. Martinich
et al. (2013) find that socially vulnerable communities are more likely to opt for the retreat option
than costly defense strategies, since their property is of a lower value and therefore less likely to
be worth protecting. This underscores that exposure is not just an issue of coastal management
and planning but also of social equity and justice.
Socio- economic vulnerability assessments in turn, are not detached from physical-property
considerations. They often consider individual wealth but are mostly concerned with analyzing
collective resilience or adaptive capacity. Adaptive capacity is a component of vulnerability
which relates to the ability to adapt over time (Brooks et al. 2005, Brouwer et al. 2007). In most
studies it stems from the socio-economic status of inhabitants at risk, manifested in census
demographic properties, which often are captured in a composite socio-economic vulnerability
index. Several indicators are typically used for social vulnerability analysis including age;
disabilities; income; occupation; race; family status; housing and infrastructure and lifelines
(Clark et al., 1998, Chakraborty et al., 2005). There are many ways to select social indicators in
order to calculate vulnerability. Brooks et al. (2005) correlate mortality rates due to climate
related disasters and socio-economic and political indicators in order to identify the relevant
vulnerability indicators. Validation and weighting is incorporated using expert judgment. Clark et
al. (1998); Cutter et al. (2003) and Fekete (2009) use factor analysis to simplify their multivariate

7
data and cluster redundant variables. After choosing the relevant indicators an index is composed
either by simply adding or averaging all components or by assigning weights to each component
which requires subjective expert judgment. Finally, Rygel et al. (2006) utilize a Pareto ranking
method in order to avoid subjective weighing by ranking each case in the data set by a
composition of indicator scores in relation to other cases.
METHOD
Our approach is essentially comparative and graphic. We define flood scenarios along the
Israeli coast and look at the property and exposure patterns in coastal communities at different
flooding increments. We present results for three select inundation increments. These denote
different flooding scenarios: 1m represents sea level rise (SLR), 2m and 5m represent extreme
flooding (EF). A 10m elevation increment represents the Low Elevation Coastal Zone (LECZ).
This is the entire coastal area below 10m which is hydrologically connected to the sea
(McGranahan et al., 2007). It is important to note that the LECZ is not an inundation scenario
per-se. Rather, it represents a spatial delineation of the area in close proximity to the coastline at
low elevation that could be affected by residual impacts of inundation.
The Mediterranean coast of Israel is 195 km long. The shoreline consists of beaches that
extend up to 300m in width in the vicinity of river estuaries and is backed by a 70 km long series
of aeolianite ridges. The coastal plain is the most densely populated area in the country and
includes two of the three major cities in Israel (Tel Aviv-Yafo and Haifa), both with large
metropolitan hinterlands. Tel Aviv-Yafo, the second largest city in the country (after Jerusalem),
has a population of more than 400 thousand inhabitants. Haifa, the third largest city has a
population of more than 250 thousand inhabitants. We use municipalities as the spatial unit of
analysis in this study because they represent the relevant level at which planning and decision
making are conducted. Out of 254 municipalities in Israel, 32 have residential buildings within

8
the LECZ. Large differences exist in the size of coastal municipalities along the coast. Nine of
them have populations of over 100 thousand and three have less than 10 thousand inhabitants.
The stages of the analysis are as follows:
Delineating the flood zones
We create inundation maps for four different elevation increments: 1, 2, 5 and 10m, representing
SLR, EF and the LECZ respectively. Global SLR rose at a non-linear rate of 1-2 mm/year during
the 21st century (with significant accelerations (Jeverjeva et al., 2008; Church and White, 2006;
2011; Woodworth et al., 2011) and a rate of 3.2 mm/year in the last couple of decades (Church
and white, 2011). Projections for the 21st century vary considerably and range from 0.2 to 2 m
(Meehl et al., 2007; Rahmstorf, 2007; Pfeffer et al., 2008; Grinsted et al., 2010), but fail to
provide an accurate rate (Willis and Church, 2012). Periodical flooding is estimated by
considering return periods (probabilities) of extreme high tides (1m represents a return period of
1:100 years (Golik and Rosen, 1999)) and extreme events such as Tsunamis. The inundation
layers serve as the platform for the exposure analysis. Each inundation increment is determined
by two main factors: topography and hydrological connectivity to the sea. We use a passive
inundation model where at each increment, the entire area below the relevant topographic
elevation which is hydrological connected to the sea, is presumed to be flooded (see Lichter and
Felsenstein, 2012).
Data Analysis
This involves two main tasks: allocating floorspace, value and inhabitants to buildings in the
flood zones and creating a social vulnerability index. The former is accomplished using a detailed
GIS building data layer and by disaggregating administrative statistical data available for small
spatial units (statistical areas-SA’s) and re-aggregating it at the level of the individual building. In

9
this way we achieve a much more reliable spatial distribution of properties and inhabitants.
Additionally, we develop a composite social vulnerability index which uses socio-economic
variables with appropriate weightings for the task at hand. The mechanics of this data processing
are described in the next section.
Comparison of Exposure Rankings at the Municipal Level
We rank coastal municipalities along the coast at different flood elevation levels. We do
this for both absolute and relative indices of exposure. In addition we categorize property
and social vulnerability into dichotomous groups (high and low) using natural break
points in the data and observe the resultant exposure patterns for key coastal
municipalities at the different flood zone levels. This allows us to trace the exposure
progression of a given community with increasing flooding level.
Property and Social exposure at the intra-urban level
Analysis at the aggregate municipality level may smokescreen or amplify the extent of exposure
correspondence that exists at the micro level such as the street, city block or urban quarter. Given
the existence of buildings level data, we are able to test the possible existence of modifiable areal
unit (MAUP)-type effects in exposure patterns (Openshaw, 1984; Fotheringham and Wong,
1991). The MAUP condition exists when measures of statistical association such as correlations,
vary with scale. Using GIS tools, we are able to zoom-in and graphically demonstrate the levels
of correspondence that might be overlooked in aggregate analysis.
DATA PROCESSING
Property exposure is manifested in residential assets exposed to risk, both in terms of floor space
and in terms of monetary value. Social exposure is expressed first, by the gross number of
inhabitants exposed to risk and second, by the relative socio-economic status of those exposed

10
inhabitants using an appropriate vulnerability index. To operationalize these concepts we use GIS
tools to create the following variables: residential building floor space, residential building value,
exposed inhabitants, socio-economic vulnerability index.
Residential Building floor space
A national polygonal building layer containing land heights and roof heights of buildings is used
to calculate the floor space in m2 (the total area of a building multiplied by its number of floors)
for each building. The layer contains building land-use classification and for this study, we use
only residential buildings. The number of floors in residential buildings is calculated by dividing
building height by average floor height of 3.5m.
Property capital stock- Residential building value
This variable is derived from a house price series made available from the CARMEN data base
by the Israel Tax Authority. It registers all housing transactions in nominal prices. Our data
relates to a data series from 1997-2008 by statistical area. Since transactions were not registered
in all statistical areas every year, we aggregate all transactions across each statistical area, and
standardize all prices in terms of real 2008 values. In places where less than three annual
transactions exist, coarser resolution regional-level data are used. Values per m2 are multiplied by
the floor space under flood in each increment.
Exposed inhabitants
We use the building layer in order to disaggregate and spatially re-distribute statistical area level
population counts:
The average number of inhabitants per m2 of residential floor space in a statistical area (ISR) is
calculated as follows:

11
where:
SSR = Total statistical area residential floor space.
IS= Total population per statistical area
Population counts per building (IB) are then calculated as follows:
Socio-economic vulnerability index
We use four key social variables obtained from the national census (2008) to define social
vulnerability at the spatial resolution of a the statistical area. These are: average income,
disabilities, age groups and number of vehicles per household.
Household income represents a direct measure of socio-economic status. Disabilities (Id)
represent the share of disabled persons in a statistical area. It combines the share of persons who
are unable or have difficulty walking, hearing, seeing, have memory problems or unable to dress
and shower independently. Age (Id) portrays the size of the dependent population in the SA and
combines the percentage of persons over 65 and under 18 in the statistical area. Vehicles (Iv)
depicts to the percent of households in a SA with one car or more. While this can be construed as
a measure of wealth it is also a measure of a capacity of evacuate in the case of an extreme event.
We regard this indicator with caution since in large cities for example, it is not always an efficient
indicator of wealth and some hazards (SLR for example) do not require rapid evacuation.
Therefore, this indicator is assigned a weight of 0.1 in the overall index.

12
We divide the national distribution of each indicator into quintiles (1- least vulnerable, 5-most
vulnerable) and assign each statistical area to its respective class. Following Cutter et al. (2003),
we derive a weighted composite index as follows:
SV = Ii*0.5 + Id*0.2 + Ia*0.2 + Iv*0.1
where: SV = the vulnerability index, Ii = income quintile, Id = disability quintile, Ia = age quintile,
Iv = vehicle quintile. After ascribing a vulnerability score (SV) to each SA in the country, we
divide national population into quintiles in order to get the same number of persons in each
vulnerability category.
RESULTS
We start by observing absolute and relative levels of property and social exposure. First, we rank
communities according to their level of absolute exposure and then we report relative exposure of
each community to its own property stock and population totals (ie percentage of exposure). In
property exposure we distinguish between floor space and the value of exposed property. In
certain communities, high exposure in terms of floor space does not necessarily translate into
high property value exposure. At the same time, in other communities high values of exposed
property do not necessarily mean high exposure in terms of residential floor space. In population
exposure we analyze the gross number of inhabitants exposed to risk and then focus further only
on those ranked as socio-economically vulnerable (ie populations categorized as “high” and
“very-high” on the socio-economic vulnerability index). Finally, we integrate the four variables
using break-point analysis and present a comprehensive picture of exposure at different flooding
increments.

13
Property exposure
Residential Floor Space
Table 1 ranks the top 5 communities exposed to SLR and EF scenarios in terms of floor space at
the different increments. The difference between large and small communities is apparent in
absolute floor space (m2). However, when looking at the percentage of exposed property out of
the total floor space, it is actually the small communities that rank highest. In relative terms, these
locations bear a higher financial burden as their budgets and tax revenues relate to the size of
their population. The localities of Kiryat Motzkin and Kiryat Bialik are not very vulnerable when
looking at the inundation increments but have more than 90% of their residential floor space in
the LECZ. Figure 1a shows cumulative floor space exposed in each increment in all 32 coastal
communities. When looking at the lower increments (1 and 2m) the differences between the
higher ranking communities is relatively minor. However, at the 5m level and in the entire LECZ
(10m), the differences in residential floor space exposure between Tel Aviv and the rest of the
coastal communities becomes significant. Tel Aviv has more than 2.5 times the residential floor
space of the second ranking community (Akko). In the LECZ, Tel Aviv has more than 4 times the
residential floor space of the second and third ranking communities (Haifa and Nahariya).

14
Table 1: Municipal ranking of residential floor space at risk in different flooding
increments
Inundation
Increment
Residential Building Floor Space Rank Municipality m2 Rank Municipality %
1 1 Haifa 64,237 1 Akko 5.73 2 Akko 62,043 2 Matte Asher 1.56 3 Tel Aviv - Yafo 60,754 3 Haifa 0.77 4 Matte Asher 31,252 4 Hof Hakarmel 0.53 5 Hof Hakarmel 15,092 5 Tel Aviv - Yafo 0.35
2 1 Akko 184,062 1 Akko 17.01 2 Tel Aviv - Yafo 174,150 2 Matte Asher 2.60 3 Haifa 108,228 3 Haifa 1.29 4 Matte Asher 52,023 4 Jisr Az-Zarqa 1.10 5 Hof Hakarmel 29,168 5 Tel Aviv - Yafo 1.02
5 1 Tel Aviv - Yafo 1,271,974 1 Akko 42.51 2 Akko 460,091 2 Kiryat Yam 11.89 3 Haifa 270,591 3 Nahariya 10.85 4 Matte Asher 210,441 4 Matte Asher 10.52 5 Nahariya 163,581 5 Tel Aviv - Yafo 7.43
10
LECZ
1 Tel Aviv - Yafo 4,898,274 1 Kiryat Motzkin 94.95 2 Haifa 1,128,367 2 Kiryat Yam 93.64 3 Nahariya 1,060,929 3 Kiryat Bialik 91.98 4 Kiryat Motzkin 1,003,684 4 Akko 80.19 5 Kiryat Bialik 977,259 5 Naharya 70.36
Residential building value
Here the difference between centrally located Tel Aviv and the rest of the coastal communities is
even more pronounced (Table 2). Starting at 1m, Tel Aviv has twice the residential building value
of Haifa, the second ranking community, which actually has more exposed floor space at this
particular increment. In the LECZ, Tel Aviv has more than 12 times the residential building value
of the next communities (Haifa and Nahariya), indicating not only higher exposure but also the
higher value per m2 in comparison with the rest of the country. Figure 1b clearly indicates this
trend showing the value of property exposure in Tel Aviv to be of a different order of magnitude

15
to elsewhere along the Israeli coast. When looking at relative ranking (Table 2), smaller
communities are more exposed and have a higher share of their residential property value at risk
across all inundation scenarios. Akko, for example ranks highest in relative terms in all
inundation scenarios. When looking at the LECZ however, other northern municipalities (Kiryat
Motzkin, Kiryat Bialik, Kiryat Yam) that are not ranked high at lower increments, have close to
90% of their residential property value located in the LECZ.
Table 2: Municipal ranking of residential capital stock at risk in different flooding
increments
Inundation
Increment
Residential Building Value Rank Municipality million NIS Rank Municipality %
1 1 Tel Aviv - Yafo 1,084 1 Akko 4.84 2 Haifa 434 2 Matte Asher 2.32 3 Akko 199 3 Haifa 0.77 4 Matte Asher 134 4 Tel Aviv - Yafo 0.39 5 Hof Hakarmel 46 5 Hof Hakarmel 0.27
2 1 Tel Aviv - Yafo 3,210 1 Akko 15.99 2 Haifa 713 2 Matte Asher 3.94 3 Akko 655 3 Haifa 1.26 4 Matte Asher 228 4 Tel Aviv - Yafo 1.16 5 Hof Hakarmel 92 5 Jisr Az-Zarqa 1.10
5 1 Tel Aviv - Yafo 23,756 1 Akko 39.44 2 Haifa 1,638 2 Matte Asher 13.10 3 Akko 1,617 3 Nahariya 12.38 4 Emeq Hefer 1,222 4 Kiryat Yam 10.02 5 Nahariya 1,116 5 Tel Aviv - Yafo 8.60
10
LECZ
1 Tel Aviv - Yafo 89,627 1 Kiryat Motzkin 94.64 2 Nahariya 6,893 2 Kiryat Yam 92.24 3 Haifa 6,404 3 Kiryat Bialik 89.62 4 Kiryat Motzkin 5,428 4 Akko 78.66 5 Kiryat Bialik 5,325 5 Nahariya 76.49

16
Population exposure
Exposed inhabitants
Table 3 shows the number of inhabitants residing in each inundation scenario and in the LECZ
and their share of the entire municipal population. In the first two increments (1 and 2m), the
northern municipality of Akko is ranked the first in both absolute and relative measures. The
number of exposed inhabitants in Akko at these increments is almost 3 times higher than in Tel
Aviv (the second ranking municipality). The relative share of those inhabitants from the entire
municipal population is even higher in Akko than in the rest of the coastal communities. In
relative terms, smaller and peripheral communities rank higher than the more populated
communities such as Tel Aviv and Haifa in the two lower increments. In the LECZ, Tel Aviv has
the highest number of inhabitants. More than 90% of the inhabitants of the northern
municipalities of Kiryat Motzkin, Kiryat Bialik and Kiryat Yam are in the category. Figure 1c
shows how Akko is the most vulnerable municipality in absolute terms in the first two inundation
scenarios and Tel Aviv becomes more vulnerable (in absolute terms) in the inundation scenario of
5m and in the LECZ.

17
Table 3: Municipal ranking of inhabitants at risk in different flooding increments
Inundation
Increment
Inhabitants At Risk Totals In Municipality % Of Total Municipal Figures
Rank Municipality # Rank Municipality %
1
1 Akko 2,420 1 Akko 5.27 2 Tel Aviv - Yafo 748 2 Matte Asher 1.82 3 Matte Asher 401 3 Hof Hakarmel 0.38 4 Haifa 398 4 Tel Aviv - Yafo 0.19 5 Bat Yam 193 5 Emeq Hefer 0.16
2 1 Akko 7,791 1 Akko 16.97 2 Tel Aviv - Yafo 2,512 2 Matte Asher 3.03 3 Haifa 1,308 3 Jisr Az-Zarqa 1.31 4 Matte Asher 666 4 Emeq Hefer 0.91 5 Emeq Hefer 318 5 Hof Hakarmel 0.86
5 1 Tel Aviv - Yafo 26,754 1 Akko 47.57 2 Akko 21,833 2 Kiryat Yam 15.10 3 Kiryat Yam 5,707 3 Matte Asher 13.40 4 Haifa 5,584 4 Nahariya 9.64 5 Nahariya 4,947 5 Tel Aviv - Yafo 6.63
10 1 Tel Aviv - Yafo 111,187 1 Kiryat Motzkin 95.51 2 Akko 38,678 2 Kiryat Yam 94.91 3 Kiryat Motzkin 36,676 3 Kiryat Bialik 92.73 4 Kiryat Yam 35,877 4 Akko 84.27 5 Kiryat Bialik 34,495 5 Nahariya 63.45
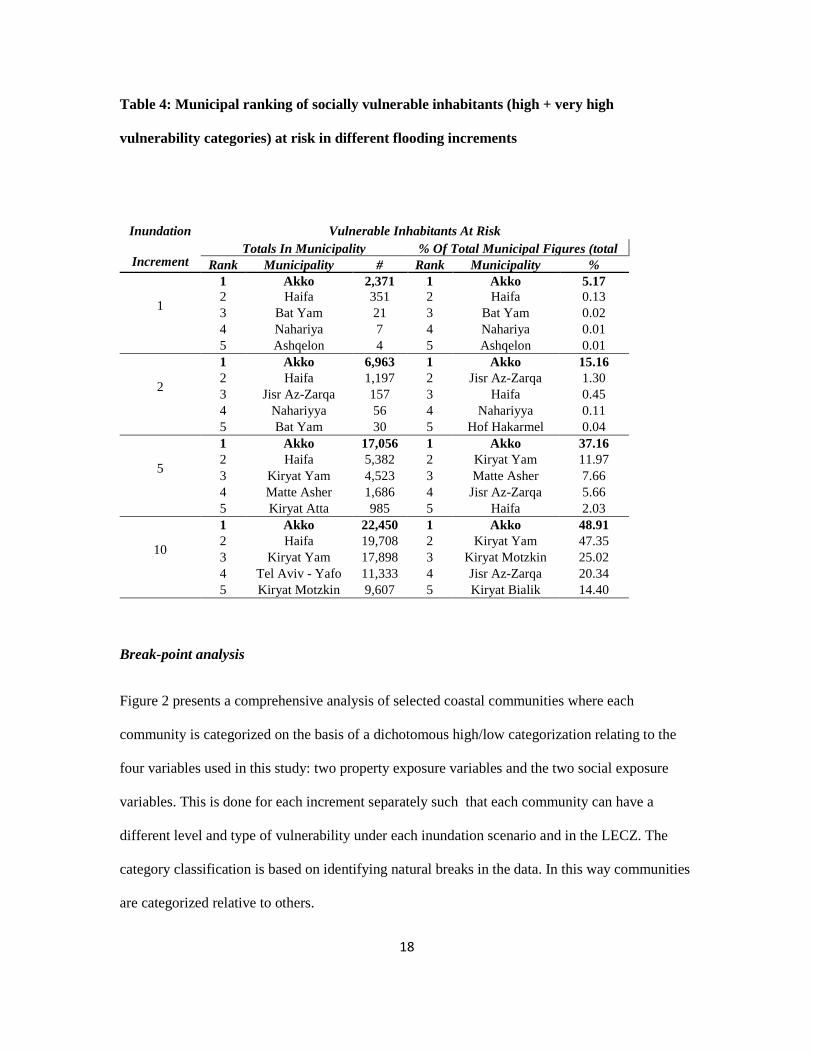
Exposed vulnerable population
By looking at the socially vulnerable inhabitants rather that the total number of inhabitants at risk
we highlight those communities with less coping ability in the face of an external shock. Table 4
shows the northern municipality of Akko as ranking highest in both absolute and relative terms
under all scenarios. Figure 1d and Table 4 illustrate that in relative terms, Akko ranks first (far
higher than all other communities) followed by Haifa and Kiryat Yam. Tel Aviv, in terms of
vulnerable population exposed only appears in the LECZ ranking, where it ranks the 4th .
18
Table 4: Municipal ranking of socially vulnerable inhabitants (high + very high
vulnerability categories) at risk in different flooding increments
Inundation
Increment
Vulnerable Inhabitants At Risk
Totals In Municipality % Of Total Municipal Figures (total
Rank Municipality # Rank Municipality %
1
1 Akko 2,371 1 Akko 5.17 2 Haifa 351 2 Haifa 0.13 3 Bat Yam 21 3 Bat Yam 0.02 4 Nahariya 7 4 Nahariya 0.01 5 Ashqelon 4 5 Ashqelon 0.01
2
1 Akko 6,963 1 Akko 15.16 2 Haifa 1,197 2 Jisr Az-Zarqa 1.30 3 Jisr Az-Zarqa 157 3 Haifa 0.45 4 Nahariyya 56 4 Nahariyya 0.11 5 Bat Yam 30 5 Hof Hakarmel 0.04
5
1 Akko 17,056 1 Akko 37.16 2 Haifa 5,382 2 Kiryat Yam 11.97 3 Kiryat Yam 4,523 3 Matte Asher 7.66 4 Matte Asher 1,686 4 Jisr Az-Zarqa 5.66 5 Kiryat Atta 985 5 Haifa 2.03
10
1 Akko 22,450 1 Akko 48.91 2 Haifa 19,708 2 Kiryat Yam 47.35 3 Kiryat Yam 17,898 3 Kiryat Motzkin 25.02 4 Tel Aviv - Yafo 11,333 4 Jisr Az-Zarqa 20.34 5 Kiryat Motzkin 9,607 5 Kiryat Bialik 14.40
Break-point analysis
Figure 2 presents a comprehensive analysis of selected coastal communities where each
community is categorized on the basis of a dichotomous high/low categorization relating to the
four variables used in this study: two property exposure variables and the two social exposure
variables. This is done for each increment separately such that each community can have a
different level and type of vulnerability under each inundation scenario and in the LECZ. The
category classification is based on identifying natural breaks in the data. In this way communities
are categorized relative to others.

19
The top part of each divided circle represents property vulnerability: the left quadrant (M)
signifies floor space vulnerability and the right quadrant (V) represents property value (all in
absolute terms). The bottom half of each circle represents vulnerability of residents in absolute
terms with (P) denoting total inhabitants exposed and (S) signifying socio-economically
vulnerable of population at risk. Dark gray denotes high and light gray denotes low vulnerability.
Only select municipalities are shown in Figure 2. As the inundation increment increases an
increasing number of municipalities become categorized as highly vulnerable. Due to the relative
nature of the comparison, it is feasible for a given community to be categorized as highly
vulnerable for a certain variable at a low increment and at a higher increment to be categorized at
a lower level of vulnerability for the same indicator.
For example, the city of Bat Yam south of Tel Aviv is scored high in terms of property value
exposure at the 1m and 2m levels but low at the 5m increment. Tel Aviv is categorized as having
low socio-economic exposure in the first two flood increments and as highly vulnerable for the
other three variables. Nahariya also tends to demonstrate low socio-economic vulnerability
(except at the 5m increment). At the 1m level it has high exposure in terms of property value
while the other variables show low level vulnerability, indicating a relatively wealthy community.
Neighboring Akko, on the other hand, is highly vulnerable in every variable and at very
increment indicating first, high exposure and second, a relatively poor community. Other
communities such as Kiryat Motzkin are not at all exposed to any of the three inundation
scenarios, but when looking at the entire LECZ the measure of exposure is higher than 90% for
almost any given indicator.
Figure 3 captures a 3D view of a small part of the southern coastal strip of Tel Aviv-Yafo,
looking east from the Mediterranean. It focuses on the Yafo port vicinity and its urban hinterland
that encompasses parts of south Tel Aviv. Maps for the four variables are presented at the micro
20
(building) level. At this scale of analysis, the heterogeneity of these variables along the Tel Aviv-
Yafo coastline becomes readily apparent. The spatial distribution of property value exposure,
seems to be correlated with the distribution of socially vulnerable populations. The cluster of
socially resilient residents in high value, exclusive gated communities around the Yafo port area
can be easily identified as can the lower property value neighborhoods with socially vulnerable
residents as the zoom moves due east. This highlights the important issue of scale that can be lost
at the aggregate level of the municipality. While Figure 2 gives a comprehensive picture of
exposure at different levels, important micro level variation is typically ironed out. These MAUP-
type effects are captured here graphically. For policy making at the intra-urban level, these
differences can be critical.
CONCLUSIONS
This study illustrates the correspondence between social and property exposure. Obviously this
relationship is mediated by city size. The juxtaposition of the exposure of a large city such as Tel
Aviv with small communities such as Akko, Kiryat Motzkin or Kiryat Yam, underscores this
point. This is borne out in Figure 1 where Tel Aviv dominates absolute exposure across all
variables aside from social vulnerability, while Akko dominates the latter in both absolute and
relative terms (and other variables in term of relative exposure). Thus, in relative terms, and this
is what matters at the local level, Akko is far more exposed.
What does this mean for community resilience? Perhaps the most salient policy issue relates to
adaptation and coping ability. A given magnitude of flooding damage in a small community has
very different implications to the same magnitude in a large community. While the value and
extent of damage may be identical, extreme inundation in a small place is not just an issue of
physical loss. Local institutions, networks and relationships may be uprooted and hard to

21
recreate. A one-time shock in a small community offers opportunities for ‘time compression’
processes (Olshansky, Hopkins and Johnson 2012). These refer to the attempts to compress
activities such as the physical renewal or demolition of capital stock, rebuilding or restructuring
of social and governmental institutions and rejuvenating land use over a short period of time due
to the ‘window of opportunity’ generated by the unanticipated event. These steps are much harder
to effect in larger communities where infrastructure and institutions are much more cumbersome
and less malleable.
In terms of policy implications this suggests that highly exposed small communities may be
subject to more speculative adaptation and mediation programs to foster recovery, than larger
communities. Small communities can unwittingly become the playing field for experimental
public policy measures and adaptation measures. The history of public policy in local economic
development is littered with examples of vulnerable communities subjected to failed programs
(Peters and Fisher 2001). Consequently, places that a priori are more exposed in terms of both
their property and social vulnerability are likely to have their risk compounded by the
‘opportunity for change’ generated by SLR and EF. Even if the extent of damage is only
moderate in absolute terms, it is the individual and community coping response that effectively
determines its magnitude. In those (small) communities where both social and property exposure
coalesce, public policy needs to be sensitive of the pitfalls related to such ‘windows’ for public
sector opportunism. They may turn out to be one-way portholes instead.
Acknowledgement: This research is partially based on work done in the SECOA (Solutions for
Environmental Contrasts in Coastal Areas) research project funded by the European Commission
Seventh Framework Programme 2007-2013 under Grant Agreement No 244251.

22
Bibliography
Bin, O., Kruse, J. B., & Landry, C. E. (2008) Flood Hazards, Insurance Rates, and Amenities:
Evidence from the Coastal Housing Market. The Journal of Risk and Insurance, 75 (1) :, 63–82.
doi:10.2307/25145263
Bin, O., & Polasky, S. (2004) Effects of Flood Hazards on Property Values: Evidence before and
after Hurricane Floyd. Land Economics, 80 (4) :, 490–500. doi:10.2307/3655805
Brooks, N., Neil Adger, W., & Mick Kelly, P. (2005) The determinants of vulnerability and
adaptive capacity at the national level and the implications for adaptation. Global environmental
change, 15(2):, 151–163.
Brouwer, R., Akter, S., Brander, L., & Haque, E. (2007) Socioeconomic vulnerability and
adaptation to environmental risk: a case study of climate change and flooding in Bangladesh. Risk
Analysis, 27(2):, 313–326.
Chakraborty, J., Tobin, G. A., & Montz, B. E. (2005) Population evacuation: assessing spatial
variability in geophysical risk and social vulnerability to natural hazards. Natural Hazards
Review, 6(1):, 23–33.
Church, J. A., & White, N. J. (2006) A 20th century acceleration in global sea-level rise.
Geophysical Research Letters, 33: L01602. doi:10.1029/2005GL024826
Church, John A., & White, N. J. (2011) Sea-level rise from the late 19th to the early 21st century.
Surveys in Geophysics, 32(4-5): 585–602.
23
Clark, G. E., Moser, S. C., Ratick, S. J., Dow, K., Meyer, W. B., Emani, S., … Schwarz, H. E.
(1998) Assessing the vulnerability of coastal communities to extreme storms: the case of Revere,
MA., USA. Mitigation and Adaptation Strategies for Global Change, 3(1): 59–82.
Cutter, S. L., Boruff, B. J., & Shirley, W. L. (2003) Social vulnerability to environmental
hazards*. Social science quarterly, 84(2): 242–261.
Fekete, A. (2009) Validation of a social vulnerability index in context to river-floods in Germany.
Nat Hazards Earth Syst Sci, 9(2): 393–403.
Fotheringham, A. S., & Wong, D. W. (1991) The modifiable areal unit problem in multivariate
statistical analysis. Environment and planning A, 23(7): 1025–1044.
Golik, A., & Rosen, D. S. (1999) Management of the Israeli coastal sand resources. Haifa: Israel
Oceanographic & Limnological Research ltd.
Harrison, D. M., T. Smersh, G., & Schwartz, A. L. (2001) Environmental determinants of
housing prices: The impact of flood zone status. Journal of Real Estate Research, 21(1): 3–20.
Jeverjeva, S., Moore, J. C., Grinsted, A., & Woodworth, P. L. (2008) Recent global sea level
acceleration started over 200 years ago? Geophysical Research Letters, 35.
Lichter, M., & Felsenstein, D. (2012) Assessing the costs of sea-level rise and extreme flooding at
the local level: A GIS-based approach. Ocean & Coastal Management, 59: 47–62.
Martinich, J., Neumann, J., Ludwig, L., & Jantarasami, L. (2013) Risks of sea level rise to
disadvantaged communities in the United States. Mitigation and Adaptation Strategies for Global
Change, 18(2): 169–185.

24
McGranahan, G., Balk, D., & Anderson, B. (2007) The rising tide: assessing the risks of climate
change and human settlements in low elevation coastal zones. Environment and Urbanization,
19(1): 17–37.
Meehl, G. A., Stocker, T. F., Collins, W. D., Friedlingstein, P., Gaye, A. T., Gregory, G. M., …
Zhao, Z. C. (2007) Global Climate Projections. In S. Solomon, D. Qin, M. Manning, Z. Chen, M.
Marquis, K. B. Averyt, … H. L. Miller (Eds.), Climate Change 2007: The Physical Science Basis.
Contribution of Working Group I to the Fourth Assessment Report of the Intergovernmental
Panel on Climate Change. Cambridge, United Kingdom and New York, NY, USA: Cambridge
University Press.
Neumann, J. E., Hudgens, D. E., Herter, J., & Martinich, J. (2010) Assessing Sea-Level Rise
Impacts: A GIS-Based Framework and Application to Coastal New Jersey. Coastal Management,
38(4): 433–455. doi:10.1080/08920753.2010.496105
Neumann, J., Hudgens, D., Herter, J., & Martinich, J. (2011) The economics of adaptation along
developed coastlines. Wiley Interdisciplinary Reviews: Climate Change, 2(1): 89–98.
doi:10.1002/wcc.90
Nicholls, R., Tol, R. S. J., & Vafeidis, A. T. (2008) Global estimates of the impact of a collapse
of the West Antarctic ice sheet: an application of FUND. Climatic Change, 91(1-2): 171–191.
Olshansky, R. B., Hopkins, L. D., & Johnson, L. A. (2012) Disaster and recovery: Processes
compressed in time. Natural Hazards Review, 13(3): 173-178.
Openshaw, S. (1984) The modifiable areal unit problem in: Concepts and Techniques in Modern
Geography. Monograph series, Vol. 38, Geo Books London (41 pp).

25
Peters A and Fisher P (2001) The Failures of Economic Development Incentives, Journal of the
American Planning Association,70 (1): 27-37.
Pfeffer, W. T., Harper, J. T., & O’Neel, S. (2008) Kinematic constraints on glacier contributions
to 21st-century sea-level rise. Science, 321(5894): 1340–1343.
Rahmstorf, S. (2007) A semi-empirical approach to projecting future sea-level rise. Science,
315(5810): 368.
Rygel, L., O’Sullivan, D., & Yarnal, B. (2006) A method for constructing a social vulnerability
index: an application to hurricane storm surges in a developed country. Mitigation and
Adaptation Strategies for Global Change, 11(3): 741–764.
Vilibić, I., Šepić, J., & Gaxotte, Z. A. (2012) Coherent patterns in long-term sea-level variability
trends derived from long-term tide gauge measurements. International Journal of Climatology.
Retrieved from http://onlinelibrary.wiley.com/doi/10.1002/joc.3449/full
Willis, J. K., & Church, J. A. (2012) Regional sea-level projection. science, 336(6081): 550–551.
Wood, N. J., Burton, C. G., & Cutter, S. L. (2010) Community variations in social vulnerability
to Cascadia-related tsunamis in the US Pacific Northwest. Natural Hazards, 52(2): 369–389.
Woodworth, P. L., & Blackman, D. L. (2004) Evidence for systematic changes in extreme high
waters since the mid-1970s. Journal of Climate, 17(6): 1190–1197.
Woodworth, Philip L., Menéndez, M., & Gehrels, W. R. (2011) Evidence for century-timescale
acceleration in mean sea levels and for recent changes in extreme sea levels. Surveys in
geophysics, 32(4-5):603–618.

26
Figure captions:
Figure 1: Exposure at different elevation levels: a. Residential floorspace, b. residential
building value, c. inhabitants at risk, and d. socially vulnerable population
Figure 2: Break-point analysis in selected municipalities:
Top part represents property vulnerability: M- floor space vulnerability V- property value (in
absolute terms). Bottom part represents societal vulnerability: P - total inhabitants S - composite
index vulnerability. Dark grey denotes high and light gray low vulnerability.

27
Figure 3: Spatial heterogeneity of property and Social vulnerability in southern Tel Aviv
and Yafo