coal mine safety: do unions make a difference?
DESCRIPTION
Morantz, 2012: "[M]ost empirical studies of the relationship between unionization and important safety outcomes, such as injuries and fatalities, have failed to find statistically significant evidence of a “union safety effect”TRANSCRIPT

Electronic copy available at: http://ssrn.com/abstract=1846700
Coal Mine Safety: Do Unions Make a Difference?
Alison D. Morantz‡
ABSTRACT:
Although the United Mine Workers of America (UMWA) has always advocated strongly for miners’ safety, prior empirical literature contains no evidence that unionization reduced mine injuries or fatalities during the 1970s and ‘80s. This study uses a more comprehensive dataset and updated methodology to examine the relationship between unionization and underground, bituminous coal mine safety from 1993 to 2010. I find that unionization predicts a substantial and significant decline in traumatic injuries and fatalities, the two measures that I argue are the least prone to reporting bias. These disparities are especially pronounced among larger mines. My best estimates imply that overall, unionization is associated with a 13-30% drop in traumatic injuries and a 28-83% drop in fatalities. Yet unionization also predicts higher total and nontraumatic injuries, suggesting that injury reporting practices differ between union and nonunion mines.
‡ Professor of Law & John A. Wilson Distinguished Faculty Scholar, Stanford Law School, Crown Quadrangle, 559 Nathan Abbott Way, Stanford, CA 94305-8610, phone 650-725-5256, email: [email protected]. This project was funded by a contract from the Centers for Disease Control and Prevention - National Institute of Occupational Safety and Health (Contract # 200-2009-28820). I am deeply grateful to Ben Schneer, Brian Karfunkel, Charlie Wysong, Patrick Leahy, Tim Hyde, Nipun Kant, and Nathan Atkinson for skilled research assistance. Dick Craswell, John Donohue, Mark Glickman, Daniel Ho, Sandy Jencks, Daniel Kessler, Jeffrey Kohler, Dennis O'Dell, Brian Sanson, Phil Smith, Jeff Strnad, David Weil, workshop participants at the 2010 Conference for Empirical Legal Studies, the University of Chicago's Law and Economics Workshop, Harvard University's Multidisciplinary Program in Inequality & Social Policy, and the University of Texas Law School’s Law, Business, and Economics Workshop; and three anonymous referees for the Industrial and Labor Relations Review also provided invaluable input and comments. I am also grateful to George Fesak and Chad Hancher of the Mining Safety and Health Administration, and to Vlad Dorjets, Fred Freme, and William Watson at the Department of Energy's Energy Information Administration, for their patient and gracious assistance in providing me with the data upon which the study is based. Finally, I am indebted to Dr. Mark Cullen of Stanford University's School of Medicine for helping me isolate the group of "traumatic" injuries upon which much of the empirical analysis rests.

Electronic copy available at: http://ssrn.com/abstract=1846700
Empirical literature on the relationship between unionization and workplace safety
presents a curious puzzle. On one hand, lscholars have documented numerous ways in which
unions help to promote safe work practices. For example, unions typically play a critical role in
educating workers about on-the-job hazards; incentivizing workers to take greater care on the
job; attracting more safety-conscious workers; inducing employers to abate known hazards;
increasing regulatory scrutiny; and developing safety-related innovations. Yet most empirical
studies of the relationship between unionization and important safety outcomes, such as injuries
and fatalities, have failed to find statistically significant evidence of a “union safety effect”
(Morantz 2009).
Prior research on the coal mining industry typifies this perplexing pattern. Coal miners’
unions, especially the dominant United Mine Workers of America (UMWA), have advocated
vigorously for improved worker safety since their inception. When the UMWA adopted its first
constitution in 1890, for example, three of its “Eleven Points” called for improvements in the
safety and health conditions of miners (Fox 1990:22-25). Organized labor was also instrumental
in the passage of the Mining Safety and Health Act of 1969 (the “Coal Act”), the statute that
paved the way for comprehensive federal enforcement of occupational safety regulations at all
surface and underground coal mines (Fox 1990:470-73). More recently, the UMWA played a
critical role in broadening the provisions of the Coal Act and encouraging the formation of state
regulatory agencies (Fox 1990:462-470, 474, 504). By the 1980s, the UMWA’s Health and
Safety Department had developed an extensive tripartite structure including a Washington, D.C.-
based international staff; regionally-based health and safety representatives tasked with liaising
with Mining Safety and Health Administration (MSHA) District Offices; and mine-level health
and safety committees that surveil day-to-day mine conditions. The myriad activities of mine-
level health and safety committees include advocating on behalf of individual miners; conducting
independent inspections; accompanying MSHA inspectors during inspections; participating in
pre- and post-inspection meetings; tracking MSHA appeals; providing various forms of safety
training; and, in extreme cases, shutting down hazardous sections of a mine, a power conferred
by the UMWA’s collective bargaining agreement with the Bituminous Coal Operator’s
Association (BCOA) (Weil 1987: 117). Nevertheless, most empirical studies focusing on the
1970s and ‘80s have reported, if anything, a counterintuitive positive relationship between a
union’s presence at a mine and the frequency of reported injuries and accidents.
1

Electronic copy available at: http://ssrn.com/abstract=1846700
This paper re-examines the link between unionization and mine safety using more recent
data, a broader set of control variables, and updated statistical techniques. Highly granular
MSHA data on injuries and mine characteristics, combined with data from the National Institute
for Occupational Safety and Health (NIOSH) and confidential data obtained from the
Department of Energy, enable me to examine whether several discrete safety outcomes differ
significantly between union and nonunion mines. Focusing on underground mines that extract
bituminous coal, I find that unionization is robustly associated with lower levels of traumatic
injuries and fatalities, the two safety outcomes that I argue are the least prone to reporting bias.
My best estimates imply that overall, unionization predicts a 13-30% drop in traumatic injuries
and a 28-83% drop in fatalities.1
These effects are especially pronounced among larger mines
and, for traumatic injuries, after the mid-1990s. At the same time, however, unionization is
associated with a significant increase in total and non-traumatic injuries, measures that are
highly susceptible to reporting bias. Taken together, these findings lend credence to concerns
that injury reporting practices vary significantly across union and nonunion settings.
Literature Review
In the past few decades, scholars have examined the relationship between unions and
workplace safety in a wide range of industries, such as the U.S. construction sector
(Dedobbeleer, Champagne, and German 1990), U.S. manufacturing (Fairris 1995), British
manufacturing (Reilly, Paci, and Holl 1995, Nichols, Walters, and Tasiran 2007), forest product
mills in British Columbia (Havlovic and McShane 1997), and the New Jersey public sector
(Eaton and Nocerino 2000). Most such studies have failed to find a statistically significant
negative relationship between unionization and the frequency of workplace accidents. Similarly,
empirical scholarship relying on aggregate cross-industry data from the U.S., Canada, and Great
Britain has rarely reported any robust evidence of a salutary union effect. (Morantz 2009).
Given its inherent dangers, the mining sector has attracted a disproportionate share of
scholarly attention. Several recent historical studies suggest that if anything, unions improved
miners’ safety during the early twentieth century (Fishback 1986; 1987:324; Boal 2009).
However, empirical scholarship focusing on the decades after the passage of the Coal Act (1969)
1 These ranges represent 95% confidence intervals for the coefficients on the “union” indicator variables in the public-fields version of the baseline (hours worked) specification presented in Table 2.
2

has reached very different conclusions. Boden (1977:116) and Connerton (1978), the first two
empirical studies focusing on the latter part of the twentieth century, examine data from 1973-75
and 1974-75, respectively. Although neither study focuses specifically on unionization, both
include union status as a control variable and report that union mines experienced significantly
more disabling injuries, ceteris paribus, than their nonunion counterparts. A landmark study on
underground coal mines sponsored by the National Research Council (1982), examining data
from 1978-80, also briefly addresses the relationship between unionization and mine safety. The
authors observe that the positive statistical relationship between union status and disabling
injuries disappears when they confine attention to a measure of injuries that is less prone to
reporting bias than total injuries, and that a (negative) correlation between unionization and mine
fatalities also vanishes when one accounts for mine size.2
Appleton and Baker (1984), the first study to focus squarely on the effect of union status,
analyzes cross-sectional data from a single year (1978) culled from 213 mines in eastern
Kentucky and western Virginia. Controlling for several mine-specific covariates, the authors
report that both total injuries and relatively serious injuries are significantly higher at union
mines. They hypothesize that the union job-bidding system and/or union miners’ postulated
lower job motivation and productivity could explain these results. Several later commentators
(Bennett and Passmore 1985; Weeks 1985) critique Appleton and Baker’s conclusions by
pointing out limitations in their data and methodology.
On these grounds, the authors suggest
that there is no relationship at all between unionization and underground coal mine safety (NRC
1982:95-96).
In sum, scholars have generally reported a positive relationship, if any at all, between
union status and reported mining inuries since the New Deal. There are, however, several
2 “Intermediate” injuries, adjudged by the study’s authors to be the least prone to reporting bias, are defined to comprise “all fatal and permanent disability injuries as well as all injuries resulting from roof/side falls, machinery, haulage, or electrical/explosive accidents” (NRC 1982:82). The report states, “The rationale for defining [the intermediate injury rate] rested on the belief that reporting inconsistencies would occur most frequently for the degree 3-5 material handling and slipping/bumping injuries. Consequently, for consistency in reporting, [the intermediate injury rate] is felt to lie somewhere between the [fatality and permanent disability rate], where reporting differences are felt to be negligible, and the [disabling injury rate], where they might not be. We thus regard [the intermediate injury rate] as a compromise measure of safety that includes ample numbers of injuries for most statistical purposes and provides for reasonably good consistency between mines in the reporting of injuries” (NRC 1982:83-84). As a robustness check, this paper’s Companion Website (http://amorantz.stanford.edu/papers/union-coal-mine-safety/) reports results from models in which the dependent variable is the number of intermediate injuries. Although the estimated coefficients are not dissimilar from those presented for traumatic injuries in Table 2, none is statistically significant at the 5% level.
3

compelling reasons to question the accuracy and contemporary relevance of these findings.
First, as Appleton and Baker (1984:140) point out, the accident reporting system in use
before 1978 suffered from extremely poor reporting practices, and therefore underreporting of
injuries by nonunion mines could have biased the results of Boden (1977) and Connerton (1978).
Second, most prior scholarship relies upon data that is geographically restricted, highly
aggregated, time-invariant, and/or prone to small-sample bias. For instance, the 213 mines
analyzed in Appleton and Baker (1984) were restricted to a single geographic region and
comprised less than 10% of all coal mines that were active in 1978.
Third, all of the statistical analysis in prior studies consists of ordinary least squares
regression modeling. Under standard assumptions, Poisson and negative binomial models yield
less biased estimates, and therefore have become the preferred approach for analysis of “count
data” such as injuries and fatalities (Cameron and Trivedi 1998:1-3).
Finally, the labor strife that characterized most of the 1970s, which included periodic
strikes and work stoppages, may have limited unions’ capacity to improve safety practices.
Although Appleton and Baker limit their study of bituminous mining to what they characterize as
a single “non-strike year” (1978) in the hopes of circumventing this problem, government
statistics indicate that 414 bituminous coal mine strikes took place in 1978 and that the national
labor-management climate remained highly adversarial (Staats 1981: 12-25; Darmstadter 1997:
27-31). Moreover, even if unions were relatively ineffectual during the 1970s, their impact may
have changed in recent decades, as the UMWA become more familiar with MSHA’s regulatory
procedures and expanded the scope of its internal health and safety programs (Weil 1994: 197).
In short, analysis of recent data may not only bear more directly on unions’ contemporary
relevance, but may also yield more credible estimates of their long-term effect. To my
knowledge, no study has directly investigated the relationship between unionization and mine
safety since 1980.3
The goal of the present article is to fill this gap in the literature by examining the 1993-
2010 period with comprehensive, granular data and up-to-date econometric methods. I pose, in
turn, a series of questions regarding the relationship between unionization and mine safety during
this period. First, are there statistically significant disparities, ceteris paribus, between the rates
3 Reardon (1996) analyzes coal mining data from 1986-88, but he does not compare the probabilities of accidents occurring across union and nonunion settings. Rather, he focuses on the probability that a reported accident has already resulted (or will likely result) in a fatality or permanently disabling injury.
4

of occupational injuries in union and nonunion coal mines? Second, do such disparities persist if
one focuses on measures of injury rates that are relatively impervious to reporting bias? Third,
have the disparities remained constant, or have they fluctuated over time? Finally, what might
explain these empirical findings?
Data
The analysis presented here relies primarily on MSHA’s historical database from 1993-
2010. This database includes quarterly data on the characteristics of each coal mine under
MSHA’s purview and on each accident or injury that was reported to MSHA during this period.
Although enormously detailed, the dataset has two important limitations. First and foremost, it
contains little information on the union status of individual mines. Although MSHA originally
collected data on unionization, the survey fell into disuse by the 1990s and historical records on
union status were not preserved.4
To remedy these shortcomings, I supplement the MSHA database with information
obtained from NIOSH and the Department of Energy’s Energy Information Administration
(EIA). The EIA database encompasses every mine in the U.S. that produces an appreciable
amount of coal.
In 2007 MSHA conducted a one-time survey of mines in an
effort to identify which ones were operating under union contracts, and in what year those mines
became unionized. Using these data, one can obtain a snapshot of the union status of U.S. mines
in 2007. However, it is impossible to determine whether any given mine was unionized in prior
years and, if so, for how long. Secondly, although the MSHA database contains comprehensive
data on coal production and employment, it lacks information on each mine’s geological
characteristics (such as mean coal bed thickness), economic constraints (such as whether it is a
subsidiary of a larger firm), and predominant extraction methods (such as the relative prevalence
of longwall, shortwall, continuous, and conventional mining).
5 Most importantly for my purposes, the EIA database contains a “union ID”
field indicating whether each mine was unionized in a given year and, if so, by which union.6
4 Phone conversation with MSHA’s George Fesak, Director of Program Evaluation and Information Resources, on 8/14/08.
5 According to the EIA Coal Production and Preparation Report (Form EIA-7A), the EIA collects data annually on mines with operations that “produced and/or processed 10,000 or more short tons of coal and/or worked 5,000 hours or more during the reporting year.” Of our sample (from MSHA) of underground, bituminous coal mines with active production for the years 1993-2010, 0.41% of mine-years do not have corresponding EIA data. These observations were dropped from the dataset. 6 The EIA considers this data unreliable prior to 1993 (Phone Conversation with Vlad Dorjets, Lead Economist at
5

The data also contain detailed information on the geological and economic characteristics of
each mine, including the number of coal beds, the thickness of each coal bed, the value of
captive and open production, productive capacity, recoverable reserves, and (for underground
mines) the share of production attributable to conventional, continuous, longwall, shortwall, and
other mining methods.7 Finally, the NIOSH dataset contains an alternative (binary) measure for
whether or not a mine utilizes longwall mining.8
I restrict the sample in several ways to ensure that the attributes of the union and
nonunion mines being compared are as similar as possible.
Merging the MSHA, EIA, and NIOSH datasets
allows me to assemble a detailed picture of safety-related outcomes at each union and nonunion
coal mine in the country between 1993 and 2010. (Precise definitions of the variables included in
this final dataset, along with their respective sources, are presented in Appendix C.)
9 First, like most previous scholars, I
confine my analysis to underground coal mines. (Surface coal mines, which have very different
risk profiles and production characteristics, are also much less likely to be unionized.) Secondly,
since none of the underground anthracite and lignite coal mines in the dataset operated under a
union contract, I restrict the sample to bituminous coal mines. Third, I drop any mine-quarters in
which a mine reported zero coal production and/or zero hours worked.10
Once these restrictions are imposed, the final sample contains 2,635 mines,
11
EIA, on 2/25/2010). Since the EIA’s union data are reported annually, whereas MSHA’s injury data are reported quarterly, I make the simplifying assumption that the union status recorded for a particular year applies to all four quarters of that year.
each of
7 Since some of these variables are considered trade secrets by the mines that provide them, I obtained these data on a confidential basis. EIA staff indicated that two of these variables, recoverable reserves and percent captive production, are unreliable before 1998 (E-mail correspondence with William Watson, EIA, 12/7/2010). Results including these confidential fields are presented in the “confidential-fields” specifications for 1998 onwards. 8 Because of the uncertainty surrounding which way of coding each mine’s extraction method is more accurate – the multifaceted approach used by MSHA, or the binary approach used by NIOSH – I estimate models that include (respectively) each measure as a regressor. 9 As a robustness check, I refine the sample further using matching methods and re-estimate the models. The purpose of this procedure, as described by Ho et al. (2007), is to balance the distributions of the covariates across the “treatment” and “control” groups. The “balanced” sample consists of 11,378 mine-quarters for which the estimated likelihoods of unionization are similarly distributed across the union and nonunion subsamples. Although results for this sample, available on the Companion Website (http://amorantz.stanford.edu/papers/union-coal-mine-safety/), generally echo those presented in the Results section, all of the coefficients in the fatality models lose statistical significance. 10 While injuries occur occasionally when a mine is not producing coal, the underlying causes of such accidents are likely to differ from those that occur during active production. Out of 42,586 initial mine-quarters, 3,696 (8.7%) reported zero coal production and/or zero hours worked; these were dropped from the analysis. 11 Because a mine that is unionized for part of the sample period and nonunionized for part of the sample period is counted in Appendix Table A1 as both a union mine and a nonunion mine, some mines are double-counted, for a total of 2,799 mines. The total number of mines used in the baseline regressions is 2,635. The difference between these two numbers, 164 mines, represents the number of mines that switched union status at some point during the
6

which was active, on average, for 15 of the 72 quarters under observation.12
Each injury report submitted to MSHA contains information on the nature and source of
the injury, the body part(s) affected, the activity in which the employee was engaged when the
incident occurred, and the severity of the injury (ranging from “first aid” to “fatality”). Using
these fields, I tabulate four different injury counts: fatal injuries (“fatalities”), “traumatic”
injuries,
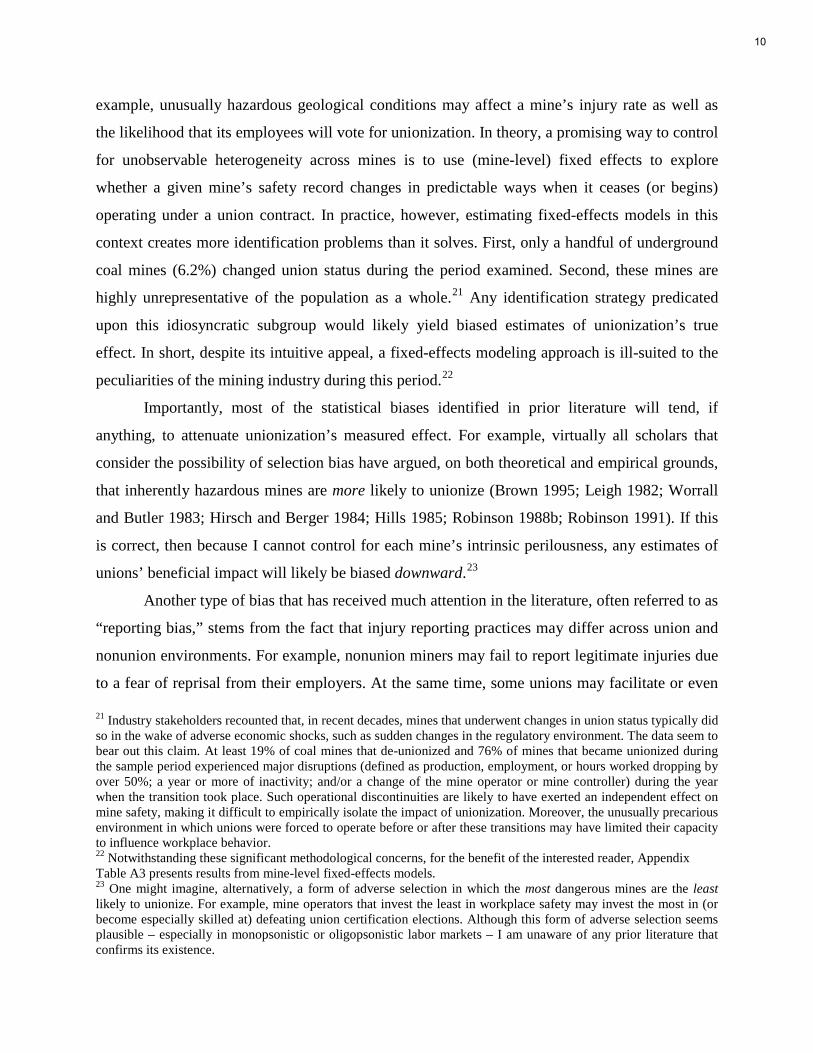
Figure 1 shows the
geographical distribution of the mines in the sample. While the mines are spread across 17 states,
89% are located in the coal mining regions of Kentucky, Pennsylvania, West Virginia, and
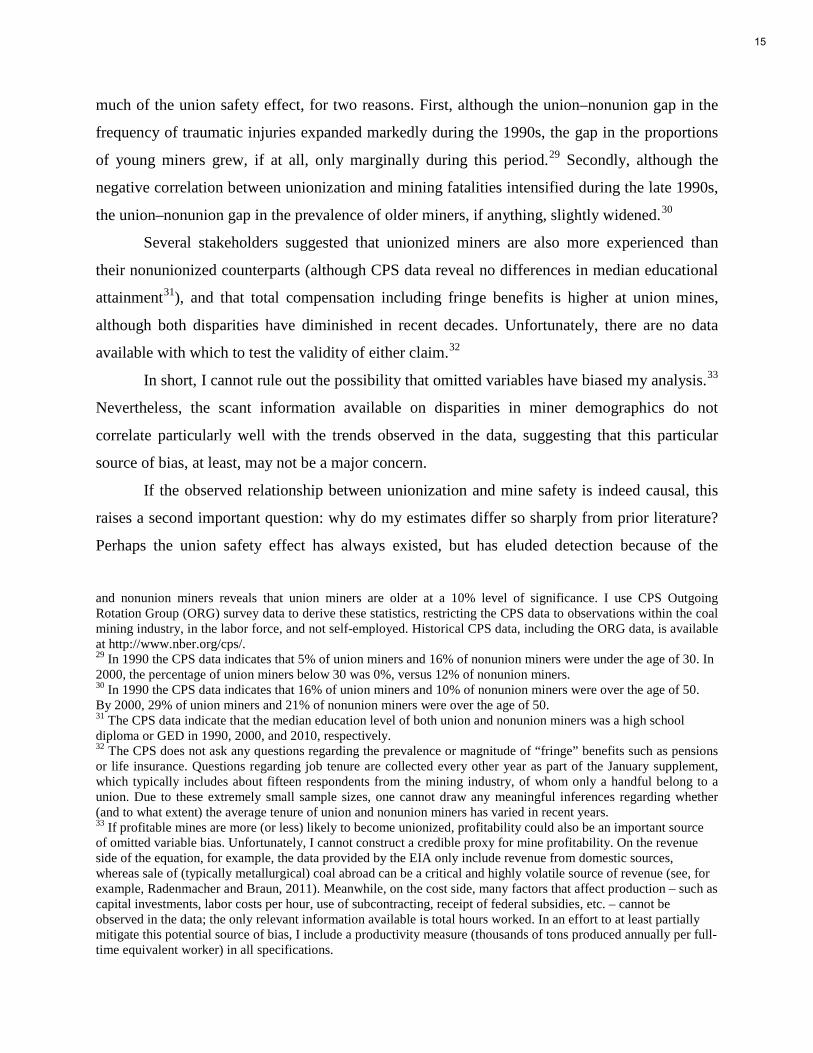
Virginia. Figure 2 displays the percentage of active mines that were unionized in each quarter.
Mirroring the general trend for most U.S. industries, the unionization rate declined steadily, from
18.7% in 1993 to 9.2% in 2010.
13 “non-traumatic” injuries,14 and total injuries. For each tabulation, I include only
injuries that occurred in the underground subunit of a mine.15
sample period. The latter group of 164 mines comprises the sample in the fixed effects models in Appendix Table A3. Also, because the historical variables (lost-work injuries and penalty points) are summed up for the previous four quarters for the non-traumatic, total, and traumatic injuries regressions, but are summed up for the previous calendar year for the fatality regressions, some mines are excluded from the fatality models but included in the other models. (For example, if a mine is open for all of only one calendar year, it will have no historical data at the yearly level, but it will have historical data for three of the four quarters it was open.) For this reason, the sample used for the fatality models contains only 2,568 mines.
Table 1 presents injury counts (and
percentages) for both union and nonunion mines. Although fatalities uniformly comprise a very
12 The underground coal mining industry exhibits high rates of entry and exit due to fluctuating demand and costs of production. For example, out of 884 mines that were active in the first quarter of 1993, only 16% were still active in the first quarter of 2000 and only 6% remained active in the final quarter of 2010. Similarly, out of 421 mines that were active in the final quarter of 2010, only 22% had been active in the first quarter of 2000, and only 11% had been active in the first quarter of 1993. 13 Because a “traumatic” injury, by definition, is caused by a discrete accident that a miner sustains during working hours, its work-relatedness is rarely in dispute as long as the miner’s account of the incident is deemed credible. In contrast, the diagnosis of non-traumatic injuries, such as cumulative or repetitive-motion injuries, often relies on the patient’s self-report of subjective symptoms. Because the existence – let alone the work-relatedness – of the latter injuries may be difficult to verify using “evidence-based medicine,” the frequency with which such claims are filed and approved can vary widely across employers. The category of “traumatic” injuries, intended to encompass the subset of injuries that are the least prone to underreporting, was defined in consultation with Professor Mark Cullen, M.D., the Chief of Stanford University’s Division of General Internal Medicine. According to Dr. Cullen, the critical determining factor in determining whether or not an injury is reported is not the triggering cause of the injury, but rather the characteristics of the injury itself. More specifically, injuries of at least moderate severity, whose effects are readily visible, that are “traumatic” (rather than cumulative) in nature are generally the least prone to reporting bias. The following injuries were deemed by Dr. Cullen to meet these criteria: amputations; enucleations; fractures; chips; dislocations; foreign bodies in eyes; cuts and lacerations; punctures; burns/scalds; crushings; and chemical, electrical, and laser burns. Fatalities of any type are also treated as traumatic injuries. So defined, “traumatic” injuries account for 37.5% of the injuries reported during the period of observation. 14 All injuries that are not classified as “traumatic” injuries are classified as “non-traumatic” injuries. 15 As a robustness check, I also estimate models that include all injuries occurring at underground mines, including those that take place above ground. Presented on the Companion Website, these results do not materially change my findings.
7

small fraction (0.3-0.6%) of total accidents, the fraction of non-traumatic injuries is typically
higher at union mines than at nonunion mines (69.9% versus 58.1%).
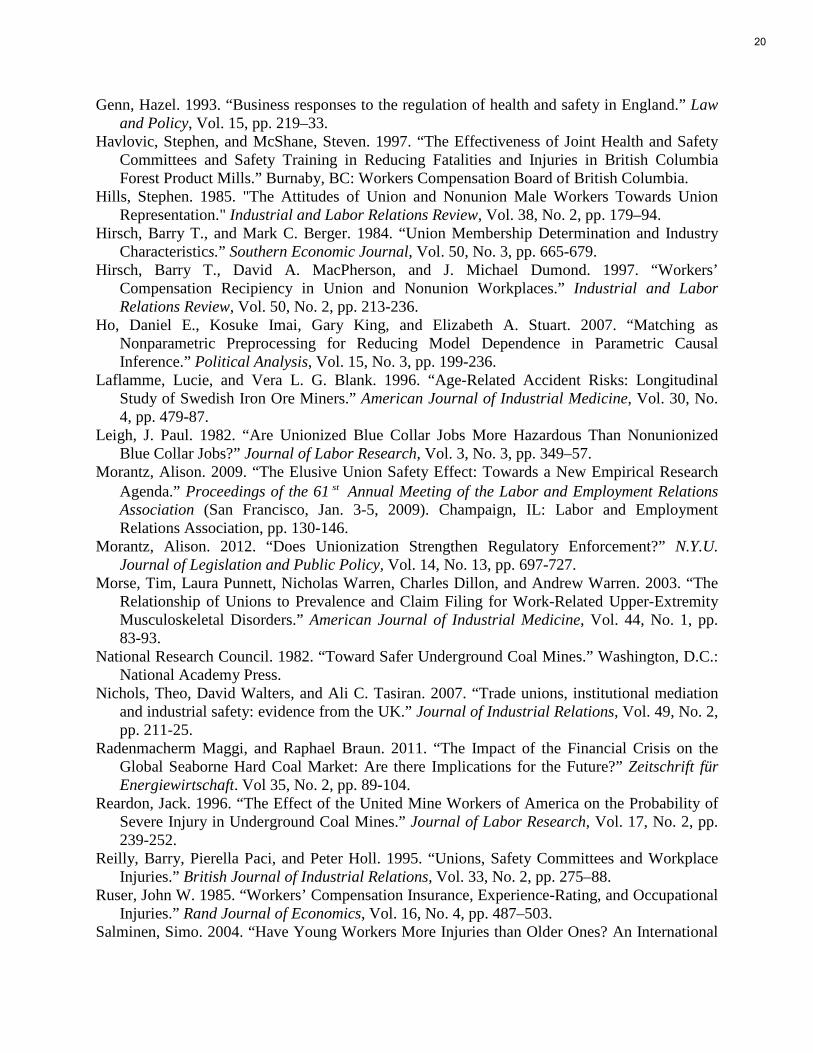
Figure 3 provides a preliminary comparison of recent trends across union and nonunion
mines by plotting, respectively, the frequencies of total and traumatic injuries (per 2,000 hours
worked) from 1993 to 2010. Two general patterns are apparent. First, regardless of union status,
the frequency of traumatic injuries has remained relatively constant over time, whereas the
frequency of total injuries has declined steadily since the early 1990s. Secondly, although the
direction and magnitude of the union-nonunion disparity fluctuated by year and injury type in the
early 1990s, by the turn of the millenium, union mines were reporting lower injury rates than
nonunion mines regardless of the metric examined.
Methodology
To explore the relationship between union status and safety outcomes, I estimate negative
binomial regression models in which the dependent variables are, respectively, total injuries,
non-traumatic injuries, traumatic injuries, and fatalities.16 The total number of hours worked is
used as an exposure term, and standard errors are clustered at the mine level. In addition to a
dummy variable indicating the presence of a union, I include several other covariates (listed in
the Appendix) that, based on prior literature and/or conversations with industry stakeholders, are
deemed likely to affect mine safety. This article presents results from several leading models.
Two different versions of three model specifications were estimated, for a total of six
specifications. The two versions differ in that the “public-fields” version relies solely on public
data, whereas the “confidential-fields” version incorporates confidential data from EIA.17 The
first model specification uses full-time equivalents (FTEs)18 as the measure of mine size. Since it
is conventional to use FTEs to calculate the frequency of workplace accidents, this is designated
as the “baseline” specification, as in Morantz (2012). The second and third specifications use
employees19 and coal tonnage20
16 Tests of overdispersion consistently indicate that a negative binomial model is preferable to a Poisson model.
as alternative measures of mine size.
17 See Appendix B for a complete description of model specifications. 18 Yearly FTEs are defined as 2,000 hours worked, and quarterly FTEs are defined as 500 hours worked. 19 MSHA defines employees as the average number of persons working during each pay period of a given quarter, rounded to the nearest whole number (see http://www.msha.gov/stats/part50/rptonpart50.pdf). Results presented here include only employees working in the underground subunit. On the Companion Website, I present results from a robustness check in which I include all injuries at underground mines, regardless of whether the injuries occurred
8

Several studies by Weil (1987:181-84; 1991:23; 1992:124-25) suggest that unions’
effects on workplace safety vary by employer size. For example, unions at large and small
facilities may differ in their respective capacities to exercise their “walk around” rights during
MSHA inspections; to form powerful health and safety committees; to independently conduct
inspections; and to enforce open-door policies among safety and health personnel. To explore
whether unions’ impact varies by mine size, I fit several models including interaction terms
between union status and mine size quartiles.
The final public-fields specification includes the following regressors: union dummy,
mine size, union-size interaction term(s), logged controller size, mine age, mine productivity,
number of lost-work injuries (in hundreds) in the previous four quarters (or in the previous year
for fatality regressions), total penalty points (in thousands) in the previous four quarters (or in the
previous year for fatality regressions), a constant term, dummies indicating presence of each type
of mine subunit, quarter dummies, MSHA district dummies, and a longwall indicator. The
confidential-fields version replaces the longwall indicator with mining method percentages and
adds as regressors the number of coal beds, mean coal bed thickness (in yards), subsidiary
indicator, captive production as a percentage of total production, and recoverable coal reserves.
Appendix Table A1 presents descriptive statistics for each included covariate.
For total, traumatic, and non-traumatic injuries, I use the most granular time period
available, the “mine-quarter,” as the unit of analysis. However, because fatalities are such rare
events, using quarterly data is problematic when modeling fatality counts. (There is often too
little variation across observations to yield valid estimates.) Therefore, I use the “mine-year” as
the unit of analysis in all fatality regressions.
By including a broader set of covariates than has been used in previous studies, I hope to
minimize omitted variable bias. Nevertheless, there are several potentially confounding
characteristics of union and nonunion miners – such as disparities in miners’ demographics and
remuneration levels – for which I cannot control. These limitations, including their implications
for the interpretation of my findings, are discussed in the Interpretation section.
Other types of unobservable, mine-level heterogeneity could also bias my analysis. For
above or below ground. For purposes of these models, I consider all employees in the mine – not just those working in the underground – when calculating mine size. 20 Tonnage is defined here as the total tons of coal produced in the underground subunit of a mine. On the Companion Website, I present robustness checks in which all injuries (regardless of subunit) are included in the model; for these purposes, I similarly define tonnage as total tons produced across all subunits.
9
example, unusually hazardous geological conditions may affect a mine’s injury rate as well as
the likelihood that its employees will vote for unionization. In theory, a promising way to control
for unobservable heterogeneity across mines is to use (mine-level) fixed effects to explore
whether a given mine’s safety record changes in predictable ways when it ceases (or begins)
operating under a union contract. In practice, however, estimating fixed-effects models in this
context creates more identification problems than it solves. First, only a handful of underground
coal mines (6.2%) changed union status during the period examined. Second, these mines are
highly unrepresentative of the population as a whole.21 Any identification strategy predicated
upon this idiosyncratic subgroup would likely yield biased estimates of unionization’s true
effect. In short, despite its intuitive appeal, a fixed-effects modeling approach is ill-suited to the
peculiarities of the mining industry during this period.22
Importantly, most of the statistical biases identified in prior literature will tend, if
anything, to attenuate unionization’s measured effect. For example, virtually all scholars that
consider the possibility of selection bias have argued, on both theoretical and empirical grounds,
that inherently hazardous mines are more likely to unionize (Brown 1995; Leigh 1982; Worrall
and Butler 1983; Hirsch and Berger 1984; Hills 1985; Robinson 1988b; Robinson 1991). If this
is correct, then because I cannot control for each mine’s intrinsic perilousness, any estimates of
unions’ beneficial impact will likely be biased downward.
23
Another type of bias that has received much attention in the literature, often referred to as
“reporting bias,” stems from the fact that injury reporting practices may differ across union and
nonunion environments. For example, nonunion miners may fail to report legitimate injuries due
to a fear of reprisal from their employers. At the same time, some unions may facilitate or even
21 Industry stakeholders recounted that, in recent decades, mines that underwent changes in union status typically did so in the wake of adverse economic shocks, such as sudden changes in the regulatory environment. The data seem to bear out this claim. At least 19% of coal mines that de-unionized and 76% of mines that became unionized during the sample period experienced major disruptions (defined as production, employment, or hours worked dropping by over 50%; a year or more of inactivity; and/or a change of the mine operator or mine controller) during the year when the transition took place. Such operational discontinuities are likely to have exerted an independent effect on mine safety, making it difficult to empirically isolate the impact of unionization. Moreover, the unusually precarious environment in which unions were forced to operate before or after these transitions may have limited their capacity to influence workplace behavior. 22 Notwithstanding these significant methodological concerns, for the benefit of the interested reader, Appendix Table A3 presents results from mine-level fixed-effects models. 23 One might imagine, alternatively, a form of adverse selection in which the most dangerous mines are the least likely to unionize. For example, mine operators that invest the least in workplace safety may invest the most in (or become especially skilled at) defeating union certification elections. Although this form of adverse selection seems plausible – especially in monopsonistic or oligopsonistic labor markets – I am unaware of any prior literature that confirms its existence.
10

encourage the reporting of fraudulent or exaggerated claims (Hirsch, MacPherson, and Dumond
1997; Morse et al. 2003). Even in the absence of outright employer intimidation or employee
fraud, institutional norms may differ regarding what “counts” as a compensable occupational
injury. For example, Azaroff, Levenstein, and Wegman (2002) suggest that attitudinal barriers
that impede the detection and reporting of injuries are weaker in unionized workplaces,
especially for injuries that are relatively minor and/or hard to diagnose. In apparent support of
this hypothesis, Hirsch, MacPherson, and Dumond (1997) and Morse et al. (2003) find that even
among those who self-report similar rates of occupational injuries, union workers are more likely
to receive workers’ compensation benefits. In short, reporting bias may also diminish the
measured impact of unionization.
Fortunately, my data enable me to explore the magnitude of reporting bias indirectly by
examining four different injury categories that vary in their relative susceptibility to such bias:
non-traumatic injuries, total injuries, traumatic injuries, and fatalities. As illustrated in Figure 4,
non-traumatic injuries are hypothesized to be the most prone to reporting bias because they (by
definition) include cumulative injuries whose work-relatedness is often difficult to confirm. At
the opposite end of the continuum are workplace fatalities, which are virtually impossible to hide
from authorities and regulators. The remaining two measures – total and traumatic injuries – fall
in between these two extremes. Total injuries are less prone to reporting bias than non-traumatic
injuries because they include fatalities and severe traumatic injuries. Traumatic injuries are
hypothesized to be even less susceptible to reporting bias than total injuries since they exclude
cumulative injuries.
If there is significant reporting bias across union and nonunion mines, the union safety
effect (if any) should appear strongest in the fatality rate models; weaker in the traumatic injury
rate models; weaker still in the total injury rate models; and weakest of all in the non-traumatic
injury rate models. In other words, union status should predict more and more injuries as the
focus of inquiry shifts from fatalities, to traumatic injuries, to total injuries, and finally to non-
traumatic injuries. The following section summarizes my main findings, but space constraints
preclude me from presenting detailed results from each and every model specification and
robustness check that was performed. For the benefit of the interested reader, the Companion
Website24
24 See
presents a variety of extra specifications and robustness checks.
http://amorantz.stanford.edu/papers/union-coal-mine-safety/
11

Results
Tables 2-4 present the study’s main findings for the four different outcomes examined:
non-traumatic injuries, total injuries, traumatic injuries, and fatalities. For ease of interpretation, I
transform each coefficient into an incident rate ratio (IRR), whereby a coefficient of 1 indicates
no change at all in predicted injuries; coefficients between 0 and 1 represent a predicted fall in
injuries (e.g. a coefficient of 0.97 represents an approximate 3% decline); and coefficients
greater than one represent predicted increases (e.g. a coefficient of 1.03 represents an
approximate 3% rise).
Results from the leading models presented in Table 2, which capture the average or “net”
effect of unionization across all mines and time periods, display a striking pattern. On one hand,
unionization is associated with a very sizable (more than 25%), robust, and statistically
significant increase in non-traumatic injuries across all specifications. The results for total
injuries are similar but more muted: the disparity is smaller in magnitude, when significant, and
is not robust across all specifications. Traumatic injuries, on the other hand, present a very
different picture; unionization is now associated with a sizable (more than 20%) and highly
significant decline in traumatic injuries across all specifications. Similarly, unionization is
associated with an even larger (more than 50%) fall in fatal injuries across all six specifications.
In short, the model results are broadly consistent with both of the hypotheses initially
posed. First and foremost, unionization is associated with a significant decline in those mine
accidents that are least vulnerable to reporting bias. Secondly, the dramatic extent to which
unions’ measured effect varies by injury type suggests that there are indeed significant
discrepancies in reporting practices across union and nonunion mines.25
Table 3 probes whether the trends observed vary by mine size. Although the analysis is
restricted to the baseline specification, the continuous mine-size term is replaced by discrete size
quartile dummies (defined such that a fourth of all mine-quarters fall into each quartile), and the
“union” and “union X size” terms are replaced with “union X size quartile” interaction terms. At
first glance, the results presented in Table 3 are surprising. Most prior scholarship suggests that
larger firms – regardless of union status – have the strongest intrinsic incentives to invest in
25 The fact that as noted in Table 1, traumatic injuries comprise a much smaller percentage of total injuries in union mines (30.1%) than in nonunion mines (41.9%) might also be construed as “circumstantial evidence” of reporting bias.
12

workplace safety (Weil 1987:124-28, Genn 1993:220-230, Fenn and Veljanovski 1988:1065;
Reilly, Paci, and Holl 1995:280; Ruser 1985:485; Frick and Walters 1998:368). Therefore, one
might expect unions’ impact on workplace safety to be the strongest among smaller mines. Yet
Table 3 reveals precisely the opposite trend: unionization’s depressive effect on traumatic and
fatal injuries is the greatest and most robust among larger mines. What might explain this
seemingly counterintuitive result? Perhaps unions are better equipped to influence workplace
safety and injury reporting policies in mines that exceed a certain size threshold. For example,
unions in small mines may find it difficult to establish active health and safety committees,
conduct independent inspections, and consistently accompany MSHA inspectors on their tours.
Finally, Table 4 probes changes over time by subdividing the analysis into three discrete
time periods (1993-1998, 1999-2004, and 2005-2010) using the baseline specification.26
Although not the focus of this study, the other covariates included as right-hand-side
variables reveal several interesting patterns. Appendix Table A2 displays expanded regression
coefficients for all of the baseline models. Although many of the estimated effects mirror those
of prior studies, some either conflict with previous estimates or illuminate relationships that prior
scholarship has not explored. The Companion Website discusses these and other ancillary
findings.
For both
non-traumatic and total injuries, the disparity between union and nonunion mines diminishes
over time. Traumatic injuries, however, display a different trend: although there is only a small
disparity across groups in the mid 1990s, unionization is associated with a significant and
sizable (more than 30%) decline in traumatic injuries in subsequent years. Fatal injuries reveal a
mixed pattern: although unionization is associated with a large (albeit only at a 10% level of
significance) decrease in fatalities around the turn of the century, the disparity shrinks and loses
statistical significance in later years. At least if one confines scrutiny to traumatic injuries, then,
the data suggest that the union safety effect could be a relatively recent phenomenon.
Interpretation
Taken at face value, my results are broadly consistent with three hypotheses regarding the
26 The data are broken into three time periods for clarity of presentation. Models with alternative time groupings, presented on the Companion Website, do not materially change the results for non-traumatic, total or traumatic injuries. The findings for fatal injuries, although differing somewhat from those presented here, are similarly equivocal.
13

relationship between unionization and coal mine safety. First, unionization may have improved
“real” mine safety levels (reflected in traumatic and fatal injury rates) several decades after the
passage of the Coal Act. Second, reporting bias has probably confounded prior studies of
unionization’s impact, especially when minor and non-traumatic injuries are included in injury
counts. Finally, in the latter half of the twentieth century, the union safety effect may not have
existed until the turn of the millenium.
Several important questions remain. First, what is the likelihood that omitted variable
bias has confounded my identification strategy?
One potentially consequential mine-level characteristic that I cannot observe is the age
distribution of the workforce. Epidemiological literature on the frequency of accidents by age is
thin and conflicting. Some studies suggest that younger and less experienced miners sustain more
injuries on the job (e.g. Laflamme and Blank 1996), but the scholarship is not unanimous on this
point. (See, for example, Souza 2009.) Based on a careful review of existing literature, Salminen
(2004) reports a bifurcated pattern, in which young workers are more susceptible to non-fatal
injuries and older workers are more prone to occupational fatalities. If the distribution of age or
experience differs substantially across union and nonunion mines – and if such age differentials
independently affect miners’ likelihood of sustaining traumatic or fatal injuries – this could bias
my results. Unfortunately, demographic variables are unavailable at the mine level, making it
difficult to verify the existence, let alone to estimate the magnitude, of such biases.27 The only
source that facilitates any age comparisons is the Current Population Survey (CPS), which
includes questions regarding age, occupation, and union membership. Although the small sample
size allows for only rough comparisons, the data suggest that the average miner is older today
than he was in 1990; that union miners are older than non-union miners; and that the latter
discrepancy has grown in recent decades.28
27 The decennial survey administered by the U.S. Census Bureau – even the “long” form administered to 5% of the population for the Public-Use Microdata Samples (PUMS) – contains no information on union membership. The U.S. Census Bureau’s Longitudinal Employer-Household Dynamics Program (LEHD) does contain mine-level demographic data. However, the LEHD dataset excludes Kentucky and Pennsylvania, which contain 43% of all underground, bituminous mines in the U.S., and data for West Virginia and Virginia – which contain an additional 46% of mines in our sample – are available only for 1997 onwards. Additionally, since the Census Bureau and MSHA use different employer identifiers, merging these two datasets would pose significant challenges. (Interview with Angela Andrus, Census Research Data Center, February 9, 2011; Interview with Emily Isenberg at the LEHD Program, U.S. Census, March 3, 2011.)
Yet this age differential seems unlikely to explain
28 For example, the typical (median) unionized miner was 41 in 1990; 46 in 2000; and 51 in 2010. In contrast, the median nonunion miner was 38 in 1990, 45 in 2000, and 45.5 in 2010. A t-test comparing the mean ages of union
14
much of the union safety effect, for two reasons. First, although the union–nonunion gap in the
frequency of traumatic injuries expanded markedly during the 1990s, the gap in the proportions
of young miners grew, if at all, only marginally during this period.29 Secondly, although the
negative correlation between unionization and mining fatalities intensified during the late 1990s,
the union–nonunion gap in the prevalence of older miners, if anything, slightly widened.30
Several stakeholders suggested that unionized miners are also more experienced than
their nonunionized counterparts (although CPS data reveal no differences in median educational
attainment
31), and that total compensation including fringe benefits is higher at union mines,
although both disparities have diminished in recent decades. Unfortunately, there are no data
available with which to test the validity of either claim.32
In short, I cannot rule out the possibility that omitted variables have biased my analysis.
33
If the observed relationship between unionization and mine safety is indeed causal, this
raises a second important question: why do my estimates differ so sharply from prior literature?
Perhaps the union safety effect has always existed, but has eluded detection because of the
Nevertheless, the scant information available on disparities in miner demographics do not
correlate particularly well with the trends observed in the data, suggesting that this particular
source of bias, at least, may not be a major concern.
and nonunion miners reveals that union miners are older at a 10% level of significance. I use CPS Outgoing Rotation Group (ORG) survey data to derive these statistics, restricting the CPS data to observations within the coal mining industry, in the labor force, and not self-employed. Historical CPS data, including the ORG data, is available at http://www.nber.org/cps/. 29 In 1990 the CPS data indicates that 5% of union miners and 16% of nonunion miners were under the age of 30. In 2000, the percentage of union miners below 30 was 0%, versus 12% of nonunion miners. 30 In 1990 the CPS data indicates that 16% of union miners and 10% of nonunion miners were over the age of 50. By 2000, 29% of union miners and 21% of nonunion miners were over the age of 50. 31 The CPS data indicate that the median education level of both union and nonunion miners was a high school diploma or GED in 1990, 2000, and 2010, respectively. 32 The CPS does not ask any questions regarding the prevalence or magnitude of “fringe” benefits such as pensions or life insurance. Questions regarding job tenure are collected every other year as part of the January supplement, which typically includes about fifteen respondents from the mining industry, of whom only a handful belong to a union. Due to these extremely small sample sizes, one cannot draw any meaningful inferences regarding whether (and to what extent) the average tenure of union and nonunion miners has varied in recent years. 33 If profitable mines are more (or less) likely to become unionized, profitability could also be an important source of omitted variable bias. Unfortunately, I cannot construct a credible proxy for mine profitability. On the revenue side of the equation, for example, the data provided by the EIA only include revenue from domestic sources, whereas sale of (typically metallurgical) coal abroad can be a critical and highly volatile source of revenue (see, for example, Radenmacher and Braun, 2011). Meanwhile, on the cost side, many factors that affect production – such as capital investments, labor costs per hour, use of subcontracting, receipt of federal subsidies, etc. – cannot be observed in the data; the only relevant information available is total hours worked. In an effort to at least partially mitigate this potential source of bias, I include a productivity measure (thousands of tons produced annually per full-time equivalent worker) in all specifications.
15

methodological shortcomings of and limited data used in prior work. Since complete data from
the 1970s no longer exist, I cannot replicate these early studies. However, when I analyze my
own data using a methodology similar to that of Appleton and Baker (1984), the results are
qualitatively not unlike those reported here, casting doubt on the possibility that findings
reported in early empirical scholarship were entirely spurious.34
If the latter conclusion is correct – and unions had little impact on mine safety until just
before the turn of the millinium – the question is why. There are several possibilities. First,
fluctuations over time in the stringency of MSHA’s enforcement scrutiny may affect union and
nonunion mines differently. For example, Weil (1987), examining data from the early 1980s,
finds that union mines were subject to more stringent enforcement scrutiny.
Alternatively, it could be that
unions did not, in fact, reduce mining hazards until decades after the Mine Act’s passage.
Although far from conclusive, the replication exercise suggests that the union safety effect may
indeed be a relatively recent phenomenon.
35 Examining data
from 1995-2009, Morantz (2012) finds that this disparity has persisted along several
dimensions.36
Secondly, unions may have shifted their institutional priorities in the 1990s, deliberately
choosing to forfeit potential wage increases in exchange for enhanced workplace safety. CPS
data do show some convergence in median (real) wages of union and nonunion miners since the
early 2000s. However, there are several reasons to doubt that the UMWA’s leadership has
If MSHA inspects union mines more intensively than nonunion mines – and if this
differential has widened over time – it could help explain the observed trends. However,
detailed comparison of the results presented here with those reported in Morantz (2012) casts
doubt on this hypothesis. Whereas the “union safety effect” described in the Results section is
strongest among large mines, the enforcement disparities reported in Morantz (2012) diminish
sharply with mine size.
34 See the Companion Website for a detailed description of my attempt to replicate Appleton and Baker’s methodology using my own dataset. 35 Weil (1987) finds that union mines are more likely to designate employee representatives; receive more frequent MSHA inspections of longer average duration; are granted shorter periods in which to abate violations; are granted fewer abatement extensions; receive more citations per inspection; pay higher penalties per violation; and are less successful in reducing penalty amounts through MSHA’s internal administrative appeals process than nonunion mines (pp. 120-185). 36 Morantz (2012) finds that unionization is associated with increases in regular inspection hours per mine quarter, total inspection hours per regular inspection, the proportion of total inspection hours spent onsite, and the proposed fine assessed for significant and substantial violations.
16

pursued such a strategy.37
Finally and most importantly, it may have taken time for the UMWA’s leadership to train
a cadre of union members capable of effectively exercising their contractual and newfound
statutory rights. In the words of one union official, “It can take a generation to institutionalize a
robust safety culture and build a corps of experienced miners who can train the newcomers.”
38
The labor strife that characterized much of the 1970s (and to a lesser extent the 1980s) likely
impeded unions’ capacity to enact meaningful changes. Weil (1994:199-200) has identified the
election of Rich Trumka in 1982 to the presidency of the UMWA as a critical turning point, after
which the union prioritized and funded the training of health and safety committee members. By
the late 1980s and early 1990s, under the leadership of Joseph Main, the UMWA’s Department
of Health and Safety took more systematic measures to train its rank and file, such as the
institution of local union training programs.39
In short, changes in the leadership and institutional
focus of the UMWA during the 1970s and ‘80s that were intended to increase the union’s long-
term impact on mine safety may not have borne fruit until the 1990s.
Conclusion
Although the United Mine Workers of America has always been a vigorous advocate for
miners’ safety, prior empirical literature has failed to detect any evidence of a union safety effect
on injury or fatality rates. If anything, prior scholarship has reported a puzzling negative
relationship between unionization and mine safety during the 1970s, the decade immediately
following the Coal Act’s passage. This study uses more comprehensive data and updated
statistical methods to re-examine the relationship between unionization and mine safety. I focus
37 First, according to the UMWA leadership, the disparity in benefits between union and nonunion miners has progressively widened even as the gap in hourly wages has narrowed. Therefore, they claimed, the true overall disparity in union–nonunion compensation has changed little in recent years. To the best of my knowledge, this assertion cannot be tested with available data. (Telephone conferences with Brian Sanson, May 21, 2010; and Phil Smith, May 28, 2010.) Second, the UMWA’s leadership explained that young miners that began entering the workforce in large numbers in the first decade of the 21st century are much less likely to have family members who are miners, or to have grown up in “mining towns” where explosions and collapses are part of the collective memory. As a result, they show relatively little interest in safety issues. As one official put it, “it has become very difficult to organize on safety issues.” (Telephone conference with Phil Smith, May 28, 2010.) Finally, CPS data show no significant convergence in mean real wages of union and nonunion miners. The recent convergence in median wages could be driven, therefore, by a growing similarity in the prevalence of inexperienced miners rather than enhanced congruence of pay scales. Unfortunately, the extreme paucity of miners surveyed for the CPS sample makes it difficult to conclusively resolve the issue. 38 Telephone interview with Phil Smith, UMWA, May 28, 2010. 39 Weil (1987:200); Telephone interview with Michael Buckner, UMWA’s Director of Research from 1981-2005, on March 3, 2011.
17

on the 1993-2010 period, for which reliable mine-level information on union status is available,
and use a variety of techniques to mitigate potential biases.
I find that unionization is associated with a sizable and robust decline in both traumatic
injuries and fatalities, the two safety outcomes that I argue are the least prone to reporting bias. I
construe these results as evidence for a “real” union safety effect in U.S. underground coal
mining. At the same time, I find that unionization is associated with higher total and non-
traumatic injuries, lending credence to claims that injury reporting practices differ significantly
across union and nonunion mines.
Interestingly, the union safety effect on traumatic injuries seems to have escalated just
before the turn of the millenium. I propose several possible explanations for this trend, including
an overall improvement in labor relations since the 1970s, fluctuations over time in the
stringency of MSHA’s enforcement scrutiny, the growing competitive pressures faced by union
leaders, and the increasing sophistication and professionalization of UMWA safety programs.
The empirical evidence available, although scant, suggests that the latter hypothesis is the most
promising. Exploring the historical relationship between UMWA activities and mine safety in
greater detail – including a richer, updated institutional account of the precise mechanisms
whereby organized labor affects safety outcomes – would be a promising topic for future inquiry.
18

References
Appleton, William C., and Joe G. Baker. 1984. “The Effect of Unionization on Safety in
Bituminous Deep Mines.” Journal of Labor Research, Vol. 4, No. 2 (Spring), pp. 139-147. Azaroff, Lenore S., Charles Levenstein, and David H. Wegman. 2002. “Occupational Injury and
Illness Surveillance: Conceptual Filters Explain Underreporting.” American Journal of Public Health, Vol. 92, No. 9, pp. 1421-1429.
Bennett, James D., and David L. Passmore. 1985. “Unions and Coal Mine Safety: Comment [The Effect of Unionization on Safety in Bituminous Deep Mines].” Journal of Labor Research, Vol. 6, No. 2 (Spring), pp. 211-216.
Boal, William M. 2009. “The Effect of Unionization on Accidents in U.S. Coal Mining, 1897-1929.” Industrial Relations, Vol. 48, No. 1, pp. 97-120.
Boden, Leslie Irvin. 1977. “Underground Coal Mining Accidents and Government Enforcement of Safety Regulations.” Diss., Massachusetts Institute of Technology.
Brown, Richard. 1995. “Unions, Markets, and Other Regulatory Mechanisms: Theory and Evidence.” University of Toronto Law Journal, Vol. 44, No. 1, pp. 1–45.
Butler, Richard J., and John D. Worrall. 1983. "Workers’ Compensation: Benefit and Injury Claims Rates in the Seventies." The Review of Economics and Statistics, Vol. 65, No. 4, pp. 580-589.
Cameron, Adrian Colin, and Pravin K. Trivedi. 1998. Regression Analysis of Count Data. New York: Cambridge University Press.
Connerton, Marguerite M. 1978. “Accident Control through Regulation: the 1969 Coal Mine Health and Safety Act Experience.” Diss., Harvard University.
Darmstadter, Joel. 1997. “Productivity Change in U.S. Coal Mining.” Resources for the Future Discussion Paper No. 97-40. Available online at http://www.rff.org/Documents/RFF-DP-97-40.pdf.
Dedobbeleer, Nicole, François Champagne, and Pearl German. 1990. “Safety Performance among Union and Nonunion Workers in the Construction Industry.” Journal of Occupational and Environmental Medecine, Vol. 32, Issue 11.
Eaton, A. and T. Nocerino. 2000. “The effectiveness of health and safety committees: Results of a survey of public-sector workplaces.” Industrial Relations, Vol. 39, No. 2, pp. 265-90.
Fairris, David. 1995. “From Exit to Voice in Shopfloor Governance: The Case of Company Unions.” Business History Review, Vol. 69, pp. 493-529.
Fenn, Paul and Simon Ashby. 2004. “Workplace Risk, Establishment Size and Union Density.” British Journal of Industrial Relations, Vol 42, pp. 461-480.
Fishback, Price V. 1986. “Workplace Safety During the Progressive Era: Fatal Accidents in Bituminous Coal Mining, 1912-1923.” Explorations in Economic History, Vol. 23, No. 3, pp. 269-298.
Fishback, Price V. 1987. “Liability Rules and Accident Prevention in the Workplace: Empirical Evidence from the Early Twentieth Century.” The Journal of Legal Studies, Vol. 16, No. 2, pp. 305-328.
Fox, Maier B. 1990. United We Stand: The United Mine Workers of America, 1890-1990. Washington, D.C: United Mine Workers of America.
Frick, Kaj., and Walters, David R. 1998. “Worker Representation on Health and Safety in Small Enterprises: Lessons from a Swedish Approach.” International Labour Review, Vol. 137, No. 3, pp. 367–89.
19
Genn, Hazel. 1993. “Business responses to the regulation of health and safety in England.” Law and Policy, Vol. 15, pp. 219–33.
Havlovic, Stephen, and McShane, Steven. 1997. “The Effectiveness of Joint Health and Safety Committees and Safety Training in Reducing Fatalities and Injuries in British Columbia Forest Product Mills.” Burnaby, BC: Workers Compensation Board of British Columbia.
Hills, Stephen. 1985. "The Attitudes of Union and Nonunion Male Workers Towards Union Representation." Industrial and Labor Relations Review, Vol. 38, No. 2, pp. 179–94.
Hirsch, Barry T., and Mark C. Berger. 1984. “Union Membership Determination and Industry Characteristics.” Southern Economic Journal, Vol. 50, No. 3, pp. 665-679.
Hirsch, Barry T., David A. MacPherson, and J. Michael Dumond. 1997. “Workers’ Compensation Recipiency in Union and Nonunion Workplaces.” Industrial and Labor Relations Review, Vol. 50, No. 2, pp. 213-236.
Ho, Daniel E., Kosuke Imai, Gary King, and Elizabeth A. Stuart. 2007. “Matching as Nonparametric Preprocessing for Reducing Model Dependence in Parametric Causal Inference.” Political Analysis, Vol. 15, No. 3, pp. 199-236.
Laflamme, Lucie, and Vera L. G. Blank. 1996. “Age-Related Accident Risks: Longitudinal Study of Swedish Iron Ore Miners.” American Journal of Industrial Medicine, Vol. 30, No. 4, pp. 479-87.
Leigh, J. Paul. 1982. “Are Unionized Blue Collar Jobs More Hazardous Than Nonunionized Blue Collar Jobs?” Journal of Labor Research, Vol. 3, No. 3, pp. 349–57.
Morantz, Alison. 2009. “The Elusive Union Safety Effect: Towards a New Empirical Research Agenda.” Proceedings of the 61 st Annual Meeting of the Labor and Employment Relations Association (San Francisco, Jan. 3-5, 2009). Champaign, IL: Labor and Employment Relations Association, pp. 130-146.
Morantz, Alison. 2012. “Does Unionization Strengthen Regulatory Enforcement?” N.Y.U. Journal of Legislation and Public Policy, Vol. 14, No. 13, pp. 697-727.
Morse, Tim, Laura Punnett, Nicholas Warren, Charles Dillon, and Andrew Warren. 2003. “The Relationship of Unions to Prevalence and Claim Filing for Work-Related Upper-Extremity Musculoskeletal Disorders.” American Journal of Industrial Medicine, Vol. 44, No. 1, pp. 83-93.
National Research Council. 1982. “Toward Safer Underground Coal Mines.” Washington, D.C.: National Academy Press.
Nichols, Theo, David Walters, and Ali C. Tasiran. 2007. “Trade unions, institutional mediation and industrial safety: evidence from the UK.” Journal of Industrial Relations, Vol. 49, No. 2, pp. 211-25.
Radenmacherm Maggi, and Raphael Braun. 2011. “The Impact of the Financial Crisis on the Global Seaborne Hard Coal Market: Are there Implications for the Future?” Zeitschrift für Energiewirtschaft. Vol 35, No. 2, pp. 89-104.
Reardon, Jack. 1996. “The Effect of the United Mine Workers of America on the Probability of Severe Injury in Underground Coal Mines.” Journal of Labor Research, Vol. 17, No. 2, pp. 239-252.
Reilly, Barry, Pierella Paci, and Peter Holl. 1995. “Unions, Safety Committees and Workplace Injuries.” British Journal of Industrial Relations, Vol. 33, No. 2, pp. 275–88.
Ruser, John W. 1985. “Workers’ Compensation Insurance, Experience-Rating, and Occupational Injuries.” Rand Journal of Economics, Vol. 16, No. 4, pp. 487–503.
Salminen, Simo. 2004. “Have Young Workers More Injuries than Older Ones? An International
20

Literature Review.” Journal of Safety Research, Vol. 35, No. 5, pp. 513-521. Souza, Kerry. 2009. “Individual and Plant Level Predictors of Acute, Traumatic Occupational
Injury in a Manufacturing Cohort.” Diss.: Harvard University. Staats, Elmer B. 1981. “Low Productivity in American Coal Mining: Causes and Cures.”
Washington, D.C.: General Accounting Office. Weeks, James L. 1985. “The Effect of Unionization on Safety in Bituminous Deep Mines:
Comment.” Journal of Labor Research, Vol. 6, No. 2 (Spring), pp. 209-210. Weil, David. 1987. “Government and Labor at the Workplace: The Role of Labor Unions in the
Implementation of Federal Health and Safety Policy.” Diss.: Harvard University. Weil, David. 1991. “Enforcing OSHA: The Role of Labor Unions.” Industrial Relations, Vol.
30, pp. 20-36. Weil, David. 1992. “Building Safety: The Role of Construction Unions in the Enforcement of
OSHA.” Journal of Labor Research, Vol. 13, pp. 121-132. Weil, David. 1994. Turning the Tide: Strategic Planning for Labor Unions. New York:
Lexington Books.
21

Figure 1. Underground Bituminous Coal Mines by County
County information was provided by MSHA. The county-level mine counts incorporate all 2,662 underground bituminous coal minesthat were active for at least one quarter between 1993 and 2010. Note that, due to high rates of entry and exit in the industry, nomore than half of the sample was active in any given quarter.
Number of Mines1 - 1011 - 5051 - 125126 - 200201 - 350
22

Figure 2. Union Penetration
Figure 3. Rates of Total and Traumatic Injuries
23

Figure 4. Susceptibility of Injury Type to Reporting Bias
24

Table 1: Injury Type Breakdown
All Mines: Union Mines: Nonunion Mines: Injury Type Frequency % of Total Frequency % of Total Frequency % of Total
Non-Traumatica 47,793 62.5% 20,153 69.9% 27,640 58.1%
Total 76,440 100% 28,847 100% 47,593 100%
Traumaticb 28,647 37.5% 8,694 30.1% 19,953 41.9%
Fatality 341 0.4% 75 0.3% 266 0.6%
Notes: This table reports the frequency of each injury type, as well as the share of total injuries that each category represents. Note that these categories are not mutually exclusive. a The non-traumatic injury category is comprised of all injuries not classified as traumatic (see below). Note that the non-traumatic and traumatic injury counts sum to the total injury count. b The traumatic injury category is comprised of the following: amputations; enucleations; fractures; chips; dislocations; foreign bodies in eyes; cuts and lacerations; punctures; burns/scalds; crushings; chemical, electrical, and laser burns; and fatalities. See footnote 13 for more details on this injury category.
25

Table 2: Effect of Union Status on Injury Frequency: Baseline Models
Specification: Baseline (Hours Worked) Employees Tonnage
Mine/Controller Size Units:
100 Quarterly FTEs 100 Employees Millions of Tons
Version: Public-Fields
Version Confid.-Fields
Version Public-Fields
Version Confid.-Fields
Version Public-Fields
Version Confid.-Fields
Version
Non-Traumatic Injury Model 1.359*** 1.269*** 1.381*** 1.299*** 1.367*** 1.290***
(0.07) (0.10) (0.07) (0.10) (0.07) (0.09) Total Injury Model
1.157*** 1.056 1.170*** 1.072 1.144*** 1.045
(0.05) (0.07) (0.05) (0.07) (0.05) (0.06) Traumatic Injury Model
0.774*** 0.696*** 0.774*** 0.695*** 0.764*** 0.683***
(0.04) (0.05) (0.04) (0.05) (0.04) (0.04)
# of Observations 38,890 24,593 38,890 24,593 38,890 24,593
# of Union Mines / # of Total Mines 355 / 2,635 186 / 1,684 355 / 2,635 186 / 1,684 355 / 2,635 186 / 1,684
Fatality Model 0.346*** 0.421* 0.358*** 0.437* 0.369*** 0.424** (0.13) (0.19) (0.13) (0.20) (0.13) (0.18)
# of Observations 11,045 6,948 11,045 6,948 11,045 6,948
# of Union Mines / # of Total Mines 352 / 2,568 182 / 1,644 352 / 2,568 182 / 1,644 352 / 2,568 182 / 1,644
Significance levels: *** 1%, ** 5%, * 10%. Standard errors, clustered at the mine level, are shown in parentheses. Results Presented: The table reports IRR (incidence rate ratio)a coefficients on the union indicator variables in negative binomial regression models. Hours worked is the exposure term. Definitions: A quarterly FTE is defined as 500 hours worked. Unit of Observation: The unit of observation is the mine-quarter for the non-traumatic, total, and traumatic injuries regressions. The unit of observation is the mine-year for fatality regressions. Dependent Variables: The dependent variables are counts of injuries of each type (specified in the far-left column) that occur underground. Traumatic injuries are defined to include the following: amputations; enucleations; fractures; chips; dislocations; foreign bodies in eyes; cuts and lacerations; punctures; burns/scalds; crushings; chemical, electrical, and laser burns; and fatalities. (See footnote 13 for more details on the definition on traumatic injuries.) The sum of traumatic and non-traumatic injuries comprises total injuries. Independent Variables: All models include the following regressors: union dummy, mine size (a continuous variable whose units are specified in column header), union X mine size, logged controller size (a continuous variable whose units are specified in column header), mine age, mine productivity, total lost-work injuries (in hundreds) during previous calendar year (for fatality models) or previous four quarters (for non-fatality models), total penalty points (in thousands) during previous calendar year (for fatality models) or previous four quarters (for non-fatality models), dummies indicating presence of each respective mine subunit, quarter/year dummies, district dummies, and a constant term. Public-fields versions also include a longwall indicator. Confidential-fields versions also include the number of coal beds, mean coal bed thickness (in yards), subsidiary indicator, captive production
26

as a percentage of total production, recoverable coal reserves, and mining method percentages. See Appendix C for complete variable definitions. An expanded version of this table, including a full covariate report, is available at http://amorantz.stanford.edu/papers/union-coal-mine-safety/. Sample: The sample consists of underground bituminous coal mines with positive coal production and positive hours worked. The public-fields versions contain mine-quarters from 1993–2010, whereas the confidential-fields versions are restricted to 1998–2010. Because the historical variables (lost-work injuries and penalty points) are summed up over the previous four quarters in the non-traumatic, total, and traumatic injuries regressions but are summed up over the previous calendar year in the fatality regressions, some mines excluded from the fatality models are included in the other models. For example, if a mine is open for all of only one calendar year, it will have no historical data at the yearly level, but it will have historical data for three of the four quarters it was open. The number of union mines is computed by counting the mines that were unionized for any of the mine-quarters in the sample period. The number of total mines is computed by counting each mine in the sample, regardless of union status. a A coefficient of 1 indicates no change at all in predicted injuries; coefficients between 0 and 1 represent a predicted fall in injuries (e.g. a coefficient of 0.97 represents a 3% decline); and coefficients greater than one represent predicted increases (e.g. a coefficient of 1.03 represents a 3% rise).
27

Table 3: Effect of Union Status on Injury Frequency: Discrete Size Groups
Non-Traumatic
Injuries Total
Injuries Traumatic
Injuries Fatalities
Union X Size Quartile 1 1.222 1.227* 1.223 0.000***
(0.16) (0.14) (0.19) (0.00)
Union X Size Quartile 2 1.237*** 1.171** 0.988 0.321
(0.10) (0.08) (0.09) (0.32)
Union X Size Quartile 3 1.424*** 1.196*** 0.815*** 0.824
(0.12) (0.08) (0.05) (0.51)
Union X Size Quartile 4 1.250*** 0.999 0.695*** 0.307***
(0.07) (0.05) (0.04) (0.09)
Observations 38,890 38,890 38,890 11,045
# of Union Mines / # of Total Mines 355 / 2,635 355 / 2,635 355 / 2,635 352 / 2,568
Significance levels: *** 1%, ** 5%, * 10%. Standard errors, clustered at the mine level, are shown in parentheses. Results Presented: The table reports IRR (incidence rate ratio)a coefficients on the union indicator variables in negative binomial regression models. Hours worked is the exposure term. Definitions: A quarterly FTE is defined as 500 hours worked. Unit of Observation: The unit of observation is the mine-quarter for the non-traumatic, total, and traumatic injuries regressions. The unit of observation is the mine-year for fatality regressions. Dependent Variables: The dependent variables are counts of injuries of each type (specified in the top row) that occur underground. Traumatic injuries are defined to include the following: amputations; enucleations; fractures; chips; dislocations; foreign bodies in eyes; cuts and lacerations; punctures; burns/scalds; crushings; chemical, electrical, and laser burns; and fatalities. (See footnote 13 for more details on the definition on traumatic injuries.) The sum of traumatic and non-traumatic injuries comprises total injuries. Independent Variables: All specifications presented above rely exclusively on regressors that are publicly available. In addition to discrete union-size interaction terms, all models include the following regressors: size quartiles (as determined by total FTEs), logged controller size (a continuous variable reflecting the controller’s total number of FTEs), mine age, mine productivity, total lost-work injuries (in hundreds) during previous calendar year (for the fatality model) or previous four quarters (for non-fatality models), total penalty points (in thousands) during previous calendar year (for the fatality model) or previous four quarters (for non-fatality models), dummies indicating presence of each respective mine subunit, quarter/year dummies, district dummies, longwall indictor, and a constant term. See Appendix C for complete variable definitions. An expanded version of this table, including a full covariate report, is available at http://amorantz.stanford.edu/papers/union-coal-mine-safety/. Sample: The sample consists of underground bituminous coal mines with positive coal production and positive hours worked from 1993–2010. Because the historical variables (lost-work injuries and penalty points) are summed up over the previous four quarters in the non-traumatic, total, and traumatic injuries regressions but are summed up over the previous calendar year in the fatality regressions, some mines excluded from the fatality models are included in the other models. For example, if a mine is open for all of only one calendar year, it will have no historical data at the yearly level, but it will have historical data for three of the four quarters it was open. The number of union mines is computed by counting the mines that were unionized for any of the mine-quarters in the sample period. The total number of mines is computed by counting each mine in the sample, regardless of union status. a A coefficient of 1 indicates no change at all in predicted injuries; coefficients between 0 and 1 represent a predicted fall in injuries (e.g. a coefficient of 0.97 represents a 3% decline); and coefficients greater than one represent predicted increases (e.g. a coefficient of 1.03 represents a 3% rise).
28

Table 4: Effect of Union Status on Injury Frequency: Time Trend
Model FTE Public (Baseline) 1993-1998 1999-2004 2005-2010
Non-Traumatic 1.359*** 1.504*** 1.243** 1.283** Injury Model (0.07) (0.09) (0.12) (0.16) Total 1.157*** 1.320*** 1.052 1.003 Injury Model (0.05) (0.07) (0.09) (0.10) Traumatic 0.774*** 0.919 0.673*** 0.698*** Injury Model (0.04) (0.06) (0.06) (0.08) Observations 38,890 16,629 11,460 10,801
# of Union Mines / # of Total Mines 355 / 2,635 294 / 1,765 129 / 1,141 65 / 928
Fatality Model 0.346*** 0.378* 0.331* 0.555 (0.13) (0.19) (0.20) (0.38) Observations 11,045 4,763 3,308 2,974
# of Union Mines / # of Total Mines 352 / 2,568 290 / 1,690 128 / 1,093 65 / 903
Significance levels: *** 1%, ** 5%, * 10%. Standard errors, clustered at the mine level, are shown in parentheses. Results Presented: The table reports IRR (incidence rate ratio)a coefficients on the union indicator variables in negative binomial regression models. Hours worked is the exposure term. The “FTE Public (Baseline)” column contains coefficient estimates from the principal baseline models (using 100 quarterly FTEs as the size measure and relying exclusively on public data) presented in Table 2. The results presented in the other three columns correspond, respectively, to coefficient estimates from identical models run on six-year subsamples. Definitions: A quarterly FTE is defined as 500 hours worked. Unit of Observation: The unit of observation is the mine-quarter for the non-traumatic, total, and traumatic injuries regressions. The unit of observation is the mine-year for fatality regressions. Dependent Variables: The dependent variables are counts of injuries of each type (specified in the far-left column) that occur underground. Traumatic injuries are defined to include the following: amputations; enucleations; fractures; chips; dislocations; foreign bodies in eyes; cuts and lacerations; punctures; burns/scalds; crushings; chemical, electrical, and laser burns; and fatalities. (See footnote 13 for more details on the definition on traumatic injuries.) The sum of traumatic and non-traumatic injuries comprises total injuries. Independent Variables: All specifications presented above rely exclusively on regressors that are publicly available. All models include the following regressors: union dummy, mine size (a continuous variable reflecting the mine’s total number of FTEs) , union X mine size, logged controller size (a continuous variable reflecting the controller’s total number of FTEs), mine age, mine productivity, total lost-work injuries (in hundreds) during previous calendar year (for fatality models) or previous four quarters (for non-fatality models), total penalty points (in thousands) during previous calendar year (for fatality models) or previous four quarters (for non-fatality models), dummies indicating presence of each respective mine subunit, quarter/year dummies, district dummies, a longwall indicator, and a constant term. See Appendix C for complete variable definitions. An expanded version of this table, including a full covariate report, is available at http://amorantz.stanford.edu/papers/union-coal-mine-safety/. Sample: The sample consists of underground bituminous coal mines with positive coal production and positive hours worked from 1993–2010. Because the historical variables (lost-work injuries and penalty points) are summed up over the previous four quarters in the non-traumatic, total, and traumatic injuries regressions but are summed up over the previous calendar year in the fatality regressions, some mines excluded from the fatality models are included in the other models. For example, if a mine is open for all of only one calendar year, it will have no
29

historical data at the yearly level, but it will have historical data for three of the four quarters it was open. The number of union mines is computed by counting the mines that were unionized for any of the mine-quarters in the sample period. The total number of mines is computed by counting each mine in the sample, regardless of union status. a A coefficient of 1 indicates no change at all in predicted injuries; coefficients between 0 and 1 represent a predicted fall in injuries (e.g. a coefficient of 0.97 represents a 3% decline); and coefficients greater than one represent predicted increases (e.g. a coefficient of 1.03 represents a 3% rise).
30

Appendix Table A1: Characteristics of Underground, Bituminous Coal Mines: Sample Means Variable
Union Mean Nonunion Mean
Variable Union Mean Nonunion Mean
Total sample sizea
Mine-quarters Minesb
Injury Rates (per annual FTE) Total injuries Traumatic injuries Non-traumatic injuries Fatalities
Mine and Controller Size Measures Mine FTEs Size Quartile 1 Size Quartile 2 Size Quartile 3 Size Quartile 4 Mine Employees Mine Tonnage Controller FTEs Controller employees Controller tonnage
5,689 355
0.1295
(0.1714) 0.0357
(0.0357) 0.0937
(0.1413) 0.0003
(0.0062)
194.68 (207.44)
9.77 (4.12) 26.36 (5.28) 51.53
(10.57) 320.67
(200.23)
176.65 (181.42)
368,828
(459,803)
1,451.81 (1,910.59)
1,292.98
(1,673.56)
3,125,170 (4,624,872)
33,201 2,444
0.1076 (0.2676) 0.0397
(0.0397) 0.0679
(0.1743) 0.0010
(0.0537)
58.76 (87.40)
9.87 (4.44) 25.39 (5.32) 49.33
(10.12) 179.18
(135.64)
51.91 (73.47)
123,184
(267,355)
632.69 (1,146.56)
542.75
(980.04)
1,296,810 (2,556,860)
Mine characteristics Mine age (in years) Productivity Percent Captive Production Subsidiary indicator Longwall indicator Subunits containedc
Surface Mill or prep plant Mining method percentages Conventional Continuous Longwall Shortwall
Geological features Number of Coal beds Mean coal bed thickness (in yards) Recoverable reserves (in millions of tons)
17.15 (16.44)
7.41
(4.05)
0.0798 (0.2582)
0.3529
(0.4779)
0.3146 (0.4644)
0.8613 (0.3457) 0.2781
(0.4481)
0.0755 (0.2641) 0.6552
(0.4262) 0.664
(0.3895) 0.0019
(0.0379)
1.0197 (0.1537)
0.9227
(0.8580)
19,593 (31,958)
6.89 (7.72)
6.93
(4.59)
0.0738 (0.2563)
0.2062
(0.4046)
0.0408 (0.1978)
0.8272 (0.3781) 0.0439
(0.2048)
0.1625 (0.3675) 0.7763
(0.4088) 0.0341
(0.1644) 0.0001
(0.0110)
0.9999 (0.1811)
0.8483 (0.713)
6,857
(27,711)
Results Presented: Table contains mean values for all mine quarters in each group; standard deviations are in parentheses. See Appendix C for complete variable definitions. a Total sample sizes represent counts (of mine-quarters and of mines, respectively) as opposed to mean values. b Because a mine that was unionized for part of the sample period and nonunionized for part of the sample period is counted here as both a union mine and a nonunion mine, some mines are double counted for a total of 2,799
31

mines. The total number of mines used in the baseline regressions is 2,635. The difference between these two numbers, 164 mines, is the number of mines that switched union status at some point during the sample period. These are the mines that are included in the fixed effects models in Appendix Table A3. c Only descriptive statistics for the surface and the mill or prep plant subunits are shown here. Other subunits include auger subunit; culm-refuse subunit; dredge subunit; independent shops or yard subunit; strip, quarry, or pit subunit; underground subunit; and other subunits. Descriptive statistics for all ten subunits are available on the Companion Website (http://amorantz.stanford.edu/papers/union-coal-mine-safety/).
32

Appendix Table A2: Effect of Union Status on Injury Frequency: Expanded Covariate Report for Baseline, Public-Fields Specifications
Non-Traumatic Injury Model
Total Injury Model
Traumatic Injury Model
Fatality Model
Union 1.335*** 1.143*** 0.780*** 0.346***
(0.07) (0.05) (0.04) (0.13)
Union X Size 0.975 0.962** 0.982 1.019
(0.02) (0.02) (0.02) (0.03)
Mine Size 0.869*** 0.890*** 0.925*** 0.899***
(0.02) (0.02) (0.02) (0.03)
Log of Controller Size 0.943*** 0.985** 1.047*** 1.021
(0.01) (0.01) (0.01) (0.06)
Mine Age 0.999 0.999 0.999 1.007
(0.00) (0.00) (0.00) (0.01)
Productivity 0.994 0.997 0.997 0.942***
(0.00) (0.00) (0.00) (0.02)
Lost-Day Injuries in Prev. Year 1.000*** 1.000*** 1.000*** 1.000
(0.00) (0.00) (0.00) (0.00)
Penalty Points in Prev. Year 1.000*** 1.000*** 1.000*** 1.000***
(0.00) (0.00) (0.00) (0.00)
Longwall Indicator 0.914 0.898* 0.919 1.569
(0.05) (0.05) (0.07) (0.54)
Mining Subunit Dummiesa Y Y Y Y
District Fixed Effectsa Y Y Y Y
Quarter/Year Fixed Effectsa Y Y Y Y
Observations 38,905 38,905 38,905 11,045
# of Union Mines / # of Total Mines 355 / 2,639 355 / 2,639 355 / 2,639 352 / 2,568
Significance levels: *** 1%, ** 5%, * 10%. Standard errors, clustered at the mine level, are shown in parentheses. Results Presented: The information presented in this table is identical to that presented in the Baseline/Public-Fields column of Table 2, but includes additional coefficient estimates. Each value represents the IRR (incidence rate ratio)a coefficient on an independent variable in a negative binomial regression model. Hours worked is the exposure term. Definitions: A quarterly FTE is defined as 500 hours worked. Unit of Observation: The unit of observation is the mine-quarter for the non-traumatic, total, and traumatic injuries regressions. The unit of observation is the mine-year for fatality regressions. Dependent Variables: The dependent variables are counts of injuries of each type (specified in the top row) that occur underground. Traumatic injuries are defined to include the following: amputations; enucleations; fractures; chips; dislocations; foreign bodies in eyes; cuts and lacerations; punctures; burns/scalds; crushings; chemical, electrical, and laser burns; and fatalities. (See footnote 13 for more details on the definition on traumatic injuries.) The sum of traumatic and non-traumatic injuries comprises total injuries. Independent Variables: All models include the following regressors: union dummy, mine size (a continuous variable reflecting the mine’s total number of FTEs), union X mine size, logged controller size (a continuous variable reflecting the controller’s total number of FTEs), mine age, mine productivity, total lost-work injuries (in hundreds)
33

during previous calendar year (for fatality models) or previous four quarters (for non-fatality models), total penalty points (in thousands) during previous calendar year (for fatality models) or previous four quarters (for non-fatality models), dummies indicating presence of each respective mine subunit, quarter/year dummies, district dummies, longwall indicator, and a constant term. See Appendix C for complete variable definitions. An expanded version of this table, including a complete covariate report, is available at http://amorantz.stanford.edu/papers/union-coal-mine-safety/. Sample: The sample consists of underground bituminous coal mines with positive coal production and positive hours worked, including all mine-quarters from 1993–2010. Because the historical variables (lost-work injuries and penalty points) are summed up over the previous four quarters in the non-traumatic, total, and traumatic injuries regressions but are summed up over the previous calendar year in the fatality regressions, some mines excluded from the fatality models are included in the other models. For example, if a mine is open for all of only one calendar year, it will have no historical data at the yearly level, but it will have historical data for three of the four quarters it was open. The number of union mines is computed by counting the mines that were unionized for any of the mine-quarters in the sample period. The total number of mines is computed by counting each mine in the sample, regardless of union status. a A coefficient of 1 indicates no change at all in predicted injuries; coefficients between 0 and 1 represent a predicted fall in injuries (e.g. a coefficient of 0.97 represents a 3% decline); and coefficients greater than one represent predicted increases (e.g. a coefficient of 1.03 represents a 3% rise).
34

APPENDIX TABLE A3: FIXED EFFECTS MODELS
Specification: Baseline (Hours Worked) Employees Tonnage Mine/Controller
Size Units: 100 Quarterly FTEs 100 Employees Millions of Tons
Version: Public-Fields
Version Confid.-Fields
Version Public-Fields
Version Confid.-Fields
Version Public-Fields
Version Confid.-Fields
Version
Non-Traumatic Injury Model
1.374*** 1.091 1.385*** 1.101 1.440*** 1.103
(0.14) (0.15) (0.14) (0.15) (0.13) (0.12) Total Injury Model
1.208** 1.056 1.205** 1.066 1.258*** 1.063
(0.09) (0.11) (0.09) (0.12) (0.09) (0.09) Traumatic Injury Model
0.896 1.037 0.882 1.058 0.971 1.032
(0.09) (0.12) (0.09) (0.14) (0.08) (0.10) # of Observations 4,075 1,558 4,075 1,558 4,075 1,558
# of Union Mines / # of Total Mines 164 / 164 79 / 79 164 / 164 79 / 79 164 / 164 79 / 79
Fatality Model 0.381** 5.067 0.386** 2.607 0.423** . a (0.17) (9.08) (0.17) (3.88) (0.18) . # of Observations 1,082 412 1,082 412 1,082 412
# of Union Mines / # of Total Mines 151 / 151 71 / 71 151 / 151 71 / 71 151 / 151 71 / 71
Significance levels: *** 1%, ** 5%, * 10%. Standard errors, clustered at the mine level, are shown in parentheses. Limitations of Fixed Effects Model: Only a small proportion of underground coal mines (6.2%) changed union status during the period examined (1993-2010). Those that did change union status seem to be highly unrepresentative of the population as a whole: at least 19% of coal mines that de-unionized and 78% of mines that became unionized during the sample period experienced major disruptions (defined as production, employment, or hours worked dropping by over 50%; a year or more of inactivity; or change of the mine operator or mine controller) during the year when the transition took place. Any analysis predicated upon this idiosyncratic subgroup is likely to yield biased estimates of unionization’s true effect, which is why I place this table in an appendix. Results Presented: The table reports IRR (incidence rate ratio)b coefficients on the union indicator variables in negative binomial regression models. Hours worked is the exposure term. Definitions: A quarterly FTE is defined as 500 hours worked. Unit of Observation: The unit of observation is the mine-quarter for the non-traumatic, total, and traumatic injuries regressions. The unit of observation is the mine-year for fatality regressions. Dependent Variables: The dependent variables are counts of injuries of each type (specified in the top row) that occur underground. Traumatic injuries are defined to include the following: amputations; enucleations; fractures; chips; dislocations; foreign bodies in eyes; cuts and lacerations; punctures; burns/scalds; crushings; chemical, electrical, and laser burns; and fatalities. (See footnote 13 for more details on the definition on traumatic injuries.) The sum of traumatic and non-traumatic injuries comprises total injuries. Independent Variables: All models include the following regressors: union dummy, mine size (a continuous variable whose units are specified in column header), union X mine size, logged controller size (a continuous
35

variable whose units are specified in column header), mine age, mine productivity, total lost-work injuries (in hundreds) during previous calendar year (for fatality models) or previous four quarters (for non-fatality models), total penalty points (in thousands) during previous calendar year (for fatality models) or previous four quarters (for non-fatality models), dummies indicating presence of each respective mine subunit, quarter/year dummies, district dummies, and a constant term. Public-fields versions also include a longwall indicator. Confidential-fields versions also include the number of coal beds, mean coal bed thickness (in yards), subsidiary indicator, captive production as a percentage of total production, recoverable coal reserves, and mining method percentages. See Appendix C for complete variable definitions. An expanded version of this table, including a full covariate report, is available at http://amorantz.stanford.edu/papers/union-coal-mine-safety/. Sample: The sample consists of underground bituminous coal mines with positive coal production and positive hours worked that switched union status at some point during the sample period. The public-fields versions contain mine-quarters from 1993–2010, whereas the confidential-fields versions are restricted to 1998–2010. Because the historical variables (lost-work injuries and penalty points) are summed up over the previous four quarters in the non-traumatic, total, and traumatic injuries regressions but are summed up over the previous calendar year in the fatality regressions, some mines excluded from the fatality models are included in the other models. For example, if a mine is open for all of only one calendar year, it will have no historical data at the yearly level, but it will have historical data for three of the four quarters it was open. a Of the 412 mine-years in our sample for the confidential-fields version of the tonnage specification (rightmost column above), there were only 10 fatalities, which occurred in 5 unionized mine-years and 5 nonunionized mine-years. Because of the small sample size and lack of significant variation, the negative binomial regression did not converge for this model. b A coefficient of 1 indicates no change at all in predicted injuries; coefficients between 0 and 1 represent a predicted fall in injuries (e.g. a coefficient of 0.97 represents a 3% decline); and coefficients greater than one represent predicted increases (e.g. a coefficient of 1.03 represents a 3% rise).
36

APPENDIX B: DESCRIPTION OF MODEL SPECIFICATIONS
The list below describes the three specifications and two versions that are included in Table 2. Hours Worked (Baseline) Specification: Mine size is measured in units of 100 quarterly FTEs. Controller size is measured by the log of hours worked across all mines controlled by that controller, in units of 100 quarterly FTEs. Employees Specification: Mine size is measured in hundreds of employees. Controller size is measured by the log of employees across all mines controlled by that controller, in hundreds of employees. Tonnage Specification: Mine size is measured in millions of tons. Controller size is measured by the log of tonnage across all mines controlled by that controller, in millions of tons. Public-Fields Version: All models include the following regressors: union dummy, union-size interaction term, mine size measure (defined as specified in column headers or the table note), logged controller size measure (defined as specified in column headers or the table note), mine age, mine productivity, number of lost-work injuries (in hundreds) in the previous calendar year (for fatality models) or previous four quarters (for non-fatality models), total penalty points (in thousands in the previous calendar year (for fatality models) or previous four quarters (for non-fatality models), a constant term, dummies indicating presence of each type of mine subunit, quarter/year dummies, district dummies, and a longwall indicator. Confidential-Fields Version: All models include the following regressors: union dummy, union-size interaction term, mine size measure (defined as specified in column headers or the table note), logged controller size measure (defined as specified in column headers or the table note), mine age, mine productivity, number of lost-work injuries (in hundreds) in the previous calendar year (for fatality models) or previous four quarters (for non-fatality models), total penalty points (in thousands) in the previous calendar year (for fatality models) or previous four quarters (for non-fatality models), a constant term, dummies indicating presence of each type of mine subunit, quarter/year dummies, district dummies, number of coal beds, mean coal bed thickness (in yards), subsidiary indicator, captive production as a percentage of total production, recoverable coal reserves, and the mining method percentages.
37

APPENDIX C: VARIABLE DICTIONARY Variable Name Variable Definition Source Non-traumatic injuries Total number of injuries not classified as traumatic MSHA Total injuries Total number of injuries and fatalities reported MSHA
Traumatic injuries A subset of injuries that are least prone to reporting bias (see footnote 13) MSHA
Fatalities Total number of fatalities reported MSHA
District dummies 1 if mine is located in a given MSHA district, 0 otherwise MSHA
Ln (Controller Size)
Log of controller size measure. Controller size measure is either 100 FTEs, 100 employees, or one million tons MSHA
Lost-workday injuries
Lost-workday injuries are those that result in time lost from work. When included as a regressor, it is the number of such injuries in the previous calendar year (for fatality models) or previous four quarters (for non-fatality models), in hundreds. MSHA
Mine age Age of mine in years since the first operator began work at the mine (top censored at 1970) MSHA
Penalty Points Thousands of penalty points in the previous calendar year (for fatality models) or previous four quarters (for non-fatality models)
MSHA
Productivity Thousands of tons of coal produced per annual FTE (2,000 hours) MSHA
Quarter/year indicators
1 if observation is for a given year or quarter, 0 otherwise MSHA
Size Measure Size measure is either 100 FTEs, 100 employees, or one million tons MSHA
Subunit indicator
1 if mine contains a given subunit, 0 otherwise Subunit types include e.g. “surface” and “mill or prep plant” MSHA
Mean coal bed thickness
The mean thickness of all coal beds at the mine, in yards EIAa
38

Mining method
percentages
Proportion of underground operation that uses a given mining method, expressed as fraction between 0 and 1; types include conventional, continuous, longwall, shortwall, and other EIA
Number of coal beds Number of coal beds at the mine site EIAa Percent captive production
Percent of production for mine or parent company’s own use
EIAa,b
Recoverable reserves Estimated tonnage of remaining coal reserves EIAa,b Subsidiary indicator 1 if mine is a subsidiary of a larger firm, 0 otherwise EIAa Union indicator 1 if mine is unionized, 0 otherwise EIA Longwall Indicator 1 if mine is a longwall mine, 0 otherwise NIOSH
Source: MSHA inspection records, 1993–2010; EIA coal mine data 1993–2010; NIOSH coal mine data 1993–2010. a These data fields were obtained on a confidential basis, and are considered trade secrets by the companies that provided them. b These data fields are unavailable prior to 1998.
39