coal energy and electric generation
TRANSCRIPT

COAL ENERGY ANDELECTRIC GENERATION
D E C I S I O N - M A K E R SF I E L D C O N F E R E N C E 2 0 0 2
S a n J u a n B a s i n
C H A P T E R T H R E E
NEW MEXICO’S ENERGY,PRESENT AND
FUTURE
Policy, Production, Economics,and the Environment
D E C I S I O N - M A K E R S F I E L D C O N F E R E N C E 2 0 0 2
New Mexico Bureau of Geology and Mineral ResourcesA Division of New Mexico Institute of Mining and Technology
2002
Brian S. Brister and L. Greer Price, Editors
This electronic document is part of a larger work that can be obtained from The New Mexico Bureau of Geology
http://geoinfo.nmt.edu/publications/decisionmakers
or call: [505] 835-5410

SAN JUAN BASIN
C O A L E N E R G Y & E L E C T R I C G E N E R A T I O N
Coal-bearing rocks underlie one-fifth of the state ofNew Mexico, but most citizens are unaware of the
important role coal plays in the economy of the state.Coal mining has been a significant part of our eco-nomic development since the 1850s. Today, NewMexico ranks 12th in U.S. coal production (27.34 mil-lion short tons), with 1.39 billion short tons of recov-erable coal reserves at producing mines.1 Forty-sixpercent of the state’s total energy needs are metthrough power generated from coal. The coal indus-try’s contribution to New Mexico’s state budget is thethird largest source of revenue from mineral and ener-gy production. State tax revenues from the coal indus-try in New Mexico totaled $31.8 million in calendaryear 2000. In addition, the state receives 50% of allroyalties from coal leases on federal lands, and allrents and royalties from state lands. The coal industryin 2000 employed over 1,700 people with a payroll ofnearly $100 million. While the present-day market forcoal is dominated by electrical generation, this is justone of the factors that ultimately determine the eco-nomic feasibility of mining coal in New Mexico.
NEW MEXICO’S COAL INDUSTRY TODAY
Six coal mines currently operate in New Mexico; fiveof them are in the San Juan Basin (Fig. 1). All of theseoperations mine coal at or near the surface, althoughthe San Juan mine is in the process of converting to anunderground operation. Three of those five mines arecaptive, which means that all the coal produced atthose mines is destined for a specific electric powerplant. The San Juan and La Plata mines supply coal tothe San Juan generating station (operated by PublicService of New Mexico); the Navajo mine suppliescoal to the Four Corners generating station (operatedby Arizona Public Service). The McKinley mine nearGallup and the Lee Ranch mine northwest of Grantshave access to rail transportation and ship their coal toArizona power plants. Lee Ranch supplies coal to theEscalante generating station (operated by Tri-StateGeneration & Transmission Association) near Prewitt,New Mexico. The Ancho mine in the Raton Basindelivers high-rank coal by rail to a power plant inWisconsin; the quality of the coal from the Ancho
mine and the proximity of the mine to rail make iteconomically feasible to transport the coal out of state.
ECONOMICS OF COAL
The regional geology of an area determines whethercoal is present or absent, and, if present, if the coalbeds are thick enough to be considered minable withthe available mining techniques. The structure of thecoal-bearing deposits—whether the rock units are flatlying, have significant dips, or are faulted—also deter-mines whether a coal bed can be mined with the tech-niques available.
Coal quality is important as well. There are twoimportant considerations in this regard: sulfur con-tent, which significantly affects the quality of theemissions produced when the coal is burned (how“clean” or “dirty” the coal is), and the heating value,expressed in Btu/lb, which is a measure of how muchheat (or energy) can be produced per pound of coal.The relationship between these two factors is the ulti-mate measure of coal quality.
To meet current standards of the Clean Air Act (asamended in 1990), electric generating stations maynot discharge gaseous effluent containing more than1.2 lb of sulfur dioxide (SO2) per million Btu, whichtranslates to about 0.6% sulfur per million Btu.Installing combustion gas scrubbers helps remove sul-fur from power plant emissions if a coal has highersulfur content than the standards allow, but thisincreases the cost of operations.
Another important quality to consider is the ashcontent of the coal: the greater the ash content, thegreater the amount of combustion byproduct thatmust be disposed of (see article by Hoffman on fly ashin this volume). Ash is also corrosive to materials usedin the combustion chamber, so the greater the ashcontent of the coal, the higher the cost of maintainingthe boiler. Finally, combustion byproducts associatedwith high ash content must be periodically removedto maintain an efficient and safe operation.
Other factors that affect the economics of coal min-ing are 1) proximity to available transportation net-works, 2) distance to a market and competition withinthat market, and 3) the technology available for
65
New Mexico’s Coal Industry: Resources,Production, and Economics
Gretchen K. Hoffman, New Mexico Bureau of Geology and Mineral Resources

C H A P T E R T H R E E
DECISION-MAKERS FIELD GUIDE 2002
extraction. Throughout the history of coal mining inNew Mexico (and elsewhere), the relative importanceof each of these factors has changed in response tochanges in the end users of the coal produced.
GEOLOGY
Several areas in New Mexico are defined as coal fields(Fig. 1), but most of the economic coal lies within theSan Juan and Raton Basins. Coal-bearing rocks in theSan Juan Basin are of Late Cretaceous age (95–60 mil-lion years ago) and were deposited in peat swamps incoastal environments. Most San Juan Basin coals thickenough to have economic potential developed fromsediments that accumulated as the seas slowly retreat-ed to the northeast, in response to increased sedimentsupply from the continental highlands to the south-west. This slow and uneven retreat allows for greaterbuildup of organic material (peat) and for preservationof coal in the rock record. Pressure from the weight ofoverlying sediments, deposited by rivers, wind, lakes,and seas, compresses the peat. Compaction of theplant material forces out oxygen, hydrogen, and othervolatiles, leaving a greater percentage of carbon. Thiscompaction decreases the thickness of the material, aswell: an accumulation of 15–20 feet of peat producesa 1-foot thick coal bed.
Heat and time are the most effective elements that
increase the heating value of the coal. Coals in the SanJuan Basin do not have great lateral extent. They tendto exist in multiple thin seams within the coal-bearingrock formation, in varying thickness, and typicallypinch out laterally. The thickness and extent of coal-bearing strata are important factors in their ultimateeconomic value.
There are three major coal-bearing rock sequencesin the San Juan Basin: the Crevasse Canyon, Menefee,and Fruitland Formations (Fig. 2). The CrevasseCanyon Formation is the oldest unit; coals in this for-mation are not being mined at this time. The MenefeeFormation has two coal-bearing sequences (the ClearyCoal Member at the base and the upper coal memberat the top) and is the oldest coal-bearing formationactively mined in the San Juan Basin. Coals in boththe Cleary and the upper coal members are thin, aver-aging 3–5 feet, with some seams as much as 25-feetthick. These coals have limited lateral extent, andthere are multiple seams within the coal-bearingsequence at any one location. Surface-minable coal inthe Cleary Coal Member is present along the southernedge of the basin and is near the surface on the west-ern and eastern flanks of the basin where the rockunits dip steeply. The Menefee Formation coals arelow in ash content (inorganic noncombustible materi-al, 7–15%) and are subbituminous in rank
66
FIGURE 1 Coal fields of New Mexico with active mines, coal-fired power plants, and transportation network.

SAN JUAN BASIN
C O A L E N E R G Y & E L E C T R I C G E N E R A T I O N
(9,500–11,500 Btu/lb). The sulfur content of theMenefee coals can be over 1% in some areas (which isconsidered high for New Mexico; New Mexico coalsaverage 0.8% sulfur content). These values limit theeconomic potential of these reserves. Of the 1.1 bil-lion short tons (st) of surface-minable coal within theMenefee, only 106 million meet Clean Air Act stan-dards of 0.6 lbs sulfur/million Btu. The McKinley andLee Ranch mines extract coal from the Cleary CoalMember in the southern part of the San Juan Basin(Fig. 1, 2).
The Fruitland Formation is the youngest coal-bear-ing unit in the San Juan Basin and crops out along thebasin’s western, southern, and part of its eastern edges(Fig. 2). Some of the thickest coals in the basin arenear the base of the Fruitland. Coal seams in the
Fruitland Formation can reach 30 feet in thickness,but 5–10-foot seams are more common. The lateralextent of these coals is limited, but they tend to havegreater continuity than coals in the MenefeeFormation. Fruitland coals are very high in ash(18–22% by weight), and the sulfur content is vari-able, depending on the geographic and stratigraphiclocation, but averages 0.8%. Most of the coals in theFruitland Formation are of subbituminous rank, butcoals near the Colorado border, thermally altered bythe San Juan volcanic complex, are of a higher rank(high-volatile bituminous) and therefore have higherheating values (11,500–13,000 Btu/lb). Fruitlandcoals are mined at the Navajo, San Juan, and La Platamines west of Farmington (Fig. 1, 2). Demonstrated
67
FIGURE 2 Coal fields and coal-bearing rock units within the San Juan Basin.

C H A P T E R T H R E E
DECISION-MAKERS FIELD GUIDE 2002
reserves of compliance coal (coal meeting Clean AirAct standards) within the Fruitland Formation are 883million short tons (Hoffman, 1996).
TECHNOLOGY
Throughout the history of coal mining, methods ofextraction have changed, becoming more efficient,safer, and less labor intensive. Coal mining in NewMexico began in the 1850s with crude methods (pickand shovel) to mine coal from surface outcrops.Advances were made in underground mining: usingexplosives to break the coal for easier removal, andemploying mules and then battery or electric cars tobring the coal to the surface. With these improve-ments, along with better ventilation systems, minesincreased in size and efficiency. The introduction oflarge earth-moving machinery, such as large bucketshovels and draglines, made surface mining feasible.Although surface mining began in the 1920s, under-ground methods prevailed until the 1960s in NewMexico and across most of the nation. The increasedmechanization of both surface and underground min-ing and the use of computers and global positioningsystems have increased productivity significantly inthe past few years. Although fewer mines are operat-ing in New Mexico now than in the 1980s, produc-tion has continued to rise, partly because of techno-logical improvements.
MARKETS AND TRANSPORTATION
New Mexico coal was first used locally as a homeheating fuel. The introduction of railroads to NewMexico Territory spurred the development of manysmall mines to supply coal to power steam locomo-tives. Ore smelters in the Southwest provided an addi-tional market for New Mexico coal, particularly coalfrom the Raton Basin because of its high quality andmetallurgical properties. The railroad industry’s switchto diesel engines in the 1950s led to the loss of mar-kets for many of the small coal mines and a significantdrop in coal production statewide.
Our modern coal industry in New Mexico began inthe 1960s, with the increase in population in theSouthwest coupled with the demand for cheap elec-tricity. The San Juan Basin was a major area of devel-opment because the geology and structure of the areawere ideal for surface mining. The Navajo and SanJuan mines opened in 1963 and 1973, respectively, tosupply coal to adjacent electrical generating stations,built to be near both coal and water. Instead of trans-
porting coal to distant power plants, electricity is gen-erated on site and shipped via transmission lines.
A major restriction for marketing coal from most ofthe San Juan Basin is the lack of transportation infra-structure (Fig. 1). The lack of railroads is most signifi-cant because the only cost-effective way to transportcoal is by rail. The only rail line in the northwest partof the state is along the southern edge of the basin,and this line allows the McKinley and Lee Ranchmines to ship coal to power plants in Arizona. Otherareas within the San Juan Basin lack coal developmentin part because of this lack of rail transportation.
In the past, several rail lines have been proposed toprovide access to markets, but a major stumblingblock has been land access. Although the federal gov-ernment owns large portions of land in the basin, fed-eral lands are broadly dispersed among tribal, state,and private lands, in checkerboard fashion (see articleby Hiles in this guidebook).
The market for New Mexico coal is limited to NewMexico and the greater Southwest, but most of thesurrounding states also produce coal. Although NewMexico coal is of a desirable quality that surpassesother coal in the market area—moderate to low sulfurcontent, high Btu values—transportation and the highcost of mining multiple thin seams has limited themarket.
MINING COSTS
The Clean Air Act of 1970 (as amended in 1990)made the sulfur content of coal relative to its Btuvalue a major criterion in meeting emission standards.The lower sulfur standard led to a nation-wide shift tolow-sulfur coal at generating stations and contributedto the growth of Wyoming’s Powder River Basin coalindustry, with its vast reserves of low-sulfur coal. ThePowder River Basin has 14.7 billion tons of surface-minable, low-sulfur coal compared to the 1.6 billiontons of low-sulfur coal in the San Juan Basin.Development of the Powder River Basin has influ-enced the entire U.S. coal market. The thick, low-sul-fur coal beds in this region allow for very low coalprices, and the extensive rail network in Wyomingallows Powder River Basin coal to be shipped any-where in the country.
Wyoming coal currently dominates the industrythroughout the U.S. The Power River Basin producesabout 30% of the nation’s coal. The cost of Wyomingcoal in 2000 was $5.45/short ton at the mine; theaverage cost of New Mexico coal in 2000 was$20.29/short ton. The net result is that Wyoming coal
68

SAN JUAN BASIN
C O A L E N E R G Y & E L E C T R I C G E N E R A T I O N
can be shipped far greater distances before approach-ing the cost of New Mexico coal at the mine.
In addition to extraction costs, reclamation and safe-ty regulations are part of the coal mining economics.The Coal Mine Health and Safety Act (1969) and theSurface Mine Control and Reclamation Act (1977)added many safety and reclamation regulations.Compliance with these regulations increased miningcosts and made it difficult for small operators to stayin business. The average price of New Mexico coal in1974 was under $5/short ton. Between 1974 and1981 the price jumped to over $17/short ton. Smallercompanies have gotten out of the coal-mining busi-ness, and large corporations now own most of today’soperating mines.
The Clean Air Act directly affected the electric gen-eration industry, a major consumer of coal and hashad a significant influence on the coal industry.Pollution controls at the San Juan generating station,for instance, account for 35% of the operating costs.Electric utilities consume 87% of the nation’s coal pro-duction. Approximately 56% of all electricity generat-ed in the U.S. comes from coal-fired generating plants.The dependence on coal to produce electricity variesdepending on the region. In New Mexico 46% of thestate’s total energy needs including electricity, gasolinefor cars, and propane for heating is produced fromburning coal. The cost of electricity in New Mexico isdirectly tied to the cost of New Mexico’s coal becausealmost all coal burned at power plants within the stateis locally mined. The real price of coal has declined inpart because of the greater competition, greater pro-ductivity, and the replacement of long-term contractswith reliance on short-term or spot market pricing byutilities. With the pending deregulation of utilities, thecoal industry may have to find other ways to cut coststo stay competitive.
TAXES
The last part of the coal economics equation is taxeslevied on coal production. Taxes on coal productionare complex and vary from state to state. Most stateshave four types of tax: sales, corporate income, prop-erty, and severance. Royalties are also paid to theowner of the property from which coal is mined, be itstate, federal, tribal governments, or private entities.Sales, corporate income, and property taxes are com-mon for an individual or company to pay, but sever-ance taxes are unique to the mining industry.Severance taxes are levied on the value or volume ofmaterial extracted from the ground. These taxes may
be levied by percent of value (ad valorem) or per unit,or as a combination of the two.
The average effective tax rate (the actual collectionsdivided by output or by gross revenue) in NewMexico is high compared with other western states’tax rates (Fig. 3). Only Montana has a higher tax ratethan New Mexico. When calculated by cost per ton,New Mexico is actually the highest in the westernstates (Fig. 4). Figure 3 shows the breakdown of thedifferent taxes and illustrates where New Mexico hashigher tax rates. Neither Utah nor Montana chargessales tax on coal, and Colorado charges a small frac-tion of a percent. In fact, all states except Arizona andNew Mexico provide an exemption on sales tax forcoal sold to utilities. These two states levy a sales taxon both electricity and coal, resulting in a double tax-ation on coal: once as a product from the mine andthen again as a component of the price of electricity.
Utah and Arizona do not charge severance tax. Theseverance tax in New Mexico consists of a severancetax (2.67%) and severance surtax (2.03%). Beginningin 1990, any coal sold under new contract is exemptfrom the surtax, effectively lowering the total sever-ance tax by 43%. This legislation was renewed in the1999 legislature until June 30, 2009. The exemption
69
Sta te Vo lume Average Price Average Effective(1,000 tons) ($/ton) Coal Tax Rate
($/ton)
Arizona 11,787 NA NA
Colorado 29,989 17.23 0.55
Montana 41,102 8.82 1.34
New Mexico 29,156 20.97 2.54
Utah 26,373 17.33 0.10
Wyoming 337,119 5.38 0.51
FIGURE 3 Western states coal production and averageprice for 1999 (EIA, 2001).
FIGURE 4 Average effective coal tax rates by state—percentof gross receipts. From O’Donnell and Clifford, 1999.
U T A Z CO W Y N M M T
Sales 0 1.8% .03% 0.1% 5.3% 0
Severance 0 0 2.6% 4.8% 4.7% 10.5%
Property 0.6% 0.8% 0.5% 4.4% 1.3% 1.0%
Other 0 0% 0% 0% 0.8% 3.7%
Total 0.6% 2.6% 3.2% 9.4% 12.1% 15.2%

C H A P T E R T H R E E
DECISION-MAKERS FIELD GUIDE 2002
70
also applies to pre-existing contracts but only toamounts sold in excess of average sales from 1987 to1989. This legislation has resulted in great savings tothe New Mexico coal industry. The prospective elimi-nation of the severance surtax is on the horizon. Thesurtax will likely be eliminated as present contractsexpire. This will remove a $0.60 charge on each ton ofcoal produced and reduce the effective severance taxrate in New Mexico to 2.67%.
For many years coal mines operating on the NavajoNation paid taxes to both the State of New Mexicoand the Navajo Nation, but legislation passed in 2001permits mines operating on Navajo Nation lands andpaying taxes to the Navajo Nation to qualify for acredit against gross receipts tax due the state. Thisnew credit means substantial savings for the McKinleyand Navajo mines and any new mines to operate onNavajo Nation land. With this legislation and theelimination of the severance surtax, New Mexico’s coaltaxes will be more in line with those of other westernstates.
The remaining taxes, property and other (e.g.,resource excise, conservation) shown in Figure 3 arelow for New Mexico. Property tax constitutes a largepercentage of the tax burden in Wyoming, andMontana levies a “coal gross proceeds tax” amountingto 3.7% of the effective tax rate.
CONCLUSION
If we examine all the factors (geology, transportation,market, and taxes), we can better understand whyNew Mexico coal is relatively expensive compared tocoal from other western states (Fig. 4). Most of NewMexico’s coal mines are 20 years old or older, whichmeans the reserves in the mines are deeper and moreexpensive to mine now than at the beginning of eachmine’s operation. The San Juan mine switch from sur-face to underground operations is in response to theincreased cost of surface mining. By going under-ground, San Juan hopes to maintain a competitiveproduct. No new mines have been developed in theSan Juan Basin for many years, in part because of thelack of transportation and the inability to reach newmarkets, as well as the high cost of mining the multi-ple thin seams characteristic of San Juan Basin coal.Some areas that have potentially economic coalreserves have not been developed because of landaccess issues. Land access issues are a major stumblingblock for new mines trying to acquire land and right-of-ways for transportation. In the 1990s there was noreal demand for new coal resources in the New
Mexico market area, but with the recent energy crisisin California there has been renewed interest in coal.The most viable option for new coal mines in NewMexico is captive mines, where coal is shipped direct-ly to a nearby generating station and electricity, notcoal, is transported to its destination.
Before electric utility deregulation, the cost of NewMexico coal was not as much of an issue as it is intoday’s market. Deregulation of the electric utilitieswould likely bring greater pressure on the coal indus-try to lower the cost of coal. Recently, several contractsbetween local coal companies and the utilities havebeen renegotiated, but more cost-cutting measuresmay be necessary to maintain a competitive coalindustry in New Mexico. Some of these cost-cuttingmeasures may have to come in the form of tax relief.Major reductions in coal production would adverselyaffect the state’s economy, not only in decreased rev-enues for the state but also in jobs lost within thestate.
REFERENCES
Energy Information Administration, February 1999, U.S. CoalReserves: 1997 Update: U.S. Department of Energy, EnergyInformation Administration, Report DOE/EIA-0529 (97) Fig.A2.
Energy Information Administration, June 2001, Coal IndustryAnnual 1999: U.S. Department of Energy, Energy InformationAdministration, Report DOE/EIA-0584 (99), Figs. 1, 25, 80.
Hoffman, G.K. 1996, Demonstrated reserve base for coal in NewMexico, modified from final report for cooperative agreementDOE-FC0193EI23974: New Mexico Bureau of Mines andMineral Resources Open-file report 428, 89 p., 2 appendices.
U.S. Department of Interior, Minerals Management Survey, 2001,Fig. 33. Summary of mineral revenues distributed to States fromFederal mineral leases by revenue type, Fiscal Year 2000: inMineral Revenues 2000-Report on Receipts from Federal andAmerican Indian Leases, http://www.mrm.mms.gov/Stats/pdf-docs/mrr00pre.pdf accessed October 24, 2001.
O’Donnell, K., and Clifford, T., 1999, Taxation of Coal Productionin the Western States: in State Tax Notes, January 11, 1999, TaxAnalysts, Arlington, Va., 20 p.
ENDNOTE1Coal in New Mexico can be divided into resources—the coal that
is in the ground—and reserves: coal that is economically pro-duceable at this time, given our current technology, the cost ofenergy, competition from other markets, etc.

SAN JUAN BASIN
C O A L E N E R G Y & E L E C T R I C G E N E R A T I O N
I’ve heard it said that the coal industry is the mostregulated business in America. Having regulated
surface coal operations for almost eight years, I thinkI’d have to agree. But if it’s one of the most regulatedindustries, it is also one of the most environmentallyresponsible. The dynamic between these two canserve as a model for striking a balance between devel-opment and environmental protection.
I’d like to introduce you to coal regulation in NewMexico by briefly summarizing:
• the laws affecting surface coal mining in NewMexico;• what goes into a surface coal mining permit;• the role the state of New Mexico plays in theoperation of a mine;• how the coal operators and the state worktogether, to protect the environment and achievequality reclamation that will be productive longafter the mine is gone.The regulation of surface coal mining is governed by
the federal Surface Mining Control and ReclamationAct (SMCRA), enacted by Congress and signed intolaw in 1977. The act created a national regulatoryauthority, the Office of Surface Mining (OSM) that isresponsible for permitting, inspection, and enforce-ment of surface coal mines through regulation (30CFR 700-7900). Title V of the act allows OSM totransfer regulatory responsibilities for surface coalmining to the states, provided that a state programthat is no less effective than SMCRA can be createdthrough statute and regulation.
New Mexico was granted primacy in 1980 with thepassage of the Surface Mining Act (NMSA 1979 69-25A-1 et seq.) and its implementing regulations,developed through the Coal Surface MiningCommission, 19.8 NMAC. New Mexico’s coal pro-gram, which is part of the EMNRD’s Mining andMinerals Division, regulates federal, state, and privatelands, excluding only lands falling within the boundsof Indian reservations, which are regulated by OSMunder the federal program.
New Mexico’s three hundred pages of coal regula-tions cover every aspect of mining and the effects itmay have on the environment or the public. These
include air quality, protection of surface and groundwater, protection of topsoil, and disposal of trash on apermitted mine. More importantly, the regulations seta standard for reclamation of lands affected by mining.
WHAT’S IN A COAL MINING PERMIT?
There are three main parts of a surface coal miningpermit application:1 Legal, Financial, Compliance, and Related InformationAn applicant must provide information on who ownsthe mining company and will conduct mining.Included is a detailed description of the corporation,affiliated corporations, and the parent corporation.The federal Office of Surface Mining established theApplicator Violation System, which uses this informa-tion to identify “bad actors” and prohibit them fromoperating a coal mine anywhere in the U.S. This partof the permit also identifies all landowners of surfaceor mineral estates, any other permits and licenses thatmay be needed (NPDES, MSHA, etc.), and documen-tation that the applicant has a right-of-entry or leasesto conduct mining.2 Background on Existing Environmental Conditions Apermit must contain detailed information about thenature of the site before mining. This includes sec-tions on surface and ground water hydrology, geology,topography, climate, vegetation, soils, fish and wildlife(including threatened and endangered species), andcurrent, pre-mining land use. There are specificrequirements for the various types of information list-ed in each section. For example under vegetation, anapplicant must collect:
• A comprehensive listing of species by plantcommunity;• Information on ground cover, and frequencyand constancy values for each species (herba-ceous, tree, and shrub);• Acreages for each community correlated tosoils, slope, and aspect;• Information on the above that is collected overtwo growing seasons.
3 A Reclamation and Operations Plan The purpose forcollecting the environmental information is to developa reclamation plan that will reconstruct as many of the
71
Regulation of the Coal Industryin New Mexico
James O’Hara, New Mexico Energy, Minerals and NaturalResources Department

C H A P T E R T H R E E
DECISION-MAKERS FIELD GUIDE 2002
pre-mining conditions as possible. The reclamationplan includes an approved post-mining land-use andtopography, replacement of topsoil, the type of vegeta-tion (seed mix) needed to meet post-mining land uses,and any special mitigation required to prevent toxic oracid-forming materials from affecting the long-termviability of the final reclamation.
The operation plan sets forth a process by whichcoal will be mined and all the requirements of thereclamation plan will be implemented. Unlike othertypes of mining reclamation, coal mine reclamation iscontemporaneous with the removal of coal. There arestrict provisions that limit the amount of disturbancethat may take place without corresponding reclama-tion.
HOW ARE PERMITS APPROVED?
When an application is received by the Mining andMinerals Division (MMD) it undergoes an in-depth
review to ensure that all of the elements are present,correct, and in the prescribed detail. The Mining andMinerals Division works with the applicant until theapplication is administratively complete. At that timethe public is notified and given the opportunity toreview and comment on the application. Public hear-ings may be held, and additional technical issues aretypically addressed.
Upon completion of the public comment period, thedirector will make a decision on the disposition of apermit. If it is judged to be approvable, the operatormust submit a bond that is based on a calculation ofwhat it would cost MMD to complete reclamationshould the operator go out of business or not meet thepermit requirements. The regulations specify that abond adequate to carry out reclamation must be heldfor no less than ten years after the last seeding is com-pleted and specific performance standards have beenmet, based on a post-mining land use. For example,
72
Mine Mine location Permit are a Acres Current Phase Amount Acres (County) (acres) disturbed bond released released released
Ancho2 Colfax 15,909 2,080 $10,000,000
Black Diamond1 San Juan 249 23 $89,732 I $134,597 23
Carbon No. 21 McKinley 361 308 $308,000 I $2,976,687 468.4II $1,676,458 308
Cimarron1 Colfax 5114 54 $1,102,694
De-Na-Zin1 San Juan 820 172 $251,402 I $2,815,176 170II $1,373,980 149.3
Fence Lake3 Catron & Cibola 17,702 0 $7,739,773
Fence Lake No. 11 Catron 500 116 $998,743 I $665,829 92.6
Gateway1 San Juan 600 144 $468,742 I $703,113 144.1II $260,811 144.1
La Plata2 San Juan 3,300 1,902 $56,000,000
Lee Ranch2 McKinley 15,522 4,835 $75,500,000
McKinley2 McKinley 10,727 4,262 $44,489,000 Liability Release $0 1,745.6
Mentmore McKinley 1,813 1,746 $1,587,000 I $0 618.9Section 33 Final $0 455.7Industrial Park1
San Juan2 San Juan 18,050 5,127 $67,000,000 I $0 1,832NW Pinion Final $0 236.74
York Canyon Colfax 2,733 1,174 $2,258,000 I & II $5,525,319 1,053Surface1
York Canyon Colfax 4,792 650 $14,598,577 I & II $2,210,019 190Underground1
1No production, all areas are under reclamation in the 10-year liability period; 2Currently producing coal, with areas of reclamation in the 10-year liabilityperiod; 3Permitted, but has not begun mining operations.
FIGURE 1 A summary of New Mexico’s surface coal mine oper-ations in 2001.

SAN JUAN BASIN
C O A L E N E R G Y & E L E C T R I C G E N E R A T I O N 73
criteria for the amount of ground cover, production,diversity, and shrub reestablishment are specified inthe permit. Once the bond instrument is in place, thepermit can be approved. It can take up to a year ormore to process a new application, depending on thequality of the submittal.
One last comment on the permitting process: Theregulations include provisions for appealing a permit-ting decision. This ensures that the public interest isprotected.
WHAT GOES ON DURING THE LIFE OF A COAL-MINING OPERATION?
Most of the permitted coal mines have a minimum lifeof about twenty years for the smaller mines and thirtyto fifty years for the larger ones. During this timeMMD relies on a series of performance standards andthe stipulations of the permit to inspect and enforceall operations; violations can be written on infractionsof the rules or the permit. Inspections to review howwell the mine is following its operation and reclama-tion plans are conducted on a monthly basis.
Permits are generally renewed every five years. Arenewal is similar to a new application, except that amine has a right of successive renewal unless an oppo-nent can show the director that the original permitwas improvidently issued. The purpose of renewals isto update permits and fine-tune issues associated withoperation or reclamation planning. Permits will oftenundergo minor changes that do not go through a pub-lic notice process. MMD completes 50–75 modifica-tions for its mines every year.
BOND RELEASE - GETTING CLOSURE
Since reclamation is contemporaneous with mining,bonds are recalculated every couple of years andadjusted as necessary. As reclamation is completed,permittees can also apply for phased bond releases.Phase I credits completion of backfilling and gradingby establishment of an approved post-mining topogra-phy. Phase II recognizes revegetation success and eval-uates the performance standards for successful revege-tation included in the permit. A bond can be reducedupon the director’s approval of a bond release applica-tion. Final bond release, Phase III, documents that thepermittee has waited ten years and demonstrated tothe director that the reclaimed lands can support thepost-mining land use, which in most cases is grazing.Once the bond is released, the permit is terminated.
A SUMMARY OF COAL PERMITS IN NEW MEXICO
New Mexico has 16 surface coal mines currently per-mitted (Fig. 1). Ten of these are under the ten-yearreclamation liability period and are not in production.Five are under production, producing about 20 mil-lion short tons of coal a year. The remaining mine,Fence Lake, is permitted but has not begun operation.
Coal mining continues to be an important elementof New Mexico’s economy. The regulatory processseeks to strike a balance between the economic andenergy needs of the nation and protection of the envi-ronment.

C H A P T E R T H R E E
DECISION-MAKERS FIELD GUIDE 2002
74
Coal Mine Reclamationin New Mexico
Douglas Bland, Mining and Minerals Division, New MexicoEnergy, Minerals and Natural Resources Department
The primary goal of coal mine reclamation is theestablishment of an appropriate post-mining land
use. Regulations require that disturbed areas bereturned to the approximate original contour of theland. In this paper I will discuss standard reclamationpractices that have been used at most mines in NewMexico. I will also discuss how we address areas thathave steep slopes or that require drainages be recon-structed, and special habitat areas where unique recla-mation techniques are used to create diversity in land-forms and wildlife habitat.
There are differences of opinion regarding the mostappropriate post-mining land use for mine sites. Inaddition, there can be disagreements as to whether themine should be constructed at all. One reason foropposition to energy development is use of the landfor religious purposes. In New Mexico, NativeAmericans claim that development on certain landsmay impede their historic use of the land for religiouspractice. Such claims can be made even if title to theland is not currently held by the claimant. In 2000 theNew Mexico Legislature passed the Religious FreedomRestoration Act to address this issue. At the end of thepaper I’ve included a discussion of the ReligiousFreedom Restoration Act and its implications for coalmining.
STANDARD RECLAMATION: PRODUCTIVESHRUB/GRASSLANDS
Grazing land and wildlife habitat are the most com-mon post-mine land uses for New Mexico reclama-tion. Creating a diverse, effective, and permanent veg-etative cover on all affected lands is the best way toachieve these land uses (Fig. 1).
Standard reclamation practices on coal mines aregeared toward maximizing the potential for post-mineplant productivity. All surface or strip coal mines cre-ate open pits when the coal is removed. The backfill-ing and grading operations following coal removaltypically result in a gentle, rolling reclamation topog-raphy (Fig. 1). Any rock or other material that is toxicor detrimental to plant growth is buried below the root-ing zone. Soils are generally more evenly distributed, in
terms of both location and depth, than they werebefore mining. Native grasses, shrubs, and forbs areseeded; each species is selected for its ease of estab-lishment, adaptation to site conditions, and seasonalforage value. Management of surface water and pre-cipitation runoff is usually better than the pre-minecondition. Finally, careful management is applied toall reclaimed lands during the minimum 10-year bondliability period.
FIGURE 1 Reclaimed land including a small area depres-sion and productive grasslands at Ancho mine, ColfaxCounty, New Mexico.
The reclamation bond liability period can bethought of as a proving-up time. Livestock grazing isconducted, revegetation is monitored, and wildlifeusage is recorded. The quantity and quality of surfaceand ground water are also monitored. The mine oper-ator is required to demonstrate that reclaimed landscan and do support the post-mine land use, whilemeeting all approved revegetation and hydrology suc-cess criteria, and the bond is not released unless thepost-mine land use has been successfully implement-ed.
The results of these reclamation practices areimpressive. Post-mine production of palatable forage istypically double the pre-mine productivity. If the site

SAN JUAN BASIN
C O A L E N E R G Y & E L E C T R I C G E N E R A T I O N 75
was in poor range condition before mining, the post-mine vegetation productivity gains can be much high-er. Without question, the essential reclamation man-dates are being achieved in New Mexico.
Although reclamation of coal mines has been ongo-ing since the federal Surface Mining Control andReclamation Act was passed in 1977, it is an evolvingscience. The following topics discuss refinements andenhancements to basic reclamation that are beingincorporated into reclamation practices in New Mexico.
Adjacent undisturbed areas can provide models fordrainage construction. Sinuosity within low-flowchannels is used to reduce drainage gradients and ero-sion potential. Rock fragments that do not easily washaway may be used at critical spots in the drainage bot-tom. Wider flood-stage channels are added in the larg-er drainages to spread and slow the runoff from majorprecipitation events.
SPECIAL HABITAT FEATURES
Special habitat features include badlands and cliffs,small area depressions, and wetlands. The creation ofspecial habitat features is an important component ofmodern reclamation. Animal and plant species diversi-ty on the reclaimed landscape is dependent on thecreation of a variety of appropriate habitats.
The reclamation of badland sites, such as theGateway mine in the San Juan Basin, present someunique challenges. The Gateway mine is on state trustlands that were used for grazing before mining; graz-ing is also the post-mining land use. The coal that wasmined there provided much more revenue to publicschools than badland grazing ever could. The absenceof fertile, or even neutral, soil material made it verydifficult to establish an effective vegetative cover.Several experimental soil amendments were tried atGateway to improve reclamation success, includingvarious combinations of wood chips, fertilizer, calci-um chloride, gypsum, and phosphorus. However, redscoria gravel, which was salvaged before mining andapplied as surface mulch during reclamation, resultedin the best vegetative cover. Forage production onGateway reclamation, although still sparse, is seventimes greater than was measured before mining.
Sandstone-capped plateaus, mesas, and cuestas arecommon and dramatic pre-mine features that areimportant both to plant and animal diversity as wellas to the aesthetic value of the landscape. Severalcompetent sandstone highwall segments at NewMexico coal mines have been retained as cliff habitat.Recently a raven established a nest on one reclamationcliff while grading operations were still being complet-ed. Rock surfaces concentrate precipitation andenhance soil moisture at the bases of cliffs. Theincreased moisture encourages the establishment oftrees and shrubs, and the depressions created at thebases of cliffs provide seasonal water sources (Fig. 3).
Small area depressions are commonly built on recla-mation to furnish temporary drinking water for live-stock and wildlife, to control erosion, and to createvegetation diversity. They also provide breeding habi-
FIGURE 2 Complex slopes and drainage construction atSan Juan mine, San Juan County, New Mexico.
STEEP SLOPE AND DRAINAGE CONSTRUCTION
Revegetation can take several seasons to become fullyestablished in New Mexico because of our generallydry climate and the use of perennial species that takemore than one year to mature. Erosion can be a prob-lem during the first few years following seeding whensurface roughness, mulch, and sparse annual weedcover are the only protection against the forces ofnature. Cut-and-fill terraces and rock-lined drains aresometimes used to limit erosion on steeper slopes, butthe long-term stability of terraces and drains is a con-cern. Complex slopes, talus slopes, and substrateswith high coarse rock fragment concentrations can beeffective alternatives to terraces for steep-slope recla-mation. Erosion control is achieved on complex slopesby creating branched drainage patterns. The length ofsteep slopes is thereby effectively shortened, reducingrunoff velocity. Slopes are built with an overall con-cave longitudinal profile, steeper at the top and flatterat the bottom, so that gradients are reduced as surfacerunoff accumulates (Fig. 2).

C H A P T E R T H R E E
DECISION-MAKERS FIELD GUIDE 2002
76
tat for insects and amphibians, and foraging sites forpredators. Depressions are completely incised andhave gentle slopes, and they are re-soiled in a mannerconsistent with adjoining areas. Depending on the cli-mate of the site and the size of the contributing water-shed, small area depressions may vary from westernwheatgrass-dominated communities to seasonal wet-lands.
Rare plant species are commonly associated withshale and sandstone rock outcrops or springs andseeps. Mitigation is required when mining impactssprings or other wetland habitat, or if the plants arelisted as threatened or endangered. Sediment andflood control ponds may be retained as wetlands ordeveloped water resources, with landowner concur-rence. Ponds fed by artesian wells have also been usedto replace spring-fed wetlands. Outcrop-type rareplant habitat can be provided by simply not re-soilingsmall areas of reclamation, where the rocky materialprovides suitable physical and chemical characteristicsfor the species of concern, and then transplanting theplants and a bucketful of their original soil to thereplacement site.
FIGURE 3 Reclamation cliff at Mentmore mine, McKinleyCounty, New Mexico.
The science of reclamation is evolving. Naturalecosystems are extremely complicated, and as under-standing of them expands, so do efforts to address thecritical elements of re-creating ecosystems that areboth useful and long-lasting.
ACKNOWLEDGMENTS
Many thanks to Dave Clark, Senior Reclamation Specialist with the
Mining and Minerals Division, for his assistance with this paper.

SAN JUAN BASIN
C O A L E N E R G Y & E L E C T R I C G E N E R A T I O N 77
Because religious practice is highlyprotected under our laws, the gov-ernment bears a heavy burden tojustify its restriction with a “com-pelling governmental interest.”
“Least restrictive means” In addi-tion to requiring the government tojustify its regulation by compellinginterest, the government must showthat its regulation is narrowly tai-lored to achieve its purpose.
The proper forum for a RFRAchallenge appears to be the DistrictCourt. The legislature provided thatRFRA violations may be asserted “asa claim or defense in a judicial pro-ceeding and obtain appropriaterelief including injunctive ordeclaratory relief and damages pur-suant to the Tort Claims Act.”“Judicial proceeding” refers toDistrict Court. This may result in asecond, separate process being usedby challengers to government per-mits or actions as a sort of citizenssuit, in that a challenged decisionproceeds through normal adminis-trative appeal channels, while at thesame time someone can bring aRFRA challenge in District Court,without going through administra-tive channels.
Exactly how and under what cir-cumstances New Mexico’s newlyenacted RFRA will be used is notyet known. However, the clearmessage is that religious freedom isan important issue to the state leg-islature and the governor, and itmust be properly considered whenenergy and mineral development iscontemplated in areas where this isan issue.
A the restriction is in the formof a rule of general applicabilityand does not directly discrimi-nate against religion or amongreligions; andB the application of the restric-tion is essential to further acompelling governmental inter-est and is the least restrictivemeans of furthering that com-pelling governmental interest.
RFRA goes on to provide forinjunctive and declaratory reliefand damages pursuant to the TortClaims Act.
RFRA analysis requires consider-ation of several key phrases inorder to better understand thestatute.
“Substantially motivated” Anyanalysis of a RFRA issue mustbegin with the question whetherthe “free exercise of religion” isinvolved. Under RFRA, the reli-gious conduct sought to be pro-tected must be “substantially moti-vated by religious belief.” (“Freeexercise of religion” means an actor refusal to act that is substantiallymotivated by religious belief.”)
“General applicability” This sim-ply means that a restriction mustapply equally across the board toeveryone. Any restriction that tar-gets a specific group will be invalid.
“Compelling governmental inter-est” RFRA does not prohibit everygovernmental restriction thatimpacts religious practice. It essen-tially contains a balancing test,under which the governmental jus-tification for the restriction isweighed against the practice.
P roper reclamation becomes amajor issue at a mine site only
after mining begins. The decision tobegin mining involves successfullyaddressing any challenges as towhether mining is appropriate forthe site. One mechanism that maybe used to prevent mining fromstarting is the Religious FreedomRestoration Act (RFRA), signed intolaw by Governor Gary Johnson in2000.
In the 1990s Congress passed thefederal RFRA in response to certaincourt decisions that were perceivedby some to unduly restrict certainreligious practices. RFRA wasintended to change the law in orderto provide more religious protec-tion. Subsequently, the federalRFRA was found unconstitutionalon the grounds that it was beyondthe power of the U.S. Congress, andthe court ruled that the states alonecould pass such legislation. Manystates including New Mexico havesince passed their own RFRA. Thereis currently very little case law onRFRA, because states have justbegun to pass RFRAs. General FirstAmendment law will likely be usedin RFRA analysis, because RFRAalso addresses the protections con-tained in First Amendment law. Tobetter understand the positioncourts have taken on such issues inspecific circumstances, case lawrelated to the First Amendmentshould be consulted.
In part, the New Mexico RFRAprovides that a government agencyshall not restrict a person’s free exer-cise of religion unless:
The Religious Freedom Restoration Act

C H A P T E R T H R E E
DECISION-MAKERS FIELD GUIDE 2002
Most New Mexicans understand that New Mexicois an “oil and gas state.” We are among the
nation’s top producers of those energy forms. Butmany don’t know that New Mexico is blessed withhuge coal reserves, as well. In fact, our coal reserve—the amount of coal in the ground—are the fourthlargest in the United States. Yet New Mexico takes lit-tle advantage of these rich reserves. As a coal producer—actually pulling coal out of the ground—we onlyrank 13th nationwide.
Why? Rail service from the Four Corners area, siteof the state’s largest coal reserves, is virtually nonexist-ent. Coal in New Mexico is used primarily at powerstations built at the mouth of a mine. As a result, coalmined in New Mexico is used primarily for electricityproduction at two major generating stations: the SanJuan Generating Station, operated by Public ServiceCompany of New Mexico (PNM), and the FourCorners Power Station, operated by Arizona PublicService Company.
San Juan Generating Station is the seventh largestcoal-fired generator in the western United States. Theplant burns between 6.5 and 7 million short tons ofcoal a year. The nearly 1,800 megawatts of energyproduced at the station, located in the northwesterncorner of New Mexico, serves PNM’s approximately369,000 electric customers in Albuquerque, Santa Fe,Las Vegas, Clayton, and Deming. Power producedhere but not needed for PNM customers or the plant’sother owners reaches across the West through a trans-mission network that stretches across 11 westernstates, two Canadian provinces, and into Baja, Mexico.With eight different owners from as far away as south-ern California to nearby Farmington, New Mexico, theplant’s product is a vital part of the regional economy.
The nearby Four Corners Power Plant, operated byArizona Public Service, provides even more energy, at2,040 megawatts. Together, the two plants produceenough energy for more than 3.6 million homes. Theirlocation on the western grid, with major switchingfacilities, makes the two power plants key facilities inthe Southwest. Despite this, when a unit goes down,power flows across the transmission system from othergenerators, and PNM customers don’t even notice.
RELIANCE ON COAL
PNM customers rely on coal for the majority of theirelectricity. But other resources make up the fuelmix. Nuclear power from Palo Verde NuclearGenerating Station west of Phoenix provides about24% of the energy PNM customers might use on anygiven day. Eighteen percent of the energy PNM pro-duces comes from natural gas and oil. Still, coalremains the workhorse fuel, providing 58% of theenergy for our New Mexico customers. Nationally,the United States burns coal for about 51% of itselectricity generation.
The average PNM customer uses 526 kilowatt-hours of electricity a month. If all this energy camefrom coal, it would take about 660 pounds of coaleach month to generate that amount of electricity. Atthis writing (January 2002), PNM is exploringrenewable resources like wind for investment in ourenergy future. But today, and into the foreseeablefuture, PNM and other utilities will continue to relyheavily on coal for meeting our energy needs.
In order for coal to be used far into the future, itmust be burned as cleanly as possible. More than 25years old, the San Juan Generating Station meets allregulations for air emissions. It has also been a zero-discharge plant since 1983, keeping all water dis-charged on the plant site rather than returning it tothe area’s rivers and streams. But strict compliancewith environmental law is only part of the station’sfocus. The plant has substantially “raised the bar” onemissions and other environmental practices. We’vemade a serious commitment to getting the most outof every ton of coal burned while reducing emis-sions at the same time.
For example, between 1997 and 2001, we wereable to dramatically reduce sulfur dioxide emissionsby 50%, even while we burned more coal (Fig. 1).And, the plant has teamed up with BHP Minerals,supplier of the coal the plant burns, to providecleaner-burning coal at a reduced cost. This kind ofinnovative thinking will lead to the development ofthe largest longwall mining operation in NorthAmerica. And it’s located right in San Juan County.
78
Coal-Fired Electric Power Generationin New Mexico
Pat Goodman, Public Service Company of New Mexico

SAN JUAN BASIN
C O A L E N E R G Y & E L E C T R I C G E N E R A T I O N
REDUCING AIR EMISSIONS
Burning coal with less and less emissions is at theheart of PNM’s goals for its coal-fired generation. NewMexico had some of the most stringent state laws forair quality in the nation when the majority of SanJuan Generating Station was under construction in the1970s. To meet those standards, PNM installed astate-of-the-art and very expensive air emissions con-trol system. The system allowed the plant to meet thenew air quality laws of the time.
That original Wellman-Lord regenerative sulfurdioxide-removal system was replaced with a newlimestone-forced oxidization system in mid-1998. Thenew system takes gases from the flue, once combus-tion is complete, and forces them through a spray oflimestone slurry in huge absorber cells. The slurrycontaining the gases becomes calcium sulfate, or gyp-sum. Once the moisture is removed, the gypsum canbe safely returned to the mine to be buried as part ofthe mine reclamation process.
The new limestone system not only performs better,reducing emissions such as sulfur dioxide by about50% over the old system, but it also costs much lessto run. Operating and capital costs related to the new
system also dropped a significant $20 million a yearfor the plant’s owners, helping to keep San Juanpower prices competitive in the marketplace and rateslow for PNM customers. And the numbers continue toimprove with our expanding operating knowledge andexperience.
Nitrogen oxide (NOx) is another significant emis-sion associated with coal burning. The plant hasinstalled low-NOx burners and burns coal at slightlylower temperatures to further reduce NOx emissions.The electrostatic precipitators at the plant remove99.7% of the particulates from the flue gas to ensurecleaner emissions.
SAN JUAN GENERATING STATION’SENVIRONMENTAL MANAGEMENT SYSTEM
Emissions control systems are only part of the solutionto burning coal cleaner. In 1999 the San JuanGenerating Station took an ambitious step by imple-menting an Environmental Management System(EMS). And we took it one step farther with our com-mitment to obtain ISO 14001 certification.
ISO 14001 standards are international standards forenvironmental management systems that are set by the
79
FIGURE 1
C H A P T E R T H R E E
DECISION-MAKERS FIELD GUIDE 2002
International Organization for Standardization inSwitzerland. The standards are based on the conceptof continuous improvement of environmental per-formance. In March 2000 an independent auditor cer-tified San Juan Generating Station’s EnvironmentalManagement System to the ISO 14001 standards.
In December 2000 the San Juan Generating Stationwas recognized by the Environmental ProtectionAgency (EPA) as a charter member in its PerformanceTrack Program. The Performance Track Program wasdeveloped by the EPA to recognize companies thatachieve superior environmental performance and todevelop partnerships with these companies. San Juanwas one of only two coal-fired generating stations inthe United States to be recognized as a charter mem-ber in the Performance Track Program.
San Juan’s membership in the Performance TrackProgram includes a commitment to additional reduc-tions in emissions and support of the recovery ofendangered species. As part of the Performance TrackProgram, San Juan Generating Station recently signeda contract with Phoenix Cement to provide fly ash foruse in cement products and road building. This repre-sents a significant reduction in solid waste to beburied as part of the mine reclamation process—areduction of about 300,000 short tons a year.
The plant has served as a model for other powerplants PNM operates. The company is committed toimplementing an Environmental Management Systemat all its power plant facilities, from the oldest mem-bers of the generating station “fleet,” to the newestplants under construction today.
A NEW COAL SUPPLY
Later this year, the coal supply for San JuanGenerating Station will come from a new source. BHPMinerals, owner and operator of the mine located nextto the plant, is currently making the transition fromits surface mining operation to an underground mine.
To mine the coal, BHP Minerals has invested in new“longwall mining” equipment. The technologyemploys massive hydraulic roof supports and speedyconveyer belts to mine and move large amounts ofcoal. The underground facility will take advantage oflarge underground coal seams that could not bereached by surface mining equipment. The coal that isremoved will not contain the dirt or other materialsoften found in the surface-mined coal. As a result, theplant will receive higher grade coal. Switching to anunderground mine will allow the mining company tooffer a lower-priced and cleaner-burning coal supply,
keeping San Juan Generating Station’s future powersupply economic and competitive long into the future.
FUEL DIVERSITY
Investing in power plants is capital intensive. San JuanGenerating Station represents a total investment ofover $1 billion today. Those costs have been borne notonly by utility customers but also by shareholders andother owners in the plant. Selling the plant’s excesspower when available also helps keep costs down. Theend result is competitively priced electricity.
Part of what helps keep prices competitive is theconcept known as “fuel diversity.” PNM’s generationresources represent a mixture of fuels, from coal tonuclear to natural gas and oil. Each source is traded ina larger market for energy. Most consumers are famil-iar with the volatility of the market when it comes tonatural gas for heating their homes. Power plants run-ning on natural gas see the same ups and downs, too.
Newer plants under construction today use clean-burning natural gas as a fuel but the cost to producethat electricity can suffer great price swings. To count-er this effect, coal-fired plants offer stable fuel costsover many decades. When managed as a portfolio ofresources, power produced by diverse fuel sourcesoffers better protection against price swings over themany decades of service that each plant provides.Each fuel has its strengths and weaknesses. Withpower plants serving 40 years or more, such decisionshave long-lasting effects.
PNM believes that there will still be a place for newcoal production in the next generation of powerplants. But these new plants will have the advantageof well-developed “clean coal technologies.” This newgeneration of coal-fired plants must address concernsabout carbon dioxide and global warming. An inte-grated gasification combined-cycle approach mayprove to offer the benefits of coal while significantlyreducing the impacts on the environment.
Utilities like PNM must consider these long-rangeimpacts and develop a clear understanding of how tomanage them. At San Juan Generating Station, we havestruck a good balance, reducing the effect of burningcoal while producing reliable, affordable energy.
ADDITIONAL RESOURCES
For more information on PNM’s power plant operations or envi-ronmental focus, visit the PNM website: www.pnm.com
For information on the electric industry in the United States, visitthe Edison Electric Institute’s website: www.eei.org
80

SAN JUAN BASIN
C O A L E N E R G Y & E L E C T R I C G E N E R A T I O N
Haze is caused when light is absorbed or scatteredby air pollution. Haze makes the view less clear
and diminishes the range of visibility. Air pollutantsthat are responsible for haze include sulfates, nitrates,organic carbons, soot, soil dust, and nitrogen dioxide.The greater the quantity of these pollutants that are inthe atmosphere, the more regional haze will obscurethe view. Generally, haze is worse in the summer whenthere is more humidity; some of the pollutants thatcause haze, such as sulfates, grow in size whenexposed to water particles. Larger particles are moreeffective at scattering and absorbing light, so hazebecomes worse. There are many sources of the air pol-
lutants that cause haze to form. Electric power gener-ating facilities are large contributors of haze-formingair pollutants. These facilities emit particulates, nitro-gen dioxide, and sulfur dioxide. Sulfates and nitratesare formed when sulfur dioxide and nitrogen dioxideare transported long distances. Other sources of airpollution that contribute to haze formation includeautomobiles, forest fires, windblown dust, and otherindustrial facilities.
The pollutants that cause haze have major impactsto our health and environment. Small particles of airpollution can be inhaled and reside in the lungs,increasing the risk of respiratory illness, damage to
81
Air Quality and the Clean Air ActAmendments
Sandra Ely and Mary Uhl, New Mexico Environment Department
FIGURE 1 Map of 156 national park and Wilderness areas pro-tected by EPA’s regional haze rule

C H A P T E R T H R E E
DECISION-MAKERS FIELD GUIDE 2002
82
FIGURE 2 Class 1 areas in New Mexico.
lung tissue, and even premature death. Sulfates andnitrates are formed from sulfur dioxide and nitrogendioxide emitted from facilities such as power plants,refineries, and copper smelters. These pollutants causeacid rain. Acid rain damages plants, buildings, andbodies of water. Acid rain may cause lakes, rivers, andstreams to become so acidic that there is harm toaquatic plants and fish. Many of the pollutants thatcause haze also contribute to the formation of ozone atground level. Ozone causes respiratory problems anddamages plants and ecosystems. Nitrogen dioxideemitted from electric power generating stations and oiland gas facilities can increase the nitrogen loading inlakes, streams, and rivers, upsetting the balance ofnutrients in the water and harming plants and fish.
In the western United States, visual range in nationalparks and Wilderness areas has decreased from anaverage of 140 miles in the late 1800s to anywherefrom 35 to 90 miles today. In the eastern UnitedStates, visual range has also decreased. In nationalparks and monuments, including Grand Canyon,Bandelier, and Yosemite, this decrease in visibility alsodecreases the quality of the visit for tourists, whileincreasing the health and environmental problemscaused by the haze-forming pollutants.
Congress mandated that the EnvironmentalProtection Agency (EPA) address the problem of hazein our nation’s parks and Wilderness areas in theClean Air Act Amendments of 1990. In 1997 EPA pro-posed a regulation to reduce emissions that cause hazeto form. The rule was issued in April 1999. It requiresstates to establish quantifiable goals for improving visi-bility and returning visibility to “natural conditions” in156 national parks and Wilderness areas (Fig. 1) bythe year 2065. The rule requires a coordinated effortbetween states because tiny particles of air pollutioncan be transported hundreds of miles by the wind.Each state must develop a plan that addresses the con-tribution of sources of air pollution to national parksand Wilderness areas within the state and in neighbor-ing states.
New Mexico has nine national parks and Wildernessareas where visibility must be improved under theEPA’s new regional haze rule (Fig. 2). These areas aredesignated as Class I areas, meriting special protectionby Congress because of their scenic vistas, wild areas,and historic landmarks. In New Mexico the Class Iareas are:
• Wheeler Peak Wilderness• San Pedro Parks Wilderness• Pecos Wilderness
• Bandelier National Monument• Bosque del Apache National Wildlife Refuge• White Mountain Wilderness• Carlsbad Caverns National Park• Salt Creek Wilderness• Gila Wilderness
These areas attract thousands of tourists to NewMexico each year. Class I areas in neighboring statesthat may be affected by air pollution from NewMexico include Mesa Verde National Park, GuadalupeMountains National Park, Weminuche Wilderness,and Chiricahua National Park. In most of these Class Iareas, visibility has been improving on the “cleanest”days over the past ten years, but degrading on the“dirtiest” days. Clean days are days when visibilityrange is greatest; dirty days are days when visibilityrange is reduced by the greatest amount. EPA’s 1997regional haze rule requires improvement in visibilityon the cleanest and the dirtiest days. At most of theseClass I areas, acid rain has also increased over the pastten years.

SAN JUAN BASIN
C O A L E N E R G Y & E L E C T R I C G E N E R A T I O N
In the San Juan Basin (San Juan, McKinley, and RioArriba Counties), there are many sources of nitrogendioxide and sulfur dioxide pollution. There are elec-tric power generation facilities, oil and gas productionand transmission facilities, refineries, other smallindustrial facilities, automobiles, wind-generated dustemissions, and occasional forest fires. There are cur-rently three large electric power generation facilities inthe San Juan Basin: Public Service Company of NewMexico’s San Juan plant, Arizona Public ServiceCompany’s Four Corners plant, and Tri-State’sEscalante plant. These three electric power generatingfacilities account for a large percentage of the emis-sions of haze-forming pollutants in the San JuanBasin; they contribute approximately 66% of the nitro-gen dioxide emissions and 92% of the sulfur dioxideemissions from industrial facilities in the region.
Transport of air pollution from the San Juan Basinand other areas of New Mexico contributes to the for-mation of regional haze in Class I areas in NewMexico and in neighboring states. For example, inBandelier National Monument 44% of the reductionin visibility on the dirtiest days in 1997 was due tosulfates, 9% to nitrates, 25% to organic carbon, 8% tosoot, and 14% to soil dust (Fig. 3). In other Class Iareas, the reduction in visibility may be due to differ-ing proportions of pollutants, depending on nearbysources and the predominant wind direction for trans-port of pollutants. Emissions from San Juan Basinfacilities do appear to be increasing, however, as mon-itored ozone concentrations have recently been elevat-ed and are close to the National Ambient Air QualityStandard for ozone.
New Mexico is currently participating in theWestern Regional Air Partnership to develop goals anda plan for reducing the emissions that form haze inthe West. The Western Regional Air Partnership mem-bership includes other states in the West, such asUtah, Arizona, and Wyoming. This organization isdetermining which sources contribute most to pollu-tants that cause haze to form, which pollutants needto be reduced, and how those reductions can be madeto achieve the visibility goals established for Class Iareas in the western U.S. Because the ultimate goal isto achieve natural visibility conditions by 2065, thestates will establish milestones every ten years toensure that the visibility improves enough incremen-tally to achieve the ultimate goal. For most of thestates in the U.S., visibility goals will be achievedthrough traditional “command and control” methods.For example, EPA has designated several categories of
air pollution facilities built between 1962 and 1977that will be required to install new air pollution con-trol technology in order to reduce pollutants that con-tribute to the formation of haze. However, severalwestern states with Class I areas on the ColoradoPlateau have the option of meeting visibility goalsthrough a combination of voluntary actions and a “capand trade” program.
The cap and trade program offers flexibility toindustry by setting caps on annual emissions.Emissions are tracked annually to determine if volun-tary reductions are keeping emissions below the caps.If the caps are exceeded, a regional trading program isinitiated, whereby industrial sources trade air pollu-
83
FIGURE 3 Pollutants that contributed to reduced visibili-ty on the worst days in 1997, Bandelier NationalMonument, New Mexico.

C H A P T E R T H R E E
DECISION-MAKERS FIELD GUIDE 2002
tion emissions credits to ensure that regional emis-sions of haze-forming pollutants do not increase fur-ther. New Mexico must submit a plan to EPA forimproving visibility between 2003 and 2008, depend-ing on whether the state intends to follow the tradi-tional command and control method or the more flex-ible cap and trade method. Careful analysis of theadvantages and disadvantages of both methods is cur-rently underway. The Air Quality Bureau is in the midstof planning several public meetings to ensure compre-hensive stakeholder involvement in the decision.
Regional haze goals for Class I areas in the West willrequire significant reductions in air pollution in NewMexico. Recent degradation in visibility in Class Iareas in and near New Mexico will have to be reversedin order to meet the requirements of this federal man-date. Power generating facility emissions contribute alarge proportion of industry-generated pollutants thatform haze, but the complete picture must be analyzedto determine which emission-reduction and air pollu-tion-control technologies will result in the greateststeps toward visibility goals and the improvement ofthe health and environment of New Mexico. The EPA’sregional haze rule offers an opportunity for the stateof New Mexico to examine not only the impacts of airpollution from New Mexico sources, but also theimpacts of sources outside of New Mexico. This coop-erative program should help to clarify the causes andcontributors to haze in New Mexico, with a long-termgoal of increasing air quality statewide.
84
SAN JUAN BASIN
C O A L E N E R G Y & E L E C T R I C G E N E R A T I O N
One of the natural byproducts of coal combustionis fly ash, the noncombustible particulate matter
that remains behind once the organic component ofcoal is consumed and the volatiles are expelled. Flyash is composed mainly of minerals and rock frag-ments that exist naturally in the coal. For many yearsthis byproduct was considered waste and required dis-posal (the fly-ash industry in the U.S. dates only tothe 1960s). But in recent years, fly ash has been deter-mined to have commercial uses and economic value,providing an important resource for other industriesand an economic gain to coal-fired power plants.Commercial uses of fly ash include as an admixture toconcrete (to improve its strength and durability), inrailway construction, as structural fill, and in wastestabilization.
New Mexico coals, high in ash content (from 13%to 27%), create a significant amount of coal combus-tion byproducts, most of which is fly ash. Of the 28.8million short tons (st) of coal produced in NewMexico in 1999, over half was delivered to three elec-trical generating stations in New Mexico.Furthermore, New Mexico coals produce fly ash withhigh silica and low calcium content, characteristicsthat make New Mexico fly ash a beneficial admixturefor portland cement concrete. The quality of NewMexico fly ash makes it marketable not only in NewMexico but throughout the Southwest.
ORIGIN OF THE ASH IN COAL
The inorganic, noncombustible portion of coal—minerals and rock particles—are introduced eitherduring or after deposition of peat, or during the coali-fication process. Minerals are transported into theswamp by water or air. Bottom-dwelling organisms inthe coal swamp may mix minerals into the peat at thetime of deposition. Windblown dust and volcanic ashcan both make significant contributions because of theslow accumulation rates of peat in the swamp envi-ronment. Swamps downwind of volcanic activity mayperiodically receive large amounts of volcanic ash.Most (95%) of the mineral matter present in coal isclay, pyrite, and calcite. Clay minerals make up60–80% of the total mineral content of coal. Clayminerals can be finely dispersed throughout the coalor form layers. During the transformation of peat to
coal, other minerals also precipitate along joints andin voids and may occur as finely disseminated parti-cles or mineral aggregates. Other noncombustibles canbe introduced during mining. Small partings are oftenmined with the coal, and some of the roof and floor,above and below the coal seam, may also be mixedwith the coal. This will add to the total content ofnoncombustible material in the coal, and ultimately tothe quantity of ash byproduct.
A BYPRODUCT OF THE COMBUSTION PROCESS
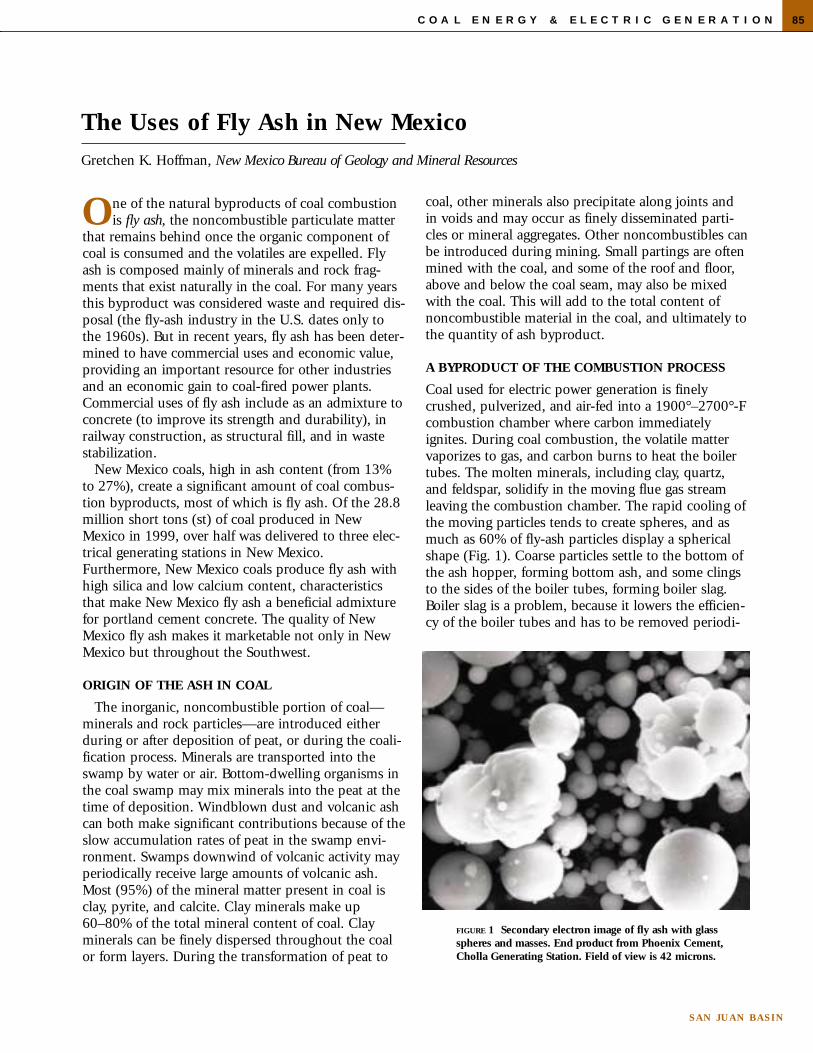
Coal used for electric power generation is finelycrushed, pulverized, and air-fed into a 1900°–2700°-Fcombustion chamber where carbon immediatelyignites. During coal combustion, the volatile mattervaporizes to gas, and carbon burns to heat the boilertubes. The molten minerals, including clay, quartz,and feldspar, solidify in the moving flue gas streamleaving the combustion chamber. The rapid cooling ofthe moving particles tends to create spheres, and asmuch as 60% of fly-ash particles display a sphericalshape (Fig. 1). Coarse particles settle to the bottom ofthe ash hopper, forming bottom ash, and some clingsto the sides of the boiler tubes, forming boiler slag.Boiler slag is a problem, because it lowers the efficien-cy of the boiler tubes and has to be removed periodi-
85
The Uses of Fly Ash in New Mexico
Gretchen K. Hoffman, New Mexico Bureau of Geology and Mineral Resources
FIGURE 1 Secondary electron image of fly ash with glassspheres and masses. End product from Phoenix Cement,Cholla Generating Station. Field of view is 42 microns.

C H A P T E R T H R E E
DECISION-MAKERS FIELD GUIDE 2002
cally. The ratio of fly ash to bottom ash produced bycoal combustion is dependent on the type of burnerand the type of boiler. Pulverized coal (PC) burnersare the most common type used for coal-fired electri-cal generation, and the fly-ash percentage for thesevaries from 65% to 85%.
Fly-ash particles consist primarily of glass spheres(often hollow) and spongy masses. Physical character-istics of fly ash include size, morphology, fineness, andspecific gravity. Fineness is usually determined by thepercentage of the ash retained on a 45-µm (325-mesh)sieve; standards requires that no more than 34% of flyash be retained. Size distribution can be quite vari-able, depending on the type of precipitator, and sizecan vary with coal even when it is from the samesource. Fly ash is removed from the flue gas stream byeither electrostatic or mechanical precipitators.
OTHER COAL COMBUSTION BYPRODUCTS
All byproducts of coal-fired electrical generation mustbe disposed of or used in some application. Coal com-bustion products (CCPs) include fly ash, bottom ash,boiler slag, and flue gas desulfurization material(FGD). Several factors determine whether thesebyproducts are marketable: (1) quality of the prod-uct—a result of the chemical and physical composi-tion, (2) consistency of product, (3) distance to andeconomics of the market for these products, (4) trans-portation network and facilities, and (5) availabilityand cost of competing materials.
The American Coal Ash Association compiles statis-tics on the use of coal combustion products in theUnited States. Of the CCPs, fly ash has the largest pro-duction, greatest usage, and widest applications. In1999, 62.67 million short tons (st) of fly ash were pro-duced in the U.S., and 33% of this was put to use.Cement, concrete, and grout capture over half of themarket for fly ash (11.35 million st). Thirty-two percentof bottom ash is used, most of it in structural fill (1.38million st) and road base/subbase (1.29 million st).Almost all boiler slag (82%) is used in the manufactureof blasting grit, because of its considerable abrasiveproperties. Only 18% of FGD is used, primarily in themanufacture of wallboard (1.60 million st). Significantamounts of FGD do not meet the purity specificationsfor wallboard without further processing. The majorityof CCPs are disposed of in ponds or landfills. Somegenerating stations that are adjacent to the coal minesupplying the coal will return the fly ash to the minefor disposal in the pits or for use in reclamation. Alldisposal methods are regulated, and all cost money.
USE OF FLY ASH IN CEMENT AND CONCRETEPRODUCTS
Fly ash is used in cement for its pozzolanic nature. Apozzolan is a siliceous or siliceous and aluminousmaterial that in itself is not cementitious—that is tosay: it does not in itself act as a cement, but reactschemically with calcium hydroxide in cement at ordi-nary temperatures to form compounds possessingcementitious properties. Natural pozzolans have beenused for centuries; both the Greeks and Romans wereaware that certain volcanic rocks, when finely groundand mixed with lime, yielded a mortar that was supe-rior in strength and resistant to fresh or salt water.
As an admixture, fly ash provides many attractivecharacteristics to concrete, including strength, durabil-ity, and increased workability. The fine grain sizeenables fly ash to fill void space within the concrete,reducing the need for fine-grained aggregate. The sizeof the fly-ash particles (0–45 µm) also improves thepacking of cementitious materials and reduces thepermeability of the concrete through pozzolanicaction. Reduced permeability means the concrete ismore resistant to chemical attacks by seawater or sul-fate-bearing ground water. The spherical shape of thefly ash increases the workability of the concrete. Useof fly ash lowers the cost of the concrete and savesenergy. Cement manufacturing is an energy intensiveprocess, so the savings can be significant. The averagecost of cement in the U.S. is $83/short ton. The aver-age cost of fly ash is approximately $22/ short ton.The use of fly ash also reduces the mining of othermaterials for cement. Because fly ash is a byproduct, ithas some advantages over other artificial and naturalpozzolans. There are environmental considerations, aswell; carbon dioxide generated in the manufacture ofcement is lowered as much as 50% with the use of flyash. The primary benefit of fly ash is to the generatingstation, reducing fly-ash disposal costs and providingadditional income through its sale.
OTHER USES
The most significant use of fly ash is in cement andconcrete products, including concrete for large con-struction projects such as dams. But there are otheruses, as well. Fly ash has been used as structural fill,in embankments, highway shoulders, and as load-bearing structural fill. It can be compacted with nor-mal construction equipment and shows little settlingcompared with conventional fill materials. Fly ash canbe used to stabilize hazardous materials by solidifyingthem into an inert mass.
86

SAN JUAN BASIN
C O A L E N E R G Y & E L E C T R I C G E N E R A T I O N
A minor amount of the total fly ash produced con-sists of hollow spheres called cenospheres, which havespecific high-value applications. Cenospheres float;consequently, they can be collected from the surface offly-ash disposal ponds. The spherical shape, smallsize, low density, relatively high-strength in uniformcompression, good thermal and acoustical insulating,and dielectric properties allow for a multitude of uses.These applications include fillers for paint, varnishes,and ceramics as well as applications in electronics.
FLY-ASH PRODUCTION IN NEW MEXICO
Most of New Mexico’s coal is used to produce electric-ity, both here in New Mexico and in Arizona. NewMexico produced 27.3 million short tons (st) of coalin 2000 from six surface operations (New MexicoEnergy, Minerals, and Natural Resources Dept., 2001),five of them in the San Juan Basin. New Mexico coalwas burned primarily at seven coal-fired electricalgenerating plants (four in New Mexico and three inArizona; see Fig. 2). The total estimated fly ash pro-duced in 1999 from these seven generating stations is4.34 million st, or about 15% of the coal consumed.In that same year, 32% of fly ash produced was land-filled or disposed on site at those plants. (Some of thefly ash from the Springerville and Cholla plants iscontaminated by the scrubbers and cannot be used inother products.) The total useable fly ash from New
Mexico coals in 1999 was estimated at about 2.4 mil-lion st. Approximately 29% of that was sold for use;the remaining 61% was used in mine reclamation oras fill in mine pits. This is a significant amount, bear-ing in mind that only 33% of the fly ash producednationwide is used, and the average usage of all coalcombustion products from the western U.S. is 20%.
MARKETING OF NEW MEXICO FLY ASH
Generating stations burning New Mexico coal selltheir fly ash to marketers for resale or admixing (Fig.2). Marketers, knowledgeable about the fly-ash mar-ket, handle the quality control, load-out facilities fortransport, technical support, sales, and promotion ofthe product for all New Mexico fly ash that is beingsold. Fig. 2 summarizes the source and ultimate desti-nation of this material. Several factors make New Mexico fly ash a marketableproduct. The high percentage (over 60%) of silica inNew Mexico fly ash is particularly important, becausethe alkaline rocks available in the region as aggregaterequire the use of high-silica ash. As with most indus-trial minerals, transportation and proximity to marketsis crucial. Some plants have rail transportation on siteor nearby. Because many of the generating stations inNew Mexico and Arizona are not close to large mar-kets, this access to railroad transportation is impor-tant. However, because fly ash is a low-cost product
87
Company Plant name Coal Ash Transportation Market are a Major use/State source ma rketer
Arizona Electric Apache/AZ McKinley Boral Material Rail and truck AZ, CA, Mexico Concrete productsPower Technologies
Arizona Public Cholla/AZ McKinley, Phoenix 40% rail, AZ, CA, NM Concrete productsService Lee Ranch Cement 60% truck
Arizona Public Four Corners/ Navajo Phoenix 60% by truck NM, CO, Concrete products,Service NM Cement to rail head CA, AZ backfill
Salt River Coronado McKinley Mineral Rail and truck AZ, CO, N/AProject Resources TX, NM, CA
Technology
Tri-State Escalante/NM Lee Ranch Minerals Rail and truck AZ, NV, N/AGeneration Solutions West TX, NM
Tucson Electric Springerville/AZ Lee Ranch None—fly ash is Power contaminated by
dry scrubbers
Public Service San Juan/NM San Juan, Phoenix 100% truck NM, AZ, UT BackfillCompany of La Plata CementNew Mexico
FIGURE 2 Coal-fired power plants and fly-ash marketers (see Fig.1 on page 66 for location of mines and plants).

C H A P T E R T H R E E
DECISION-MAKERS FIELD GUIDE 2002
and specialized rail cars are needed, very few mar-keters send all their fly ash by rail. A unique situationexists at the Four Corners plant (New Mexico) where60% of their marketed fly ash is shipped by truck to arailhead near Gallup, then shipped to California andArizona markets. The Arizona Cholla plant ships 40%of its marketed fly ash by rail to California. Havingstorage facilities at different locations in the marketarea is also important, particularly with the seasonalfluctuation in the production of fly ash. Most of themarketers of New Mexico fly ash have this capability,which allows them to have product available yearround.
ENVIRONMENTAL CONCERNS
The Environmental Protection Agency (EPA) did an indepth study in 1980 of the use and disposal of fly ashon human health and environment under theResource Conservation and Recovery Act. Their reportto the United States Congress recommended classifica-tion of pure stream fly ash, bottom ash, boiler slagand FGD material as nonhazardous. Individual stateswere left with the responsibility to develop solid-wasteprograms to deal with coal byproducts (EPA 1988).Early in 2000, the EPA reconsidered this decision. OnApril 25, 2000, the EPA decided to not reclassify coalcombustion wastes as hazardous substances. EPA doesplan to develop national standards to address wastesfrom coal burning plants that are presently either landdisposed or used as fill in mining. Had fly ash beenregulated as a hazardous material, the economicimpact on coal-fired power plants and ash marketerswould have been significant. The cost would haveincluded (a) the loss of revenue from sale of a prod-uct, (b) the cost of disposal for this combustionbyproduct, and, perhaps most important, (c) the costof handling what might then have been classified as ahazardous material.
CONCLUSIONS
The use of fly ash as a commercial product has signifi-cantly reduced costs associated with what has other-wise traditionally been a combustion byproductrequiring disposal. The birth of the fly-ash industry inthe U.S. in the 1960s not only solved this problem,but provided an additional source of income to pro-ducers of fly ash. The importance of fly ash as a com-mercial product, with its many beneficial applications,has allowed the development of a viable industry. Thefuture of that industry will depend upon whether theEnvironmental Protection Agency continues to view
fly ash as a nonhazardous byproduct. Whatever thefuture of the fly-ash industry, it will continue to beclosely tied to the coal-generated power industry inNew Mexico and adjacent states.
SELECTED REFERENCES
Austin, G. S., and Barker, J. M., 1998, Cement and concrete—pro-duction and use in New Mexico: New Mexico Geology, v. 20,no. 2, pp. 33–43.
Environmental Protection Agency, 1988, Report to Congress:Wastes from the combustion of coal by electric utility powerplants, Final Report EPA/530/SW-88/002A: ICF, Inc., Fairfax,VA, 374 pp.
Kalyoncu, R.S., 2001: Coal combustion products: U.S. GeologicalSurvey commodity statistics and information, World Wide Webaddress:
http://minerals.usgs.gov/minerals/pubs/commodity/coal New Mexico Energy, Minerals, and Natural Resources Dept., 1999:
New Mexico Natural Resources 2000—data and statistics for1999; p. 14.
88

SAN JUAN BASIN
C O A L E N E R G Y & E L E C T R I C G E N E R A T I O N
Fossil-energy resources currently provide 85% of allenergy consumed worldwide and are readily avail-
able. Resource exhaustion could lead to a decline in theuse of oil and gas within the next few decades. On theother hand, coal resources in the U.S. and elsewherecould satisfy world energy demand for several centuries.Based on studies by the U.S. Geological Survey, coalresources in the U.S. exceed 10,000 Gigatons (Gt). Thisnumber should be compared to an annual carbon con-sumption of about 6.5 Gt of carbon in all fossil fuelscombined. As technologies improve, interchangeabilitybetween the various fuels becomes easier. In short, weare not likely to run out of fossil-fuel resources in theforeseeable future. As we discuss below, it is the envi-ronmental concerns associated with their use, particu-larly concerns about air quality, that need to beresolved.
In the 1970s environmental concerns focused on cer-tain air pollutants, particularly heavy metals like lead andmercury, and compounds of sulfur and nitrogen.Regulations were adopted to reduce those emissions.Over the last decade, however, carbon dioxide (CO2)—the primary end product of fossil-fuel combustion—hasitself become a concern, mainly because of its probablerole in human-induced climate change. Unlike other pol-lutants, CO2 is harmful not as a single emission, butthrough its long-term accumulation in the atmosphere.Coal is the most carbon-intensive fossil fuel, producinglarge amounts of CO2 as a byproduct of combustion. Asgovernments impose carbon production constraints, bothenergy producers and consumers will be affected. To bemost effective, carbon constraints should aim for zeroemissions. A power plant that converts its waste byprod-ucts to reusable or disposable solids and eliminates air-borne emissions altogether would be ideal.
Current annual atmospheric CO2 emissions are increas-ing at a rate of 1.7 ppm/year (ppm = parts per million),which exceeds 1% of the total pre-industrial carbon con-tent of the atmosphere (280–370 ppm). Given a mini-mum worldwide population growth of 2% per annum,CO2 levels in the atmosphere will exceed 500 ppm before2050, or within the expected lifetime of a coal-firedpower plant built today.
Halting the increase of atmospheric CO2 accumula-tion requires drastic reductions of emissions. Model cal-
culations suggest that in order to fix the total carbondioxide level in the atmosphere, yearly emissions willhave to fall by a factor of about 3 below those of 1990in a matter of a decade or two. If, in the coming centu-ry, we lower worldwide CO2 emissions to 30% of whatthey are today, and given a world population of ten bil-lion sharing equally, the allowable per capita emissionswould only be 3% of today’s per capita emission in theUnited States.
Energy demand will rise rapidly over the course ofthe next century. In the twentieth century, energy con-sumption grew by a factor of twelve. In the comingcentury the remainder of the world may repeat whatEurope, Japan, and North America accomplished in thelast century in terms of industrialization and energyconsumption, but with a population that is billionslarger. The importance of energy to the world’s econom-ic development should not be underestimated. Figure 1shows the primary energy consumption per dollar ofgross domestic product (GDP) in various countries. Inspite of energy efficiency improvements, which alreadyhave been dramatic, the amount of energy required fora dollar of GDP is remarkably large. Without access tocheap and abundant energy, further industrial develop-ment of the world is limited.
89
Can We Achieve Zero Emission Coal Power?
C. L. Berger and H. J. Ziock, Los Alamos National Laboratory LAUR-01-3941K. S. Lackner, Department of Earth and Environmental Engineering, Columbia UniversityD. P. Harrison, Department of Chemical Engineering, Louisiana State University
FIGURE 1 Relationship between energy and GDP

C H A P T E R T H R E E
DECISION-MAKERS FIELD GUIDE 2002
Thus, fossil energy must be a major contributor tosatisfy the ever-growing energy demand. However, forfossil energy to play such a role in the next century, car-bon dioxide emissions, together with all other airborneemissions, will have to be drastically reduced or elimi-nated. This affects not only coal-based power plants,but also any use of fossil energy. But because powerplants are such large and concentrated sources of car-bon dioxide, they are also likely initial targets for man-dated reductions. In the long run, mandated emissionsreductions must apply to natural-gas-based power aswell as coal-based power.
Los Alamos National Laboratory (LANL), in collabo-ration with university, government, and industrial part-ners, is developing an integrated zero emission processfor power plants that is based on a combination ofimprovements in the power generation process and amethod of sequestering CO2. Sequestration refers tomethods used to temporarily or permanently isolate theCO2 that is a natural byproduct of combustion from theatmosphere.
THE POWER GENERATION PROCESS
The goal of current research is to develop a process thatwill produce hydrogen from coal, hydrogen that willthen be used in fuel cells to generate electricity. Themulti-stage process gasifies coal, using hydrogen to pro-duce a methane-rich intermediate state (methane is themost common component of natural gas). The methaneis subsequently reformed using water and a calciumoxide (CaO)-based sorbent. A sorbent is a compoundthat removes, in this case, CO2 from the process. Thesorbent supplies the energy needed to drive the reform-ing reaction and simultaneously removes the generatedCO2 by producing calcium carbonate (CaCO3). Theresulting hydrogen product stream is split, approxi-mately half going to gasify the next unit of coal, and the
other half being used to generate electricity from solidoxide fuel cells (SOFC). The inevitable high-tempera-ture waste heat produced by the SOFC would in turnbe used to convert the CaCO3 into CaO (which can bereused in the process) and pure CO2 (which must besequestered). The SOFC yields an exhaust stream that islargely recycled back to the reforming stage to generatemore hydrogen with a slipstream (a small fraction ofexhaust flow from the fuel cell) being extracted andcondensed. The slipstream carries with it the other ini-tial contaminants present in the starting coal. Overallthe process is effectively a closed loop, with zerogaseous emissions to the atmosphere. The process alsoachieves very high conversion efficiency (about 70%)from coal energy to electrical energy. In addition to ourwork, several other groups are also employing variantsof this process to produce hydrogen from a number ofcarbon-based fuels.
THE SEQUESTRATION PROCESS
Sequestration methods that have been proposed and arebeing studied (Fig. 2) are both temporary and perma-nent storage in underground reservoirs (such as old oilfields), deep ocean disposal where CO2 forms a solidhydrate in reaction with cold water, or mineral seques-tration where the CO2 is “locked away” into a new min-eral by chemical reaction. We favor the latter, throughformation of mineral carbonates from readily availablemagnesium or calcium silicate minerals. This naturalprocess, which happens spontaneously on geologicaltime scales, is virtually unlimited in its uptake capacity.The difficulty lies in the design of an efficient industrial-scale chemical process. An accelerated mineral carbona-tion process is now being developed by a collaborationthat includes Los Alamos National Laboratory, theAlbany Research Center, Arizona State University, andthe National Energy Technology Laboratory. Carbondioxide reacts with magnesium-rich silicate minerals,serpentine or olivine, forming magnesium carbonate,silica, and possibly water. The process would perma-nently sequester CO2, the end products are all naturallyoccurring, and they can be safely disposed of in landfills.
Available mineral deposits required for this processfar exceed humankind’s capacity for generating carbondioxide. The necessary magnesium silicates exist invast, rich deposits worldwide. A single deposit in Omancontains over 30,000 cubic kilometers of magnesiumsilicates, which alone could handle all of the world’scoal. The mining operations to obtain magnesium sili-cates would be large, but in terms of volumes minedand areas disturbed they are substantially smaller thanthe associated above-ground coal mines. The mining
90
FIGURE 2 Carbon reservoirs.

SAN JUAN BASIN
C O A L E N E R G Y & E L E C T R I C G E N E R A T I O N
and running appliances as theydirectly use taking showers andwatering lawns. According to theBush administration’s 2001 NationalEnergy Policy, our growing popula-tion and economy will require393,000 megawatts of new generat-ing capacity (1,300 to 1,900 newpower plants—more than one builteach week) by the year 2020, put-ting further strain on the nation’swater resources. In summary, theintimate link between clean, afford-able energy and clean, affordablewater is crystal clear. There cannotbe one without the other.
nuclear energy requires 190,000million gallons of water per day,accounting for 39% of all freshwaterwithdrawals in the nation, with71% of that going to fossil-fuel elec-tricity generation alone. Coal, themost abundant fossil fuel, currentlyaccounts for 52% of U.S. electricitygeneration; each kilowatt hour gen-erated from coal requires 3.3 gallonsof water. Coal and nuclear energyaccount for 72% of U.S. electricitygeneration and together account formore than a third of all freshwaterwithdrawals. That means U.S. citi-zens may indirectly use nearly asmuch water turning on the lights
Energy production requires a reli-able, abundant, and predictable
source of water, a resource that isalready in short supply throughoutmuch of the U.S. and the world.The energy industry is the secondlargest user of water in the UnitedStates. According to the U.S.Geological Survey, electricity pro-duction from fossil fuels and
91
The Energy–WaterConnection
Wendy E. SollLos Alamos National Laboratories,LALP-02-7
disposing of the carbon dioxide generated. What makesthe process attractive is the elimination of all harmfulairborne emissions. The process has no smokestack,because there is no combustion of coal. The ash fromthe coal is fully contained, making compliance withever-tighter restrictions on particle emissions straight-forward. A small amount of calcium oxide or calciumcarbonate is used to capture the sulfur in the coal. Thesulfur is pulled out of the reaction vessels in a solidform, also eliminating hydrogen sulfide or SOX emis-sions. Additionally, the reducing conditions inside thehydrogen production vessel do not lead to the forma-tion of NOX, and because there is no combustioninvolved, NOX emissions are eliminated. Finally theCO2 generated in the hydrogen production is initiallyextracted as a solid before being converted to a concen-trated gas stream. As this is an integral part of thehydrogen production process, no additional expensesare incurred in producing a concentrated stream of CO2
exhaust. The exhaust will be permanently disposed ofby reacting it with abundant, naturally occurring miner-als to form harmless, stable mineral solids that will notleave a greenhouse gas legacy for future generations.
In conclusion, coal has an important and even domi-nant position in the energy future for the world. It isimportant that the value of this resource be recognized,and that the resource be utilized. We are confident thattechnological solutions exist that will allow the realiza-tion of “green” coal, which can be used to ensure aclean world and a long term, prosperous, healthy, andsecure global economy.
FIGURE 3 Outline of the zero emission coal process.
operation suitable for a large electric power plant issmaller than that for a large open-pit copper mine. Theend products from the carbonation process would beused to refill the mine. It is estimated that the mining,crushing, milling, and reclamation costs for thissequestration process are low: around $7 to $20 perton of CO2. With a power plant operating at 70% effi-ciency, this would be about 1¢ US/kWh of electricity.
COMBINED PROCESSES ELIMINATE ATMOS-PHERIC EMISSIONS
The zero emission coal process is illustrated in Figure3. It combines a high-efficiency, coal-based electricpower plant with a process for safely and permanently

C H A P T E R T H R E E
DECISION-MAKERS FIELD GUIDE 2002
92
The process of deregulating industries has beenwith us for decades. Deregulation of the airline,
railroad, trucking, telecommunication, and even thenatural gas industries, all preceded the move to makeelectric utilities competitive. To a large degree, at leastin the electric power business, the impetus came fromthe large industrial customers who were being forcedby market competition to reduce their costs, and whoreasoned that there would be significant savings in thebulk quantities of energy they consumed if only theycould choose their energy providers. The energy crisesof the 1970s resulted in government-encourageddevelopment of independent generators, and of co-generators that produced electric power as a byprod-uct of some other industrial process. This energy fre-quently was priced low enough to be attractive to theindustrial customer, if only there had been a way forthat customer to get around (by deregulation) thelocally regulated utility with its franchise protectionand higher-cost electricity.
A significant move in this direction was the nationalEnergy Policy Act of 1992. This law permitted federalenergy regulators to require utilities, under certainconditions, to open their transmission lines to otherswho wished to ship (or “wheel” in industry terms) thepower across the utility’s lines to get it to the cus-tomer. This law was very specific, however. It limitedsuch transactions to wholesale power sales only. Thiswas essentially a market in which utilities sold powerto each other. The decision to implement retail com-petition that would allow the end-user or retail cus-tomer to choose their power supplier was left to thestates.
NATIONAL TREND
Many states took up that cause, and by the year 2000roughly half of the states had either begun some formof retail electric competition or had set target dates tobegin doing so. Congress, too, has debated this issuefor years because of the interstate nature inherent inmodern electric generation and transmission technolo-gy. Many proposals have been put forth in Congress,both as comprehensive industry restructuring legisla-tion, and as proposals to deal with individual aspects
of the deregulation process. None had gained wideenough support by late 2001 to become law. Energypolicy legislation has now become a high priority,however, as there is growing recognition of theurgency to act, especially following the September 11terrorist attack. There is increased awareness of therole that a strong power industry plays in our econo-my and of its importance to national security.
Among the various federal issues are questions con-cerning transmission planning, coordination, limits onthe market power of utilities that own both generationand transmission infrastructure, defining the bound-ary between state and federal jurisdictions, and themodification or repeal of federal laws that currentlydiscourage competition in the electric power business.
DEREGULATION VERSUS RESTRUCTURING
So what exactly do we mean by deregulation? Perhapsderegulation is the wrong word. Most people whohave studied the matter agree that it is more accurateto speak of “restructuring” the electric industry. In anyevent, we are not likely to see less regulation, onlychanges in how the industry is regulated.
To better understand the typical restructure propos-al, let’s look at how the traditionally regulated electricutility functions. Since the early twentieth century,utilities have been vertically integrated: a single com-pany owns its own generators to produce the power(or purchases the power on the wholesale market toresell), and it owns the transmission lines to move theelectricity over long distances. That same companyowns the distribution systems that convert the high-voltage electricity coming over the transmission linesto lower voltages and distributes it to businesses andhomes.
Because of the enormous expense of building andoperating this system, it has been economically moreefficient to build only one such system for a singleservice territory. For this reason, electric utilities his-torically have been considered natural monopolies andgiven franchised service territories. In exchange forthis exclusive right (and obligation) to serve, utilitiesaccepted government regulation of their rates andterms of service.
Current Status of Electric RetailCompetition
Ernie C’de Baca, Public Service Company of New Mexico

SAN JUAN BASIN
C O A L E N E R G Y & E L E C T R I C G E N E R A T I O N
Most restructuring proposals would separate thegeneration component from the other two servicesprovided by the utility. Utility customers would beallowed to choose the company from which they pur-chase the electricity. This company might be the localutility, it might be a different utility, or it might be apower generator or marketer from in or out of state.The price of the power would be unregulated, set bysupply and demand in the market.
The local utility would continue to own the trans-mission and distribution systems, but other powercompanies would be able to send their power acrossthese lines. The transmission and distribution systemswould remain regulated by the government, whichwould set rates for their use. Regulators also wouldhave the responsibility to set rules to encourage com-petition and ensure fairness for all participants.Consolidating transmission systems into regionaltransmission organizations that plan, build, and oper-ate transmission systems exclusively, independentfrom power suppliers, is a concept being pushed atthe federal level.
Restructuring proponents argue that retail competi-tion will bring customers lower costs and morediverse services. It remains an open question whetherretail competition will lower costs. There has beenlimited success, at least initially, in some of the firststates to deregulate their electric utilities, but one suchstate – California – has experienced disastrously hugerate increases following its bungled restructuringefforts.
Restructuring the electric utility industry in NewMexico began in earnest with the introduction of sev-eral proposals in the 1993 New Mexico Legislatureand in following years. Those proposals never gotbeyond committee debate, but lawmakers did estab-lish a bipartisan study committee every year from1993 through 1998, which, under the chairmanshipof Senator Michael Sanchez (D-Belen) devoted sixyears to a careful examination of restructuringapproaches taken in other states. That effort culminat-ed in New Mexico’s Electric Utility IndustryRestructuring Act, which became law in 1999.
NEW MEXICO’S ELECTRIC UTILITYRESTRUCTURING LAW
The law, which moved through the legislature asSenate Bill 428, permitted retail electric customers tochoose their power supplier, beginning with residen-tial customers, schools, and small businesses, as ofJanuary 1, 2001. It permitted choice for all other cus-
tomers as of January 1, 2002. The New Mexico PublicRegulation Commission (PRC) was given the authority(which it subsequently exercised) to delay those datesso that choice would become an option for the firstgroup on January 1, 2002, and for all others on July1, 2002. The law required all investor-owned electricutilities to participate and to file plans for the transi-tion to open access for the PRC’s approval. The state’s16 distribution cooperatives are required either toserve as an aggregator for their members, or to choosefrom three other business models for providing retailservice, including open access. Municipal electric utili-ties may choose to provide open access, but they arenot required to do so.
The law eliminates regulation of the price of electricityas a commodity, but state regulation is retained overtransmission and distribution. Utilities may (but are notrequired to) sell off their generation assets. Utilities maykeep these unregulated assets, however, only if they areseparated from their regulated distribution utility, toprevent cross subsidies and to discourage favoring theirown generation over competing power suppliers.Utilities may recover, through rates, at least half of their“stranded” investment in generation before deregulation,and they may recover some or all of the remainingstranded costs, as well as transition costs, with PRCapproval.
Other provisions of the law include a “standard offer”service from the native utility for customers who do notchoose their power provider, or who wish to return toservice from their home utility. The law also fundsrenewable energy projects, protects customers against“slamming” and other market abuses, and directs thePRC, among other things, to educate consumers aboutcustomer choice. All billing and local service issues willcontinue to be handled through the local utility,although service issues surrounding the energy com-modity itself will be the responsibility of the companyproviding the energy.
CALIFORNIA’S EXPERIENCE
By early 2001 California’s dismal experience with elec-tric deregulation forced New Mexico and many otherstates to reconsider their own plans. At least one statepartially repealed its deregulation law. Some states thathad authorized competitive retail electric sales, includ-ing New Mexico, opted for delay. Three states continueon course with their deregulation plans.
Many in New Mexico, including some of the cus-tomers who had advocated most strongly for competi-tion only a year or two before, were fearful that we
93

C H A P T E R T H R E E
DECISION-MAKERS FIELD GUIDE 2002
would experience California’s fate, and they now wantedmore time to get ready. Others argued that provisions inNew Mexico’s law would prevent the lack of generation,which was California’s basic problem and which causeddramatic spikes in that state’s wholesale energy costs.
Senator Sanchez, sponsor of New Mexico’s 1999 law,held public meetings. He concluded that there wasstrong support for the proposition that, although dereg-ulation might be a good idea and New Mexico’s lawavoided some of California’s problems, the market hadchanged or not responded as expected; that the marketwas too unpredictable; and that electric supply in theWest was too limited. Therefore, New Mexico shoulddelay its deregulation plans until the market was morefavorable.
Sanchez sponsored Senate Bill 266, which passed inthe 2001 New Mexico legislative session and wassigned by Governor Gary Johnson. It delays the start ofelectric retail competition in this state for five years, oruntil January 2007. However, legislators were worriedthat New Mexico, although it has adequate generationfor the near-term, might end up like California if thereisn’t enough generation for a competitive market inNew Mexico by 2007. So the law also permits electricutilities to proceed with developing their holding com-pany structures, and to invest in unregulated generationplants. The PRC is currently considering how to admin-ister this law.
UNCERTAIN FUTURE
However uncertain the future of electric deregulationmay be, it is highly likely that we will see some changein the way the electric industry serves customers andhow it is regulated. Regulated or unregulated, thepower industry, especially generation, is largely depend-ent on private investors for the enormous capital need-ed to build infrastructure. There must be certainty inthe rules to attract that investment, and there will be noinvestment if we pursue the notion that we can go tomarkets when market prices are less than cost, and thatwe can go to cost – meaning regulation – when cost isless than market.
For the customer, the promise of restructuring thisbusiness is not, and never has been, the certainty oflower electric bills, however politically appealing thatmay be in selling this proposition to the public. Rather,the goal is to establish competitive markets that useresources more efficiently and send proper price signalsto customers regarding their usage. This in turn pro-vides incentives to the marketplace to innovate and pro-vide more options from which customers can choose.
94