coal concepts proficiency testing general analysis …
TRANSCRIPT

Page 1 of 22
`
COAL CONCEPTS PROFICIENCY TESTING
GENERAL ANALYSIS SAMPLE
REPORT EIGHTY-SEVEN
Revision 00
Final report
DATE ISSUED: 31 JANUARY 2019
PARTICIPANT
SCHEME COORDINATOR: K MUNSAMY
SIGNATURE: _____________________
CHECKED BY: R BABOOLAL (SCHEME MANAGER)
Disclaimer: Opinions and interpretations expressed herein are outside the scope of SANAS accreditation *Moisture in the analysis sample is not included in the SANAS schedule of accreditation as robust statistics cannot be applied.
Chlorine, Fluorine, Quick ash, ASTM ash and ASTM Volatiles is not included in the scope of accreditation.
THINKING QUALITY, QUALITY THINKING
REGISTRATION NUMBER: 2006/149731/23 (RMB INDUSTRIAL STATIONERS cc t/a)
81 CERAMIC CURVE, ALTON, RICHARDS BAY 3900 l TEL: +27(0)35 751 2446 l CEL: +27(0)83 6500151 l FAX: 0862605793
E-MAIL: [email protected]
LABORATORY CODE:

Page 2 of 22
EXECUTIVE SUMMARY
1. One hundred and thirteen samples were sent to participants with 109 timeous result submissions
2. The total number of outliers found were as follows (dry base):
ISO Volatile Matter x 6
Quick Ash x 1
Calorific Value x 2
Sulphur x 2
Carbon x 1
Nitrogen x 1
ASTM Volatile Matter x 1
3. Nitrogen, Chlorine, Fluorine, ASTM Ash & ASTM Volatile Matter participants were insufficient to warrant robust statistical calculations. The average result was used as the assigned value.
4. Trending for your laboratory is as follows:
Page 3 of 22
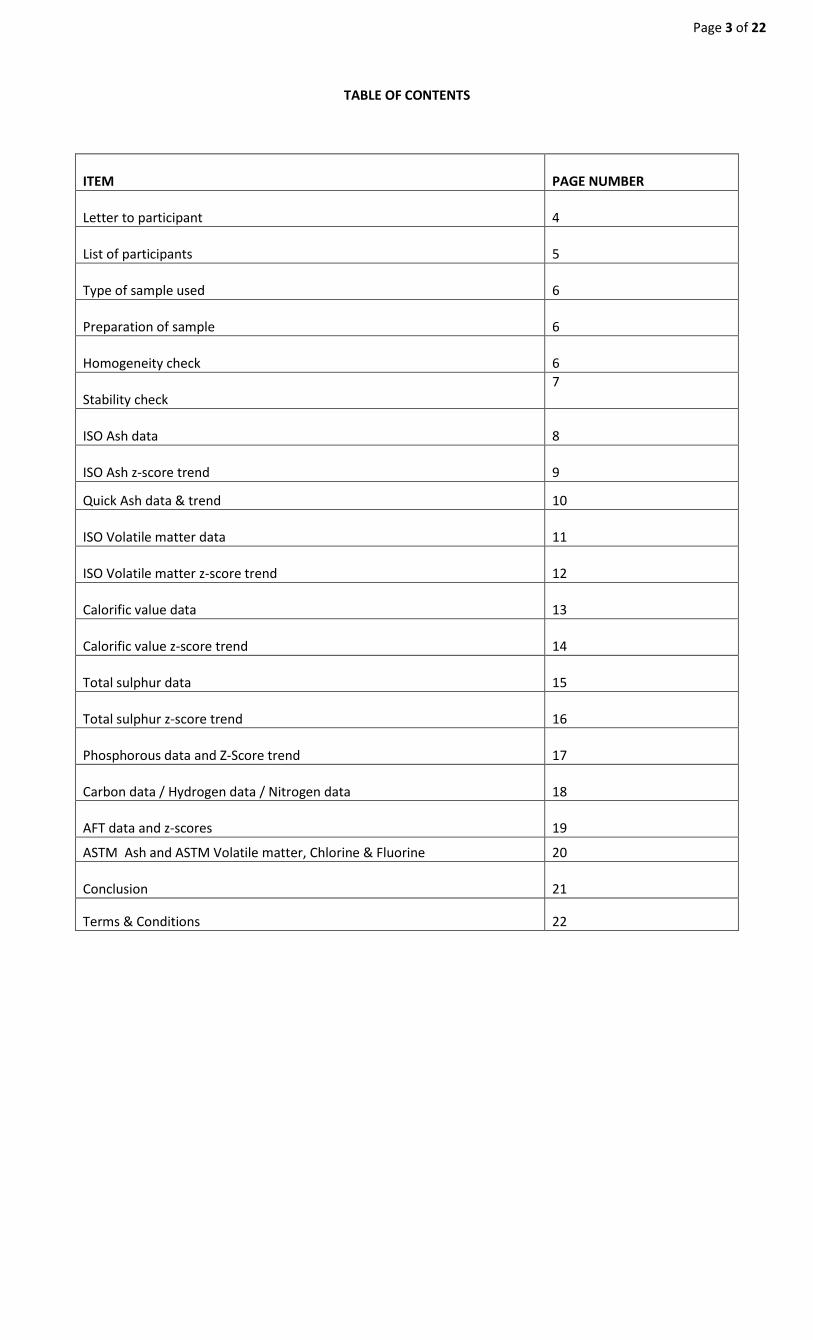
TABLE OF CONTENTS
ITEM
PAGE NUMBER
Letter to participant
4
List of participants
5
Type of sample used
6
Preparation of sample
6
Homogeneity check
6
Stability check
7
ISO Ash data
8
ISO Ash z-score trend
9
Quick Ash data & trend 10
ISO Volatile matter data
11
ISO Volatile matter z-score trend
12
Calorific value data
13
Calorific value z-score trend
14
Total sulphur data
15
Total sulphur z-score trend
16
Phosphorous data and Z-Score trend
17
Carbon data / Hydrogen data / Nitrogen data
18
AFT data and z-scores
19
ASTM Ash and ASTM Volatile matter, Chlorine & Fluorine 20
Conclusion
21
Terms & Conditions 22

Page 4 of 22
Dear Participant
RE: PROFICIENCY TESTING RESULTS FOR THE MONTH OF JANUARY 2019
Thank you for your participation in the Coal Concepts proficiency testing scheme.
Your laboratory code is
All results are totally confidential. Any results in Bold, Italics and Underlined are outliers. Where applicable, the most
extreme outliers have been eliminated from calculations using the Grubbs estimate for outliers. Robust statistics has been
applied where possible. Analysis results have been reported on air dry and dry base. The dry base results have been used
to calculate the z-scores.
Please take note of the following:
1. Z-scores between -1 and +1 is deemed acceptable
2. Z-scores between -2 and -3 should serve as a warning that the analysis result could get worse
3. Z-scores between +2 and +3 should also serve as a warning that analysis results could get worse.
4. Z- scores lower than -3 and exceeding +3 should warrant an investigation
5. Compare your result to the robust average which will be the assigned value. The measurement of uncertainty (UoM) of
the results is also stated.
6. All calculations can be made available upon request
The Coal Concepts scheme adheres to the requirements of ISO/IEC 17043:2010 – Conformity assessment – General
requirements for proficiency testing.
Statistical analysis has been carried out using ISO/IEC 13528:2015-Statistical methods for use in proficiency testing by
interlaboratory comparisons
Please find results attached together with Z-score trends.
Best Regards
R Baboolal
Page 5 of 22
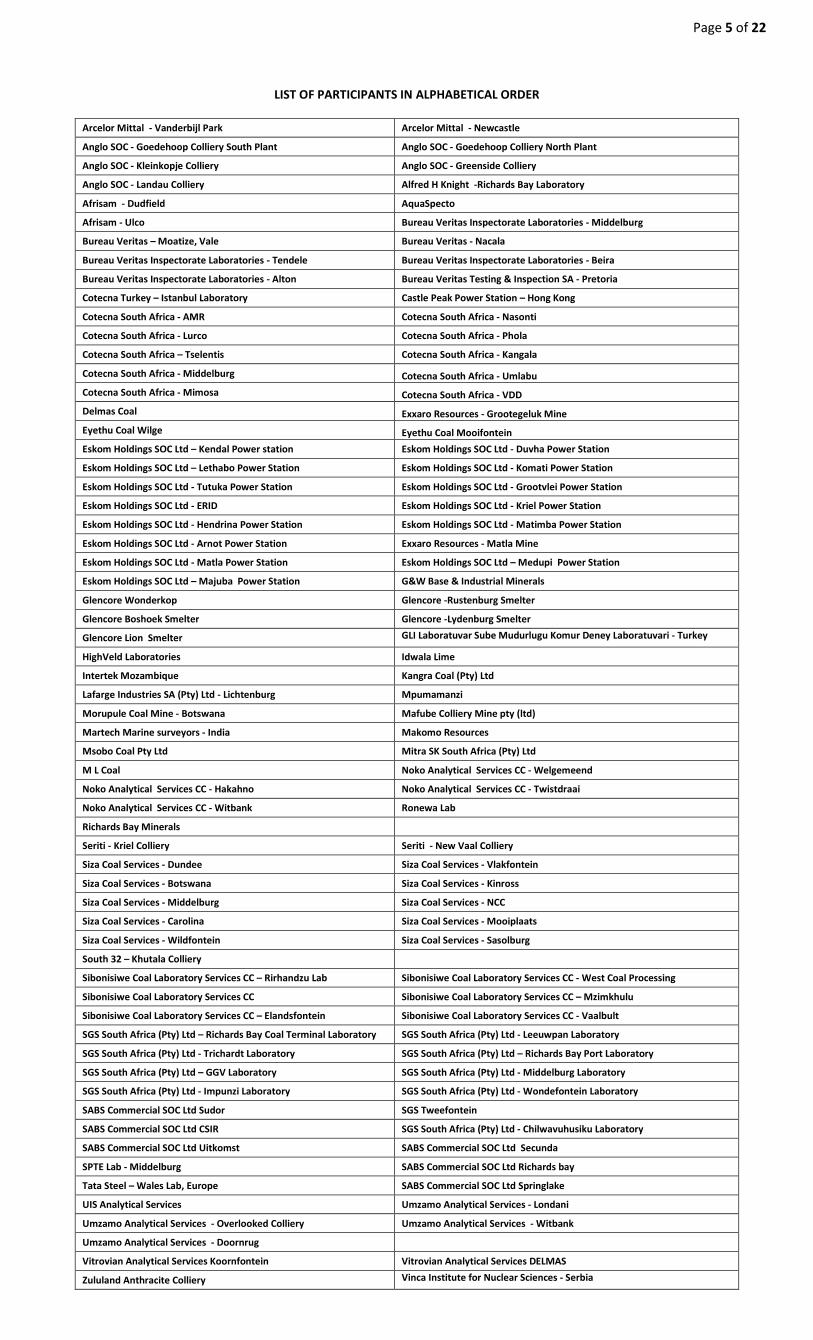
LIST OF PARTICIPANTS IN ALPHABETICAL ORDER
Arcelor Mittal - Vanderbijl Park Arcelor Mittal - Newcastle
Anglo SOC - Goedehoop Colliery South Plant Anglo SOC - Goedehoop Colliery North Plant
Anglo SOC - Kleinkopje Colliery Anglo SOC - Greenside Colliery
Anglo SOC - Landau Colliery Alfred H Knight -Richards Bay Laboratory
Afrisam - Dudfield AquaSpecto
Afrisam - Ulco Bureau Veritas Inspectorate Laboratories - Middelburg
Bureau Veritas – Moatize, Vale Bureau Veritas - Nacala
Bureau Veritas Inspectorate Laboratories - Tendele Bureau Veritas Inspectorate Laboratories - Beira
Bureau Veritas Inspectorate Laboratories - Alton Bureau Veritas Testing & Inspection SA - Pretoria
Cotecna Turkey – Istanbul Laboratory Castle Peak Power Station – Hong Kong
Cotecna South Africa - AMR Cotecna South Africa - Nasonti
Cotecna South Africa - Lurco Cotecna South Africa - Phola
Cotecna South Africa – Tselentis Cotecna South Africa - Kangala
Cotecna South Africa - Middelburg Cotecna South Africa - Umlabu
Cotecna South Africa - Mimosa Cotecna South Africa - VDD
Delmas Coal Exxaro Resources - Grootegeluk Mine
Eyethu Coal Wilge Eyethu Coal Mooifontein
Eskom Holdings SOC Ltd – Kendal Power station Eskom Holdings SOC Ltd - Duvha Power Station
Eskom Holdings SOC Ltd – Lethabo Power Station Eskom Holdings SOC Ltd - Komati Power Station
Eskom Holdings SOC Ltd - Tutuka Power Station Eskom Holdings SOC Ltd - Grootvlei Power Station
Eskom Holdings SOC Ltd - ERID Eskom Holdings SOC Ltd - Kriel Power Station
Eskom Holdings SOC Ltd - Hendrina Power Station Eskom Holdings SOC Ltd - Matimba Power Station
Eskom Holdings SOC Ltd - Arnot Power Station Exxaro Resources - Matla Mine
Eskom Holdings SOC Ltd - Matla Power Station Eskom Holdings SOC Ltd – Medupi Power Station
Eskom Holdings SOC Ltd – Majuba Power Station G&W Base & Industrial Minerals
Glencore Wonderkop Glencore -Rustenburg Smelter
Glencore Boshoek Smelter Glencore -Lydenburg Smelter
Glencore Lion Smelter GLI Laboratuvar Sube Mudurlugu Komur Deney Laboratuvari - Turkey
HighVeld Laboratories Idwala Lime
Intertek Mozambique Kangra Coal (Pty) Ltd
Lafarge Industries SA (Pty) Ltd - Lichtenburg Mpumamanzi
Morupule Coal Mine - Botswana Mafube Colliery Mine pty (ltd)
Martech Marine surveyors - India Makomo Resources
Msobo Coal Pty Ltd Mitra SK South Africa (Pty) Ltd
M L Coal Noko Analytical Services CC - Welgemeend
Noko Analytical Services CC - Hakahno Noko Analytical Services CC - Twistdraai
Noko Analytical Services CC - Witbank Ronewa Lab
Richards Bay Minerals
Seriti - Kriel Colliery Seriti - New Vaal Colliery
Siza Coal Services - Dundee Siza Coal Services - Vlakfontein
Siza Coal Services - Botswana Siza Coal Services - Kinross
Siza Coal Services - Middelburg Siza Coal Services - NCC
Siza Coal Services - Carolina Siza Coal Services - Mooiplaats
Siza Coal Services - Wildfontein Siza Coal Services - Sasolburg
South 32 – Khutala Colliery
Sibonisiwe Coal Laboratory Services CC – Rirhandzu Lab Sibonisiwe Coal Laboratory Services CC - West Coal Processing
Sibonisiwe Coal Laboratory Services CC Sibonisiwe Coal Laboratory Services CC – Mzimkhulu
Sibonisiwe Coal Laboratory Services CC – Elandsfontein Sibonisiwe Coal Laboratory Services CC - Vaalbult
SGS South Africa (Pty) Ltd – Richards Bay Coal Terminal Laboratory SGS South Africa (Pty) Ltd - Leeuwpan Laboratory
SGS South Africa (Pty) Ltd - Trichardt Laboratory SGS South Africa (Pty) Ltd – Richards Bay Port Laboratory
SGS South Africa (Pty) Ltd – GGV Laboratory SGS South Africa (Pty) Ltd - Middelburg Laboratory
SGS South Africa (Pty) Ltd - Impunzi Laboratory SGS South Africa (Pty) Ltd - Wondefontein Laboratory
SABS Commercial SOC Ltd Sudor SGS Tweefontein
SABS Commercial SOC Ltd CSIR SGS South Africa (Pty) Ltd - Chilwavuhusiku Laboratory
SABS Commercial SOC Ltd Uitkomst SABS Commercial SOC Ltd Secunda
SPTE Lab - Middelburg SABS Commercial SOC Ltd Richards bay
Tata Steel – Wales Lab, Europe SABS Commercial SOC Ltd Springlake
UIS Analytical Services Umzamo Analytical Services - Londani
Umzamo Analytical Services - Overlooked Colliery Umzamo Analytical Services - Witbank
Umzamo Analytical Services - Doornrug
Vitrovian Analytical Services Koornfontein Vitrovian Analytical Services DELMAS
Zululand Anthracite Colliery Vinca Institute for Nuclear Sciences - Serbia

Page 6 of 22
1. TYPE OF SAMPLE USED
The coal used in this proficiency testing round was bituminous coal from Mpumalanga.
2. PREPARATION OF SAMPLE
Approximately 800kg’s of sample with an approximate topsize of 50mm was sourced. This was crushed to -4mm
using a jaw crusher. The -4mm material was reduced to -212um using a cross beat pulveriser. The 212 material
was sieved using a 212um screen. Any +212um material was pulverised and sieved until all material passed
through the 212 um sieve.
All the -212um material was then mixed in a mixing drum for 4 hours.
3. HOMOGENEITY CHECK
There were 113 participants in this round, 10 portions of sample were randomly extracted from the 800kg
sample. These were packaged in their final form i.e. in 200ml sample bottles. The bottles were labelled 1 to 10.
The results were as follows:
SAMPLE NO.
TEST PORTION 1
TEST PORTION 2
sample av (Xt) range (Wt) range sqd
1 29,7 29,72 29,71 0,02 0,0004
2 29,69 29,81 29,75 0,12 0,0144
3 29,82 29,66 29,74 0,16 0,0256
4 29,72 29,69 29,71 0,03 0,0009
5 29,73 29,76 29,75 0,03 0,0009
6 29,82 29,71 29,77 0,11 0,0121
7 29,72 29,67 29,70 0,05 0,0025
8 29,81 29,69 29,75 0,12 0,0144
9 29,68 29,62 29,65 0,06 0,0036
10 29,75 29,63 29,69 0,12 0,0144
GENERAL AVERAGE 29,72 STANDARD DEVIATION 0,036 WITHIN SAMPLE STANDARD DEVIATION 0,067
BETWEEN SAMPLE STANDARD DEVIATION 0,031
The between sample standard deviation must be ≤ 0.3 x ơ
(ơ = std deviation for the proficiency assessment)
Ơ = 2% of the mean was used, which is the repeatability for ISO ash (Ash % > 10%)
Hence 0.3 x 0.594 = 0.178
Since 0.031 < 0.178 the samples are homogenous

Page 7 of 22
4. STABILITY CHECK Samples were retained for sales as reference material. ten of them were randomly chosen for stability testing.
In order for the proficiency testing samples to be declared stable the general average from the homogeneity
check and that of the stability check the difference in the general average should not differ by more than 0.3 X
precision
This test has been carried out about a month after the samples were received by the participating laboratories
SAMPLE NO.
TEST PORTION 1
TEST PORTION 2
sample av (Xt) range (Wt) range sqd
1 29,82 29,98 29,90 0,16 0,0256
2 29,96 29,83 29,90 0,13 0,0169
3 29,87 29,88 29,88 0,01 0,0001
4 29,89 29,93 29,91 0,04 0,0016
5 29,94 29,87 29,91 0,07 0,0049
6 29,83 29,86 29,85 0,03 0,0009
7 29,95 29,78 29,87 0,17 0,0289
8 29,85 29,98 29,92 0,13 0,0169
9 29,84 29,87 29,86 0,03 0,0009
10 29,93 29,81 29,87 0,12 0,0144
GENERAL AVERAGE 29,88 STANDARD DEVIATION 0,025 WITHIN SAMPLE STANDARD DEVIATION 0,075 BETWEEN SAMPLE STANDARD DEVIATION 0,047
(Ơ = 0.538 was used)
For this report 0.3 x 0.598 = 0.179
Absolute value of (29.72 – 29.88) = 0.16
Since 0.16< 0.179 the proficiency testing samples were stable

Page 8 of 22
COAL CONCEPTS - PROFICIENCY TESTING -JANUARY 2019
ANALYTICAL PARAMETER : ISO ASH (%)
LAB ID MOISTURE IN ANALYSIS SAMPLE (%) AIR DRY (%) DRY BASE (%) Z-SCORE (DRY BASE)
1a 3,46 29,87 30,94 -0,12
6a 3,00 29,69 30,61 -1,11
7a 3,33 30,73 31,79 2,42
9a 3,35 30,25 31,30 0,95
10a 3,10 29,70 30,65 -0,99
12a 3,10 29,90 30,86 -0,37
15a 3,35 30,32 31,37 1,17
18a 3,07 29,82 30,76 -0,65
20a 3,18 30,33 31,33 1,04
21a 2,58 29,93 30,72 -0,77
23a 3,10 29,94 30,90 -0,25
24a 3,41 30,20 31,27 0,86
26a 2,77 30,59 31,46 1,44
27a 2,80 29,70 30,56 -1,27
28a 3,23 30,20 31,21 0,68
30a 2,91 30,47 31,38 1,21
32a 2,90 29,90 30,79 -0,56
33a 2,63 29,80 30,60 -1,12
35a 2,95 29,97 30,88 -0,30
36a 3,00 30,10 31,03 0,15
37a 2,75 30,30 31,16 0,53
38a 3,05 30,28 31,23 0,76
42a 3,19 30,18 31,17 0,58
49a 2,83 30,11 30,99 0,02
58a 2,50 29,80 30,56 -1,25
59a 2,67 30,04 30,86 -0,35
60a 2,96 29,73 30,64 -1,03
61a 3,20 29,70 30,68 -0,89
65a 3,10 29,90 30,86 -0,37
66a 2,96 29,67 30,58 -1,21
67a 3,30 29,70 30,71 -0,80
69a 2,80 30,53 31,41 1,29
71a 2,63 30,80 31,63 1,95
72a 2,82 30,45 31,33 1,06
76a 2,70 29,73 30,55 -1,27
79a 3,21 30,05 31,05 0,20
80a 3,50 30,51 31,62 1,91
82a 2,70 30,84 31,70 2,14
83a 2,96 30,14 31,06 0,24
88a 3,18 30,08 31,07 0,26
92a 3,40 29,80 30,85 -0,39
95a 3,40 29,40 30,43 -1,63
96a 3,17 29,96 30,94 -0,12
97a 3,12 29,72 30,68 -0,91
99a 3,10 29,80 30,75 -0,68
101a 2,77 30,03 30,89 -0,28
105a 2,90 29,90 30,79 -0,56
106a 2,82 30,11 30,98 0,0
108a 3,11 29,70 30,65 -0,98
109a 3,00 30,00 30,93 -0,16
110a 3,09 29,68 30,63 -1,06
112a 3,30 29,50 30,51 -1,42
117a 3,08 29,88 30,83 -0,45
124a 3,03 30,06 31,00 0,06
126a 2,75 30,50 31,36 1,1
131a 2,95 30,45 31,38 1,18
132a 2,83 30,14 31,02 0,11
135a 3,23 29,73 30,72 -0,77
136a 3,25 29,84 30,84 -0,41
137a 2,91 30,28 31,19 0,62
139a 3,26 30,20 31,22 0,71
143a 2,72 30,44 31,29 0,93
145a 3,31 29,80 30,82 -0,48
146a 3,20 30,40 31,40 1,27
151a 3,39 30,38 31,45 1,39
162a 3,47 30,28 31,37 1,16
165a 3,14 29,78 30,75 -0,70
166a 3,30 30,30 31,33 1,06
167a 3,33 29,67 30,69 -0,86
168a 2,18 29,88 30,55 -1,30
169a 3,50 29,70 30,78 -0,61
170a 2,70 29,80 30,63 -1,06
171a 2,86 29,45 30,32 -1,99
177a 2,07 30,53 31,18 0,58
179a 3,10 29,80 30,75 -0,68
178a 3,03 30,40 31,35 1,11
Number of results - 76 76 76 -
OUTLIERS - - 0 0 -
AVERAGE - 3,03 30,04 30,98 -
STD DEVIATION - - 0,33 0,33 -
MEDIAN 29,99 30,91
ROBUST AVERAGE - - 30,04 30,98 -
ROBUST STD DEVIATION - - 0,36 0,37 -
UoM 0,05 0,05

Page 9 of 22
-3,00
-2,00
-1,00
0,00
1,00
2,00
3,00
Z-SC
OR
E
LABORATORY ID
ISO ASH Z-SCORE TREND

Page 10 of 22 COAL CONCEPTS - PROFICIENCY TESTING -JANUARY 2019
ANALYTICAL PARAMETER : QUICK ASH (%)
LAB ID
MOISTURE IN ANALYSIS SAMPLE (%) AIR DRY (%) DRY BASE (%)
Z-SCORE (DRY BASE)
8a 2,80 30,00 30,86 -0,62
21a 2,58 29,88 30,67 -1,22
22a 3,12 29,95 30,91 -0,46
23a 3,10 30,11 31,07 0,03
24a 3,41 30,28 31,35 0,89
35a 2,95 29,80 30,71 -1,12
36a 3,00 29,90 30,82 -0,74
39a 2,83 30,45 31,34 0,86
41a 2,70 30,00 30,83 -0,72
49a 2,83 29,93 30,80 -0,82
50a 2,93 30,00 30,91 -0,49
63a 3,20 30,36 31,36 0,94
73a 2,53 31,43 32,25 3,69
74a 2,65 29,97 30,79 -0,87
77a 3,80 30,00 31,19 0,38
84a 3,05 30,37 31,33 0,82
92a 3,40 30,14 31,20 0,43
94a 3,48 30,70 31,81 2,32
101a 2,77 30,20 31,06 0,0
102a 2,70 30,00 30,83 -0,72
105a 2,90 30,10 31,00 -0,20
113a 3,59 29,98 31,10 0,10
122a 3,10 30,20 31,17 0,32
126a 2,75 30,20 31,05 -0,03
130a 3,60 30,30 31,43 1,15
131a 2,95 30,13 31,05 -0,05
132a 2,83 30,18 31,06 0,0
133a 2,93 30,23 31,14 0,25
136a 3,25 30,10 31,11 0,15
137a 2,91 30,19 31,09 0,10
138a 3,20 30,47 31,48 1,29
140a 3,68 30,18 31,33 0,84
143a 2,72 30,54 31,39 1,03
145a 3,31 29,90 30,92 -0,44
147a 2,68 29,40 30,21 -2,67
153a 3,05 29,50 30,43 -1,98
161a 2,90 30,20 31,10 0,12
162a 3,47 30,34 31,43 1,15
163a 3,70 29,90 31,05 -0,04
164a 3,05 30,20 31,15 0,27
165a 3,14 29,82 30,79 -0,86
168a 2,18 29,48 30,14 -2,89
169a 3,50 29,90 30,98 -0,25
176a 3,70 30,20 31,36 0,93
180a 1,97 30,33 30,94 -0,39
181a 3,40 30,50 31,57 1,59
182a 2,90 30,30 31,20 0,44
183a 3,60 30,10 31,22 0,50
184a 3,20 29,90 30,89 -0,55
185a 3,47 30,36 31,45 1,21
Number of results - 50 50 50 -
OUTLIERS - - 1 1 -
AVERAGE - 3,07 30,11 31,06 -
STD DEVIATION - - 0,26 0,32 -
MEDIAN 30,13 31,07
ROBUST AVERAGE - - 30,11 31,07 -
ROBUST STD DEVIATION - - 0,27 0,33 -
UoM 0,05 0,06
-3,00
-2,00
-1,00
0,00
1,00
2,00
3,00
Z-SC
OR
E
LABORATORY ID
QUICK ASH Z-SCORE TREND

Page 11 of 22
COAL CONCEPTS - PROFICIENCY TESTING -JANUARY 2019
ANALYTICAL PARAMETER : ISO VOLATILE MATTER (%)
LAB ID MOISTURE IN ANALYSIS SAMPLE (%) AIR DRY DRY BASE Z-SCORE (DRY BASE)
1a 3,46 20,69 21,43 -0,69
6a 3,00 21,36 22,02 0,65
7a 3,33 17,72 18,33 -7,76
8a 2,80 21,50 22,12 0,88
9a 3,35 21,03 21,75 0,05
10a 3,10 21,10 21,78 0,09
12a 3,10 20,90 21,57 -0,38
15a 3,35 20,86 21,58 -0,34
18a 3,07 21,15 21,82 0,20
20a 3,18 20,95 21,64 -0,22
21a 2,58 21,15 21,71 -0,05
22a 3,12 20,78 21,45 -0,65
23a 3,10 20,86 21,52 -0,48
24a 3,41 20,80 21,53 -0,46
26a 2,77 24,52 25,22 7,95
27a 2,80 21,80 22,43 1,58
28a 3,23 22,20 22,94 2,76
30a 2,91 20,66 21,28 -1,04
32a 2,90 21,20 21,83 0,23
33a 2,63 21,13 21,70 -0,08
35a 2,95 21,42 22,07 0,77
36a 3,00 21,10 21,75 0,04
37a 2,75 22,38 23,01 2,91
38a 3,05 22,08 22,77 2,36
39a 2,83 21,55 22,18 1,01
41a 2,70 21,50 22,10 0,83
42a 3,19 21,20 21,90 0,38
49a 2,83 21,09 21,70 -0,07
50a 2,93 21,44 22,09 0,81
58a 2,50 21,00 21,54 -0,45
59a 2,67 18,90 19,42 -5,29
60a 2,96 20,95 21,59 -0,33
61a 3,20 21,10 21,80 0,15
63a 3,20 21,16 21,86 0,28
65a 3,10 21,20 21,88 0,33
66a 2,96 20,65 21,28 -1,04
67a 3,30 20,80 21,51 -0,51
69a 2,80 20,95 21,55 -0,41
71a 2,63 16,95 17,41 -9,88
72a 2,82 20,87 21,48 -0,59
73a 2,53 0,15 0,15 -49,26
74a 2,65 20,60 21,16 -1,32
76a 2,70 20,20 20,76 -2,22
77a 3,80 20,60 21,41 -0,73
79a 3,21 20,81 21,50 -0,53
80a 3,50 20,47 21,21 -1,19
82a 2,70 20,74 21,32 -0,96
83a 2,96 21,16 21,81 0,16
88a 3,18 21,20 21,90 0,37
92a 3,40 21,01 21,75 0,04
94a 3,48 20,68 21,42 -0,72
95a 3,40 21,10 21,84 0,25
96a 3,17 21,04 21,73 0,0
97a 3,12 20,80 21,47 -0,60
99a 3,10 20,30 20,95 -1,79
101a 2,77 20,91 21,51 -0,52
102a 2,70 21,70 22,30 1,30
105a 2,90 21,80 22,45 1,64
106a 2,82 20,92 21,53 -0,47
108a 3,11 20,82 21,49 -0,56
109a 3,00 20,70 21,34 -0,90
110a 3,09 21,18 21,86 0,28
112a 3,30 21,20 21,92 0,43
113a 3,59 20,28 21,04 -1,60
117a 3,08 21,05 21,72 -0,03
122a 3,10 21,10 21,78 0,09
124a 3,03 20,61 21,25 -1,10
126a 2,75 22,35 22,98 2,85
130a 3,60 20,70 21,47 -0,60
131a 2,95 21,43 22,08 0,79
132a 2,83 21,06 21,67 -0,14
133a 2,93 21,43 22,07 0,77
135a 3,23 20,92 21,61 -0,28
136a 3,25 21,07 21,78 0,10
137a 2,91 21,03 21,66 -0,17
138a 3,20 21,49 22,20 1,06
139a 3,26 20,28 20,96 -1,76
140a 3,68 21,47 22,29 1,27
143a 2,72 21,33 21,93 0,44
145a 3,31 21,00 21,72 -0,03
146a 3,20 20,10 20,76 -2,21
147a 2,68 21,05 21,63 -0,24
151a 3,39 20,89 21,62 -0,25
161a 2,90 21,00 21,63 -0,24
162a 3,47 20,87 21,62 -0,26
165a 3,14 21,21 21,90 0,37
166a 3,30 20,85 21,56 -0,39
167a 3,33 20,87 21,59 -0,33
168a 2,18 22,10 22,59 1,96
169a 3,50 20,70 21,45 -0,65
170a 2,70 21,30 21,89 0,36
179a 3,10 24,30 25,08 7,63
180a 1,97 22,20 22,65 2,08
181a 3,40 20,50 21,22 -1,17
182a 2,90 21,00 21,63 -0,24
183a 3,60 20,90 21,68 -0,12
184a 3,20 20,70 21,38 -0,80
NUMBER OF RESULTS - 97 97 97 -
OUTLIERS - - 6 6 -
AVERAGE - 3,05 21,07 21,73 -
STD DEVIATION - 0,45 0,44 -
MEDIAN 21,03 21,68
ROBUST AVERAGE - - 21,07 21,73 -
ROBUST STD DEVIATION - - 0,49 0,47 -
UoM - - 0,06 0,06 -

Page 12 of 22
-3,00
-2,00
-1,00
0,00
1,00
2,00
3,00
76a
146a
99a
139a
113a
74a
80a
181a
124a
30a
66a
82a
109a
184a
77a
94a
1a 22a
169a
97a
130a
72a
108a
79a
101a
67a
23a
106a
24a
58a
69a
166a
12a
15a
167a
60a
135a
162a
151a
161a
182a
147a
20a
137a
132a
183a
33a
49a
21a
145a
117a
96a
92a
36a
9a 10a
122a
136a
61a
83a
18a
32a
95a
110a
63a
65a
170a
88a
165a
42a
112a
143a
6a 35a
133a
131a
50a
41a
8a 39a
138a
140a
102a
27a
105a
168a
180a
38a
28a
126a
37a
Z-SC
OR
E
LABORATORY ID
VOLATILE MATTER Z-SCORE TREND

Page 13 of 22
COAL CONCEPTS - PROFICIENCY TESTING -JANUARY 2019
ANALYTICAL PARAMETER : CALORIFIC VALUE (MJ/kg)
LAB ID MOISTURE IN ANALYSIS SAMPLE (%) AIR DRY (MJ/kg) DRY BASE (MJ/kg) Z-SCORE (DRY BASE)
1a 3,46 20,83 21,58 0,24
6a 3,00 20,94 21,59 0,29
8a 2,80 20,75 21,35 -0,69
9a 3,35 21,00 21,72 0,85
10a 3,10 20,91 21,58 0,25
12a 3,10 20,89 21,56 0,17
18a 3,07 20,86 21,52 0,0
20a 3,18 21,06 21,75 0,96
21a 2,58 20,83 21,38 -0,55
23a 3,10 20,88 21,54 0,11
24a 3,41 20,78 21,51 -0,01
27a 2,80 20,51 21,10 -1,70
28a 3,23 21,02 21,72 0,84
30a 2,91 20,81 21,43 -0,34
32a 2,90 20,75 21,37 -0,60
33a 2,63 20,96 21,53 0,04
35a 2,95 20,90 21,54 0,08
36a 3,00 20,61 21,25 -1,10
37a 2,75 20,75 21,34 -0,73
38a 3,05 21,04 21,70 0,75
39a 2,83 21,48 22,10 2,38
42a 3,19 20,70 21,38 -0,55
49a 2,83 20,90 21,51 -0,03
50a 2,93 20,48 21,10 -1,71
58a 2,50 20,90 21,44 -0,33
60a 2,96 20,87 21,51 -0,04
63a 3,20 20,52 21,20 -1,30
65a 3,10 21,12 21,80 1,14
66a 2,96 20,92 21,56 0,17
71a 2,63 20,54 21,09 -1,72
72a 2,82 20,44 21,03 -1,97
73a 2,53 21,42 21,98 1,87
74a 2,65 20,79 21,35 -0,66
76a 2,70 20,73 21,31 -0,86
77a 3,80 20,88 21,70 0,77
79a 3,21 20,24 20,91 -2,47
80a 3,50 21,07 21,83 1,30
82a 2,70 21,11 21,69 0,71
83a 2,96 20,88 21,52 0,00
84a 3,05 20,85 21,51 -0,04
88a 3,18 20,89 21,57 0,23
92a 3,40 19,93 20,63 -3,61
94a 3,48 20,95 21,71 0,77
95a 3,40 20,64 21,37 -0,61
96a 3,17 20,89 21,57 0,23
97a 3,12 21,04 21,72 0,82
99a 3,10 20,96 21,63 0,47
101a 2,77 20,70 21,29 -0,93
102a 2,70 21,63 22,23 2,91
105a 2,90 20,78 21,40 -0,47
106a 2,82 21,01 21,62 0,42
108a 3,11 20,91 21,58 0,26
109a 3,00 20,91 21,56 0,16
110a 3,09 21,01 21,68 0,67
112a 3,30 20,76 21,47 -0,20
117a 3,08 21,07 21,74 0,91
122a 3,10 21,08 21,75 0,97
124a 3,03 20,83 21,48 -0,15
126a 2,75 20,78 21,37 -0,61
130a 3,60 20,93 21,71 0,80
131a 2,95 20,83 21,46 -0,22
132a 2,83 20,73 21,33 -0,75
133a 2,93 21,39 22,03 2,11
135a 3,23 20,64 21,33 -0,77
136a 3,25 20,31 20,99 -2,14
137a 2,91 20,77 21,39 -0,51
140a 3,68 20,96 21,76 1,00
143a 2,72 20,67 21,25 -1,10
145a 3,31 20,95 21,67 0,61
147a 2,68 20,91 21,49 -0,13
153a 3,05 20,73 21,38 -0,55
161a 2,90 20,80 21,42 -0,39
162a 3,47 21,74 22,52 4,10
163a 3,70 20,69 21,48 -0,13
164a 3,05 20,95 21,61 0,38
165a 3,14 21,03 21,71 0,80
167a 3,33 20,93 21,65 0,55
168a 2,18 20,81 21,27 -0,99
169a 3,50 20,68 21,43 -0,35
170a 2,70 20,93 21,51 -0,02
171a 2,86 20,28 20,88 -2,61
172a 3,77 20,42 21,22 -1,21
176a 3,70 20,95 21,75 0,97
177a 2,07 20,95 21,39 -0,50
179a 3,10 21,23 21,91 1,60
180a 1,97 21,19 21,62 0,41
181a 3,40 20,94 21,68 0,65
182a 2,90 21,29 21,93 1,67
183a 3,60 20,77 21,55 0,12
184a 3,20 20,69 21,37 -0,58
186a 3,15 20,81 21,49 -0,12
NUMBER OF RESULTS - 91 91 91 -
OUTLIERS - - 2 2 -
AVERAGE - 3,04 20,86 21,52 -
STD DEVIATION - - 0,24 0,25 -
MEDIAN 20,88 21,52
ROBUST AVERAGE - - 20,86 21,52 -
ROBUST STD DEVIATION - - 0,25 0,26 -
UoM - - 0,03 0,03 -

Page 14 of 22
-3,00
-2,00
-1,00
0,00
1,00
2,00
3,00
171a
79a
136a
72a
71a
50a
27a
63a
172a
36a
143a
168a
101a
76a
135a
132a
37a
8a 74a
95a
126a
32a
184a
21a
42a
153a
137a
177a
105a
161a
169a
30a
58a
131a
112a
124a
163a
147a
186a
84a
60a
49a
170a
24a
83a
18a
33a
35a
23a
183a
109a
66a
12a
88a
96a
1a 10a
108a
6a 164a
180a
106a
99a
167a
145a
181a
110a
82a
38a
77a
94a
130a
165a
97a
28a
9a 117a
20a
122a
176a
140a
65a
80a
179a
182a
73a
133a
39a
102aZ-
SCO
RE
LABORATORY ID
CALORIFIC VALUE Z-SCORE TREND

Page 15 of 22
COAL CONCEPTS - PROFICIENCY TESTING -JANUARY 2019
ANALYTICAL PARAMETER : TOTAL SULPHUR (%)
LAB ID MOISTURE IN ANALYSIS SAMPLE (%) AIR DRY DRY BASE Z-SCORE (DRY BASE)
1a 3,46 1,15 1,19 0,52
6a 3,00 1,14 1,18 0,39
7a 3,33 0,27 0,28 -6,66
9a 3,35 1,13 1,17 0,34
10a 3,10 1,09 1,12 0,00
12a 3,10 1,14 1,18 0,40
15a 3,35 1,14 1,18 0,43
18a 3,07 1,14 1,18 0,40
21a 2,58 0,96 0,99 -1,10
23a 3,10 1,15 1,19 0,48
24a 3,41 1,21 1,25 1,00
26a 2,77 0,94 0,97 -1,25
27a 2,80 1,00 1,03 -0,76
28a 3,23 0,85 0,88 -1,94
30a 2,91 1,17 1,21 0,63
36a 3,00 1,04 1,07 -0,42
37a 2,75 1,49 1,53 3,20
38a 3,05 1,02 1,05 -0,58
39a 2,83 1,26 1,30 1,35
42a 3,19 1,27 1,31 1,47
49a 2,83 1,13 1,16 0,29
50a 2,93 3,01 3,10 15,54
58a 2,50 1,10 1,13 0,0
60a 2,96 1,14 1,17 0,39
61a 3,20 1,21 1,25 0,98
65a 3,10 0,81 0,84 -2,28
66a 2,96 1,15 1,19 0,47
69a 2,80 1,10 1,13 0,0
71a 2,63 1,10 1,13 0,0
72a 2,82 1,15 1,18 0,46
74a 2,65 1,12 1,15 0,20
76a 2,70 0,95 0,98 -1,17
79a 3,21 1,13 1,17 0,33
80a 3,50 1,20 1,24 0,93
83a 2,96 1,20 1,24 0,87
88a 3,18 1,18 1,22 0,73
92a 3,40 0,88 0,91 -1,69
95a 3,40 1,08 1,12 -0,06
97a 3,12 1,14 1,18 0,40
99a 3,10 1,09 1,12 0,00
101a 2,77 1,23 1,27 1,10
106a 2,82 1,21 1,25 0,94
108a 3,11 1,09 1,12 0,00
109a 3,00 1,13 1,16 0,31
110a 3,09 1,14 1,18 0,40
112a 3,30 1,01 1,04 -0,64
113a 3,59 1,18 1,22 0,77
122a 3,10 0,95 0,98 -1,14
124a 3,03 1,03 1,06 -0,50
126a 2,75 0,92 0,95 -1,41
130a 3,60 1,06 1,10 -0,20
131a 2,95 1,12 1,15 0,22
132a 2,83 0,92 0,95 -1,41
133a 2,93 1,10 1,13 0,00
135a 3,23 1,36 1,41 2,20
136a 3,25 0,88 0,91 -1,70
137a 2,91 1,00 1,03 -0,75
138a 3,20 1,10 1,14 0,09
139a 3,26 1,09 1,13 0,0
140a 3,68 0,91 0,94 -1,42
143a 2,72 1,13 1,16 0,28
145a 3,31 1,19 1,23 0,83
146a 3,20 1,23 1,27 1,14
151a 3,39 1,02 1,06 -0,55
161a 2,90 0,96 0,99 -1,08
162a 3,47 1,11 1,15 0,19
165a 3,14 0,93 0,96 -1,30
167a 3,33 1,10 1,14 0,10
168a 2,18 1,04 1,06 -0,49
169a 3,50 1,05 1,09 -0,29
172a 3,77 0,74 0,77 -2,80
177a 2,07 1,23 1,26 1,03
179a 3,10 1,20 1,24 0,89
180a 1,97 1,03 1,05 -0,59
183a 3,60 1,08 1,12 -0,04
186a 3,15 1,12 1,16 0,24
NUMBER OF RESULTS 76 76 76 -
OUTLIERS - - 2 2 -
AVERAGE - 3,06 1,09 1,13 -
MEDIAN - 1,11 1,14
STD DEVIATION - - 0,12 0,13 -
ROBUST AVERAGE - - 1,09 1,12 -
ROBUST STD DEVIATION - - 0,13 0,13 -
UoM - - 0,02 0,02

Page 16 of 22
-3,00
-2,00
-1,00
0,00
1,00
2,00
3,00
172a
65a
28a
136a
92a
140a
126a
132a
165a
26a
76a
122a
21a
161a
27a
137a
112a
180a
38a
151a
124a
168a
36a
169a
130a
95a
183a
10a
99a
108a
133a
139a
58a
71a
69a
138a
167a
162a
74a
131a
186a
143a
49a
109a
79a
9a 60a
6a 18a
110a
12a
97a
15a
72a
66a
23a
1a 30a
88a
113a
145a
83a
179a
80a
106a
61a
24a
177a
101a
146a
39a
42a
135a
37a
Z-SC
OR
E
LABORATORY ID
TOTAL SULPHUR Z-SCORE TREND

Page 17 of 22 COAL CONCEPTS - PROFICIENCY TESTING -JANUARY 2019
ANALYTICAL PARAMETER : PHOSPHOROUS IN COAL (%)
LAB ID
MOISTURE IN ANALYSIS SAMPLE (%) AIR DRY DRY BASE
Z-SCORE (DRY BASE)
1a 3,46 0,076 0,079 0,21
7a 3,33 0,104 0,107 1,90
9a 3,35 0,080 0,083 0,44
12a 3,10 0,070 0,072 -0,17
18a 3,07 0,089 0,092 0,98
21a 2,58 0,083 0,085 0,59
23a 3,10 0,065 0,067 -0,48
24a 3,41 0,075 0,077 0,11
26a 2,77 0,053 0,054 -1,24
69a 2,80 0,049 0,050 -1,46
67a 3,30 0,081 0,084 0,50
74a 2,65 0,058 0,060 -0,92
108a 3,11 0,075 0,077 0,13
109a 3,00 0,073 0,075 0,00
113a 3,59 0,066 0,068 -0,40
112a 3,30 0,098 0,101 1,54
114a 3,05 0,079 0,081 0,37
138a 3,20 0,060 0,062 -0,78
139a 3,26 0,044 0,045 -1,74
146a 3,20 0,047 0,049 -1,56
169a 3,50 0,101 0,105 1,73
172a 3,77 0,072 0,075 0,0
177a 2,07 0,078 0,080 0,26
Number of results - 23 23 23 -
OUTLIERS - - 0 0 -
AVERAGE - 3,13 0,073 0,075 -
STD DEVIATION - - 0,016 0,017 -
MEDIAN - 0,075 0,077
ROBUST AVERAGE - - 0,073 0,075
ROBUST STD DEVIATION - - 0,018 0,019
UoM - - 0,005 0,005
-3,00
-2,00
-1,00
0,00
1,00
2,00
3,00
139a 146a 69a 26a 74a 138a 23a 113a 12a 172a 109a 24a 108a 1a 177a 114a 9a 67a 21a 18a 112a 169a 7a
Z-SC
OR
ES
LAB ID
PHOSPHOROUS IN COAL Z-SCORES

Page 18 of 22 COAL CONCEPTS - PROFICIENCY TESTING -JANUARY 2019
ANALYTICAL PARAMETER : TOTAL CARBON (%)
LAB ID
MOISTURE IN ANALYSIS SAMPLE (%) AIR DRY DRY BASE
Z-SCORE (DRY BASE)
1a 3,46 54,01 55,95 0,11
9a** 3,35 45,38 46,95 -10,10
18a 3,07 53,41 55,10 -0,85
21a** 2,58 55,64 57,11 1,44
42a 3,19 54,62 56,42 0,65
49a 2,83 54,67 56,26 0,47
66a** 2,96 53,00 54,62 -1,40
88a 3,18 53,84 55,61 -0,27
99a 3,10 53,80 55,52 -0,37
108a 3,11 53,95 55,68 -0,19
109a 3,00 53,70 55,36 -0,55
145a** 3,31 55,70 57,61 2,00
177a 2,07 53,80 54,94 -1,03
Number of results - 13 13 13 -
OUTLIERS - - 1 1 -
AVERAGE - 3,02 54,18 55,85 -
MEDIAN - - 53,90 55,65 -
STD DEVIATION - - 0,83 0,88 -
ROBUST AVERAGE - - 54,14 55,80
ROBUST STD DEVIATION - - 0,98 0,98
UoM - - 0,35 0,35
REPRODUCIBILITY
UPPER LIMIT - - - 56,85 -
LOWER LIMIT - - - 54,85 -
COAL CONCEPTS - PROFICIENCY TESTING -JANUARY 2019
ANALYTICAL PARAMETER : HYDROGEN (%)
LAB ID
MOISTURE IN ANALYSIS SAMPLE (%) AIR DRY DRY BASE
Z-SCORE (DRY BASE)
1a 3,46 2,81 2,91 -0,04
9a 3,35 2,58 2,67 -1,57
18a 3,07 2,76 2,85 -0,44
21a 2,58 2,75 2,82 -0,60
36a 3,00 2,64 2,72 -1,24
42a 3,19 2,84 2,93 0,11
88a 3,18 2,96 3,06 0,89
99a 3,10 2,85 2,94 0,16
108a 3,11 2,86 2,95 0,22
109a 3,00 2,89 2,98 0,40
177a** 2,07 3,18 3,25 2,10
Number of results 11 11 11
OUTLIERS - - 0 0 -
AVERAGE - 3,01 2,83 2,92 -
MEDIAN - 2,84 2,93 -
STD DEVIATION - - 0,16 0,16 -
ROBUST AVERAGE - - 2,82 2,91
ROBUST STD DEVIATION - - 0,14 0,15
UoM - - 0,05 0,06
REPRODUCIBILITY
UPPER LIMIT - - - 3,17 -
LOWER LIMIT - - - 2,67 -
COAL CONCEPTS - PROFICIENCY TESTING -JANUARY 2019
ANALYTICAL PARAMETER : NITROGEN(%)
LAB ID
MOISTURE IN ANALYSIS SAMPLE (%) AIR DRY DRY BASE
Z-SCORE (DRY BASE)
1a 3,46 1,23 1,27 -0,73
9a 3,35 1,26 1,30 -0,11
18a 3,07 1,33 1,37 1,35
42a 3,19 1,33 1,37 1,38
88a** 3,18 1,04 1,07 -4,98
99a 3,10 1,23 1,27 -0,83
108a 3,11 1,26 1,30 -0,17
109a 3,00 1,29 1,33 0,45
177a 2,07 1,22 1,25 -1,34
Number of results 9 9 9 -
OUTLIERS - - 1 1 -
AVERAGE - 3,06 1,27 1,31 -
MEDIAN - 1,26 1,30 -
STD DEVIATION - - 0,04 0,05 -
REPRODUCIBILITY
UPPER LIMIT - - - 1,46 -
LOWER LIMIT - - - 1,16 -
Page 19 of 22
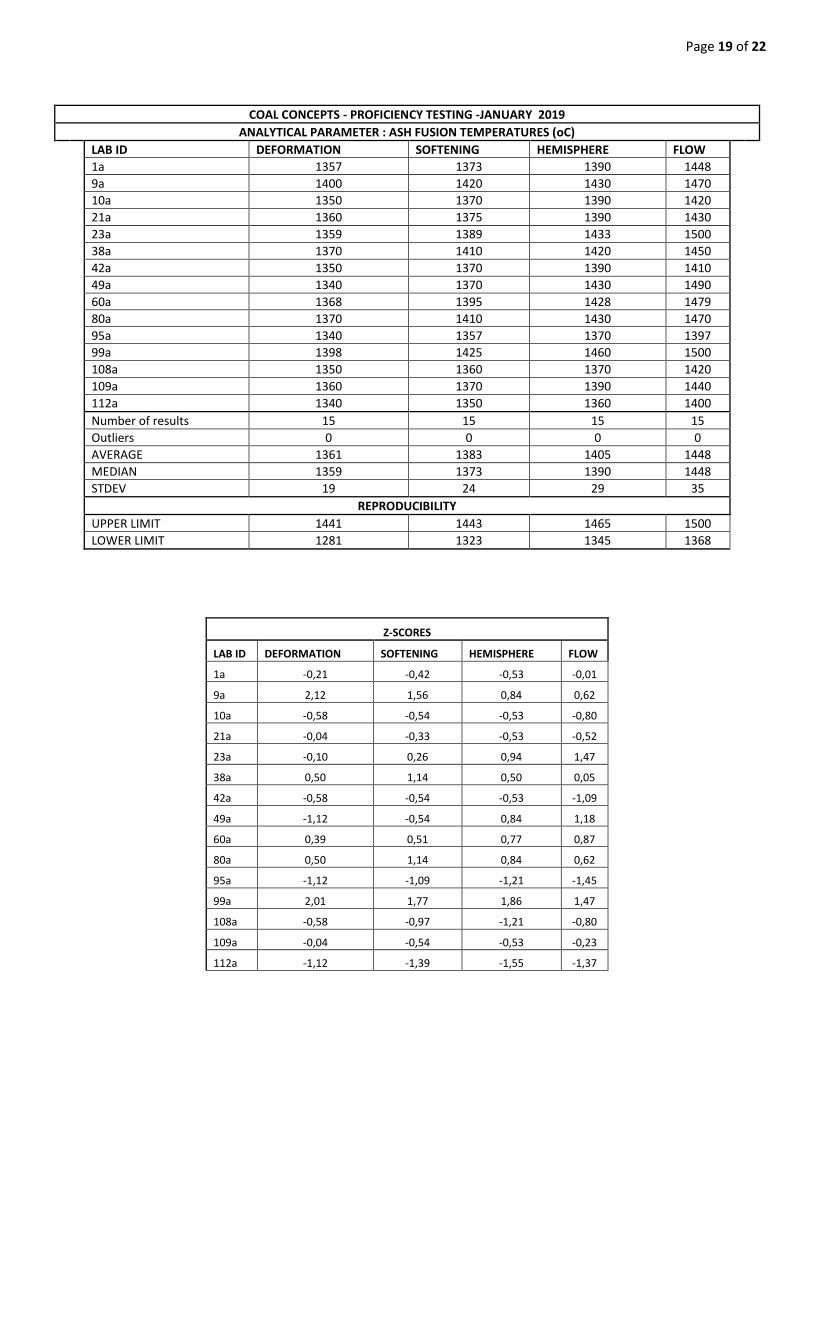
COAL CONCEPTS - PROFICIENCY TESTING -JANUARY 2019
ANALYTICAL PARAMETER : ASH FUSION TEMPERATURES (oC)
LAB ID DEFORMATION SOFTENING HEMISPHERE FLOW
1a 1357 1373 1390 1448
9a 1400 1420 1430 1470
10a 1350 1370 1390 1420
21a 1360 1375 1390 1430
23a 1359 1389 1433 1500
38a 1370 1410 1420 1450
42a 1350 1370 1390 1410
49a 1340 1370 1430 1490
60a 1368 1395 1428 1479
80a 1370 1410 1430 1470
95a 1340 1357 1370 1397
99a 1398 1425 1460 1500
108a 1350 1360 1370 1420
109a 1360 1370 1390 1440
112a 1340 1350 1360 1400
Number of results 15 15 15 15
Outliers 0 0 0 0
AVERAGE 1361 1383 1405 1448
MEDIAN 1359 1373 1390 1448
STDEV 19 24 29 35
REPRODUCIBILITY
UPPER LIMIT 1441 1443 1465 1500
LOWER LIMIT 1281 1323 1345 1368
Z-SCORES
LAB ID DEFORMATION SOFTENING HEMISPHERE FLOW
1a -0,21 -0,42 -0,53 -0,01
9a 2,12 1,56 0,84 0,62
10a -0,58 -0,54 -0,53 -0,80
21a -0,04 -0,33 -0,53 -0,52
23a -0,10 0,26 0,94 1,47
38a 0,50 1,14 0,50 0,05
42a -0,58 -0,54 -0,53 -1,09
49a -1,12 -0,54 0,84 1,18
60a 0,39 0,51 0,77 0,87
80a 0,50 1,14 0,84 0,62
95a -1,12 -1,09 -1,21 -1,45
99a 2,01 1,77 1,86 1,47
108a -0,58 -0,97 -1,21 -0,80
109a -0,04 -0,54 -0,53 -0,23
112a -1,12 -1,39 -1,55 -1,37

Page 20 of 22
COAL CONCEPTS - PROFICIENCY TESTING -JANUARY 2019
ANALYTICAL PARAMETER : ASTM ASH (%)
LAB ID
MOISTURE IN ANALYSIS SAMPLE (%) AIR DRY (%) DRY BASE (%)
Z-SCORE (DRY BASE)
1a 3,46 29,95 31,02 0,26
108a 3,11 29,90 30,86 -0,54
109a 3,00 30,00 30,93 -0,20
172a 3,77 30,11 31,29 1,56
186a 3,15 29,78 30,75 -1,08
Number of results - 5 5 5 -
OUTLIERS - - 0 0 -
AVERAGE - 3,30 29,95 30,97 -
STD DEVIATION - - 0,12 0,20 -
MEDIAN - - 29,95 30,93 -
COAL CONCEPTS - PROFICIENCY TESTING -JANUARY 2019
ANALYTICAL PARAMETER : ASTM VOLS (%)
LAB ID
MOISTURE IN ANALYSIS SAMPLE (%) AIR DRY (%) DRY BASE (%)
Z-SCORE (DRY BASE)
1a 3,46 21,33 22,09 -1,46
108a 3,11 21,60 22,29 0,78
109a 3,00 21,60 22,27 0,49
172a 3,77 20,34 21,14 -12,21
186a 3,15 21,54 22,24 0,18
Number of results - 5 5 5 -
OUTLIERS - - 1 1 -
AVERAGE - 3,30 21,52 22,22 -
STD DEVIATION - - 0,13 0,09 -
MEDIAN - - 21,57 22,25 -
COAL CONCEPTS - PROFICIENCY TESTING -JANUARY 2019
ANALYTICAL PARAMETER : FLUORINE (ppm)
LAB ID
MOISTURE IN ANALYSIS SAMPLE (%) AIR DRY DRY BASE
Z-SCORE (DRY BASE)
12a 3,10 190 196 -0,31
108a 3,11 174 180 -0,86
109a 3,00 191 197 -0,28
177a 2,07 244 249 1,45
Number of results - 4 4 4 -
OUTLIERS - - -
AVERAGE - 2,82 200 205 -
STD DEVIATION - - 31 30 -
MEDIAN - - 191 196 -
COAL CONCEPTS - PROFICIENCY TESTING -JANUARY 2019
ANALYTICAL PARAMETER: CHLORINE (ppm)
LAB ID
MOISTURE IN ANALYSIS SAMPLE (%) AIR DRY DRY BASE
Z-SCORE (DRY BASE)
12a 3,10 70 72 -0,50
108a 3,11 63 65 -0,69
109a 3,00 78 80 -0,29
177a 2,07 145 148 1,48
Number of results - 4 4 4 -
OUTLIERS - - 0 0 -
AVERAGE - 2,82 89 91 -
STD DEVIATION - - 38 38 -
MEDIAN - - 74 76 -

Page 21 of 22
CONCLUSION
1. The overall ISO Ash determination trend was negatively biased. The average, robust average and median were similar.
2. The overall ISO volatile determination trend was almost positively biased. Six outliers were detected. These
seemed to be due to possible swopped samples and analytical errors. The average, robust average and
median were similar
3. Calorific value graph indicated an almost even z-score trend. Two outliers were detected. These seemed to
be due to possible swopped samples or analytical errors
4. Sulphur determination trend was positively biased. This indicated that participates reported results that
were generally higher than the average value. The average, robust average and median were similar
5. Phosphorus: The median, robust average and mean compared well with each other indicating that the extreme values did not affect the centralized values.
6. Carbon, Hydrogen and Nitrogen analysis was well done. One outlier was detected on Carbon and Nitrogen.
7. AFT results were generally well done.
8. Assessment criterion for homogeneity check (From ISO 13528, page 45)
8.1 Comparison of the between sample standard deviation with the standard deviation for proficiency testing Standard deviation for ISO ash =0.33 Check value = 0.33 x 0.3 = 0.099
Between sample standard deviation = 0.031 The between standard deviation is less than the check value for the criterion assessment for
homogeneity, therefore homogeneity has been established.

Page 22 of 22
COAL CONCEPTS: Terms and Conditions
Return of results: Laboratories participate in proficiency testing programs on the understanding that they will be sharing their results and information anonymously with other laboratories performing the same analysis. No return of results compromises the spirit of the programs, and reports will not be sent to laboratories unless they return results. Payment in full is required from all laboratories enrolling whether they return results or not. Errors in Participant Proficiency Testing Results: Proficiency testing reports should reflect the level of accuracy that a regular testing client would receive. If a participant finds an error in their proficiency testing results, they may notify us in writing and change their submission PRIOR to the due date for return. Changes after this time will not be accepted. Coal Concepts’ reports results as submitted by participants. On occasion, it seems as though participants have mixed up the samples or not processed the samples according to the instructions. Coal Concepts cannot make assumptions of this nature and change results 'to suit'. We also cannot compromise the integrity of the programs by suggesting to some participants that they should review their results prior to the due date. (This is unfair to other participants) It is the responsibility of the participants to check all aspects of the program, including sample identification, preparation, testing instructions, calculations and reporting of the results prior to results submission. If samples are not in good condition on arrival to the participant laboratory, Coal Concepts must be notified in writing IMMEDIATELY, as often samples can be replaced in good time. Claims about samples received in bad condition will not be accepted after the report has been issued. Late Enrolments and Late Results: Late enrolment requests cannot always be accommodated, as sample manufacture must be scheduled well in advance to the shipping date of the program to allow all necessary quality assurance activities to be carried out. Shipping of PT materials and evaluating test results from PTPs out of cycle with the mainstream programs is considerably time consuming and therefore costly. In order not to disadvantage participants able to comply with time frames, Coal Concepts may charge a late fee in the following circumstances: Requests that Coal concepts staff enters results on behalf of participants Requests to record results after the due date Requests for PTP participation that is out of cycle with the scheduled dates Shipping fees and Customs clearance: Costs incurred for shipping samples and clearance of same through customs are the responsibility of the participating laboratory unless otherwise indicated Non-payment of fees: Coal Concepts retains the right to withhold reports and/or test materials and services when invoices are outstanding. Confidentiality of results: All data and information received by Coal Concepts from its clients are considered confidential unless the client has given express permission to pass on information. Definitions: The dictionary definitions of “collusion” and “falsification” are as follows. · Collusion: A secret agreement or cooperation for a fraudulent or deceitful purpose. · Falsification: Deliberately changing something to be false. In proficiency testing terms, collusion is comparing data (and perhaps changing data) to fit in with a believed “correct” result. This is contrary to the spirit of proficiency testing programs, which are issued with the intention of providing an objective comparison of a laboratory’s performance with others. Coal Concepts tries to minimise the occurrence of collusion by being aware that laboratories should be objective when they report their results, and should therefore not know the intended results at the time they are reporting to us. Answers are not provided to clients until results have been submitted. To prevent collusion and falsification our advice to clients is: DON’T confer with others about PT samples or results. DO accept the fact that everyone makes errors. DON’T average the results or opinions of every person in the laboratory before selecting the answer to be submitted. Instead, use one of the answers AS SUBMITTED to you and take advantage of the Coal Concepts internal QA services and submit all answers generated by the technicians. DO have confidence in your own results. Proficiency Testing (PT) is a compulsory part of laboratory accreditation, but it is also an important tool for giving you confidence in your results. “Enhancing” your PT results with assistance from another participant cannot increase confidence in your laboratory’s performance. Coal concepts’ testing staff are not told what the expected results are, nor what we are expecting. We subject ALL results to analysis, even if they are different. The staff have the right to check that the results we enter on their behalf are correctly transcribed. Clients are always welcome to contact Coal Concepts to seek advice or information about collusion or falsification of data. Policy for Participant Appeal of PT Performance Assessment: If participants disagree with their performance assessment in a proficiency report, they should inform Coal Concepts in writing. The response will include Coal Concepts interpretation of the outcome of the reassessment and an explanation of that outcome. (For example, explanation of a calculation, or the rationale for the outcome of the evaluation.) If a mistake has been made by Coal Concepts, it will be dealt with via Coal Concepts’ non-conformance system. Liability In no event shall a party's liability to the other party for direct damages exceed an amount equal to the value of the amount for the PT Programme, under that specific month End of report