coa pf inv mtg- gallagher agenda-2017-02-23 draft-gfa-5 …
TRANSCRIPT
GALLAGHER FIDUCIARY ADVISORS, LLC
310 Grant Street, Suite 802
Pittsburgh, PA 15219
P: 412.232.1000 | F: 412.232.1027
27 Commerce Street, Suite 1827
Newark, NJ 07102
P: 973.424.6414 | F: 973.424.6419
1667 K Street N.W. | Suite 1270
Washington, DC 20006
P: 202.898.2270 | F: 202.898.1819
© 2017 GALLAGHER FIDUCIARY ADVISORS, LLC ARTHUR J. GALLAGHER & CO. | AJG.COM
Investments Agenda
City of Annapolis Police and Fire Retirement Plan Commission Meeting
145 Gorman Street, Third Floor Conference Room Annapolis, MD 21401 Dial In Number – 1-888-950-5945; Participant Code: 9910883
February 23, 2017 – 8:30 am
Items Proposed
Tab
Proposed Timing
1. Introductions & Review of Agenda
Scott Abel, CFA & Marc Morlock Bios (see Tab A)
8:30 am
2. Presentation Overview of Gallagher Fiduciary Advisors, LLC
Gallagher update letter to RFI response Update on capabilities, resources, experience, Plan performance, asset allocation
modeling and Gallagher services proposal
Tab A
3. Gallagher Market Monitor Report Tab B
4. Investment Performance & Evaluation Reports
4th Quarter 2016 Report
Handout
5. Investment Policy Statement Updates
Proposed revised strikeline for review, subject to decisions on other possible alternate portfolio mixes
6. Fixed Income Structure Analysis – Consideration of Possible Partial Reallocations to Garcia Hamilton
Handout
7. Aberdeen Emerging Markets Equity Strategy Update
8. Aberdeen Frontier Markets Equity Strategy Preliminary performance, risk and style overlap analysis
Handout
9. Other

Tab A

GALLAGHER FIDUCIARY ADVISORS, LLC
FEBRUARY 23, 2017
City of Annapolis Police and Fire Retirement Plan CommissionExecutive Summary Presentation

ARTHUR J. GALLAGHER & CO. | BUSINESS WITHOUT BARRIERS™ 2© 2017 GALLAGHER FIDUCIARY ADVISORS, LLC
Table of Contents
© 2017 GALLAGHER FIDUCIARY ADVISORS, LLC
1. Overview of Gallagher and Capabilities 3
2. City of Annapolis Gallagher Client Team 4
3. Gallagher Team & Research Platform 5 – 6
4. Current Portfolio Positioning 8 – 9
5. Plan Portfolio Positioning Post Financial Crisis 11 – 14
6. Plan Summary Performance Review & Peer Benchmarking 16 – 19
7. Outlook & Plan Asset Allocation Modeling 21 – 24
8. Gallagher Team Services Proposal 26
Section Page(s)

ARTHUR J. GALLAGHER & CO. | BUSINESS WITHOUT BARRIERS™ 3© 2017 GALLAGHER FIDUCIARY ADVISORS, LLC
Institutional Investment & Fiduciary Services
The Institutional Investment & Fiduciary Services practice of Arthur J. Gallagher & Co., Gallagher Fiduciary Advisors, LLC (“Gallagher”) is an SEC registered investment advisor
Firm and its predecessors founded in 1976
Serving plan sponsors as fiduciaries– Advisory Consulting
– Discretionary Consulting
– Fiduciary Decision-Making
Approximately $63 billion* in consulting assets under management– 224 clients, 316 asset pools and approximately $66 billion in total assets
including fiduciary decision-making*
30 consulting professionals across offices in Pittsburgh, Newark, and Washington, DC– 15 CFA charter holders, 1 CAIA charter holder, 1 CPA, 3 attorneys
17 additional staff providing analytical, compliance, and administrative support
DB49%
DC28%
Operating11%
Other12%
Plan Type
Taft-Hartley
55%
Corporate26%
Health Care10%
Other9%
Sponsor Type
*Consulting AUM as of 09/30/2016. Sponsor and Plan Type chart percentages based on AUM.
Overview of Gallagher
© 2017 GALLAGHER FIDUCIARY ADVISORS, LLC

ARTHUR J. GALLAGHER & CO. | BUSINESS WITHOUT BARRIERS™
City of Annapolis Client Team
© 2017 GALLAGHER FIDUCIARY ADVISORS, LLC 4
Primary Consultants
Client Relationship Oversight
Scott Abel, CFAArea Senior Vice President 19 years experience MBA, Duke University Pittsburgh office
Marc MorlockArea Assistant Vice President 22 years experience BS, Pennsylvania State
University Washington, DC office
Frank Domeisen, CFAArea Executive Vice President & Area Director 23 years experience MBA, University of Pittsburgh Pittsburgh office

ARTHUR J. GALLAGHER & CO. | BUSINESS WITHOUT BARRIERS™© 2017 GALLAGHER FIDUCIARY ADVISORS, LLC 5
Gallagher’s Team
Independent Senior Fiduciary
Consultants*
Michael Johnson, CFA
Francis Lilly
Leadership Team
Consultants Analysts Marketing Operations Compliance
Scott Abel, CFA Susan Bowen, CFAChristiaan Brokaw, CFA, AIF®
Barbra Byington, CFAJamia Canlas, CFA Frank Domeisen, CFA, AIF®
Eric Elbell, CFA, CAIAPhilip Fabrizio, CFA, CFPAndrew Irving, Esq. Christopher JarmushMichael Johnson, CFAFrancis LillyChristopher Pipich, CFAAdam Marks, CFAMarc MorlockMangala MurthyChristian Sevier, CFAJoseph Stevens, CFATim Walters Billy Welsh, CIPMGregory Zuroski
Business DevelopmentChristy HuffmanLisa KrughJohn Murphy
OperationsLisa Marcotullio Jeanette Vaughn
Project ManagerGuia Reyes
AdministrativeSamantha BrokawTheresa Deliantis Nikki HensonBetsy Lohler Catherine WaslisSherry WeinmanKia Easton
Chief Compliance OfficerNatalie Kossak, Esq.
*Independent Contractors
Tammy BatesAndrew BarnesAndrew ClarkKevin DiMannaBradley Hampton Christine MansourKyongdo Min, CPA, CFACraig Morton, CFA David MurrayChristopher SmithJeffrey SteinerLinda Tressler
Anthony A. Dreyspool, Esq. Stephen R. Wilson
Christiaan Brokaw, CFA, AIF®
Tim Walters
Frank Domeisen, CFA, AIF®
Andrew Irving, Esq.
ARTHUR J. GALLAGHER & CO. | BUSINESS WITHOUT BARRIERS™© 2017 GALLAGHER FIDUCIARY ADVISORS, LLC 6
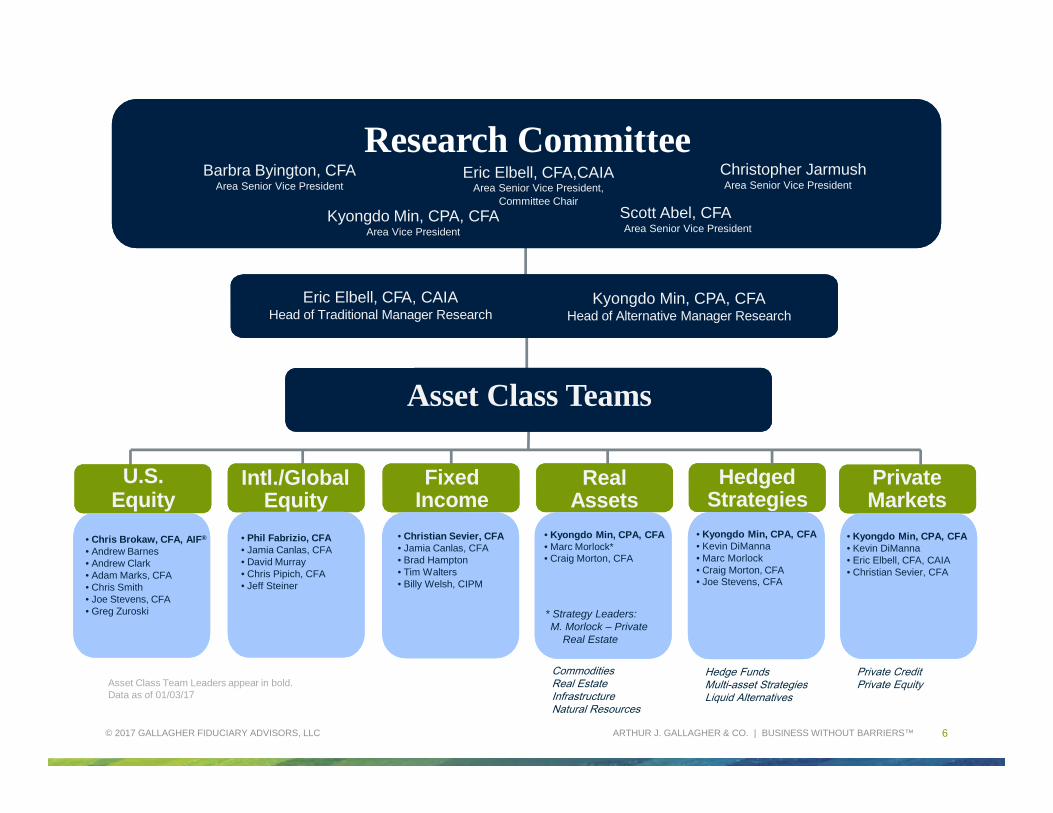
Research Committee
Kyongdo Min, CPA, CFAArea Vice President
Barbra Byington, CFAArea Senior Vice President
Eric Elbell, CFA,CAIAArea Senior Vice President,
Committee Chair
U.S.Equity
• Chris Brokaw, CFA, AIF®
• Andrew Barnes• Andrew Clark• Adam Marks, CFA• Chris Smith• Joe Stevens, CFA• Greg Zuroski
Intl./Global Equity
• Phil Fabrizio, CFA• Jamia Canlas, CFA• David Murray• Chris Pipich, CFA• Jeff Steiner
FixedIncome
• Christian Sevier, CFA• Jamia Canlas, CFA• Brad Hampton• Tim Walters• Billy Welsh, CIPM
Real Assets
• Kyongdo Min, CPA, CFA• Marc Morlock*• Craig Morton, CFA
HedgedStrategies
• Kyongdo Min, CPA, CFA• Kevin DiManna• Marc Morlock • Craig Morton, CFA• Joe Stevens, CFA
Private Markets
• Kyongdo Min, CPA, CFA• Kevin DiManna• Eric Elbell, CFA, CAIA• Christian Sevier, CFA
Asset Class Teams
Asset Class Team Leaders appear in bold. Data as of 01/03/17
Eric Elbell, CFA, CAIAHead of Traditional Manager Research
Kyongdo Min, CPA, CFAHead of Alternative Manager Research
Scott Abel, CFAArea Senior Vice President
Christopher JarmushArea Senior Vice President
CommoditiesReal EstateInfrastructureNatural Resources
* Strategy Leaders:M. Morlock – Private
Real Estate
Hedge FundsMulti-asset StrategiesLiquid Alternatives
Private CreditPrivate Equity
ARTHUR J. GALLAGHER & CO. | BUSINESS WITHOUT BARRIERS™
Current Defensive Portfolio Positioning
© 2017 GALLAGHER FIDUCIARY ADVISORS, LLC 7

ARTHUR J. GALLAGHER & CO. | BUSINESS WITHOUT BARRIERS™© 2017 GALLAGHER FIDUCIARY ADVISORS, LLC 8
U.S Equity, 30.8
Fixed Income, 21.5Marketable Aternatives, 21.1
Global/International Equity, 17.9
Real Estate, 5.8Cash, 3
Hedge Funds, 14.6
Special Situations
4.4
Commodities, 2.1
Current Asset Allocation (as of 12/31/2016)

ARTHUR J. GALLAGHER & CO. | BUSINESS WITHOUT BARRIERS™© 2017 GALLAGHER FIDUCIARY ADVISORS, LLC 9
All Public Plans < $1B- Total Fund Peer Group Allocations
-Current Allocation as of 12/31/16
ARTHUR J. GALLAGHER & CO. | BUSINESS WITHOUT BARRIERS™
Defensive Positioning vs. Bull Market Run
© 2017 GALLAGHER FIDUCIARY ADVISORS, LLC 10

ARTHUR J. GALLAGHER & CO. | BUSINESS WITHOUT BARRIERS™© 2017 GALLAGHER FIDUCIARY ADVISORS, LLC 11
*Source: eVestment

ARTHUR J. GALLAGHER & CO. | BUSINESS WITHOUT BARRIERS™© 2017 GALLAGHER FIDUCIARY ADVISORS, LLC 12
*Source: eVestment

ARTHUR J. GALLAGHER & CO. | BUSINESS WITHOUT BARRIERS™© 2017 GALLAGHER FIDUCIARY ADVISORS, LLC 13
*Source: eVestment
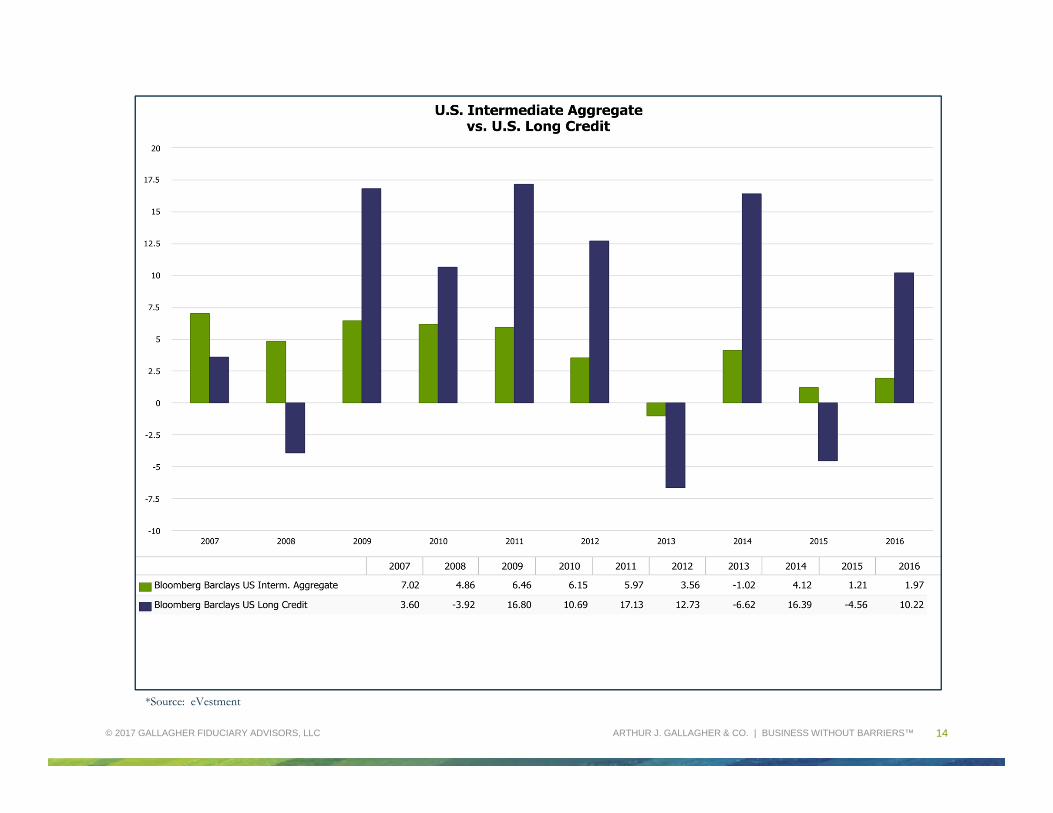
ARTHUR J. GALLAGHER & CO. | BUSINESS WITHOUT BARRIERS™© 2017 GALLAGHER FIDUCIARY ADVISORS, LLC 14
*Source: eVestment
ARTHUR J. GALLAGHER & CO. | BUSINESS WITHOUT BARRIERS™
Defensive Positioning Relative Performance
© 2017 GALLAGHER FIDUCIARY ADVISORS, LLC 15

ARTHUR J. GALLAGHER & CO. | BUSINESS WITHOUT BARRIERS™ 16
Portfolio Performance on a Risk Adjusted Basis- All Plans
© 2017 GALLAGHER FIDUCIARY ADVISORS, LLC
• The portfolio has generated an additional 8 bps & 10 bps of return per unit of risk as compared with its median peer group over the three & five year periods.
• The portfolio has achieved greater risk adjust returns than 74% of its peer group over the five year period.

ARTHUR J. GALLAGHER & CO. | BUSINESS WITHOUT BARRIERS™ 17
Portfolio Performance vs. Peers w/ Similar Equity Exposure
© 2017 GALLAGHER FIDUCIARY ADVISORS, LLC
• Compared with Public Plans w/ <$1B in assets & U.S. Equity exposure < 35%, the fund has outperformed its median peers by 51 bps over the five year period.
• The fund outperformed in Q4 by 32 bps
• On a risk adjusted basis, the fund performed in the top quartile, outperforming 83% of plans that allocated at least 65% of their portfolio outside of U.S. Equity.
• Tactical Allocation outside of the U.S. market has added significant risk adjusted value.
ARTHUR J. GALLAGHER & CO. | BUSINESS WITHOUT BARRIERS™ 18
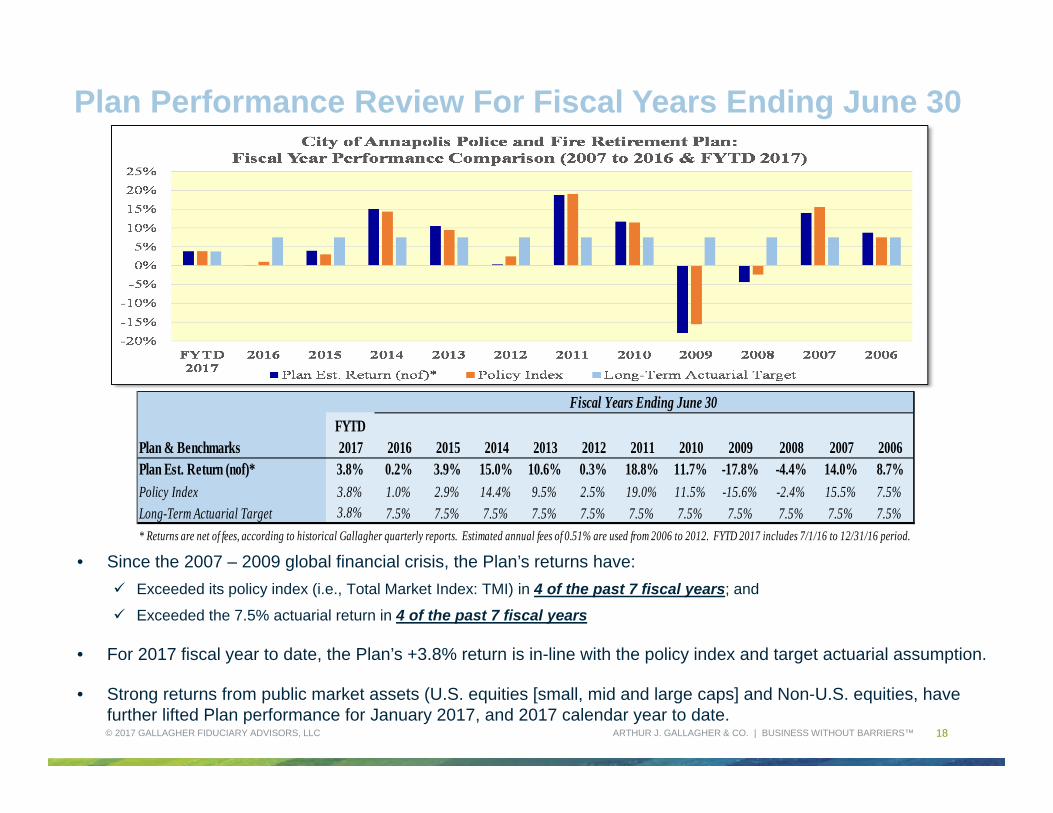
Plan Performance Review For Fiscal Years Ending June 30
© 2017 GALLAGHER FIDUCIARY ADVISORS, LLC
• Since the 2007 – 2009 global financial crisis, the Plan’s returns have:
Exceeded its policy index (i.e., Total Market Index: TMI) in 4 of the past 7 fiscal years; and
Exceeded the 7.5% actuarial return in 4 of the past 7 fiscal years
• For 2017 fiscal year to date, the Plan’s +3.8% return is in-line with the policy index and target actuarial assumption.
• Strong returns from public market assets (U.S. equities [small, mid and large caps] and Non-U.S. equities, have further lifted Plan performance for January 2017, and 2017 calendar year to date.
Plan & BenchmarksFYTD 2017 2016 2015 2014 2013 2012 2011 2010 2009 2008 2007 2006
Plan Est. Return (nof)* 3.8% 0.2% 3.9% 15.0% 10.6% 0.3% 18.8% 11.7% -17.8% -4.4% 14.0% 8.7%Policy Index 3.8% 1.0% 2.9% 14.4% 9.5% 2.5% 19.0% 11.5% -15.6% -2.4% 15.5% 7.5%
Long-Term Actuarial Target 3.8% 7.5% 7.5% 7.5% 7.5% 7.5% 7.5% 7.5% 7.5% 7.5% 7.5% 7.5%
* Returns are net of fees, according to historical Gallagher quarterly reports. Estimated annual fees of 0.51% are used from 2006 to 2012. FYTD 2017 includes 7/1/16 to 12/31/16 period.
Fiscal Years Ending June 30

ARTHUR J. GALLAGHER & CO. | BUSINESS WITHOUT BARRIERS™ 19
Plan Performance Universe Rankings ReviewAnnualized Returns As Of 12/31/2016 & Fiscal Years Ending June 30
© 2017 GALLAGHER FIDUCIARY ADVISORS, LLC
• The Plan’s generally more conservative profile, with lower target U.S. equity allocation compared to the Public Fund universe, has generated lower relative rankings in the past several years through 12/31/2016
• In capital market environments exhibiting weaker U.S. equity and corporate bond returns, the Plan’s broader diversification and lower U.S. equity target allocation has generally provided stronger relative rankings compared to the broad peer group (i.e., 48th percentile for FYTD 2017, and 31st
percentile in FY 2015 and 44th percentile in FY 2008)
ARTHUR J. GALLAGHER & CO. | BUSINESS WITHOUT BARRIERS™
Defensive Positioning Outlook
© 2017 GALLAGHER FIDUCIARY ADVISORS, LLC 20

ARTHUR J. GALLAGHER & CO. | BUSINESS WITHOUT BARRIERS™
Public Pension Trends
© 2017 GALLAGHER FIDUCIARY ADVISORS, LLC 21
*Source: BlackRock
• Since 1995, pensions have had to step out on the risk curve in order to generate the same 7.5% return they were able to with just bonds
• Portfolio risk is now predominately concentrated in equities
Asset Allocation required to hit a 7.5% return target*
The associated volatility of asset allocation*

ARTHUR J. GALLAGHER & CO. | BUSINESS WITHOUT BARRIERS™
Asset Allocation Modeling Update – 2016 CMA vs. 2017 CMACurrent vs. Proposed Alternate Mixes From Dec. 2016 Presentation
© 2017 GALLAGHER FIDUCIARY ADVISORS, LLC 22
Asset Class Style Current TMI* Portfolio 1 Portfolio 2 Portfolio 3 Portfolio 4Equity Global 44.0% 42.0% 44.0% 47.0% 50.0%
Total 44.0% 42.0% 44.0% 47.0% 50.0%Fixed Income Intermediate - US 29.0% 25.0% 23.0% 19.0% 17.0%
Total 29.0% 25.0% 23.0% 19.0% 17.0%Alternatives Marketable Alts 19.0% 15.0% 11.0% 10.0% 8.0%
Private Markets 0.0% 5.0% 10.0% 12.0% 14.0%Private Real Estate 6.0% 4.0% 7.0% 7.0% 5.0%Infrastructure 0.0% 7.0% 3.0% 3.0% 4.0%Total 25.0% 31.0% 31.0% 32.0% 31.0%
Other Cash 2.0% 2.0% 2.0% 2.0% 2.0%
Total Portfolio 100.0% 100.0% 100.0% 100.0% 100.0%
Expected Return/ Risk (w/ 2016 CMA) Current TMI* Portfolio 1 Portfolio 2 Portfolio 3 Portfolio 4
Return (Geo) 5.70% 6.21% 6.44% 6.70% 6.89%Risk 8.77% 9.62% 10.86% 11.80% 12.71%
Expected Return/ Risk (w/ 2017 CMA) Current TMI* Portfolio 1 Portfolio 2 Portfolio 3 Portfolio 4
Return (Geo) 5.56% 5.94% 6.17% 6.40% 6.55%Risk 8.69% 9.27% 10.29% 11.13% 11.91%Ret / Risk 0.64 0.64 0.60 0.57 0.55
Note: Gallagher’s 2016 long-term capital market assumptions assumes passive management for all asset classes.* Does not include recent commitments to Oaktree and Crescent. Proposed “Portfolio 1” includes full commitment to Oaktree REDF II and Crescent Mezzanine Fund VII.
Proposed “Portfolio 1” w/ selection
of Oaktree & Crescent
Proposed “Portfolio 1” w/ selection
of Oaktree & Crescent
Reductions in expected returns and yields for fixed income and other asset classes between 2016 and 2017 have led to further reductions in long-term expected returns across portfolio mixes.

ARTHUR J. GALLAGHER & CO. | BUSINESS WITHOUT BARRIERS™
Asset Allocation Modeling Update – 2017 CMACurrent Allocation & Alternate Mixes With Expanded Asset Classes
© 2017 GALLAGHER FIDUCIARY ADVISORS, LLC 23
Asset Class StyleLT Exp
Ret. (2017)LT Exp.
Ret. (2016)LT Exp.
Risk (2017)Current TMI*
Mix 1 Mix 2 Mix 3 Mix 4
Equity Global 7.0% 7.2% 17.0% 12.0% 12.0% 12.0% 12.0% 12.0%U.S. (All Cap/Style) 6.8% 7.0% 16.5% 29.0% 27.0% 27.0% 27.0% 27.0%
U.S. Large Cap TBC TBC TBC 17.0% 17.0% 17.0% 17.0% 17.0%
U.S. Mid Cap TBC TBC TBC 6.0% 5.0% 5.0% 5.0% 5.0%
U.S. Small Cap TBC TBC TBC 6.0% 5.0% 5.0% 5.0% 5.0%
Non-U.S. Develop. Mkts. 6.8% 7.0% 18.0%Non-U.S. Emerg. Mkts. 8.4% 9.1% 23.0% 3.0% 3.0% 3.0% 3.0% 3.0%
Total 44.0% 42.0% 42.0% 42.0% 42.0%Fixed Income U.S. Intermediate G/C 2.3% 2.3% 4.5% 29.0% 25.0%
U.S. Aggregate 2.6% 2.6% 5.0%U.S. Core Credit 3.6% 3.8% 7.0% 20.0%U.S. Intermediate Credit 3.1% 3.3% 5.5% 20.0% 20.0%U.S. High Yield 5.8% 6.1% 10.4% 5.0% 5.0% 5.0%
Total 29.0% 25.0% 25.0% 25.0% 25.0%Alternatives Marketable Alts. 5.5% 5.9% 8.7% 19.0% 15.0% 15.0% 15.0% 10.0%
Private Markets 8.6% 9.3% 27.5% 0.0% 5.0% 5.0% 5.0% 5.0%Private Real Estate 6.4% 6.1% 11.0% 6.0% 4.0% 4.0% 4.0% 9.0%Infrastructure 7.1% 8.0% 11.0% 0.0% 7.0% 7.0% 7.0% 7.0%
Total 25.0% 31.0% 31.0% 31.0% 31.0%Other Cash 2.0% 2.0% 2.0% 2.0% 2.0%
Total Portfolio 100.0% 100.0% 100.0% 100.0% 100.0%
Expected Return/ Risk Current Mix 1 Mix 2 Mix 3 Mix 4Return (Geo) 5.56% 5.95% 6.26% 6.37% 6.33%Risk 8.50% 9.09% 9.82% 9.92% 9.58%Ret / Risk 0.65 0.65 0.64 0.64 0.66
Note: Gallagher’s 2017 long-term capital market assumptions assumes passive management for all asset classes. U.S. All Cap/Style expected returns and risk used for U.S. Large Caps, U.S. Mid Caps and U.S. Small Caps until separate long-term capital market assumptions are developed. Gallagher anticipates this to be completed by Q2 2017. TBC: “To Be Completed”.
* Does not include recent commitments to Oaktree and Crescent. Proposed “Policy Mix 1” includes Oaktree REDF II and Crescent Mezz Fund VII per full funding commitment.

ARTHUR J. GALLAGHER & CO. | BUSINESS WITHOUT BARRIERS™
Asset Allocation Modeling Impacts & Summary Observations
© 2017 GALLAGHER FIDUCIARY ADVISORS, LLC 24
Declines in U.S. government bond yields have lowered long-term return assumptions for all U.S. government bonds across the maturity curve to near historic lows (i.e., U.S. 10-Year Treasury yield marked a 200+ year all time low in June 2016), while also lowering expected returns of other assets.
The above factors and the U.S. Federal Reserve’s prolonged monetary/quantitative easing for 7+ years have reduced long-term expected returns over the past 5-7 years for institutional portfolios, however:
The U.S. Fed has begun to unwind this historic monetary stimulus; 1st increases in Fed funds in 12/2015 and 12/2016, with three rate actions expected in 2017; Policy errors, regulatory changes, or other technical factors could change/accelerate the pace of future.
Reduced yields across fixed income securities globally have also reduced long-term expected returns across a range of other assets, prompting evaluation of traditional and alternate policy mixes to achieve target actuarial returns (7.5% for the Plan; and even higher levels for other public funds).
Further Gallagher modeling within broad asset classes (see p. 22), versus portfolio mixes provided in December 2016, maintains expected returns with those outlined in December 2016, while lowering overall expected portfolio risk by:
1. Shifting fixed income policy targets to those with higher income yields;2. Reductions in marketable alternatives, and increases in private markets and real estate
Further increases in expected returns may be achieved through future modeling of:
1. Added U.S. mid cap and U.S. small cap equity modeling at existing equity levels; 2. Modest increases in equities (U.S. / Non-U.S.) above 42% target, and increasing private markets/real estate.

ARTHUR J. GALLAGHER & CO. | BUSINESS WITHOUT BARRIERS™
Gallagher Team Value Add & Services Proposal
© 2017 GALLAGHER FIDUCIARY ADVISORS, LLC 25

ARTHUR J. GALLAGHER & CO. | BUSINESS WITHOUT BARRIERS™
Gallagher Team Value Add & Services Proposal
© 2017 GALLAGHER FIDUCIARY ADVISORS, LLC 26
Enhanced commitment of your Gallagher Client Team and our firm resources to the City of Annapolis Police and Fire Retirement Plan, Commission members and Fund staff
Including both traditional and non-traditional investment capabilities
Access to other investment decision-making services as needed, upon client request
Current Gallagher COA Team has over 40 years of combined ongoing retainer and project investment consulting experience, and other professional experience, benefiting you and the Plan
We ask your consideration and approval of 1-year grace period to allow us to:
Continue with and assist in your current initiatives and related implementation;
Evaluate and propose new possible initiatives in seeking to reduce risk, as well as improve risk-adjusted and relative returns vs. the policy index and long-term actuarial return by identifying, evaluating and possibly recommending:
Other possible expense reduction or income enhancement initiatives, as possible, across the investment platform
New prospective income producing investment strategies (following Crescent Mezz VII and Oaktree REDF II strategies) with total return targets in excess of public market strategies;
Replacements for current investment managers, as needed, if underperforming stated long-term benchmarks and/or may no longer may fit the Plan’s evolving needs, as well as other client requested initiatives/actions.
With approval of a 1-year grace period, we’d also offer a 10% good faith reduction in our annual fee for 1-year, effective March 31, 2017, with a reversion to our current fee as of March 31, 2018.

ARTHUR J. GALLAGHER & CO. | BUSINESS WITHOUT BARRIERS™ARTHUR J. GALLAGHER & CO. | BUSINESS WITHOUT BARRIERS™
Investment advisory, named and independent fiduciary services are offered through Gallagher Fiduciary Advisors, LLC, an SEC Registered Investment Adviser. Gallagher Fiduciary Advisors, LLC may pay referral fees or other remuneration to employees of AJG or its affiliates or to independent contractors; such payments do not change our fee. This document contains confidential and proprietary information that belongs to Gallagher Fiduciary Advisors, LLC and is protected by copyright, trade secret and other State and Federal laws. Any copying, redistribution or retransmission of any of the contents without the written consent of Gallagher Fiduciary Advisors, LLC is expressly prohibited. Gallagher Fiduciary Advisors, LLC is a single-member, limited-liability company, with Gallagher Benefit Services, Inc. as its single member. Neither Arthur J. Gallagher & Co., Gallagher Fiduciary Advisors, LLC nor their affiliates provide accounting, legal or tax advice.
© 2017 GALLAGHER FIDUCIARY ADVISORS, LLC 27

Tab B
© 2017 GALLAGHER FIDUCIARY ADVISORS, LLC PAGE 1 ARTHUR J. GALLAGHER & CO. | AJG.COM
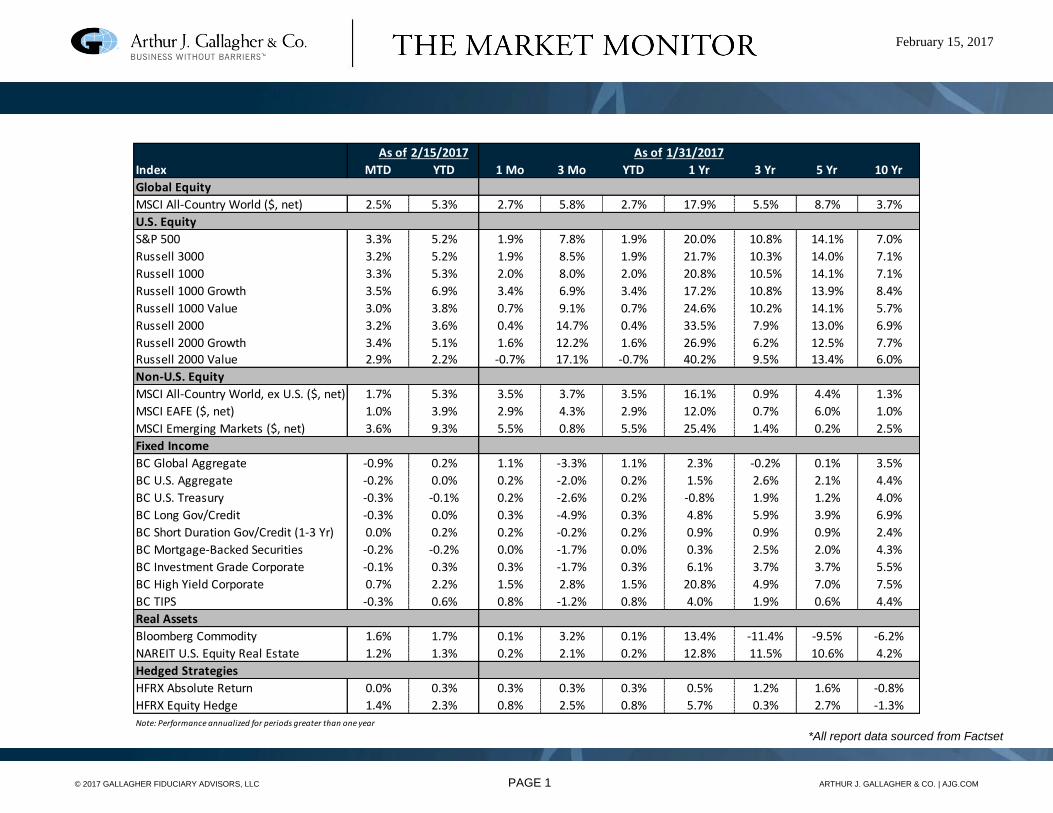
As of 2/15/2017 As of 1/31/2017
Index MTD YTD 1 Mo 3 Mo YTD 1 Yr 3 Yr 5 Yr 10 Yr
Global Equity
MSCI All-Country World ($, net) 2.5% 5.3% 2.7% 5.8% 2.7% 17.9% 5.5% 8.7% 3.7%
U.S. Equity
S&P 500 3.3% 5.2% 1.9% 7.8% 1.9% 20.0% 10.8% 14.1% 7.0%
Russell 3000 3.2% 5.2% 1.9% 8.5% 1.9% 21.7% 10.3% 14.0% 7.1%
Russell 1000 3.3% 5.3% 2.0% 8.0% 2.0% 20.8% 10.5% 14.1% 7.1%
Russell 1000 Growth 3.5% 6.9% 3.4% 6.9% 3.4% 17.2% 10.8% 13.9% 8.4%
Russell 1000 Value 3.0% 3.8% 0.7% 9.1% 0.7% 24.6% 10.2% 14.1% 5.7%
Russell 2000 3.2% 3.6% 0.4% 14.7% 0.4% 33.5% 7.9% 13.0% 6.9%
Russell 2000 Growth 3.4% 5.1% 1.6% 12.2% 1.6% 26.9% 6.2% 12.5% 7.7%Russell 2000 Value 2.9% 2.2% -0.7% 17.1% -0.7% 40.2% 9.5% 13.4% 6.0%
Non-U.S. Equity
MSCI All-Country World, ex U.S. ($, net) 1.7% 5.3% 3.5% 3.7% 3.5% 16.1% 0.9% 4.4% 1.3%
MSCI EAFE ($, net) 1.0% 3.9% 2.9% 4.3% 2.9% 12.0% 0.7% 6.0% 1.0%
MSCI Emerging Markets ($, net) 3.6% 9.3% 5.5% 0.8% 5.5% 25.4% 1.4% 0.2% 2.5%
Fixed Income
BC Global Aggregate -0.9% 0.2% 1.1% -3.3% 1.1% 2.3% -0.2% 0.1% 3.5%
BC U.S. Aggregate -0.2% 0.0% 0.2% -2.0% 0.2% 1.5% 2.6% 2.1% 4.4%
BC U.S. Treasury -0.3% -0.1% 0.2% -2.6% 0.2% -0.8% 1.9% 1.2% 4.0%
BC Long Gov/Credit -0.3% 0.0% 0.3% -4.9% 0.3% 4.8% 5.9% 3.9% 6.9%
BC Short Duration Gov/Credit (1-3 Yr) 0.0% 0.2% 0.2% -0.2% 0.2% 0.9% 0.9% 0.9% 2.4%
BC Mortgage-Backed Securities -0.2% -0.2% 0.0% -1.7% 0.0% 0.3% 2.5% 2.0% 4.3%
BC Investment Grade Corporate -0.1% 0.3% 0.3% -1.7% 0.3% 6.1% 3.7% 3.7% 5.5%
BC High Yield Corporate 0.7% 2.2% 1.5% 2.8% 1.5% 20.8% 4.9% 7.0% 7.5%
BC TIPS -0.3% 0.6% 0.8% -1.2% 0.8% 4.0% 1.9% 0.6% 4.4%
Real Assets
Bloomberg Commodity 1.6% 1.7% 0.1% 3.2% 0.1% 13.4% -11.4% -9.5% -6.2%
NAREIT U.S. Equity Real Estate 1.2% 1.3% 0.2% 2.1% 0.2% 12.8% 11.5% 10.6% 4.2%
Hedged Strategies
HFRX Absolute Return 0.0% 0.3% 0.3% 0.3% 0.3% 0.5% 1.2% 1.6% -0.8%
HFRX Equity Hedge 1.4% 2.3% 0.8% 2.5% 0.8% 5.7% 0.3% 2.7% -1.3%Note: Performance annualized for periods greater than one year
February 15, 2017
*All report data sourced from Factset

© 2017 GALLAGHER FIDUCIARY ADVISORS, LLC PAGE 2 ARTHUR J. GALLAGHER & CO. | AJG.COM
U.S. Economy
The US economy in Q4 grew +1.9% (first estimate), driven by lower net exports. An inventory build-up during the period, which added +1% to growth for the quarter, may impact overall
economic activities in coming quarters. An offsetting force would be personal consumption expenditures if strong jobs market and consumer confidence translate to more spending.
Employment report was strong with 227K addition in January, led by construction and finance sectors. Unemployment rate moved up again to 4.8%, from 4.7% in prior month but it is a
reflection of increased labor participation rate (increased to 62.9% from 62.7%) rather than a weak labor market.

© 2017 GALLAGHER FIDUCIARY ADVISORS, LLC PAGE 3 ARTHUR J. GALLAGHER & CO. | AJG.COM
Housing & the Consumer – U.S.
Home-price grew +0.9% in Nov 2016 (+0.6% for prior month) and +5.3% on an YoY. The West cities – such as Seattle (+10.4%) and Portland (+10.1%) – were the biggest contributors.
Existing home sales in Dec was at -2.8% MoM and +0.7% YoY. Sales of both single-family homes and condominiums fell.
Retail sales in Jan was +0.4% MoM but a noteworthy headline was a sharp revision of prior month from +0.6% to +1.0%. This was driven by vehicle sales (revised to +3.2% from +2.4%).
Core inflation (CPI less food and energy) was +2.3% YoY in Jan, which was an increase from +2.2% in prior month. Including food and energy, it shows even more price pressure at +2.5%.

© 2017 GALLAGHER FIDUCIARY ADVISORS, LLC PAGE 4 ARTHUR J. GALLAGHER & CO. | AJG.COM
Economic Indicators – U.S.
The index of leading indicators were up +0.5% for Dec (MoM) compared to 0.0% in Nov, reflecting the economy’s moderate pace of growth. Next report Feb 17.
Consumer confidence remains strong with 111.8 in Jan vs 113.7 in prior month (revised), which was a 15-year high. However, job outlook and income prospect components are weakening.
PPI in Jan was +0.6% MoM and +1.6% on a YoY basis. Energy prices are up +4.7% (on the back of +5.9% jump in Dec) but food was unchanged for the month.
Both ISM Non-Manufacturing (56.5 vs 56.6 prior month) and Manufacturing Indx (56.0 vs 54.7) remain solid in Jan, reflecting strong new order levels for both.

© 2017 GALLAGHER FIDUCIARY ADVISORS, LLC PAGE 5 ARTHUR J. GALLAGHER & CO. | AJG.COM
Equity Performance
US large-caps returned +3.1% so far for Feb, continuing the rally. Financials (+5.2%) and Tech (+4.3%) were strong. Utilities was the only sector having a negative month (-0.3%).
VIX rose leading up to the November election but calmed again. Current reading of 11.97 is near current cycle low (10.32, 7/3/2014).
Both earnings-per-share and net income growth rates are improving from recent lows, despite recent dip.
US election results have had an unfavorable impact on international equities but recovered toward YE 2016. Both EAFE (+1.0% MTD, in USD) and EM (+3.6%) is having a strong month.
© 2017 GALLAGHER FIDUCIARY ADVISORS, LLC PAGE 6 ARTHUR J. GALLAGHER & CO. | AJG.COM
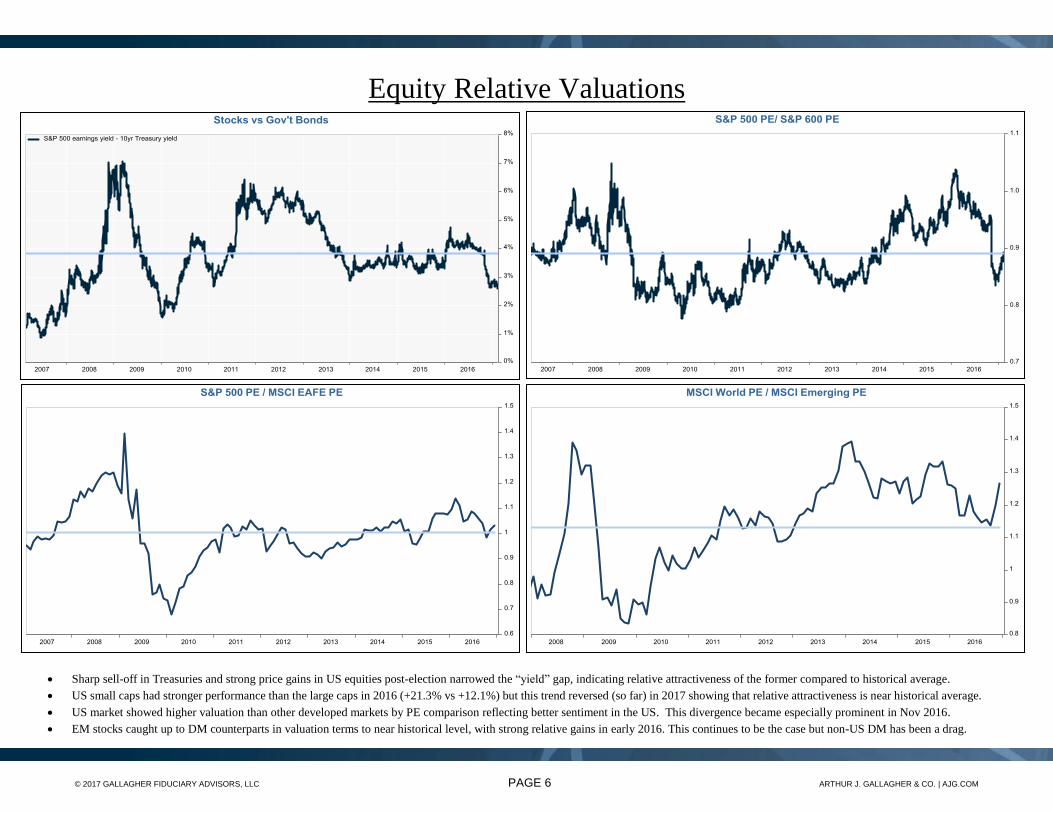
Equity Relative Valuations
Sharp sell-off in Treasuries and strong price gains in US equities post-election narrowed the “yield” gap, indicating relative attractiveness of the former compared to historical average.
US small caps had stronger performance than the large caps in 2016 (+21.3% vs +12.1%) but this trend reversed (so far) in 2017 showing that relative attractiveness is near historical average.
US market showed higher valuation than other developed markets by PE comparison reflecting better sentiment in the US. This divergence became especially prominent in Nov 2016.
EM stocks caught up to DM counterparts in valuation terms to near historical level, with strong relative gains in early 2016. This continues to be the case but non-US DM has been a drag.

© 2017 GALLAGHER FIDUCIARY ADVISORS, LLC PAGE 7 ARTHUR J. GALLAGHER & CO. | AJG.COM
Interest Rates
On Dec 2016, the US 10-year Treasury note yield touched the highest point (2.6%) in over a year, due to general uncertainty but vague expectation of expansive (and inflationary) fiscal
policies of the new administration. Yield spike has “calmed” since the initial increase, however. Yield curve (2yr-10yr differential) steadied to 125 bps after a sharp steepening post-election.
Govt bond yields resumed its climb due to higher than expected inflation levels and increased political uncertainties including Brexit negotiation.
Duration of the BB US Agg hit a record high of 5.76 in Dec 2015 and remains elevated but the YTM is at a low level, reflecting heightened rate risk.

© 2017 GALLAGHER FIDUCIARY ADVISORS, LLC PAGE 8 ARTHUR J. GALLAGHER & CO. | AJG.COM
Credit
Spreads (relative to equivalent Treasuries) for IG bonds remain subdued at ~120 bps. Credit quality spread between AA and BBB has been narrowing over the last 6 months from 100 to 80bps.
Premium demanded for the corporate high yields remain low at ~400 bps, including energy sector. Like IG, high yield spreads between BB and CCC (or below) narrowed from 950 to 580bps.
Pricing of the emerging market debt also remains near historical average but jumped by ~20 bps in a week after the surprise election results in the US. Longer-term concerns in the emerging
market includes faster rate hike in the US, potentially resulting in stronger USD, and increased uncertainty over international trade prospects.
© 2017 GALLAGHER FIDUCIARY ADVISORS, LLC PAGE 9 ARTHUR J. GALLAGHER & CO. | AJG.COM
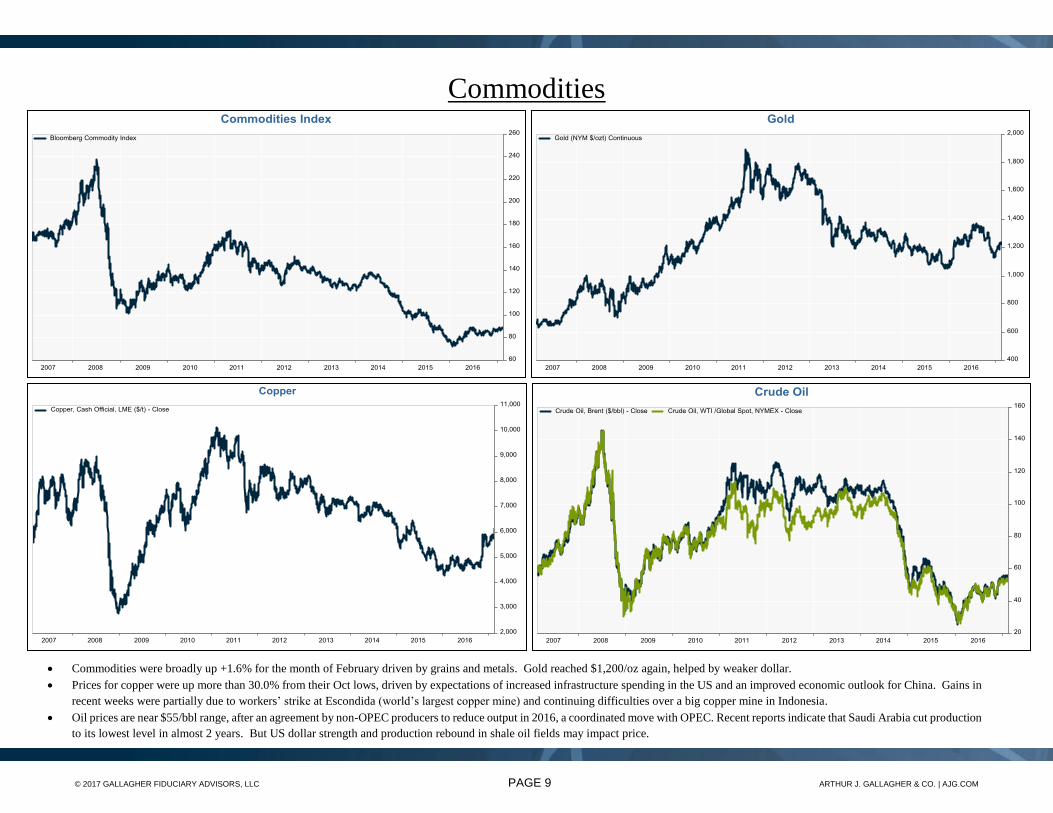
Commodities
Commodities were broadly up +1.6% for the month of February driven by grains and metals. Gold reached $1,200/oz again, helped by weaker dollar.
Prices for copper were up more than 30.0% from their Oct lows, driven by expectations of increased infrastructure spending in the US and an improved economic outlook for China. Gains in
recent weeks were partially due to workers’ strike at Escondida (world’s largest copper mine) and continuing difficulties over a big copper mine in Indonesia.
Oil prices are near $55/bbl range, after an agreement by non-OPEC producers to reduce output in 2016, a coordinated move with OPEC. Recent reports indicate that Saudi Arabia cut production
to its lowest level in almost 2 years. But US dollar strength and production rebound in shale oil fields may impact price.

© 2017 GALLAGHER FIDUCIARY ADVISORS, LLC PAGE 10 ARTHUR J. GALLAGHER & CO. | AJG.COM
Currencies
EUR-USD has been range-bound since ‘14 but recent dollar softness may have been influenced by general policy uncertainty related to the new administration and confusion over its dollar
stance. JPY, with its haven status, may have been influenced by this as well.
Sterling continues to be near a 30-year low against USD after the Brexit referendum. At issue is the timing of the EU exit and the lack of consensus on the degree of UK’s closeness to the
single Eurozone market (“hard vs “soft” Brexit). Complicating the debate is UK’s economic prospect (some expect better growth than initially thought) and inflation level.
RMB strengthened recently amid tighter capital controls. Macroeconomic factors such as slowing growth, overall debt level and potential trade conflict with the US should be monitored.

© 2017 GALLAGHER FIDUCIARY ADVISORS, LLC PAGE 11 ARTHUR J. GALLAGHER & CO. | AJG.COM
Investment advisory services and named and independent fiduciary services are offered through Gallagher Fiduciary Advisors, LLC, an SEC Registered Investment Adviser. Gallagher
Fiduciary Advisors, LLC is a single-member, limited-liability company, with Gallagher Benefit Services, Inc. as its single member. Neither Arthur J. Gallagher & Co., Gallagher Fiduciary
Advisors, LLC nor their affiliates provide accounting, legal or tax advice. The information provided cannot take into account all the various factors that may affect your particular situation,
therefore you should consult your Gallagher Fiduciary Advisors consultant before acting upon any information or recommendation contained herein to discuss the suitability of the
information/recommendation for your specific situation.