co2-based demand controlled ventilation (dcv) · controlling ventilation there is a clearly defined...
TRANSCRIPT
CO2-based Demand Controlled Ventilation (DCV)
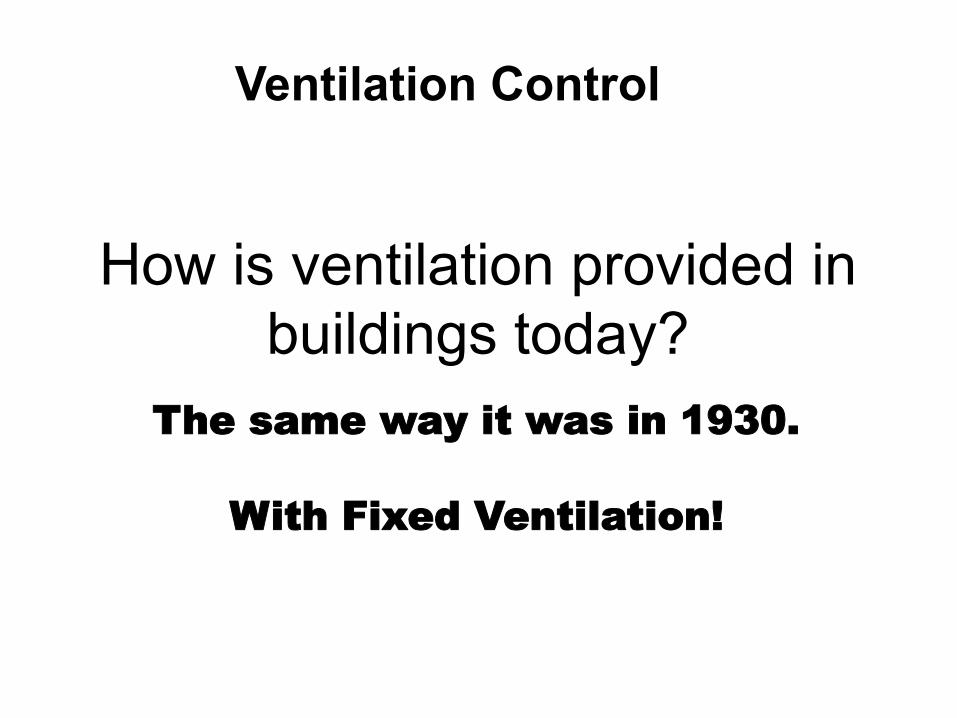
The same way it was in 1930.
With Fixed Ventilation!
How is ventilation provided in buildings today?
Ventilation Control!
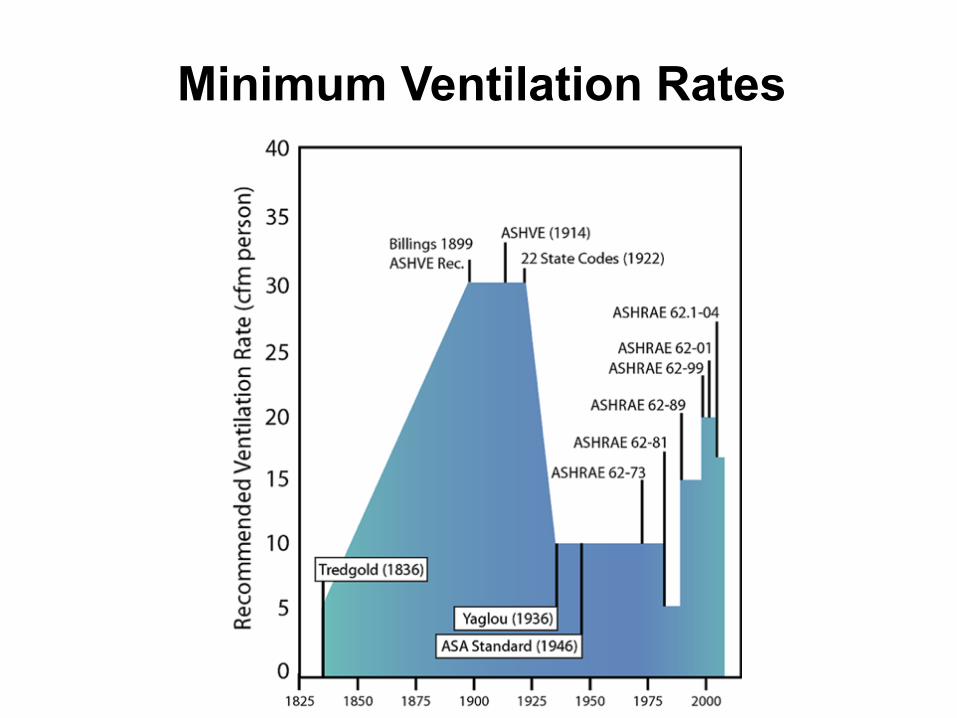
Minimum Ventilation Rates
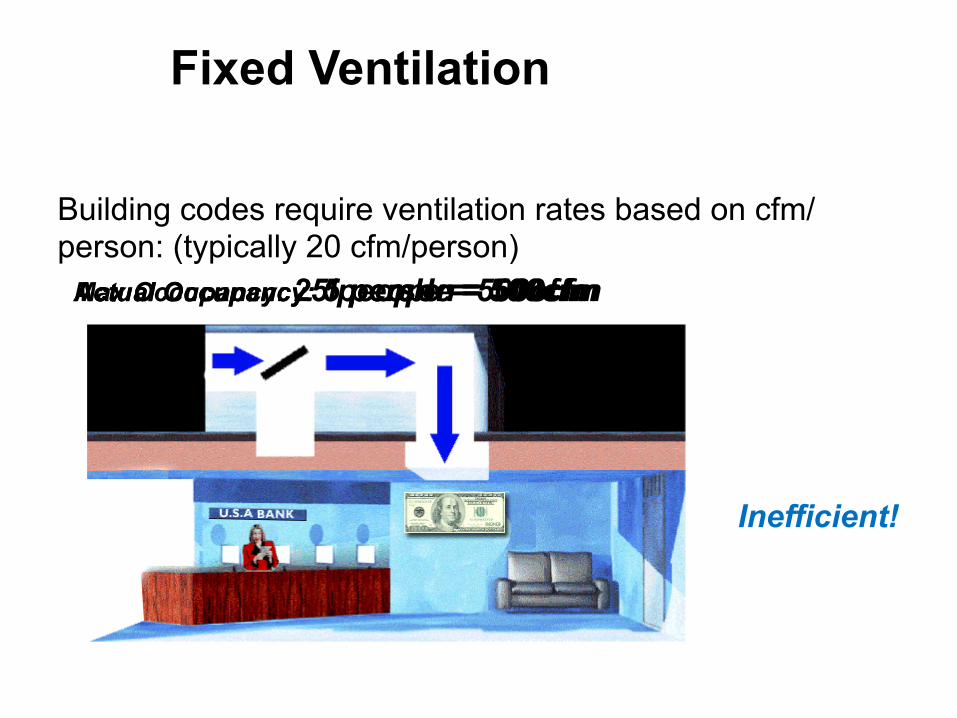
Inefficient!
Building codes require ventilation rates based on cfm/person: (typically 20 cfm/person)
Max Occupancy: 25 people = 500cfm Actual Occupancy: 5 people = 500cfm Actual Occupancy: 1 person = 500cfm
Fixed Ventilation
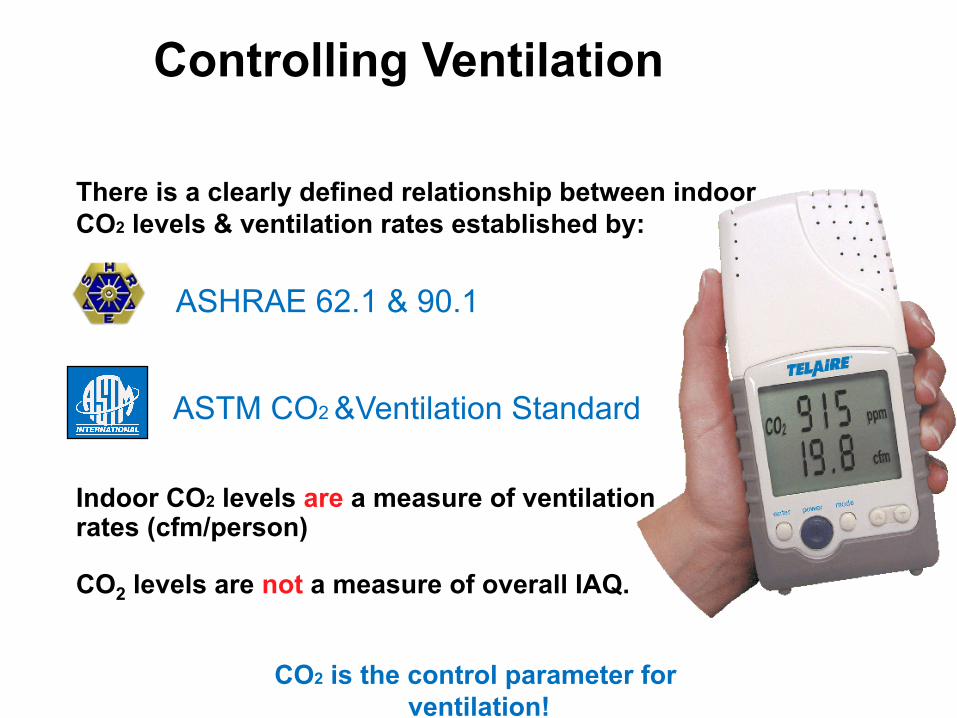
Controlling Ventilation
There is a clearly defined relationship between indoor CO2 levels & ventilation rates established by:
Indoor CO2 levels are a measure of ventilation rates (cfm/person) CO2 levels are not a measure of overall IAQ.
ASHRAE 62.1 & 90.1
ASTM CO2 &Ventilation Standard
CO2 is the control parameter for ventilation!!
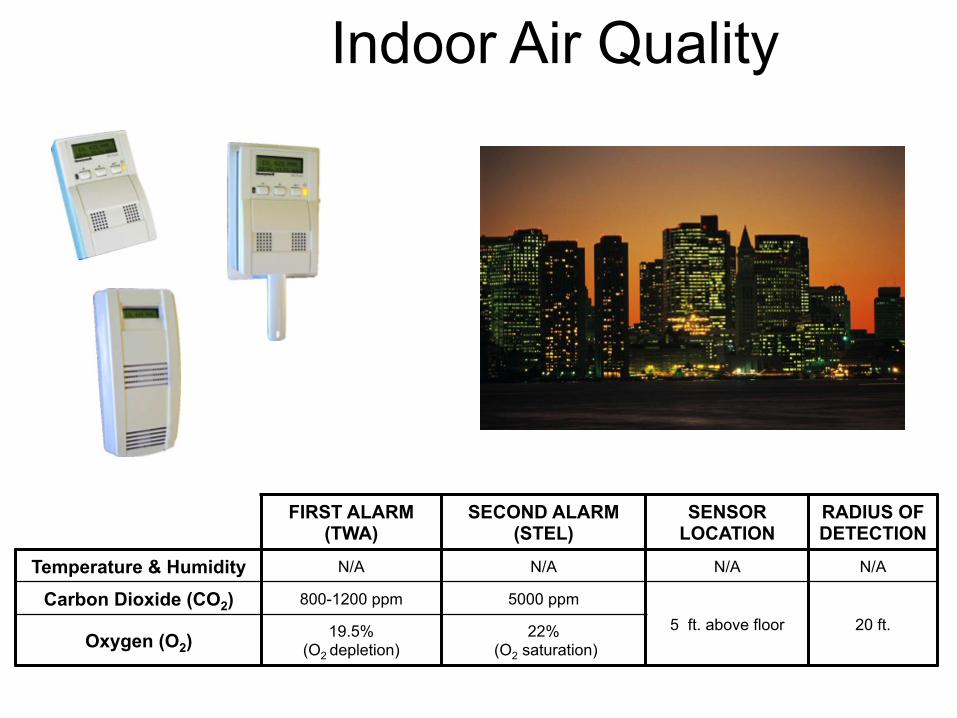
Indoor Air Quality
FIRST ALARM (TWA)
SECOND ALARM (STEL)
SENSOR LOCATION
RADIUS OF DETECTION
Temperature & Humidity N/A N/A N/A N/A
Carbon Dioxide (CO2) 800-1200 ppm 5000 ppm 5 ft. above floor 20 ft.
Oxygen (O2) 19.5%
(O2 depletion) 22%
(O2 saturation)
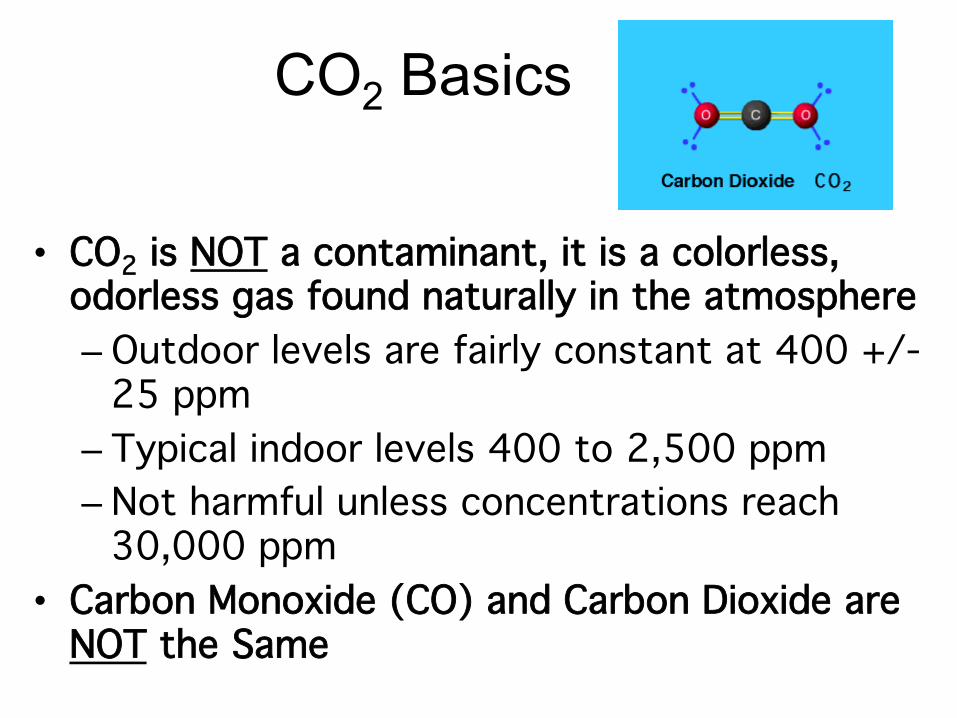
CO2 Basics
• CO2 is NOT a contaminant, it is a colorless, odorless gas found naturally in the atmosphere!– Outdoor levels are fairly constant at 400 +/-
25 ppm!– Typical indoor levels 400 to 2,500 ppm!– Not harmful unless concentrations reach
30,000 ppm !• Carbon Monoxide (CO) and Carbon Dioxide are
NOT the Same!

People exhale CO2 at concentrations of 4% (40,000 ppm)
Normal room concentrations are in the range of 400 - 1200 ppm
As a gas, CO2 diffuses and equalizes rapidly throughout a room (like humidity)
CO2 Basics
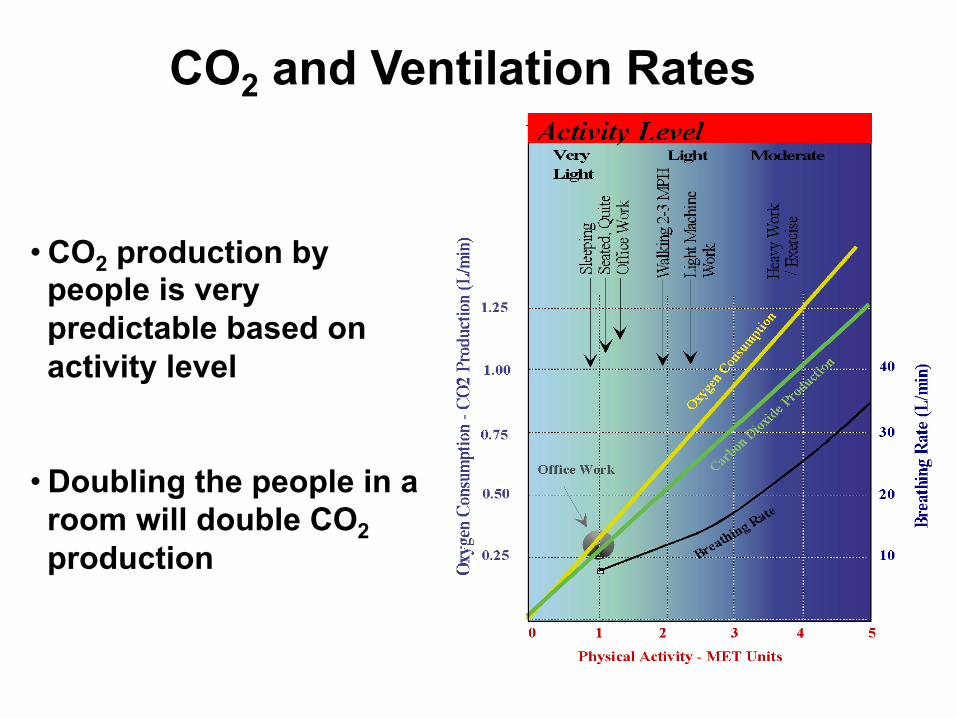
• CO2 production by people is very predictable based on activity level
• Doubling the people in a room will double CO2 production
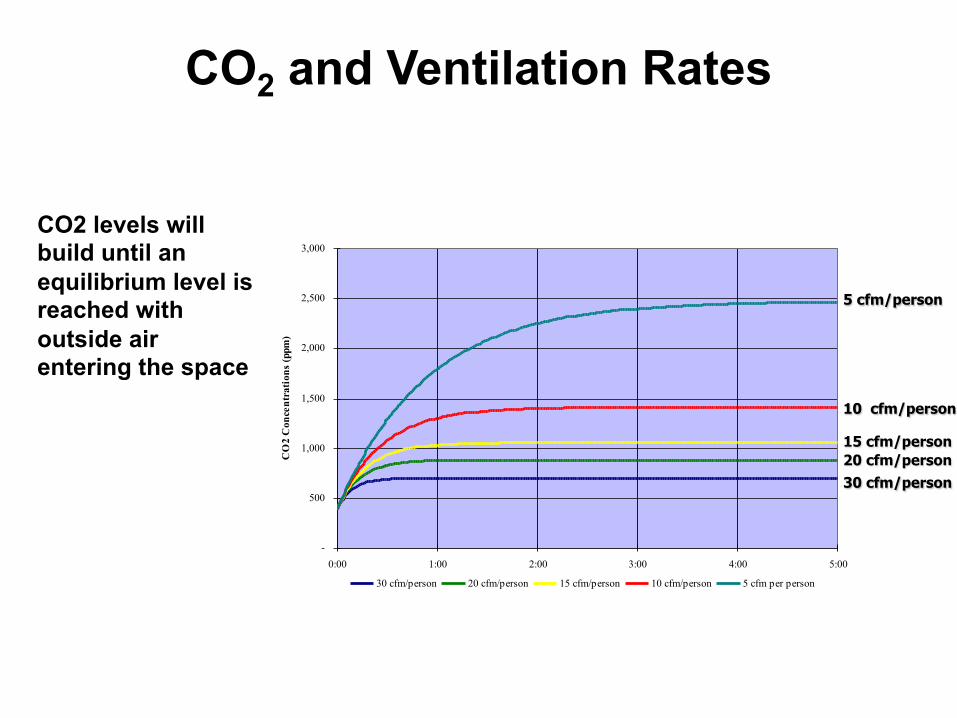
CO2 and Ventilation Rates
-
500
1,000
1,500
2,000
2,500
3,000
0:00 1:00 2:00 3:00 4:00 5:00
Time (hours)
CO
2 C
once
ntra
tion
s (p
pm)
30 cfm/person 20 cfm/person 15 cfm/person 10 cfm/person 5 cfm per person
5 cfm/person
10 cfm/person
15 cfm/person 20 cfm/person 30 cfm/person
CO2 levels will build until an equilibrium level is reached with outside air entering the space
CO2 and Ventilation Rates
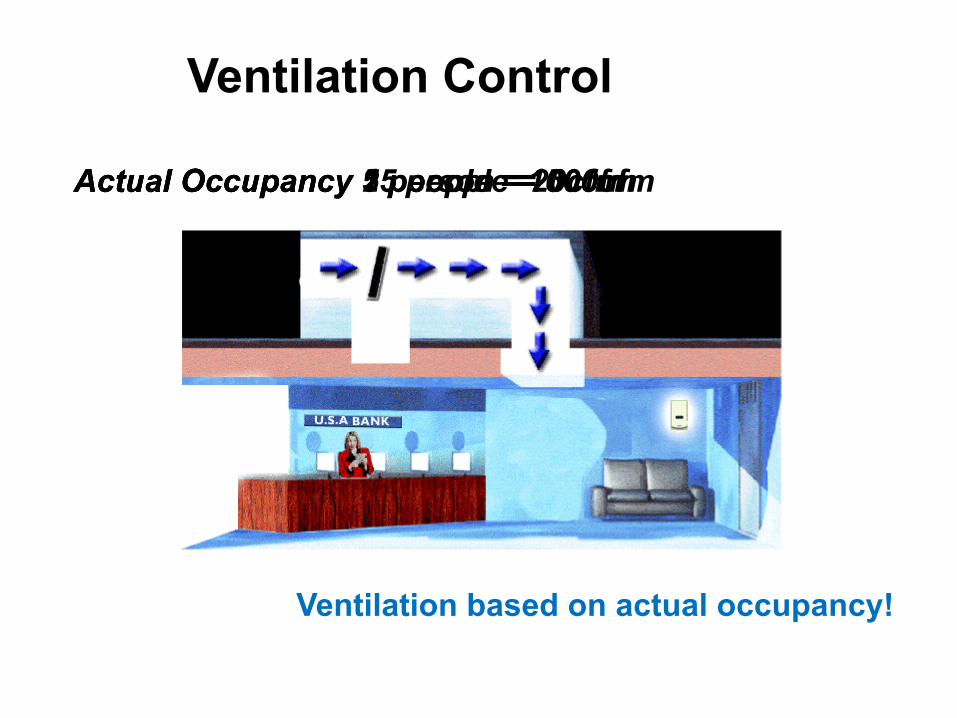
Actual Occupancy 25 people = 500cfm Actual Occupancy 5 people = 100cfm Actual Occupancy 1 person = 20cfm
Ventilation based on actual occupancy!
Ventilation Control!
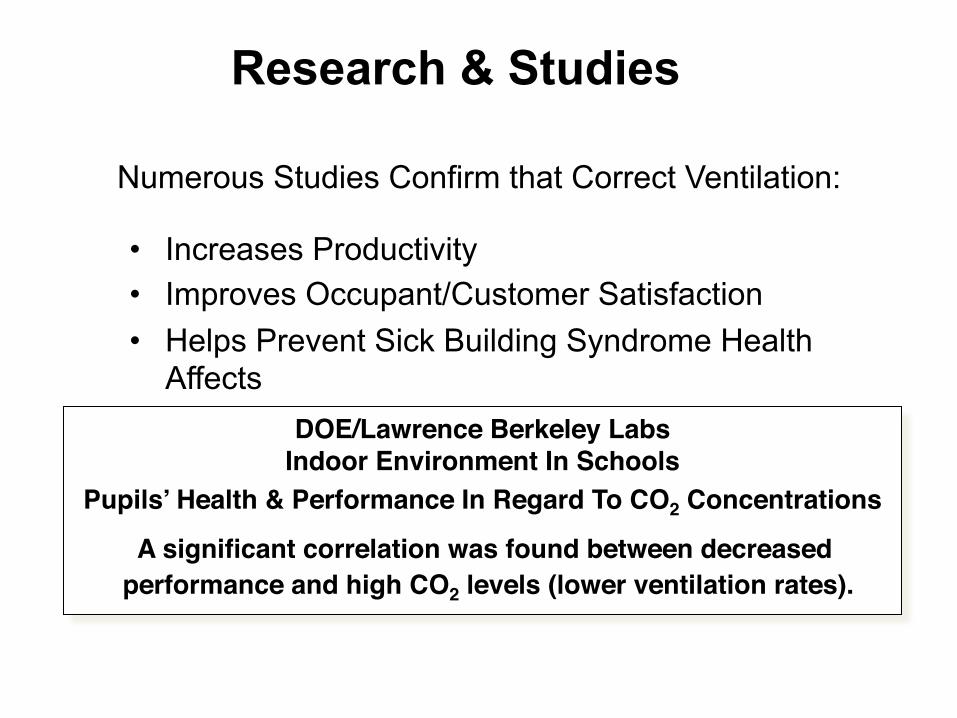
DOE/Lawrence Berkeley Labs!Indoor Environment In Schools!
Pupils’ Health & Performance In Regard To CO2 Concentrations"
A significant correlation was found between decreased performance and high CO2 levels (lower ventilation rates).!
• Increases Productivity • Improves Occupant/Customer Satisfaction • Helps Prevent Sick Building Syndrome Health
Affects
Numerous Studies Confirm that Correct Ventilation:
Research & Studies!
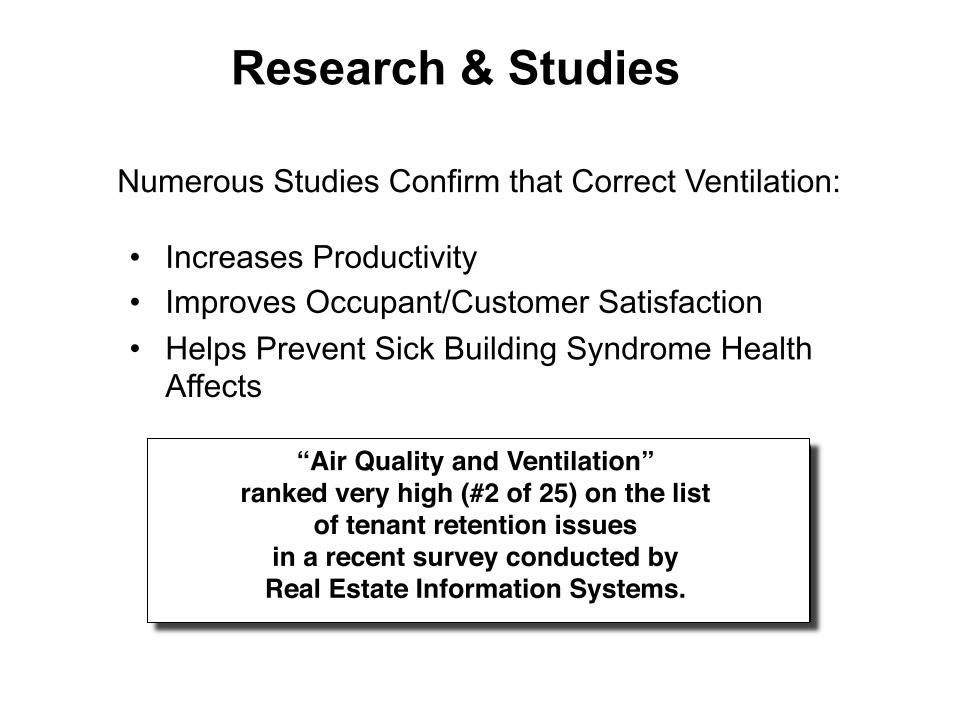
“Air Quality and Ventilation” !ranked very high (#2 of 25) on the list !
of tenant retention issues !in a recent survey conducted by !Real Estate Information Systems. !
Research & Studies
• Increases Productivity • Improves Occupant/Customer Satisfaction • Helps Prevent Sick Building Syndrome Health
Affects
Numerous Studies Confirm that Correct Ventilation:
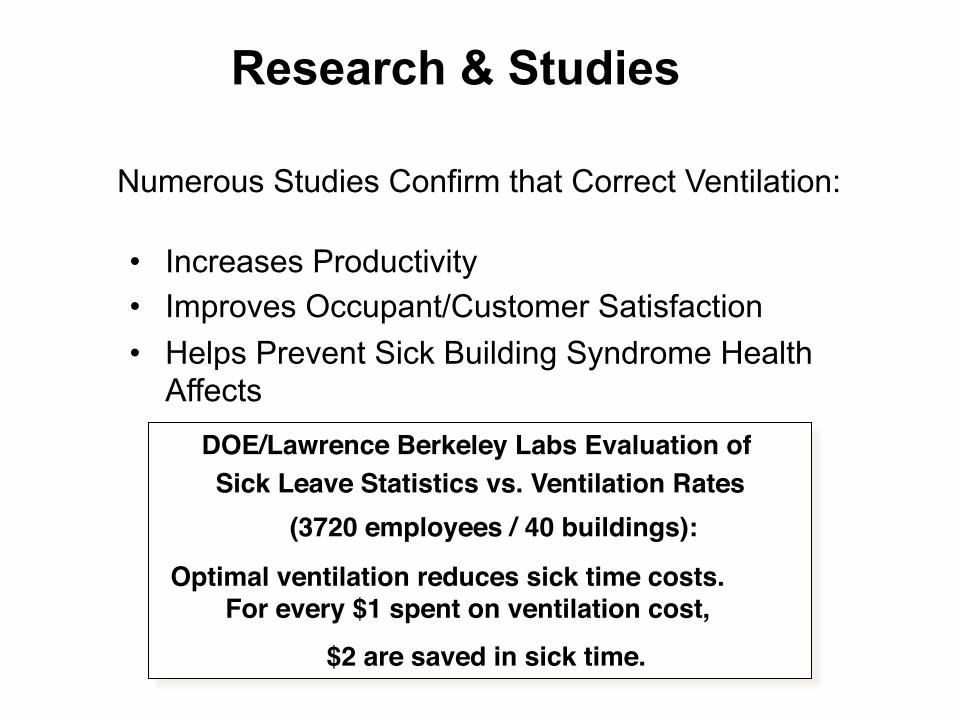
DOE/Lawrence Berkeley Labs Evaluation of !Sick Leave Statistics vs. Ventilation Rates!
(3720 employees / 40 buildings):!
Optimal ventilation reduces sick time costs. For every $1 spent on ventilation cost, !
$2 are saved in sick time.!
Research & Studies
• Increases Productivity • Improves Occupant/Customer Satisfaction • Helps Prevent Sick Building Syndrome Health
Affects
Numerous Studies Confirm that Correct Ventilation:
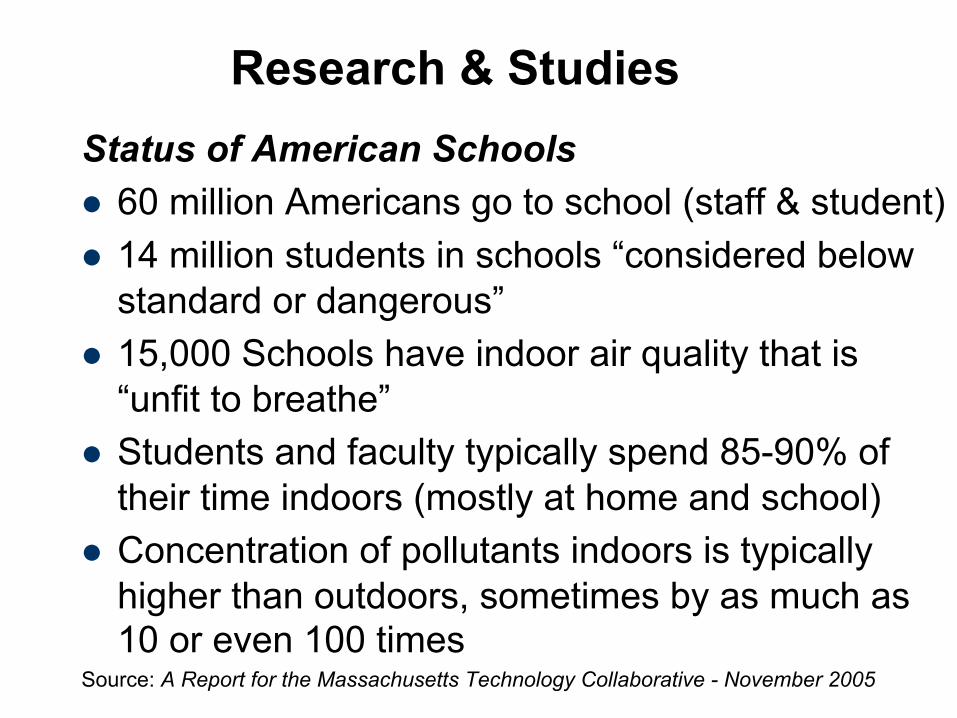
Research & Studies Status of American Schools l 60 million Americans go to school (staff & student) l 14 million students in schools “considered below
standard or dangerous” l 15,000 Schools have indoor air quality that is
“unfit to breathe” l Students and faculty typically spend 85-90% of
their time indoors (mostly at home and school) l Concentration of pollutants indoors is typically
higher than outdoors, sometimes by as much as 10 or even 100 times
Source: A Report for the Massachusetts Technology Collaborative - November 2005
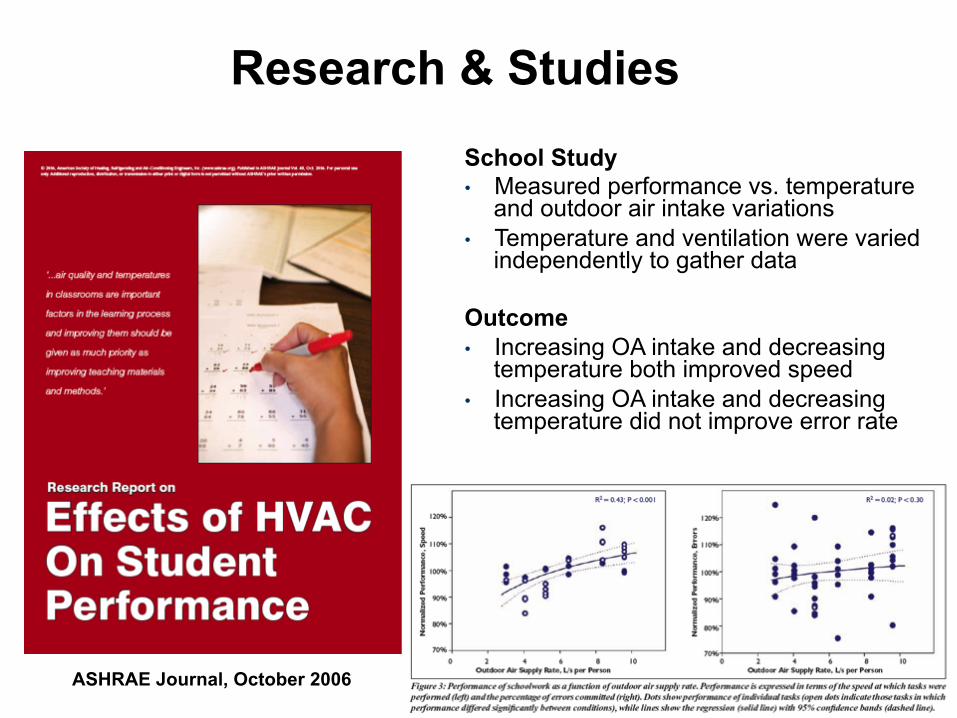
Research & Studies School Study • Measured performance vs. temperature
and outdoor air intake variations • Temperature and ventilation were varied
independently to gather data
Outcome • Increasing OA intake and decreasing
temperature both improved speed • Increasing OA intake and decreasing
temperature did not improve error rate
ASHRAE Journal, October 2006
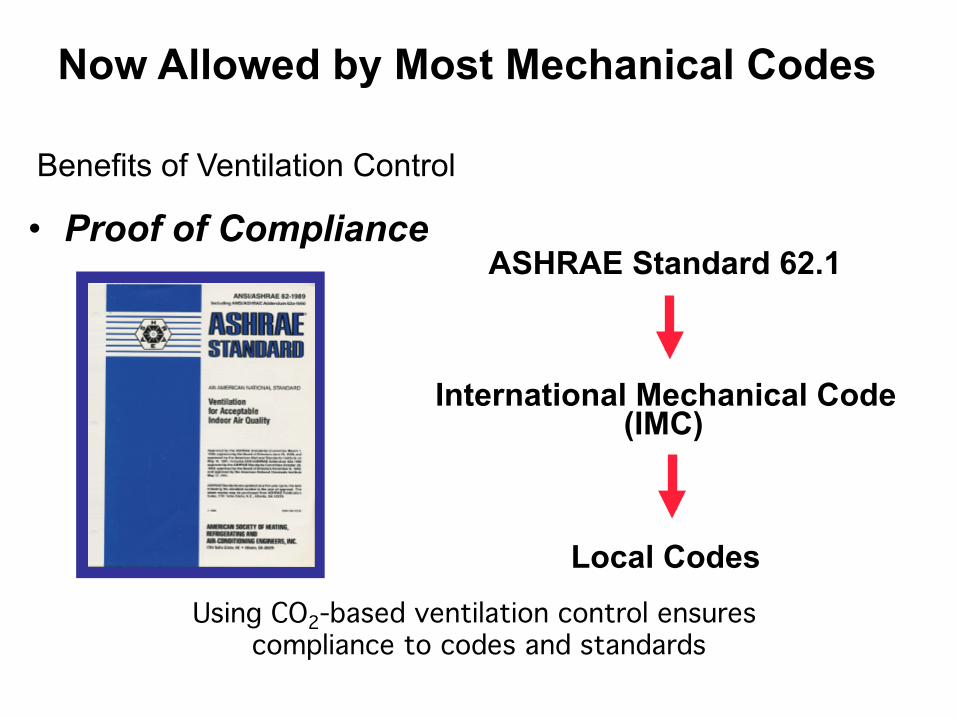
• Proof of Compliance
Using CO2-based ventilation control ensures compliance to codes and standards!
Benefits of Ventilation Control
Now Allowed by Most Mechanical Codes
International Mechanical Code (IMC)
Local Codes
ASHRAE Standard 62.1
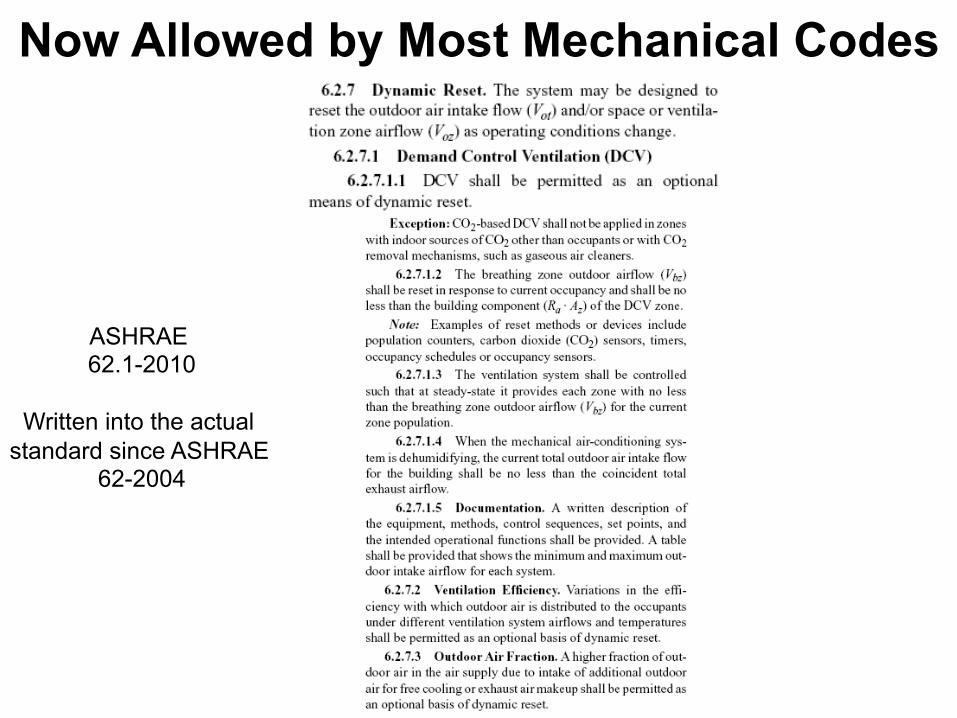
ASHRAE 62.1-2010
Written into the actual
standard since ASHRAE 62-2004
Now Allowed by Most Mechanical Codes

Commentary To The International Mechanical Code (IMC) Section 403.3.1
“The intent of this section is to allow the rate of ventilation to modulate in proportion to the number of occupants. This can result in significant energy savings. Current technology can permit the design of ventilation systems that are capable of detecting the occupant load of the space and automatically adjusting the ventilation rate accordingly.
For example, carbon dioxide (CO2) detectors can be used to sense the level of CO2 concentrations which are indicative of the number of occupants. People emit predictable quantities of CO2 for any given activity, and this knowledge can be used to estimate the occupant load in a space.”
Was written into the actual code for IMC 2006
Now Allowed by Most Mechanical Codes
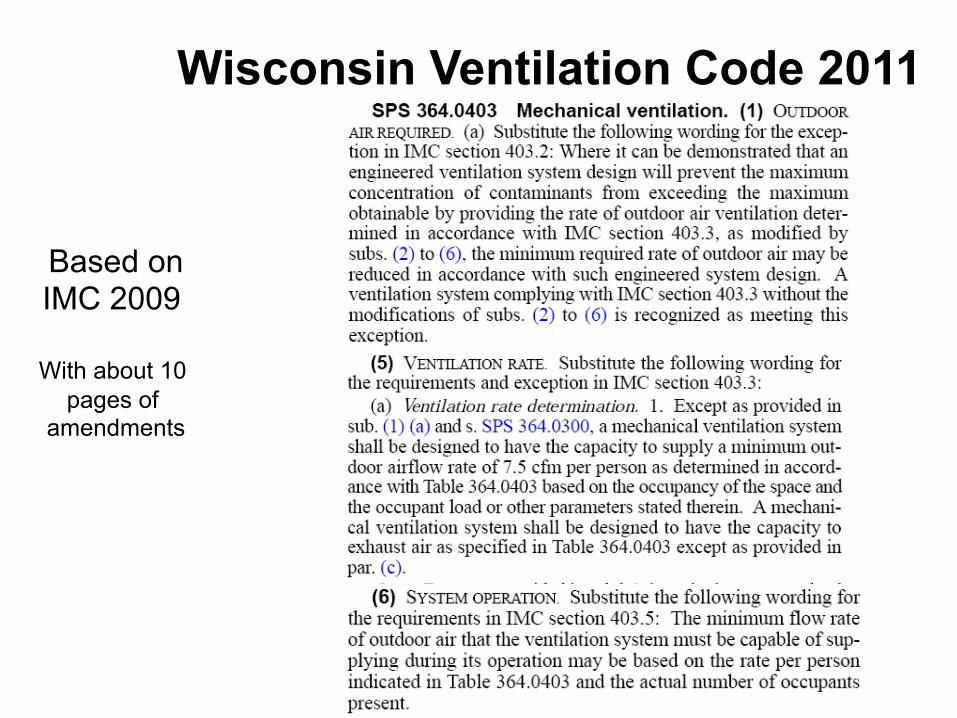
Wisconsin Ventilation Code 2011
Based on IMC 2009
With about 10
pages of amendments
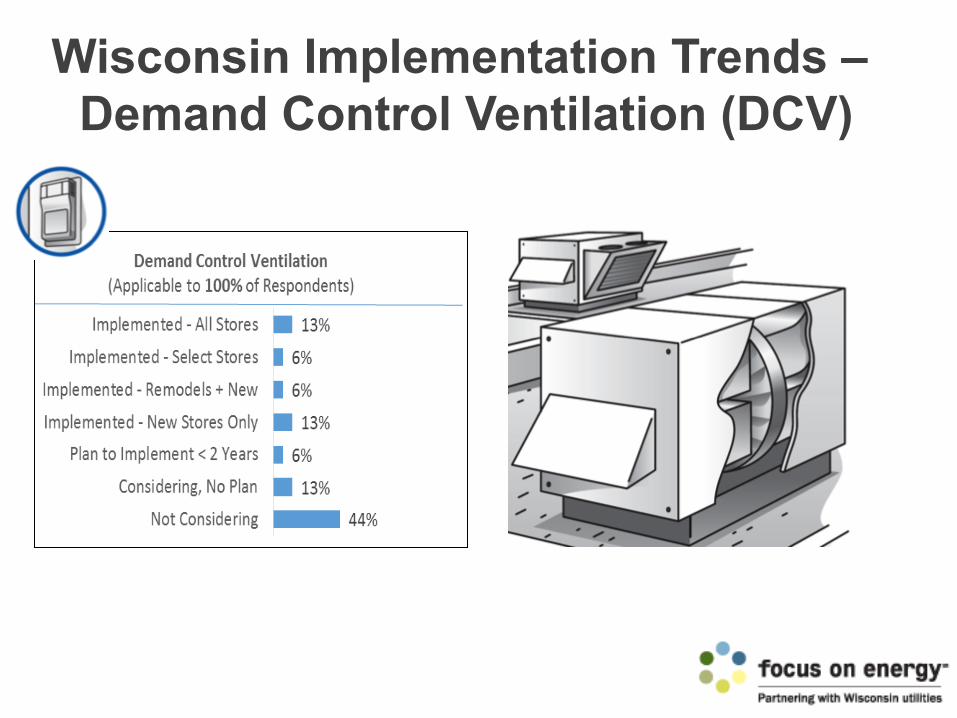
Wisconsin Implementation Trends – Demand Control Ventilation (DCV)

Chicago Ventilation Code since 2003
18-28-403.1.2 Demand ventilation. The amount of outside air delivered by a mechanical supply system may be reduced during operation below the quantities listed in able 18-28-403.3 if the system is capable of measuring and maintaining CO2 levels in occupied spaces no greater than 1000 ppm. The system capacity shall be greater than or equal to the ordinance requirements.
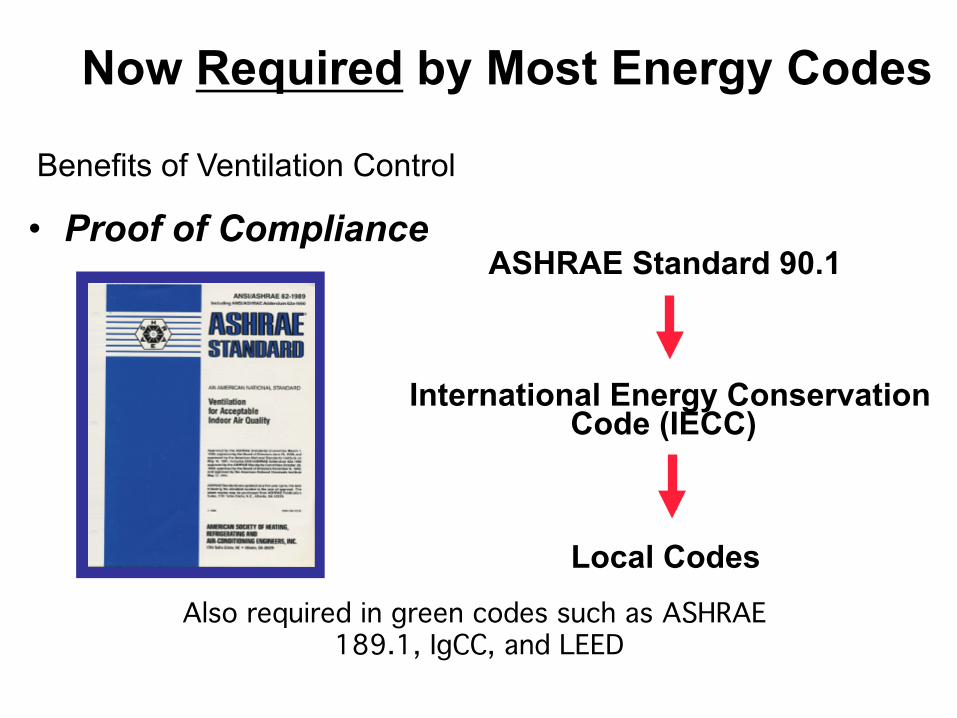
• Proof of Compliance
Also required in green codes such as ASHRAE 189.1, IgCC, and LEED!
Benefits of Ventilation Control
Now Required by Most Energy Codes
International Energy Conservation Code (IECC)
Local Codes
ASHRAE Standard 90.1
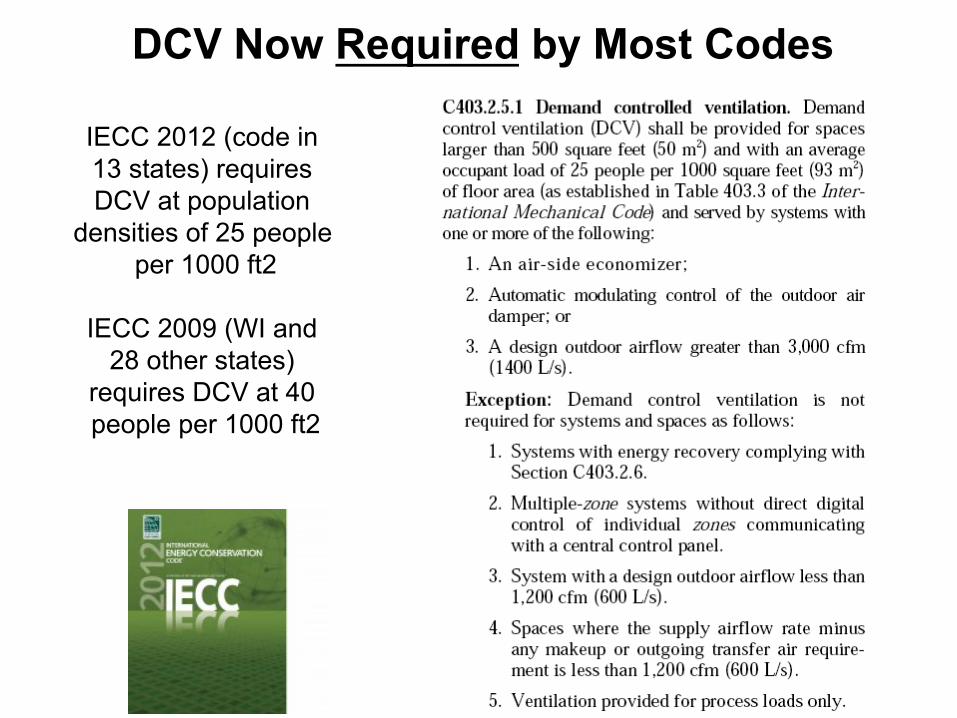
IECC 2012 (code in 13 states) requires DCV at population
densities of 25 people per 1000 ft2
IECC 2009 (WI and
28 other states) requires DCV at 40 people per 1000 ft2
DCV Now Required by Most Codes
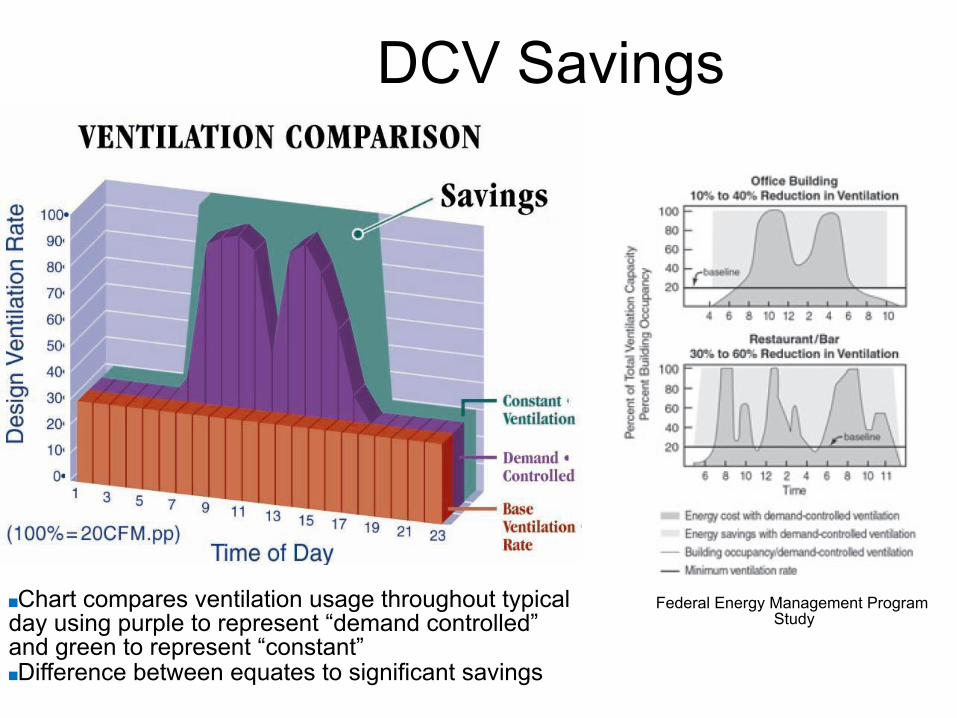
■ Chart compares ventilation usage throughout typical day using purple to represent “demand controlled” and green to represent “constant” ■ Difference between equates to significant savings
DCV Savings
Federal Energy Management Program Study

0%
10%
20%
30%
40%
50%
60%
70%
80%
90%
100%
Office Retail Restaurant School
Research Findings Demand Control Ventilation
Energy required, DCV control applied
HUGE Savings
Energy wasted - no DCV
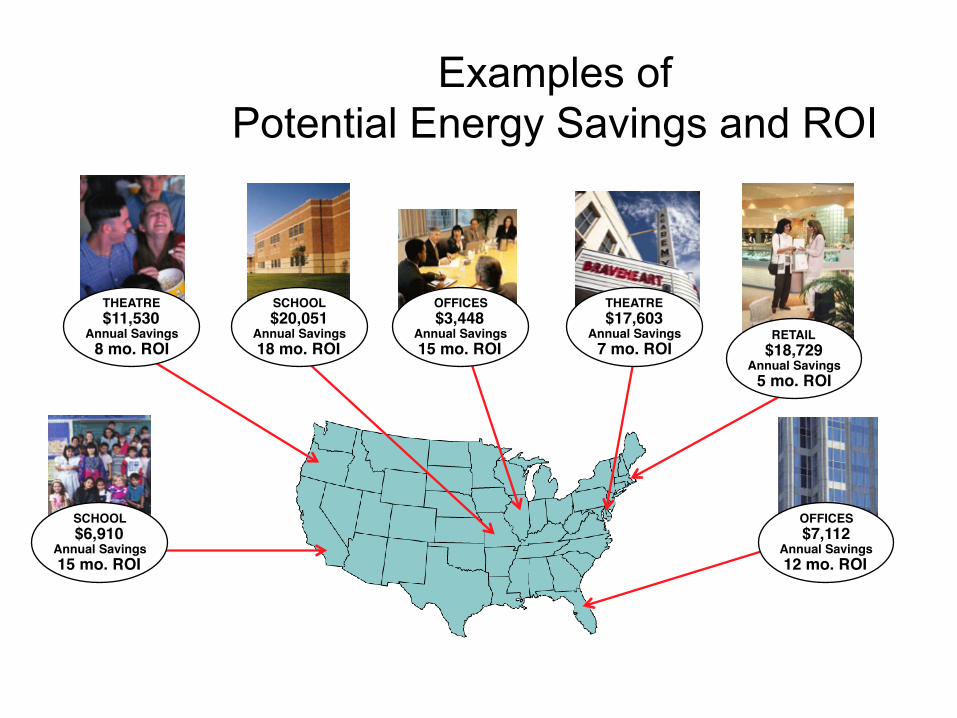
SCHOOL!$6,910!
Annual Savings!15 mo. ROI
THEATRE!$11,530!
Annual Savings!8 mo. ROI!
SCHOOL!$20,051!
Annual Savings!18 mo. ROI!
THEATRE!$17,603!
Annual Savings!7 mo. ROI!
RETAIL!$18,729!
Annual Savings!5 mo. ROI!
OFFICES!$7,112!
Annual Savings!12 mo. ROI!
OFFICES!$3,448!
Annual Savings!15 mo. ROI!
Examples of Potential Energy Savings and ROI
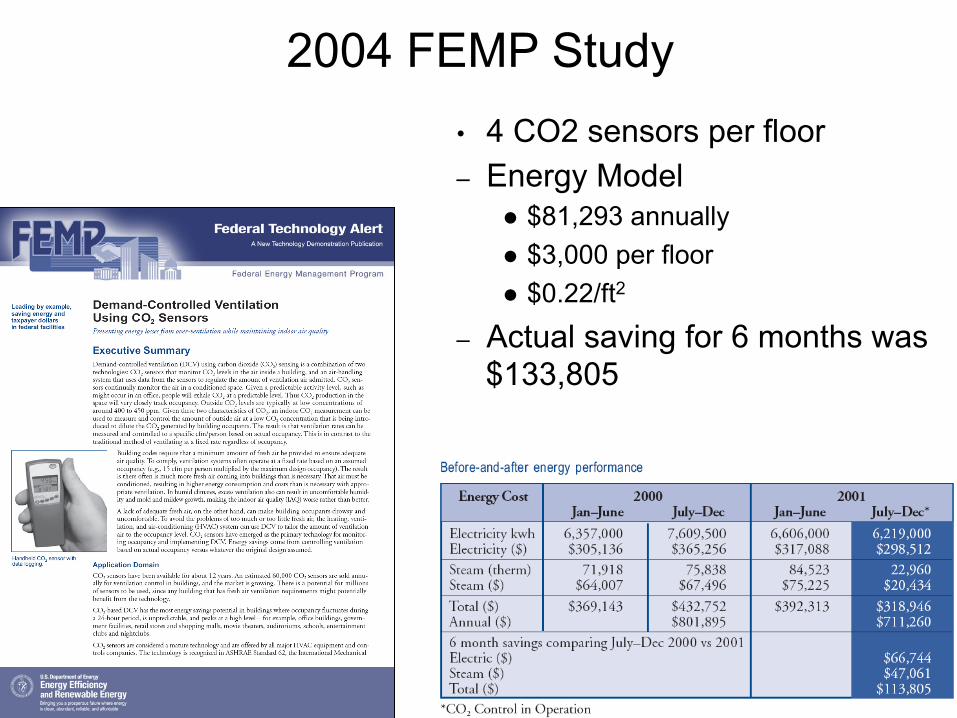
2004 FEMP Study • 4 CO2 sensors per floor – Energy Model
l $81,293 annually l $3,000 per floor l $0.22/ft2
– Actual saving for 6 months was $133,805
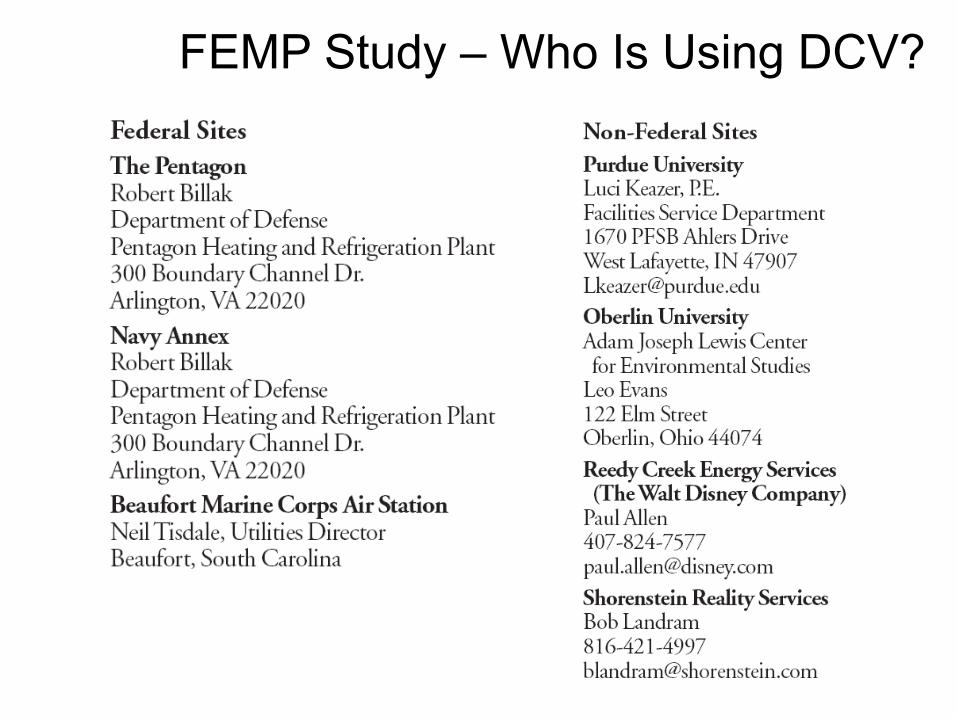
FEMP Study – Who Is Using DCV?

School, MN
Manufacturer, WI
Office, MN
University, IN
Early Adopters (1990s) - Midwest

Drivers • Comfort/Productivity • Need For Quick Response To Complaints
Results • Problem areas identified and corrected quickly (over and under ventilation).
• Teacher concerns resolved quickly.
Red Wing School District, MN
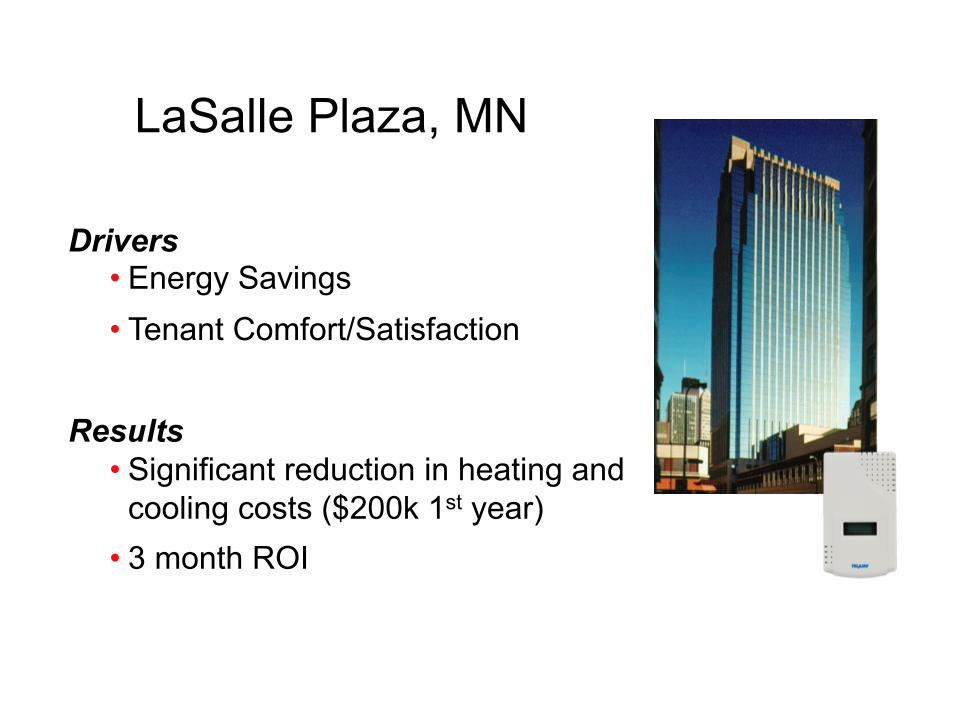
Drivers • Energy Savings • Tenant Comfort/Satisfaction
Results • Significant reduction in heating and
cooling costs ($200k 1st year) • 3 month ROI
LaSalle Plaza, MN
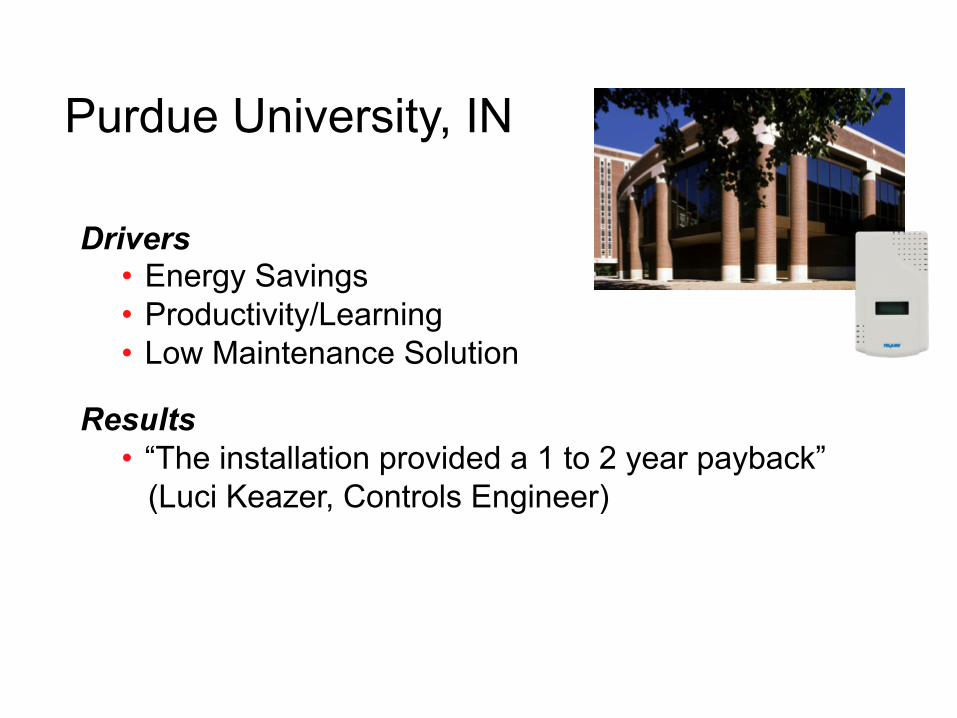
Drivers • Energy Savings • Productivity/Learning • Low Maintenance Solution
Results
• “The installation provided a 1 to 2 year payback” (Luci Keazer, Controls Engineer)
Purdue University, IN

Drivers • Productivity • Comfort • Total Quality Environment
Results • An Important part of Harley’s Quality Program for a
comfortable and productive work environment.
Harley Davidson, WI

2014 Wisconsin Case Study
Feasibility study to determine savings potential with DCV strategy: • Monitored store for a week with CO2 monitors • Compared against usage history • 20-30% gas usage reduction was estimated • Cost to implement $7,000 – floor space considered a ‘single zone’ • Payback around 8 months with incentives
• Other interesting findings

Application
Ratin
g
Application
Ratin
g
Application
Ratin
g
Correctional facilities Specialty shops Hospitals and medical facilitiesCells A Barber and beauty B Patient rooms B
Dining halls (Note 2) B Reducing salons B Medical procedure CGuard stations C Florists B Operating rooms C
Dry cleaners and laundries Clothiers B Recovery and ICU BCommercial laundry B Furniture B Autopsy rooms CCommercial dry-cleaner C Hardw are B Physical therapy AStorage and pickup B Supermarkets B Lobbies and w aiting areas ACoin-operated laundries A Pet shops C Hotels, resorts and
dormitoriesCoin-operated dry cleaners
C Sports and amusement Bedrooms BEducation and schools Spectator areas A Lobbies A
Classrooms A Industrial facilities Conference rooms ALaboratories (Note 4) B Heavy manufacturing C Meeting rooms ATraining shops B Light manufacturing B Ballrooms and assembly
areasA
Music rooms A Materials storage C Gambling casino BLibraries A Training facilities C Game rooms ALocker rooms C Painting and finishing
areasC Ice arenas A
Auditoriums A Food and meat processing C Sw imming pools CSmoking lounges (Note 3) B Office buildings A Gymnasiums A
Food and beverage service Retail stores Ballrooms and discos ADining rooms (Note 2) B Sales f loors A Bow ling alleys ACafeterias (Note 2) B Dressing rooms A Theaters ABars, cocktail lounges (Note 3)
B Malls and arcades A TransportationKitchens C Shipping and receiving C Waiting rooms A
Garages, repair and service stations
C Warehouses C Platforms A
Rating Legend: A Recommended B Possible (Note 1) C Not Recommended
Determine if CO2 Control is Appropriate
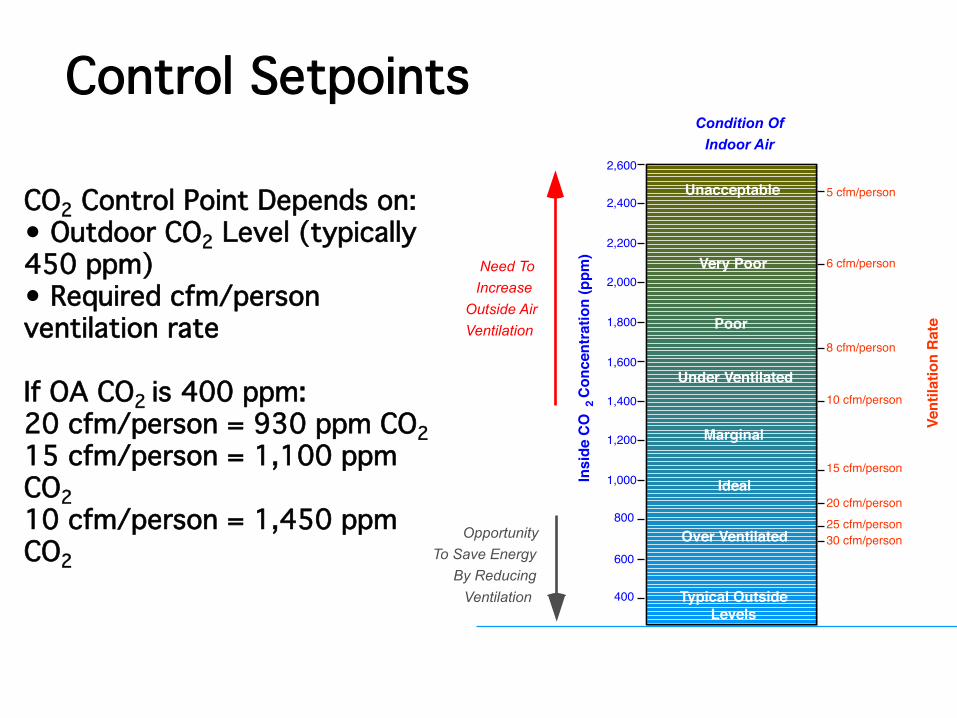
Control Setpoints!
.!
400"
600"
800"
1,000"
1,200"
1,400"
1,600"
1,800"
2,000"
2,200"
2,400"
30 cfm/person"25 cfm/person"20 cfm/person"
15 cfm/person"
10 cfm/person"
8 cfm/person"
6 cfm/person"
5 cfm/person"Unacceptable!
Very Poor!
Poor!
Under Ventilated!
Marginal!
Ideal!
Over Ventilated!
Typical Outside!Levels!
2,600"
Vent
ilatio
n R
ate!
Condition Of Indoor Air
Need To Increase
Outside Air Ventilation
Opportunity To Save Energy
By Reducing Ventilation
Insi
de C
O! 2! C
once
ntra
tion
(ppm
)!
CO2 Control Point Depends on:!• Outdoor CO2 Level (typically 450 ppm)!• Required cfm/person ventilation rate!!If OA CO2 is 400 ppm:!20 cfm/person = 930 ppm CO2!15 cfm/person = 1,100 ppm CO2!10 cfm/person = 1,450 ppm CO2!
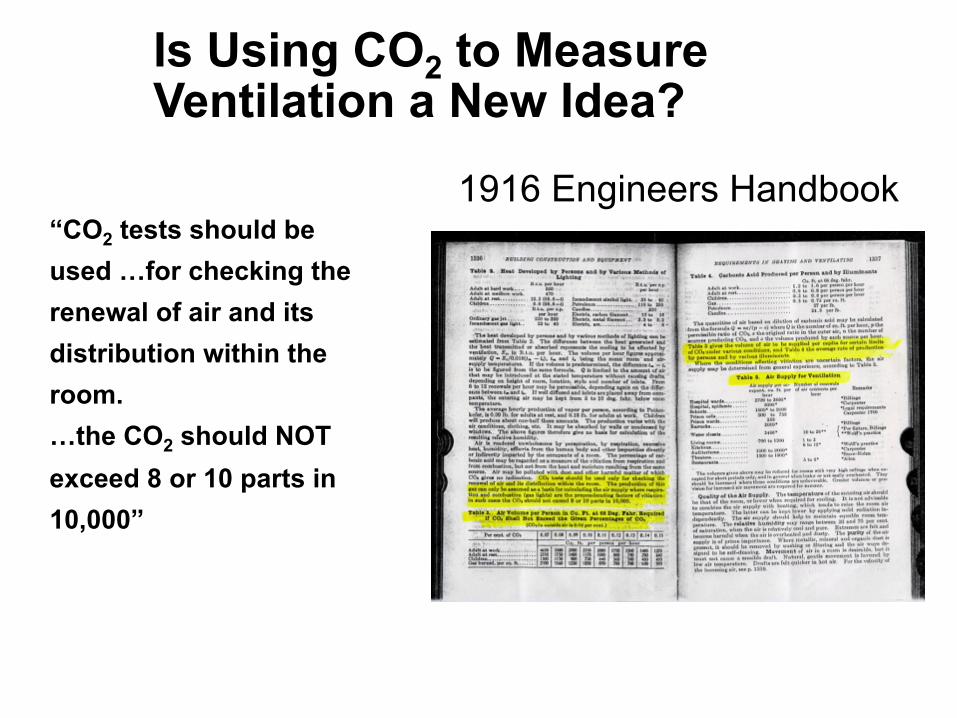
“CO2 tests should be used …for checking the renewal of air and its distribution within the room. …the CO2 should NOT exceed 8 or 10 parts in 10,000”
1916 Engineers Handbook
Is Using CO2 to Measure Ventilation a New Idea?
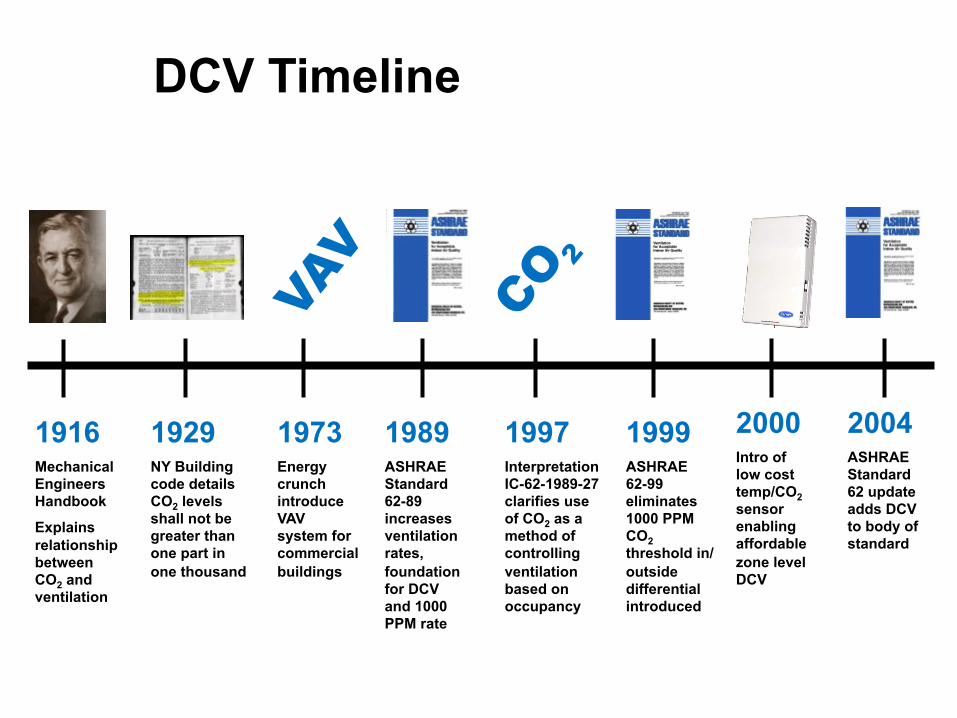
1916 Mechanical Engineers Handbook
Explains relationship between CO2 and ventilation
1929 NY Building code details CO2 levels shall not be greater than one part in one thousand
1973 Energy crunch introduce VAV system for commercial buildings
1989 ASHRAE Standard 62-89 increases ventilation rates, foundation for DCV and 1000 PPM rate
1997 Interpretation IC-62-1989-27 clarifies use of CO2 as a method of controlling ventilation based on occupancy
1999 ASHRAE 62-99 eliminates 1000 PPM CO2 threshold in/outside differential introduced
2004 ASHRAE Standard 62 update adds DCV to body of standard
2000 Intro of low cost temp/CO2 sensor enabling affordable zone level DCV
DCV Timeline
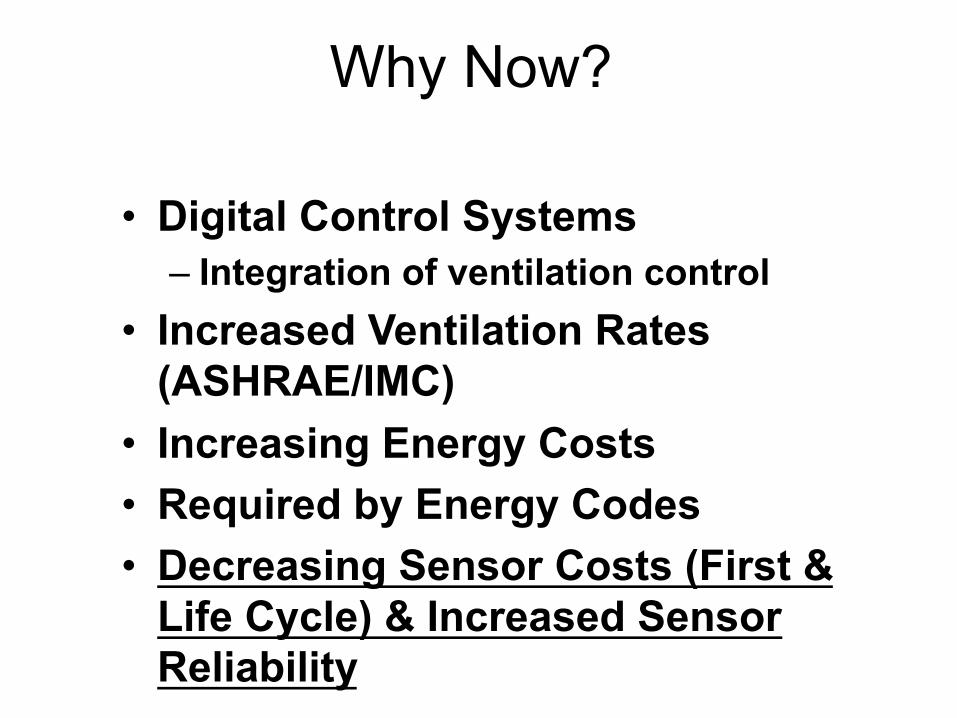
Why Now?
• Digital Control Systems – Integration of ventilation control
• Increased Ventilation Rates (ASHRAE/IMC)
• Increasing Energy Costs • Required by Energy Codes • Decreasing Sensor Costs (First &
Life Cycle) & Increased Sensor Reliability
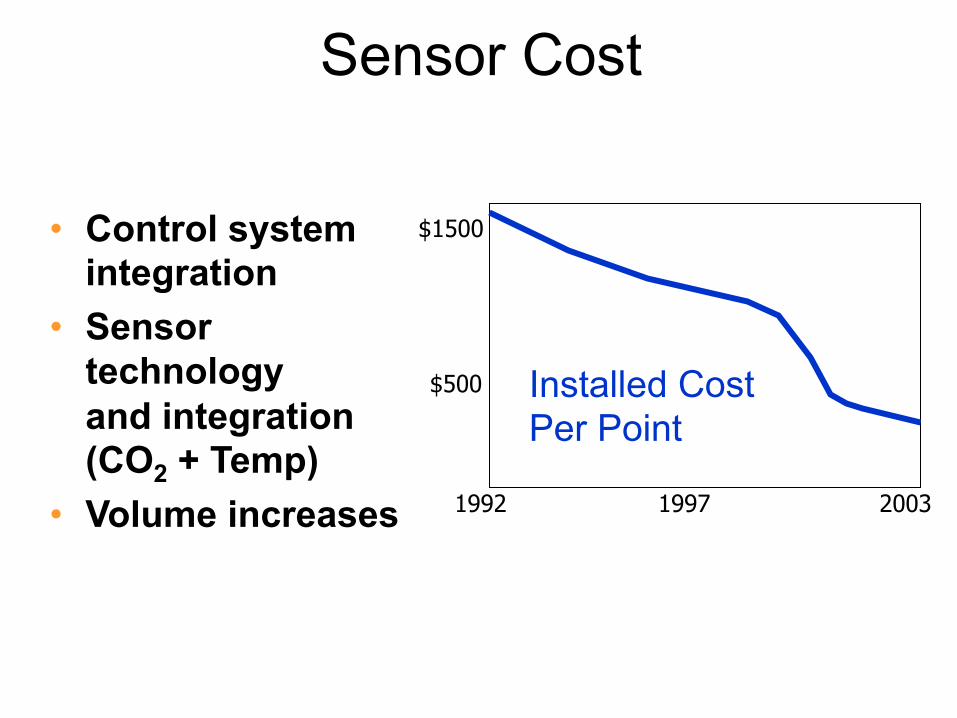
1992 1997 2003
$1500
$500 Installed Cost Per Point
• Control system integration
• Sensor technology and integration (CO2 + Temp)
• Volume increases
Sensor Cost
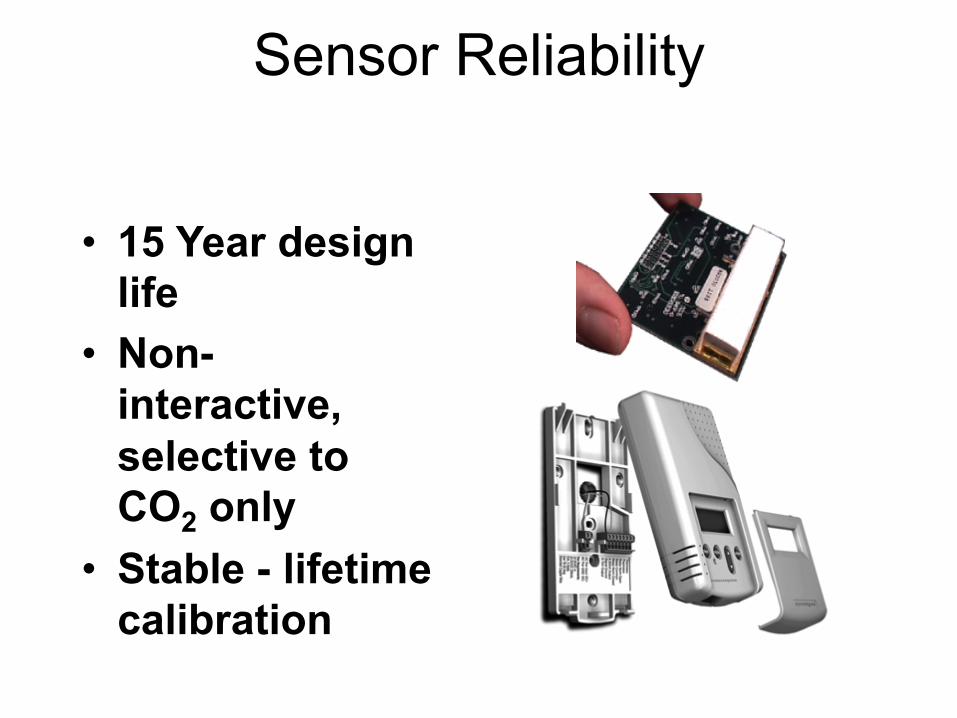
• 15 Year design life
• Non-interactive, selective to CO2 only
• Stable - lifetime calibration
Sensor Reliability
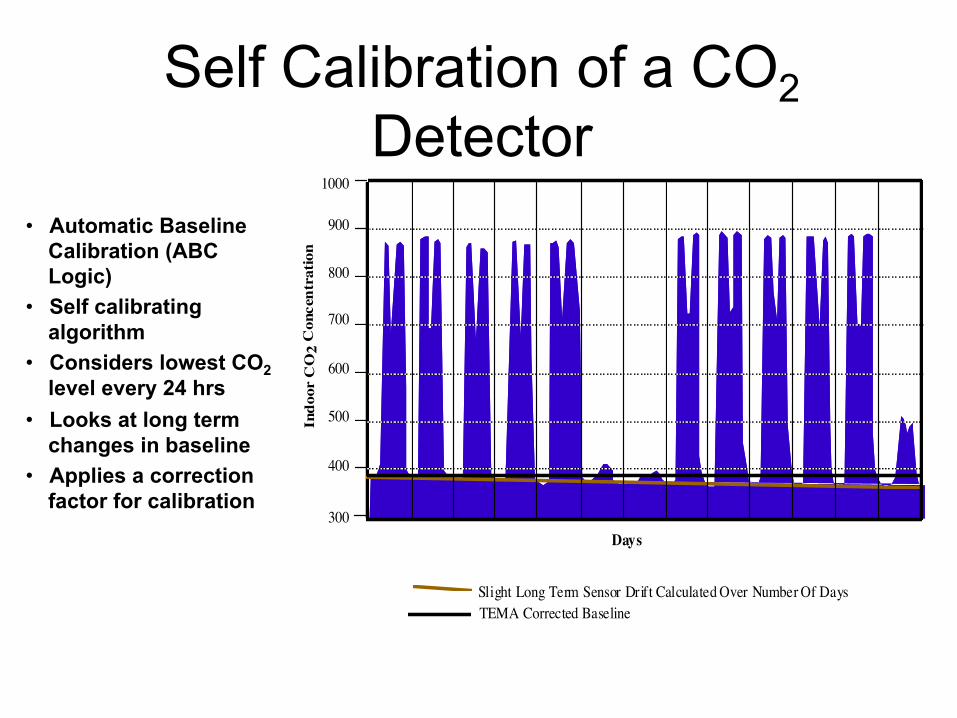
• Automatic Baseline Calibration (ABC Logic)
• Self calibrating algorithm
• Considers lowest CO2 level every 24 hrs
• Looks at long term changes in baseline
• Applies a correction factor for calibration
.
Slight Long Term Sensor Drift Calculated Over Number Of DaysTEMA Corrected Baseline
1000
900
800
700
600
500
400
300Days
Indo
or C
O2
Con
cent
ratio
n
Self Calibration of a CO2 Detector

0
100
200
300
400
500
600
700
800
2000/12/2914:58'08
2000/12/3007:38'08
2000/12/3100:18'08
2000/12/3116:58'08
2001/01/0109:38'08
2001/01/0202:18'08
2001/01/0218:58'08
2001/01/0311:38'08
2001/01/0404:18'08
PPM
Sensor 1Sensor 2Sensor 3
Self Calibration of a CO2 Detector
200
300
400
500
600
700
800
900
1000
1100
1200
1300
1400
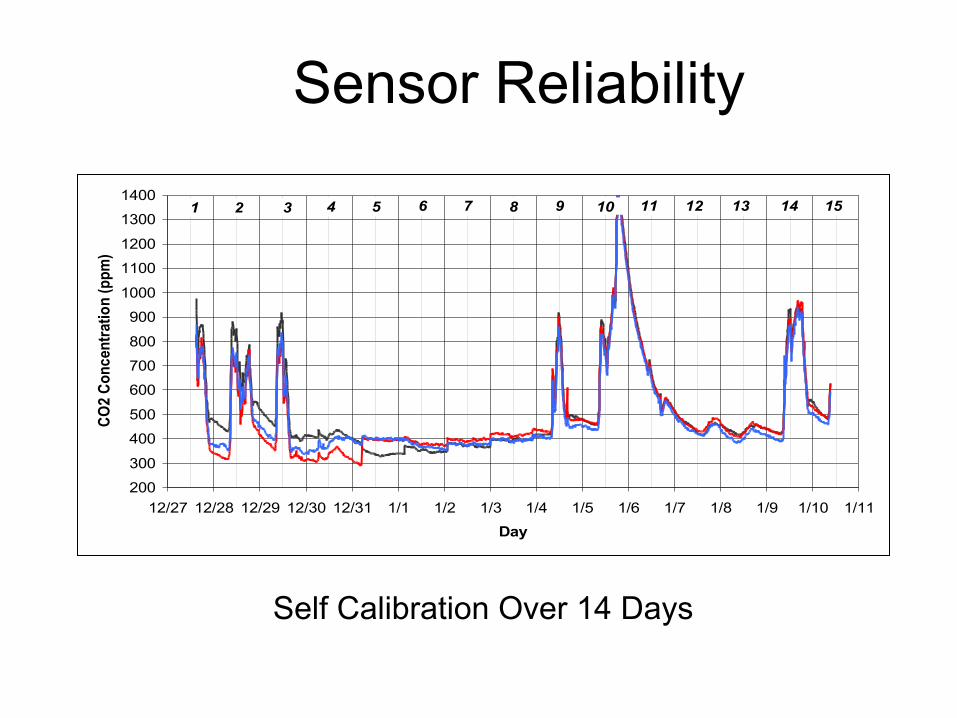
12/27 12/28 12/29 12/30 12/31 1/1 1/2 1/3 1/4 1/5 1/6 1/7 1/8 1/9 1/10 1/11
Day
CO2
Conc
entra
tion
(ppm
)
1 2 3 4 5 6 7 8 9 11 12 13 14 1510
Sensor Reliability
Self Calibration Over 14 Days
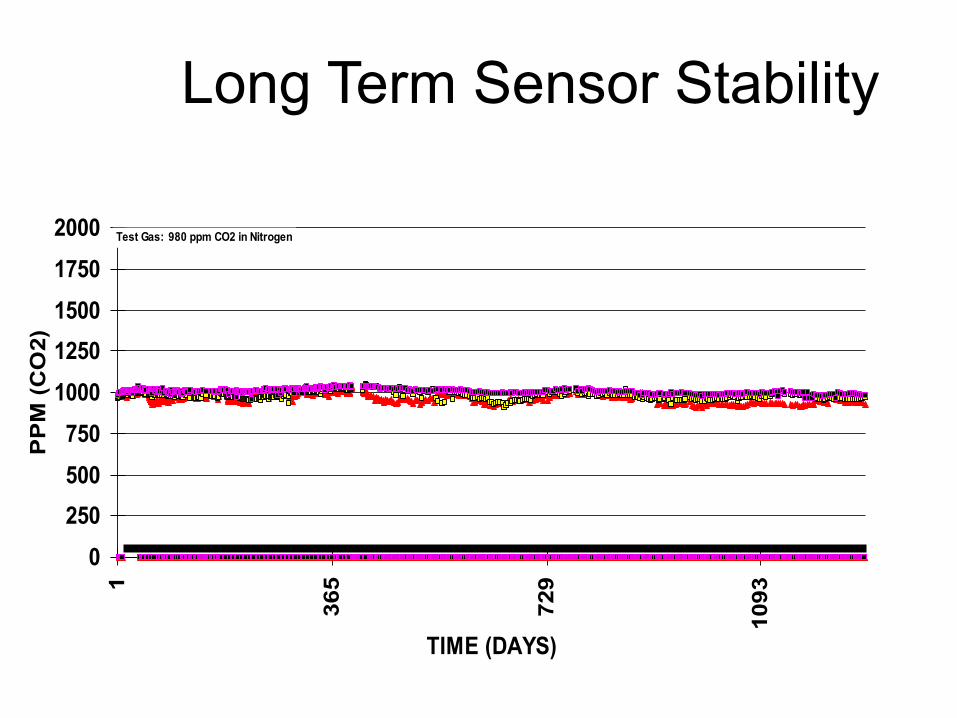
Long Term Sensor Stability
0250500750
10001250150017502000
1
365
729
1093
TIME (DAYS)
PP
M (
CO
2)
Test Gas: 980 ppm CO2 in Nitrogen

Stat, Econ, and DCV Energy Savings (Chicago retro-fit, RTU circa 2000)

Stat, Econ, and DCV Energy Savings (Milwaukee retro-fit, RTU circa 2000)
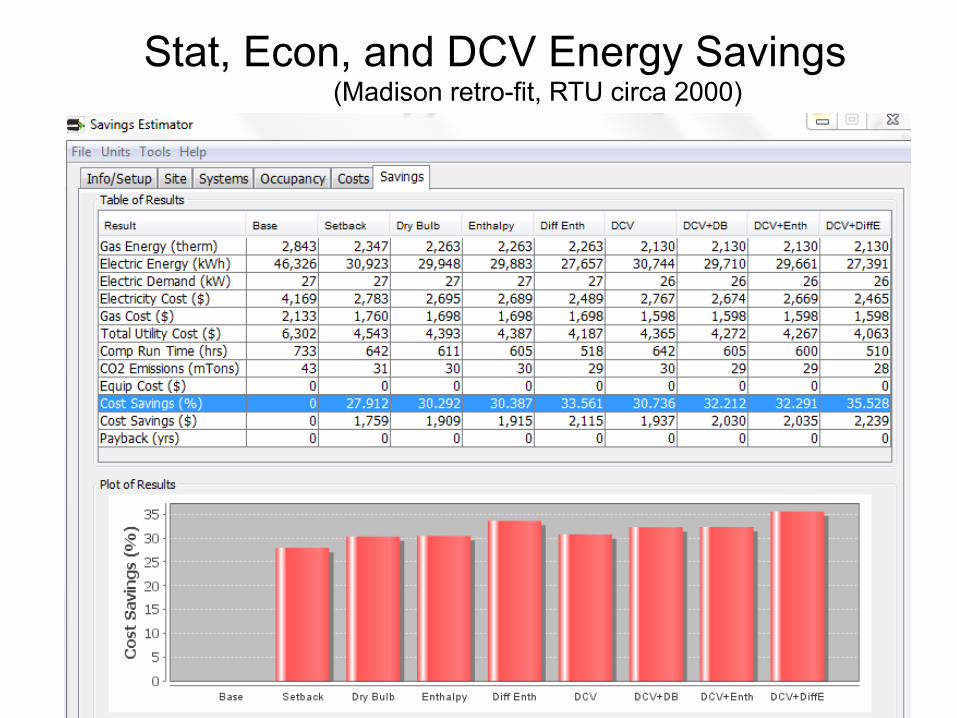
Stat, Econ, and DCV Energy Savings (Madison retro-fit, RTU circa 2000)
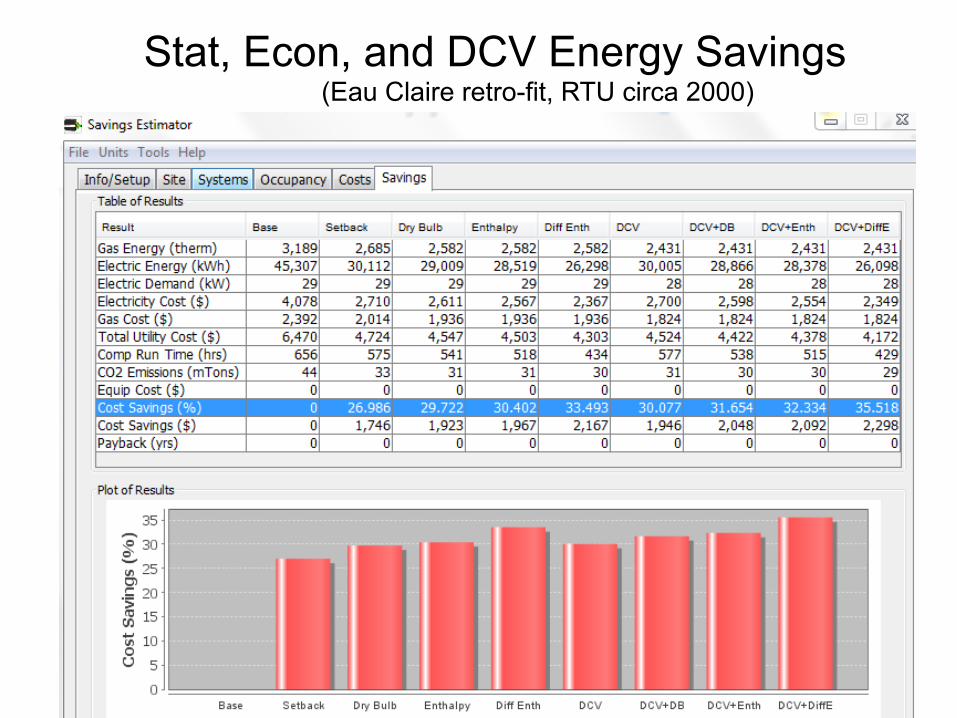
Stat, Econ, and DCV Energy Savings (Eau Claire retro-fit, RTU circa 2000)
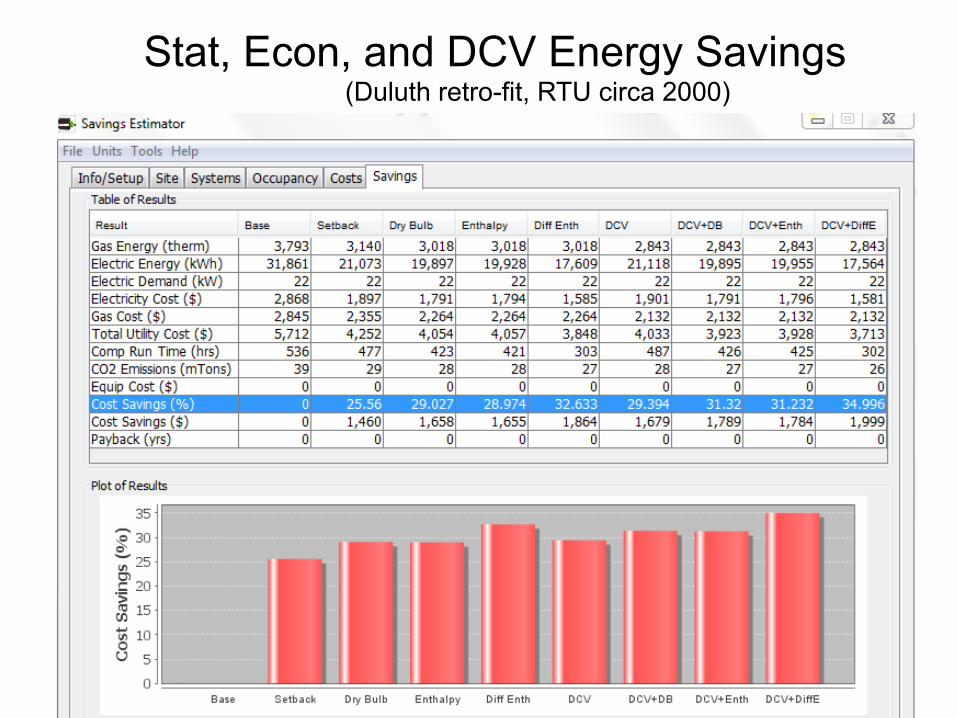
Stat, Econ, and DCV Energy Savings (Duluth retro-fit, RTU circa 2000)
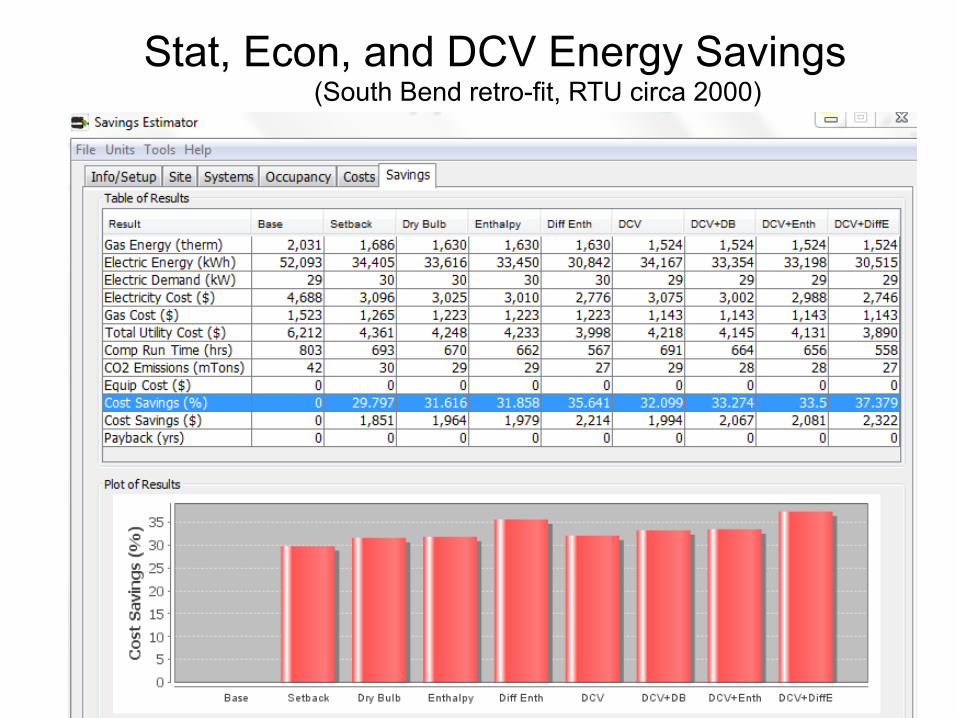
Stat, Econ, and DCV Energy Savings (South Bend retro-fit, RTU circa 2000)
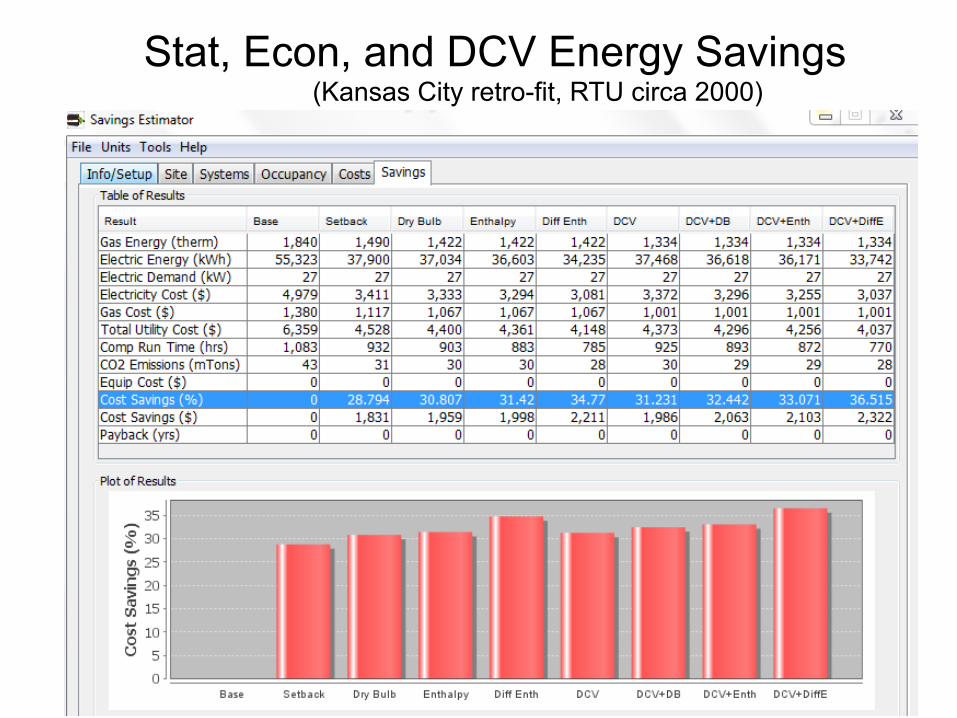
Stat, Econ, and DCV Energy Savings (Kansas City retro-fit, RTU circa 2000)
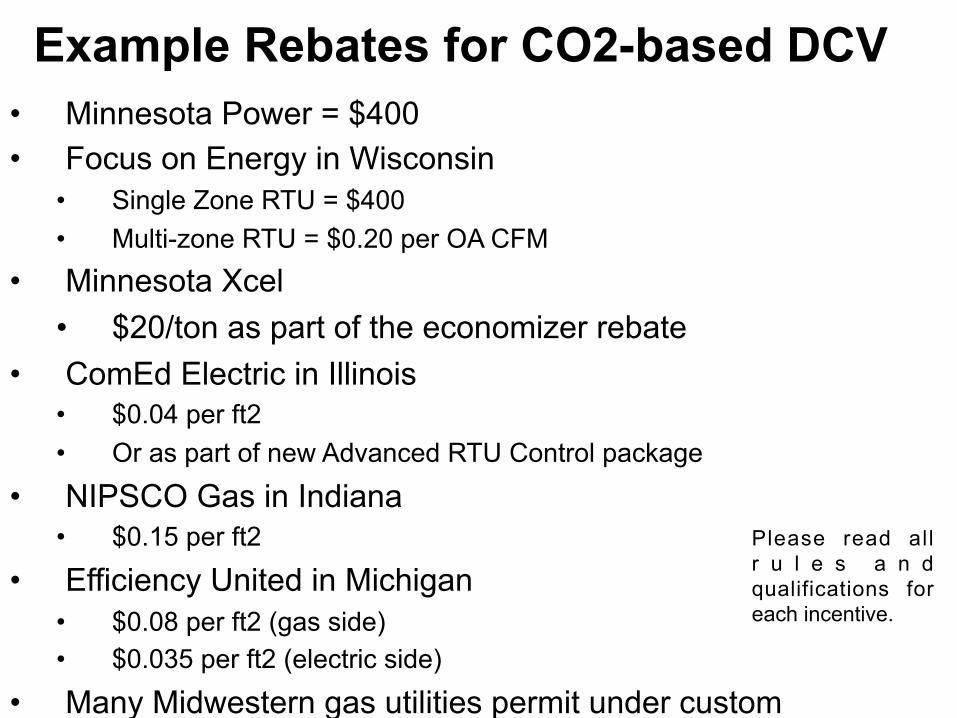
Example Rebates for CO2-based DCV
• Minnesota Power = $400 • Focus on Energy in Wisconsin
• Single Zone RTU = $400 • Multi-zone RTU = $0.20 per OA CFM
• Minnesota Xcel • $20/ton as part of the economizer rebate
• ComEd Electric in Illinois • $0.04 per ft2 • Or as part of new Advanced RTU Control package
• NIPSCO Gas in Indiana • $0.15 per ft2
• Efficiency United in Michigan • $0.08 per ft2 (gas side) • $0.035 per ft2 (electric side)
• Many Midwestern gas utilities permit under custom
Please read all r u l e s a n d qualifications for each incentive.
Energy Recovery Ventilation (ERV)
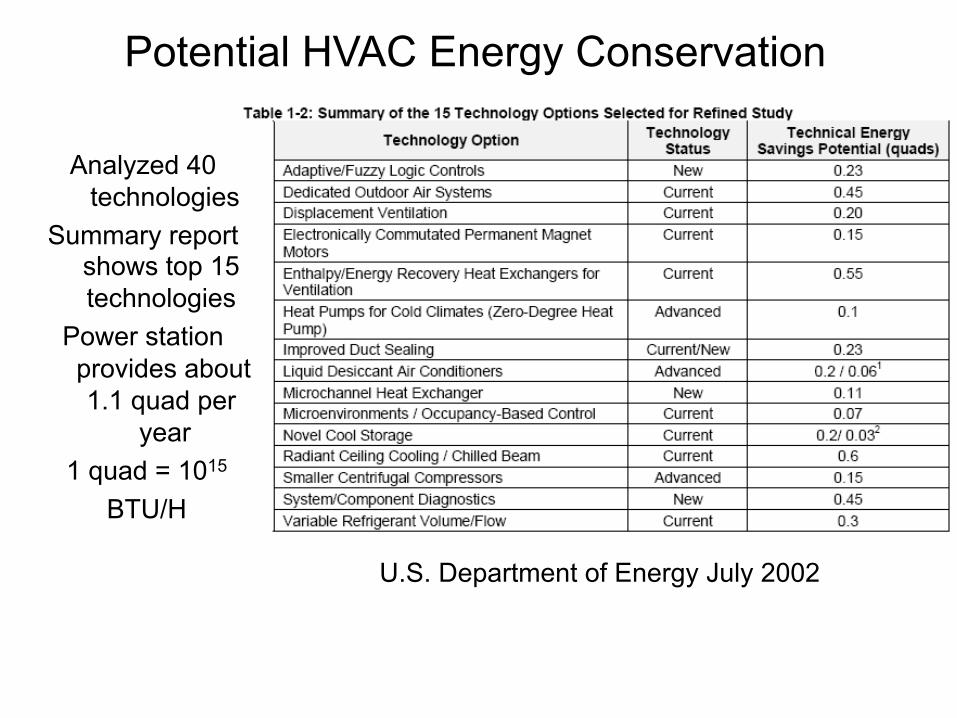
Potential HVAC Energy Conservation
Analyzed 40 technologies
Summary report shows top 15 technologies
Power station provides about 1.1 quad per
year 1 quad = 1015
BTU/H
U.S. Department of Energy July 2002
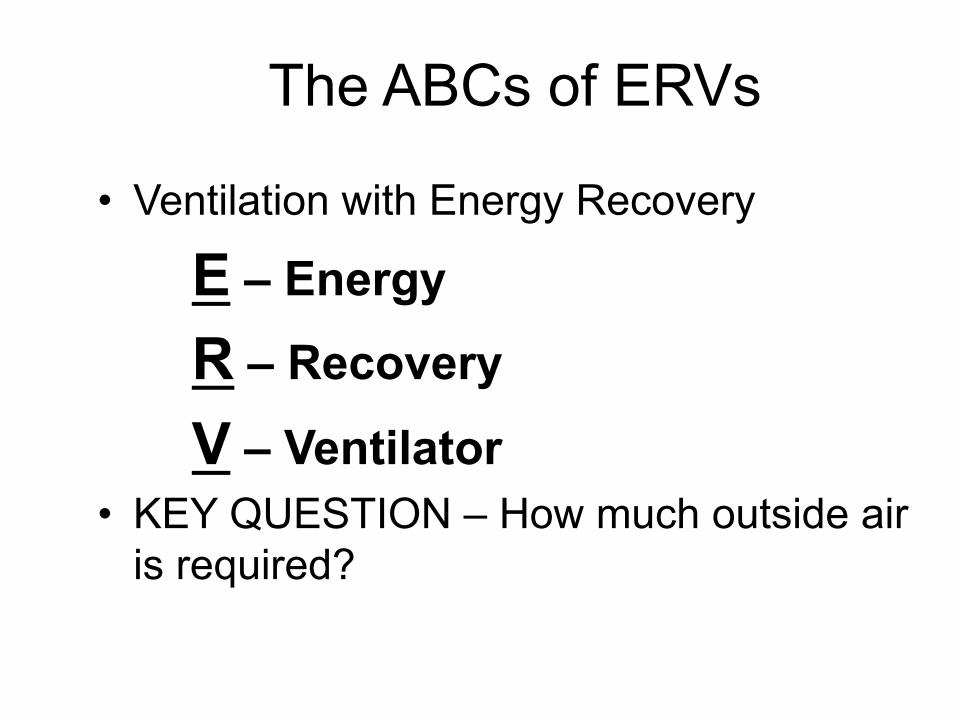
The ABCs of ERVs
• Ventilation with Energy Recovery
E – Energy
R – Recovery
V – Ventilator • KEY QUESTION – How much outside air
is required?
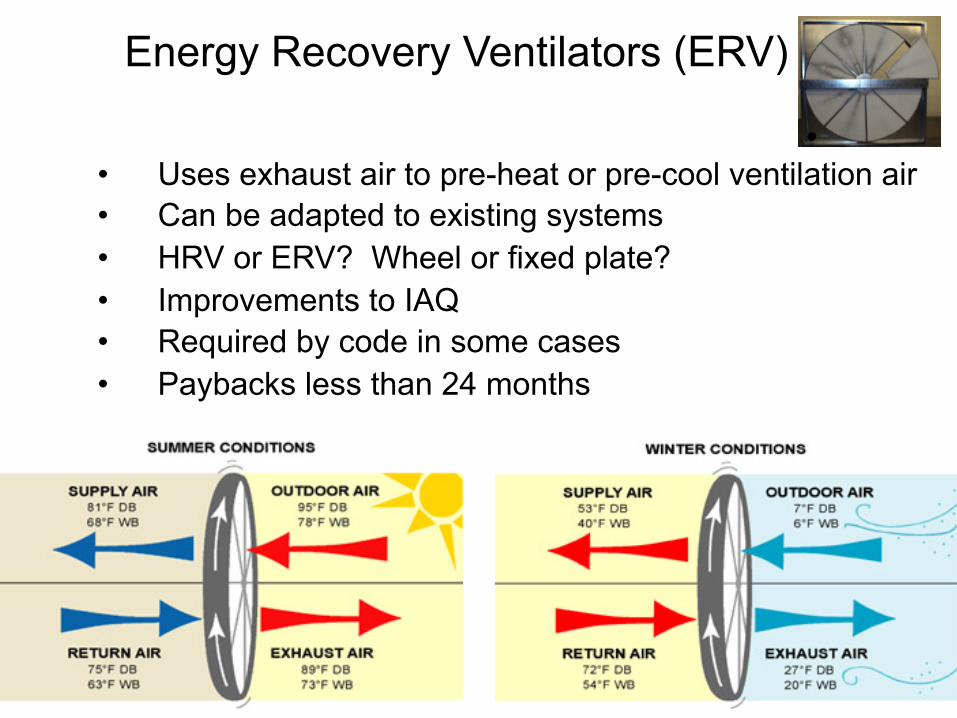
Energy Recovery Ventilators (ERV)
• Uses exhaust air to pre-heat or pre-cool ventilation air • Can be adapted to existing systems • HRV or ERV? Wheel or fixed plate? • Improvements to IAQ • Required by code in some cases • Paybacks less than 24 months

Identifying Potential Recovery Applications
When to Use ERV • Anywhere constant air changes are required and humidity control
(latent capacity) is an issue • When large quantities of ventilation air are desired • When long-term energy cost are more important then first cost • When there is a need to expand beyond the typical RTU operational
characteristics: More latent vs. sensible capability Higher system efficiencies Lower energy consumption More stages of operation
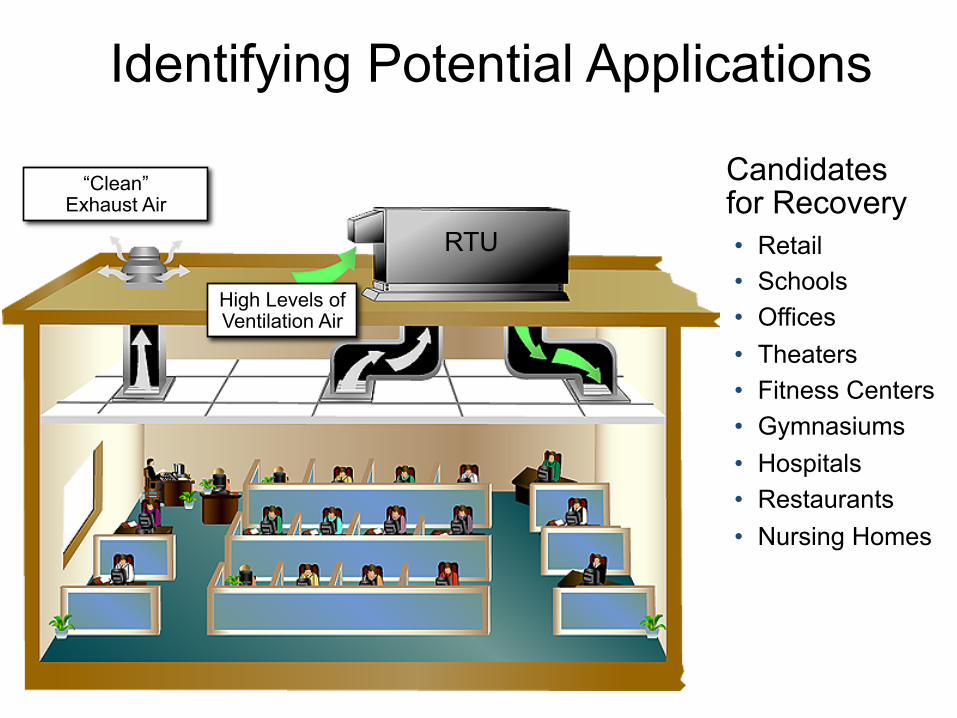
Identifying Potential Applications
RTU • Retail • Schools • Offices • Theaters • Fitness Centers • Gymnasiums • Hospitals • Restaurants • Nursing Homes
High Levels of Ventilation Air
“Clean” Exhaust Air
Candidates for Recovery

Plate Exchanger Crossflow
Return Air
Outdoor Air
Supply Air
Exhaust Air
Tight Seal Construction
Drain Pan
Module Sidewall
50 to 80 % sensible
effectiveness – latent possible