co the philiclteoappinesindustry.gov.ph/wp-content/uploads/2017/08/the... · 2017-08-09 · the...
TRANSCRIPT

CoCoaChoColateThe PhiliPPines i n t h e C o C o a - C h o C o l a t e
g l o b a l V a l U e C h a i n
a p r i l 2 0 1 7

The Philippines in the Cocoa-Chocolate Global Value Chain
This research was prepared by the Duke University Center on Globalization, Governance and
Competitiveness (Duke CGGC) on behalf of the USAID/Philippines, through the Science,
Technology, Research and Innovation for Development (STRIDE) Program. This study is part of the
Philippines Department of Trade and Industry (DTI) Board of Investment (BOI) Roadmap Initiative
for the revitalization of the manufacturing industry in the Philippines. The report is based on both
primary and secondary information sources. In addition to interviews with firms operating in the
sector and supporting institutions, the report draws on secondary research and information
sources. The project report is available at www.cggc.duke.edu.
Acknowledgements
Duke CGGC would like to thank all of the interviewees, who gave generously of their time and
expertise, as well as Richard Umali of the USAID Advancing Philippine Competitiveness
(COMPETE) Project for his extensive support.
The Duke University Center on Globalization, Governance & Competitiveness undertakes client-
sponsored research that addresses economic and social development issues for governments,
foundations and international organizations. We do this principally by utilizing the global value chain
(GVC) framework, created by Founding Director Gary Gereffi, and supplemented by other
analytical tools. As a university-based research center, we address clients’ real world questions with
transparency and rigor.
www.cggc.duke.edu
Center on Globalization, Governance & Competitiveness, Duke University
© April 2017
The Philippines in the Cocoa-Chocolate Global Value Chain
The Philippines in the Cocoa-
Chocolate Global Value Chain
FINAL DRAFT FOR REVIEW
April 2017
Prepared by
Danny Hamrick, Karina Fernandez-Stark and Gary Gereffi
Center on Globalization, Governance & Competitiveness,
Duke University
Prepared for
USAID/Philippines
This study is made possible by the generous support of the American people through the United States Agency for
International Development (USAID). The contents are the responsibility of Duke University Center on
Globalization, Governance and Competitiveness and do not necessarily reflect the views of USAID or the United
States Government.

The Philippines in the Cocoa-Chocolate Global Value Chain
i
The Philippines in the Cocoa-Chocolate Value Chain
Executive Summary .................................................................................................................................................. iv 1. Introduction ..................................................................................................................................................... 1 2. The Cocoa-Chocolate Global Value Chain .............................................................................................. 2
2.1 The Global Cocoa-Chocolate Industry: An Introduction ............................................................ 2 2.2 Mapping the Cocoa-Chocolate Global Value Chain ..................................................................... 4 2.3 Global Trade in the Cocoa-Chocolate Global Value Chain ........................................................ 7 2.4 Lead Firms and Governance ............................................................................................................. 14 2.5 Standards & Certifications ................................................................................................................. 18
3. The Philippines and the Cocoa-Chocolate Global Value Chain ........................................................ 22 3.1 Current Participation in the Cocoa-Chocolate Global Value Chain ....................................... 22 3.2 Key Firms & Industrial Organization in the Philippines Cocoa-Chocolate Sector ............... 27 3.3 Advantages and Challenges for Upgrading in the Philippines .................................................... 27
3.3.1 Advantages ....................................................................................................................................... 28 3.3.2 Challenges ........................................................................................................................................ 28
4. Upgrading: Lessons for Philippine Upgrading from Global Experiences .......................................... 31 4.1 Ecuador—Increasing Value by Process and Product Upgrading .............................................. 34 4.2 Indonesia—Increasing value by Functional Upgrading and Process Upgrading ..................... 38 4.3 Key Lessons for the Philippines ....................................................................................................... 42
5. Upgrading Trajectories Recommendations ............................................................................................ 43 6. Appendix ......................................................................................................................................................... 45 7. Bibliography .................................................................................................................................................... 48
List of Tables
Table 1. Cocoa-Chocolate Imports for Asian Countries by Segment, 2011-2015 ................................. 14 Table 2. Global Chocolate Confectionery Markets and Key Brands ......................................................... 16 Table 3. Key Certifications: Volume of Certified Cocoa Produced and Sold by Certification Scheme,
2012 ........................................................................................................................................................................... 20 Table 4. Export Volume and Value of Philippines Cocoa Exports, 2005-2014 ........................................ 23 Table 5. Retail Sales of Chocolate in the Philippines by Category, 2011-2015 ....................................... 26 Table 6. Philippines Cocoa-Chocolate GVC Import Value, 2007-2015 .................................................... 27 Table 7. Key Stakeholders Engaged in the Cocoa-Chocolate GVC ........................................................... 30 Table 8. Selected Upgrading Strategies in the Cocoa-Chocolate GVC ..................................................... 32 Table 9. Selected Indicators Related to the Cacao Sector in Ecuador, Indonesia, and the Philippines
.................................................................................................................................................................................... 33 Table 10. Major Policies in Ecuador's Cocoa Industry .................................................................................. 36 Table 11. Indonesia's Cocoa and Grinding by Volume (MT), 2010-2015 ................................................. 40
List of Figures
Figure 1. Cocoa, Palm Oil and Coffee Annual Prices, Nominal US dollars, 2000-2015 .......................... 3 Figure 2. Cocoa-Chocolate Global Value Chain ............................................................................................... 5 Figure 3. Cocoa-Chocolate Trade Value by GVC Segment, 2005-2015 ..................................................... 8 Figure 4. Cocoa Chocolate Value Chain Input-Output Traders ................................................................... 8 Figure 5. Top Ten Cocoa Bean Exporters by Value (US$, billion), 2005-2015 ......................................... 9 Figure 6. Top Ten Cocoa Bean Importers, by Value (US$ billion), 2005-2015 ....................................... 10 Figure 7. Top Ten Cocoa Paste Exporters, by Value (US$ million), 2005-2015. .................................... 11 Figure 8. Leading Cocoa Butter Exporters, by Value (US$ million), 2005-2015 ..................................... 12

The Philippines in the Cocoa-Chocolate Global Value Chain
ii
Figure 9. Leading Chocolate Exporters, by Value (US$ million), 2005-2015 ........................................... 13 Figure 10. Leading Chocolate Importers by Value (US$ million), 2005-2015 .......................................... 13 Figure 11. Philippines Participation in the Cocoa-Chocolate GVC ............................................................ 23 Figure 12. Philippines Cocoa Bean Production, 2005-2015.......................................................................... 24 Figure 13. Ecuadorian Cocoa Bean Exports, 2005-2015 ............................................................................... 35 Figure 14. Indonesia's Exports by Cocoa-Chocolate GVC Segment, (US$ million) 2005-2015 .......... 39
List of Boxes Box 1. Mondelez Cocoa Life Program to Boost Productivity ....................................................................... 4 Box 2. Cocoa Bean Varieties ................................................................................................................................. 6 Box 3. Key Actors in the Cocoa-Chocolate Global Value Chain ............................................................... 15 Box 4. Key Takeaways .......................................................................................................................................... 21 Box 5. Strong Domestic Demand: A Potential Development Ground for Export Capabilities .......... 26 Box 6. Mars Participation with Cocoa Farmers in Indonesia ....................................................................... 42

The Philippines in the Cocoa-Chocolate Global Value Chain
iii
Acronyms
ADM Archer Daniels Midland
ANECACAO National Association of Cocoa Exporters (Ecuador)
CIDAMi Cacao Industry Development Association of Mindanao, Inc.
CocoaPhil Cocoa Foundation of the Philippines
CONACADO National Confederation of Dominican Cacao Producers
DA Department of Agriculture, Philippines
DOST Department of Science and Technology
DTI Department of Trade and Industry, Philippines
EU European Union
FINACO Association of Producing Countries of Fine Aroma Cocoa (Ecuador)
GAP Good Agricultural Practices
GVC Global Value Chain
ICCO International Cocoa Organization
IFOAM International Federation of Organic Agriculture Movements INEN National Institution of Standards
MAGAP Ministry of Agriculture, Livestock, Aquaculture and Fisheries (Ecuador)
MIPRO Ministry of Industry and Productivity
MRECI Ministry of Foreign Affairs and Human Mobility
NGO Non-governmental Organization
PCAARRD Philippine Council for Agriculture, Aquatic and Natural Resources
Research and Development
PCAF Philippine Council for Agriculture and Fisheries
PGI Protected Geographical Indication
PROECUADOR Institute for Export and Investment Promotion
PSA Philippine Statistical Authority (PSA)
SEZ Special Economic Zone
UK United Kingdom
UNCTAD United Nations Commission for Trade and Development
US United States
USAID United States Agency for International Development
USDA United States Department of Agriculture

The Philippines in the Cocoa-Chocolate Global Value Chain
iv
Executive Summary
This report uses the Duke CGGC Global Value Chain (GVC) framework to examine the role of
the Philippines in the global cocoa-chocolate industry and identify opportunities for the country to
upgrade. The cocoa-chocolate global value chain (GVC) is a multimillion-dollar industry that
connects cocoa bean producers, often located in developing nations, with manufacturers and
consumers of chocolate. The demand for chocolate has grown rapidly in the last decade,
encouraging countries to expand and improve cocoa bean production. Taking advantage of
increased global demand, the Philippines is interested in participating in the sector. The Philippines’
current involvement in the cocoa-chocolate GVC is limited despite many competitive advantages.
The primary role it plays is an importer of intermediate and final products for domestic
consumption. The country has produced cocoa for centuries and has good climatic and geographical
conditions for its production. However, exports remain low; globally, the country ranks 72nd in
exports with a global market share of less than 0.01% (UNComtrade, 2016). In 2014, only eight
Filipino firms reported exports of over US$500,000 in the cocoa-chocolate GVC (PSA, 2007-2014).
The Cocoa-Chocolate Global Value Chain As the key ingredient in the production of chocolate, cocoa is one of the world’s most highly traded
tropical crops, valued at approximately US$9 billion in 2015 (UNComtrade, 2016). The cocoa-
chocolate GVC, for which cocoa beans is a key product, is also growing rapidly. Total trade in the
cocoa-chocolate GVC has doubled over the past 10 years, reaching nearly US$44 billion in 2015
(UNComtrade, 2016). Production is based in hot tropical climates in developing countries, while
consumption is primarily concentrated in developed countries in the Northern hemisphere. West
Africa is the leading producer, growing approximately two-thirds of the global supply (World Cocoa
Foundation, 2014); the majority of this comes from just two countries: Cote D’Ivoire and Ghana,
which together supply 61% of global exports (UNComtrade, 2016). Cocoa beans are primarily
destined to chocolate manufacturers concentrated in Western Europe, which then export to world
markets. Key characteristics of the cocoa-chocolate GVC include:
Evolution of global consumption patterns due to rising incomes in the Global
South. As incomes rise in many developing countries, demand for chocolate is also
increasing. Brazil, China, India, Russia, and South Africa all are seeing high growth in the
demand for chocolate. These emerging economies account for 70% of global confectionary
growth in recent years (KPMG, 2014).
Stagnation in supply has caused rising prices and concerns of sustainability.
Concurrent with rising demand, global supplies are falling for several reasons. Aging trees
and climate change are lowering yields across the globe. This is further complicated by low
farm gate price farmers receive for cocoa beans. As a result of these low prices, many
farmers have left the industry in favor of higher paying and faster yielding crops.
Global supply concerns have led midstream traders and downstream chocolate
producers to engage more directly in upstream operations. These engagements
focus primarily on techniques and farm-level interventions to improve the quality and
productivity of cocoa production. Many large-scale chocolate manufacturers are working
directly with producers to implement best practices and increase harvest while also
improving the quality of cocoa beans.

The Philippines in the Cocoa-Chocolate Global Value Chain
v
Despite low returns on the market currently, many major chocolate
manufacturers are shifting to sourcing only certified cocoa beans. Price premiums
associated with certified beans remain low due to supply shortages increasing the price of
uncertified beans. However, many global chocolate manufacturers and cocoa processors are
committing to sourcing cocoa beans from certified and sustainable sources by 2020. The
result is an increasing importance for global certifications such as UTZ and Rainforest
Alliance.
The Philippines in the Cocoa-Chocolate Global Value Chain Growing global demand in the cocoa-chocolate GVC represents an opportunity for the Philippines
to expand its presence in the industry. However, the country must first address significant
constraints to ensure the industry can support provide for sustainable long-term engagement in the
sector. Low volumes of cocoa beans and farm-level issues are the primary challenges to Philippine
participation in the chain, constraining upgrading into higher processing stages.
The dwindling supply has reduced the number of large-scale processors. Most businesses are either
small-scale chocolate manufacturers or tablea makers, with few firms having significant export
operations. Current cocoa-chocolate GVC exports totaled US$24 million in exports in 2015
(UNComtrade, 2016)—the Philippines instead was a net importer with imports exceeding US$132
million for all products in the cocoa-chocolate GVC. The country’s current position in the chain is
illustrated in Figure E-1. The segments where the country has more than US$1 million in exports
are shown by red rectangles. In addition, each segment includes the number of firms exporting over
US$500,000. Overall, only eight Filipino firms exceeded that threshold in 2014 (PSA, 2007-2014).
Figure E-1. Philippines Participation in the Cocoa-Chocolate GVC
Source: Authors.

The Philippines in the Cocoa-Chocolate Global Value Chain
vi
The Philippines’ most pronounced strengths in the cocoa-chocolate GVC relate to the geographic
conditions that allow for growth of higher value cocoa beans across the nation. It also benefits from
a climate that allows for growth of cocoa beans across the nation and a location close to emerging
consumer markets. The most prominent advantages include the following:
Geographic conditions suitable to growth: Most of the country has the necessary
climate to produce cocoa beans. The majority of production occurs on the island of
Mindanao, but the requisite climate for cocoa production can be found throughout the
nation. Cocoa also does best when intercropped with other agriculture products, such as
coconuts and bananas, which are also produced in the nation.
Ability to grow multiple varieties of cocoa beans: In addition to a large part of the
nation being suitable for cocoa bean cultivation, the Philippines can grow many varieties of
cocoa. Trinitario remains the main variety cultivated given the high value and resiliency of
the bean. However, Forastero and Criollo beans are also produced in country.
Proximity to growing demand markets: Rising incomes in Asia results in increased
consumption of chocolate as consumers shift towards more Western lifestyles. The
Philippines’ is close to many of these markets. China for example, offers an opportunity for
the Philippines to leverage its geographic location to help spur exports.
In order to capitalize on these advantages, additional effort is needed to address constraints at the
farm-level as well as broader issues of coordination across the industry. Farming techniques and
aging trees both have negative impacts on productivity. Furthermore, underdeveloped post-harvest
practices impede export potential and the ability to achieve economies of scale. Finally, the industry
needs to work towards closer collaboration to improve coordination and increase competitiveness.
Lack of adoption of modern agricultural practices: Farmers in the country often rely
on traditional farming practices, resulting in lower yields. Despite training programs,
adoption of modern agricultural practices in cocoa is limited. This is compounded by an
aging farmer population and incomplete land reform that has left many without titles to their
land, a prerequisite to secure loans to invest in farm upgrades.
Fragmented production: Smallholders primarily undertake production of cocoa beans,
and coordination among these actors is limited. While some cooperatives and farmer
associations exist to help aggregate, supply and reduce transaction costs, the high domestic
price for beans encourages side-selling by farmers and poses a significant challenge to
reaching economies of scale.
Underdeveloped post-harvest techniques. Fermentation and drying of cocoa beans is
necessary to secure high selling prices. However, implementation of modern technologies
and techniques remains limited, even with cocoa revitalization efforts.
Lack of coordination among stakeholders. The nation has launched several programs
to help revitalize the industry and capitalize on growing demand for chocolate. However,
these programs often are not coordinated across the industry, which creates inefficiencies
and duplication along the value chain.

The Philippines in the Cocoa-Chocolate Global Value Chain
vii
Upgrading in the industry in other countries has been heavily influenced by government policy and
support, including tax incentives, training programs and a national strategy for growth. Countries
that have upgraded in the industry have followed a similar approach—beginning with increasing
production before developing specialized varieties or entering into processing on a large scale. A
similar strategy is proposed for the Philippines. Table E-1 details the upgrading trajectories identified
for the Philippines to expand and upgrade its position within the cocoa-chocolate GVC.
Table E-1. The Philippines and the Cocoa-Chocolate GVC: Upgrading Trajectories
Time
Frame
Upgrading
Trajectory Key Benefits Philippines Challenges
Sh
ort
Term
Process Upgrading:
Increase domestic
production of cocoa
beans for export and
local processing
Expand volume of
cocoa exports
Increase backward
linkages and local
value add in
downstream
production
Employment and
revenue creation for
smallholders
Compliments existing
production in coconut
and banana
(intercropping)
Fragmented system of
production—mainly
smallholders
Slow uptake of GAPs among
farmers, including poor use of
fertilizer and irrigation
Weak access to capital for
smallholders
Ageing farmer population
Aging trees
Sh
ort
- M
ed
ium
Term
Process Upgrading:
Certification of
production
Provides long term
access to cocoa
market which has
increased its focus on
sustainability and
certifications
Lack of access to finance by
smallholders
Few certification agencies in the
country
Sh
ort
– M
ed
ium
Term
Product Upgrading:
Diversify the varieties
of cocoa beans
produced in country
Minimize exposure to
global price volatility
and harvest issues
Higher returns for
Fine Flavor certified
products
Reluctance to rejuvenate cocoa
trees
Some varieties are more
susceptible to disease and
weather damage than others
Lack of human capital with
relevant qualifications and
experience
Med
ium
-Lo
ng T
erm
Functional Upgrading:
Move into semi-
processed segments of
chain on a large scale
(Roasting & Grinding)
Higher unit value from
cocoa paste/liquor
Strategic location to
serve growing markets
for chocolate in China
and India
Semi-skilled and
skilled employment
generation
Lack of necessary cocoa bean
supply
Infrastructure and logistic costs
Energy cost
Human capital for managing
machinery
Regional competition from
Indonesia and Malaysia

The Philippines in the Cocoa-Chocolate Global Value Chain
1
1. Introduction
The cocoa-chocolate global value chain (GVC)1 is a multi-million dollar industry that connects
cocoa bean producers in developing countries with manufacturers and consumers of chocolate who
are most typically in developed nations. The demand for chocolate has grown rapidly in the last
decade, encouraging countries to expand and improve cocoa bean production. Seeing opportunity
in these trends as well as recognizing climatic advantages, the Philippines’ government is increasing
its presence in the sector. The country has produced cocoa for centuries; however, exports remain
low. The country ranks 72nd in exports with a global market share of less than 0.01%
(UNComtrade, 2016). In 2014, only eight Filipino firms participated in the cocoa-chocolate GVC
(PSA, 2007-2014). Instead, the country is an importer of intermediate and final products for
domestic consumption.
Expanding production of cocoa beans and farm-level issues are the primary challenges to the
Philippines’ participation in the cocoa-chocolate value chain, constraining upgrading into higher
processing stages. Production of cocoa beans is limited due to low quality seedlings, inefficient farm-
level processing techniques and limited access to capital and training for farmers. An aging farmer
population and younger generations seeking employment outside the agriculture sector further
constrain production. These issues undermine the supply of cost-competitive raw cocoa beans for
the manufacturing segments. Cocoa bean yields are well below the global average and there are not
enough domestic beans to justify either grinding for export markets or even for the domestic
market. As a result, grinding capacity is limited in the Philippines, and the number of large scale
grinding firms is shrinking.
Drawing on analysis of the global industry, it can be seen that developing countries with high
participation in the GVC such as Cote D’Ivoire, Ghana and Indonesia have focused on establishing a
solid and stable supply of cocoa beans before moving to the manufacturing stages of the chain. Using
a multi-stakeholder approach, these countries have been able to upgrade their operations to
become exporters of intermediary products such as cocoa liquor/paste and cocoa butter as well as
cocoa beans. As they expand domestic processing, the global supply of cocoa beans for downstream
processing countries will likely decline. A central lesson these countries offer the Philippines is that
entry and upgrading in the sector initially should focus on increasing and expanding cocoa bean
production. Once this goal is achieved, upgrading into the manufacturing stages of the chain can be
pursued. This work will require coordination among all the actors in the value chain—from actors
in the agricultural stages of the chain to actors in manufacturing segments.
This paper uses the global value chain (GVC) framework to understand how the global cocoa-
chocolate industry is changing, assess the Philippines current position in the GVC, and identify
opportunities to upgrade with the goal of promoting economic development, particularly in rural
areas. It first provides an overview of the cocoa-chocolate value chain to present a clear
understanding of the scope of the industry, how markets are structured and how changing
distribution of demand and supply can alter structural dynamics. It then analyzes the Philippines’
current position, examining both the advantages and the challenges for domestic industry
development. After providing comparative case studies on Ecuador and Indonesia’s experiences in
1 As this agribusiness value chain follows the industry from the production of cacao through the confection of
chocolate, the term cocoa-chocolate has been used; other variations used in the literature include the cacao
sector, and the cocoa global value chain.

The Philippines in the Cocoa-Chocolate Global Value Chain
2
the cocoa-chocolate GVC, it concludes by outlining potential upgrading strategies. Policy
recommendations to enable those upgrading trajectories conclude the paper.
2. The Cocoa-Chocolate Global Value Chain
2.1 The Global Cocoa-Chocolate Industry: An Introduction
As the key ingredient in the production of chocolate, cocoa beans is one of the world’s most highly
traded tropical crops, valued at approximately US$9 billion in 2015 (UNComtrade, 2016). Total
trade in the cocoa-chocolate GVC has doubled over the past 10 years reaching nearly US$44 billion
in 2015 (UNComtrade, 2016).2 Production is based in hot tropical climates in developing countries,
while consumption has been primarily in developed countries in the Northern hemisphere. West
Africa dominates production, growing approximately two thirds of global supply (World Cocoa
Foundation, 2014); the majority of this comes from just two countries, Côte d’Ivoire and Ghana,
which together supply 61% of global exports (UNComtrade, 2016). This cocoa is destined mainly to
chocolate manufacturers concentrated in Western Europe, which in turn, export to the world.
Several changes in recent years have begun to reshape the global cocoa industry with important
implications for countries seeking to expand their presence in the sector: First, global consumption
patterns have changed as a result of rising disposable income in emerging economies driving demand
for chocolate products. Brazil, China, India, Russia, and South Africa. These emerging economies
account for 70% of global confectionary growth (KPMG, 2014). China, in particular, is a major
driver of this growth as incomes rise, the market liberalizes and consumers begin to adopt more
Western dietary habits and lifestyles (Ferdman, 2014; Squicciarini & Swinnen, 2016). Chinese
imports of chocolate grew around 700% from 2005 to 2015, from nearly US$64 million to almost
US$516 million. Brazil has followed a similar pattern, increasing imports tenfold over the past
decade. 3 Expansion of cold chain capabilities in these southern markets has also helped to drive
demand (Barrientos, 2015). These new players have joined mature markets in the European Union
(EU), Japan and the United States (US) (International Cocoa Organization, 2014) to boost the size
of the global chocolate market to approximately US$98 billion (Euromonitor, 2016b; Hawkins &
Chen, 2014). This has also opened up numerous new South-to-South market opportunities for
cocoa-producing countries.
Second, the significant increase in demand occurred at the same time as stagnation in the supply of
cocoa beans, resulting in a global shortage; this has led to an important rise in global prices and
concerns about the sustainable supply of raw materials. Weak farm gate returns from cocoa—the
average income from cocoa production was estimated to be approximately US$0.42/capita/day in
Ghana in 2008 (Barrientos & Asenso-Okyere, 2008)—have driven farmers to move to better and
faster paying crops, or out of agriculture completely. Aging trees, adverse weather conditions and
disease have accentuated this shift, and production has become unsustainable for many producers
(Barrientos, 2014; UNCTAD, 2016; Williams & Eber, 2012). Global export volumes reflect these
challenges and have remained relatively unchanged over the past decade; in 2005, exports were 2.8
million tons, compared to 2.7 million tons in 2015 (UNComtrade, 2016). The simultaneous increase
in demand has resulted in a steady rise in the price of cocoa, even compared to other food
2 Sector-wide exports have doubled over the past 10 years, with a peak almost US$48 billion in 2014
(UNComtrade, 2016).
3 Brazil imported US$27.5 million in 2005, while in 2015 increased to nearly US$171 million (UNComtrade, 2016).

The Philippines in the Cocoa-Chocolate Global Value Chain
3
commodities over the past two decades. Nominal prices more than tripled; in 2000, cocoa was
traded at US$0.91/kg, while in 2015 it reached US$3.14/kg. During that same period, by
comparison, palm oil and Robusta coffee prices only doubled (see Figure 1). With future demand
expected to increase by more than 4.5 million tons by 2020, experts predict a global shortage of
cocoa supply, that could be as high as 1 million tons by 2020, and 2 million tons by 2030 (Fairtrade
Foundation, 2016; Ferdman, 2014). This offers potential prospects for new producing regions,
should they be able to manage constraints to sustainable production.
Figure 1. Cocoa, Palm Oil and Coffee Annual Prices, Nominal US dollars, 2000-
2015
Source: World Bank Commodity Price Data, Updated Nov. 02, 2016.
Third, concerns over global supply of chocolate have led midstream traders and downstream
chocolate producers to engage more directly in upstream operations to improve the quality and
productivity of cocoa production (Barrientos, 2015; Fairtrade Foundation, 2016; Lamb, 2014). The
chocolate sector has traditionally had little interaction with growers, who interacted with the
market mainly through traders or national marketing boards (Barrientos, 2015).4 This has begun to
change. At the cocoa production level, company schemes and commitments towards sustainable
production include Plan Ferrero’s commitment to sustainable cocoa, Mars’ Sustainable Cocoa
Initiative, Mondelez’s Cocoa Life (see Box 1) and Nestlé’s Cocoa Plan (Barrientos, 2015; Fairtrade
Foundation, 2016). Together these initiatives are focused on a) developing more disease-resistant
and productive hybrids, b) improved and innovative techniques for fermentation and drying, c)
enabling more efficient and varied farm growing plans and business models, d) paying higher wages
and providing better quality of life for farmers (Williams & Eber, 2012). Meanwhile, mid-stream
companies have been investing directly in processing facilities to ensure consistent supplies of cocoa
intermediates, including cocoa paste, liquor and butter, from a wider range of bean quality, allowing
firms to maximize on the limited supply of beans. For instance, in Cote d’Ivoire, foreign-owned
companies, including Barry Callebaut, Cargill and Olam, are investing heavily in processing facilities
(Fairtrade Foundation, 2016). New producers thus have an opportunity to immediately engage with
4 From the 1950s to 1980s, the predominant model of support for cocoa farmers was through state dominated
export-marketing boards, which set farmer prices, had monopoly control over cocoa purchases and exports. The
international cocoa market was then largely characterized by arms-length trading through commodity markets
(Barrientos, 2015).
0.00
0.50
1.00
1.50
2.00
2.50
3.00
3.50
2000
2001
2002
2003
2004
2005
2006
2007
2008
2009
2010
2011
2012
2013
2014
2015
No
min
al
Pri
ce (
US
$/k
g)
Cocoa
Palm oil
Coffee,
robusta

The Philippines in the Cocoa-Chocolate Global Value Chain
4
downstream actors; this provides a unique possibility to develop the necessary skills to be
successful in the sector.
Box 1. Mondelez Cocoa Life Program to Boost Productivity
In 2012, ten of the leading cocoa processors and chocolate brand manufacturers (developed country
firms) agreed on sharing good agricultural practices (GAP) and crop yield to meet growing demand
and address declining productivity. Mondelez International,5 the world’s largest chocolate
manufacturer, is one of the leaders of this initiative through its program, Cocoa Life. Through Cocoa
Life, Mondelez has committed US$400 million to cocoa sustainability programs in six nations: Ghana,
Cote d’Ivoire, Indonesia, the Dominican Republic, India, and Brazil; the goal is to work with as many
as 200,000 cocoa farmers by 2022.
The program seeks to promote sustainable, high yield production among farmers to help increase
farm revenue. In addition to teaching farmers GAPs, it focuses on developing business skills of the
farming communities, helping to shift the perception of farming as a subsistence activity to a
commercially, viable operation, making the profession more attractive to younger generations. The
design and themes of programs are created in consultation with multiple stakeholders in the
community. Finally, third parties frequently evaluate initiatives linked to Cocoa Life to gauge
effectiveness and impact.
By 2015, as a result of Cocoa Life, Mondelez International was working with 76,700 cocoa farmers in
Ghana, Cote d’Ivoire, Indonesia and India and sourced 21% of its coca beans from sustainable farms.
Source: Mondelez International (2016).
2.2 Mapping the Cocoa-Chocolate Global Value Chain
The cocoa-chocolate GVC spans both agricultural and manufacturing activities; it covers the
agricultural stages of cocoa bean production, mid-stream manufacturing processing of cocoa beans
into intermediate products as well as the production, marketing and distribution of chocolate and
other final products. These processes can be divided into five main segments: 1) Production of
Cocoa Beans 2) Roasting and Grinding, 3) Pressing, 4) Chocolate Manufacturing, and 5) Marketing
and Distribution. Figure 2 provides an illustration of this value chain. While each stage is highly
focused on one or two processes, volume, energy, shipping conditions, and other input
requirements have resulted in this considerable fragmentation of the chain.
5 Mondelez International owns the following chocolate brands: Cadbury, Milka, Lacta, Côte d'Or and Alpen Gold
(see Section 2.4).

The Philippines in the Cocoa-Chocolate Global Value Chain
5
Figure 2. Cocoa-Chocolate Global Value Chain
Source: Authors.
Production of Cocoa Beans: Cocoa production is a perennial crop; after planting, trees mature
within approximately three to five years depending on the variety and have a productive life of 25-
30 years, producing beans approximately every six months (ICCO, 2014; UNCTAD, 2016).6 Cocoa
beans vary by quality, with three major categories of beans (see Box 2). Growing techniques such as
shade-plantation and fertilization can have important impact on the productivity of raw mature
cocoa beans. Production is labor-intensive during harvest which is done by hand, and trees require
close monitoring during the rest of the year – particularly for fertilization needs, disease and animal
interference (UNCTAD, 2016; World Cocoa Foundation, 2016). Following harvest, the pulp-
covered beans must be fermented and dried. Fermentation entails heating the beans for up to a
week. This is a key process with considerable bearing on the quality of downstream products as it
produces the chocolate flavor. Afterwards, the wet cocoa beans are typically dried in sunlight for
five to ten days, which helps to improve their shelf life. This drying process can also be done in
mechanical dryers (UNCTAD, 2016; World Cocoa Foundation, 2016).
Labor intensity combined with the industrial organization structure of producing-countries within
the Tropics has favored production by primarily smallholders. These farmers, which cultivate
between 1 and 4ha of land, account for between 80 and 90% of global production (UNCTAD,
2016). Growers typically undertake fermentation and drying activities, although this may also be
carried out collectively by cooperatives or at a collection center owned by traders/processors. The
output of this stage is dried cocoa beans. In addition to farm level activities, production is supported
by a wide array of research and development activities geared particularly to studying new varieties
of cocoa beans as well as optimal growing cycles and processes.
6 The harvesting cycles depend on the climate and the variety of cocoa and thus may differ slightly by location and
type.
Produc onofCocoaBeans
Roas ng&GrindingMarke ngandDistribu on
PressingChocolate
Manufacturing
Inputs:Seeds/plan nes,
fer lizers,agrochemicals(herbicides,fungicides&
pes cides),farmequipment,irriga on
equipmentFermenta on
Dryingofbeans
CocoaPaste/
Liquor
CocoaPowder
CocoaBu er
IndustrialChocolate
ChocolateBars
Chocolatedrinks
Supermarkets
Foodservices(Bakeries,
Restaurants,etc.)
Smallretailers/Convenience
Internet
VendingMachines
The Philippines in the Cocoa-Chocolate Global Value Chain
6
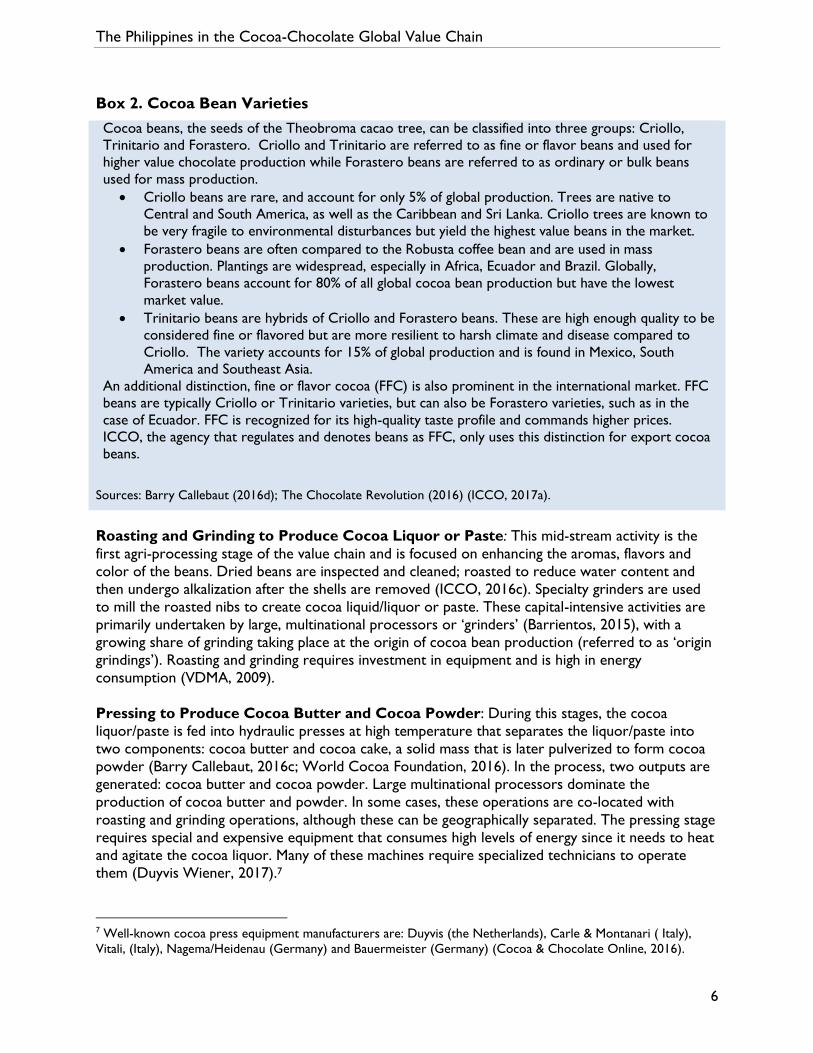
Box 2. Cocoa Bean Varieties
Cocoa beans, the seeds of the Theobroma cacao tree, can be classified into three groups: Criollo,
Trinitario and Forastero. Criollo and Trinitario are referred to as fine or flavor beans and used for
higher value chocolate production while Forastero beans are referred to as ordinary or bulk beans
used for mass production.
Criollo beans are rare, and account for only 5% of global production. Trees are native to
Central and South America, as well as the Caribbean and Sri Lanka. Criollo trees are known to
be very fragile to environmental disturbances but yield the highest value beans in the market.
Forastero beans are often compared to the Robusta coffee bean and are used in mass
production. Plantings are widespread, especially in Africa, Ecuador and Brazil. Globally,
Forastero beans account for 80% of all global cocoa bean production but have the lowest
market value.
Trinitario beans are hybrids of Criollo and Forastero beans. These are high enough quality to be
considered fine or flavored but are more resilient to harsh climate and disease compared to
Criollo. The variety accounts for 15% of global production and is found in Mexico, South
America and Southeast Asia.
An additional distinction, fine or flavor cocoa (FFC) is also prominent in the international market. FFC
beans are typically Criollo or Trinitario varieties, but can also be Forastero varieties, such as in the
case of Ecuador. FFC is recognized for its high-quality taste profile and commands higher prices.
ICCO, the agency that regulates and denotes beans as FFC, only uses this distinction for export cocoa
beans.
Sources: Barry Callebaut (2016d); The Chocolate Revolution (2016) (ICCO, 2017a).
Roasting and Grinding to Produce Cocoa Liquor or Paste: This mid-stream activity is the
first agri-processing stage of the value chain and is focused on enhancing the aromas, flavors and
color of the beans. Dried beans are inspected and cleaned; roasted to reduce water content and
then undergo alkalization after the shells are removed (ICCO, 2016c). Specialty grinders are used
to mill the roasted nibs to create cocoa liquid/liquor or paste. These capital-intensive activities are
primarily undertaken by large, multinational processors or ‘grinders’ (Barrientos, 2015), with a
growing share of grinding taking place at the origin of cocoa bean production (referred to as ‘origin
grindings’). Roasting and grinding requires investment in equipment and is high in energy
consumption (VDMA, 2009).
Pressing to Produce Cocoa Butter and Cocoa Powder: During this stages, the cocoa
liquor/paste is fed into hydraulic presses at high temperature that separates the liquor/paste into
two components: cocoa butter and cocoa cake, a solid mass that is later pulverized to form cocoa
powder (Barry Callebaut, 2016c; World Cocoa Foundation, 2016). In the process, two outputs are
generated: cocoa butter and cocoa powder. Large multinational processors dominate the
production of cocoa butter and powder. In some cases, these operations are co-located with
roasting and grinding operations, although these can be geographically separated. The pressing stage
requires special and expensive equipment that consumes high levels of energy since it needs to heat
and agitate the cocoa liquor. Many of these machines require specialized technicians to operate
them (Duyvis Wiener, 2017).7
7 Well-known cocoa press equipment manufacturers are: Duyvis (the Netherlands), Carle & Montanari ( Italy),
Vitali, (Italy), Nagema/Heidenau (Germany) and Bauermeister (Germany) (Cocoa & Chocolate Online, 2016).

The Philippines in the Cocoa-Chocolate Global Value Chain
7
Chocolate Manufacturing: This stage of the chain primarily involves the production of chocolate,
and to a lesser degree cocoa powder preparations. Depending on the type of chocolate
manufactured (Barry Callebaut, 2016c), a mixture of cocoa butter, cocoa liquor, sugar, milk and
other ingredients are heated and blended,8 removing volatile flavors, reducing viscosity and particle
size (Cadbury, 2016a; World Cocoa Foundation, 2016). After this, the mixture is tempered – that
is, heated, cooled and reheated, before being molded into chocolate bars and cooled and packaged.
In the case of cocoa powder preparation, cocoa powder is mixed with sugar and other additives.
Chocolate production includes products destined directly for consumption, such as chocolate bars,
as well as inputs for the production of confectionary items, such as biscuits, cakes, and ice cream,
amongst others. Chocolate bar manufacturing tends to be dominated by major brands, with private-
label retail chocolate taking up a minor share, whereas ‘industrial chocolate’ destined for the
production of other final products is manufactured by both brands – many of which are owned by
multinational food and beverage companies and thus vertically integrated into the production of
final products, and mid-stream cocoa processors,9 as well as other specialty chocolate providers
which supply what is referred to as the ‘open market’ (Euromonitor, 2012; Webber, 2009).
Marketing and Distribution: Once the chocolate and cocoa powder are packaged they are
distributed to different channels for their sale and consumption, including supermarkets,
convenience stores, specialty retailers, vending machines, and artisanal confectionary producers (e.g.
bakers, pastry chefs, hotels, restaurants and caterers). Supermarkets dominate sales in most major
markets. Overall, as a large share of chocolate consumption is based on impulse purchases, gifts and
special occasions such as Easter and Christmas, producers use as wide a range of purchasing points
as possible to increase potential consumption (Euromonitor, 2012; Webber, 2009).
2.3 Global Trade in the Cocoa-Chocolate Global Value Chain This section analyzes global trade in the cocoa-chocolate GVC. A large number of both developed
and developing countries participate in the cocoa-chocolate GVC. On the supply side, developing
countries located along the equator are the major exporters of cocoa beans that are later
processed into intermediate products in other locations around the world. Final products, like
chocolates and other confectionary items are mainly produced and exported by the EU and North
America. Overall, the Netherlands plays a key role in the value chain, importing cocoa beans,
processing intermediate products and producing final products. While the demand for chocolates is
still concentrated in developed countries located in Europe and North America, this is beginning to
shift towards developing markets, in particular, Asia.
This is a growing, global industry: total trade in the cocoa-chocolate GVC has doubled over the past
10 years reaching nearly US$44 billion in 2015 (UNComtrade, 2016).10 In terms of value, chocolate
exports capture 56% of the total exports in the industry, followed by cocoa beans 20%, cocoa
butter 12%, cocoa liquor/paste 7% and cocoa powder 5%. Figure 3 highlights the distribution of
exports by value in different segments of the value chain over the past decade.
8 This requires specialized blenders known as conches in the industry. 9 Under the popular global business brands, for instance, Barry Callebaut (Cacao Barry and other six brands),
Cargill (Gerken Cacao), and ADM (deZaan), cocoa processors supply industrial chocolate, as well as cocoa
powder, to business customers such as specialty manufacturers, and artisanal producers, including bakers, pastry
chefs, hotels, restaurants and caterers (Euromonitor, 2012). 10 Sector-wide exports peaked at almost US$48 billion in 2014 (UNComtrade, 2016).

The Philippines in the Cocoa-Chocolate Global Value Chain
8
Figure 3. Cocoa-Chocolate Trade Value by GVC Segment, 2005-2015
Source: UN Comtrade, HS2002- 1801,1803,1804,1805,1806; downloaded 10/25/2016
Overall, a handful of developing countries dominate exports in the early stages of the value chain,
while developed countries primarily participate in the final product stages of the chain (see Figure
4).
Figure 4. Cocoa Chocolate Value Chain Input-Output Traders
Source: Authors based on UN Comtrade, HS2002- 1801,1803,1804,1806; downloaded 10/25/2016.
-
10.0
20.0
30.0
40.0
50.0
60.0
2005 2006 2007 2008 2009 2010 2011 2012 2013 2014 2015
Glo
bal
Tra
de,
US
$ b
illio
n
Cocoa beans, whole or broken, raw or roasted. Cocoa paste, whether or not defatted.Cocoa butter, fat and oil. Cocoa powder, not containing added sugarChocolate and other food preparations containing cocoa.

The Philippines in the Cocoa-Chocolate Global Value Chain
9
Production of cocoa beans is almost exclusively the domain of developing countries.
Production is centered in the Equatorial belt nations. Two regions drive global exports: Africa and
South America, with a small presence of Asian countries. Cote D’Ivoire is the leading exporter of
cocoa beans, followed by Ghana. In 2015, Cote D’Ivoire supplied approximately US$3 billion, while
Ghana exported US$2 billion worth of cocoa beans (see Figure 5) (UNComtrade, 2016); together,
concentrating 61% of the total world exports. South American production by comparison is much
smaller; but the region’s focus is on fine cocoa, supplying 80% of this higher value variety (Amores
et al., 2007). Leading exporters are Ecuador,11 Dominican Republic and Peru. Indonesia is the most
prominent Asian producer, with more than 1.5 million Ha of cocoa plantations. The country
launched a revitalization program in 2009 to boost production. Since 2010 cocoa beans exports
have declined and the export of processed cacao products such as cocoa liquor and cacao butter
began increasing (Indonesia Investments, 2017); in part due to a 2010 export tax on raw cacao
beans to incentivize the processing stages.
Figure 5. Top Ten Cocoa Bean Exporters by Value (US$, billion), 2005-2015
Source: UN Comtrade, HS2002- 1801, downloaded 10/25/2016
Traded cocoa beans are destined primarily to developed countries. Demand for cocoa
beans to produce chocolate bars and other products that contain chocolate is concentrated in
Europe and the US. The top 10 importers represent 82% of the market; although the leading three
importers, the US, the Netherlands and Germany, alone accounted for approximately half (47%) of
imports in 2015. The Netherlands serves both as a leading manufacturing destination, as well as an
entry point for cocoa beans destined to Germany (see Figure 6).12 Malaysia is the only Southern
market in the top five. Host to a number of chocolate global brands, Malaysia aims to be the leader
11 Ecuador is the biggest supplier of fine cocoa in the world. 12 In 2015, approximately 23% of cocoa beans imported into the Netherlands were re-exported on to Germany.
0
0.5
1
1.5
2
2.5
3
3.5
4
2005 2006 2007 2008 2009 2010 2011 2012 2013 2014 2015
Exp
ort
Val
ue
, US$
bill
ion
Cote d'Ivoire Ghana Ecuador
Cameroon Nigeria Dominican Rep.
Peru Indonesia Papua New Guinea

The Philippines in the Cocoa-Chocolate Global Value Chain
10
of chocolate production in the Asian region by 2020.13 The country is also encouraging the
production of cocoa in the country providing inputs and training to small farmers (Malaymail Online,
2014). While the country’s value of imports has remained constant over the past ten years, it has
seen a significant decline in the volumes imported as prices have risen. Between 2006-2008, import
volumes were approximately 454 million tons, but by 2015, this had fallen to just half of that
(UNComtrade, 2016).
Figure 6. Top Ten Cocoa Bean Importers, by Value (US$ billion), 2005-2015
Source: UN Comtrade, HS2002- 1801; downloaded 10/25/2016
Producing (developing) countries, nonetheless, have begun to undertake a greater share of early
processing, particularly in the production of cocoa paste, this is known as ‘origin grinding’. As the
largest global producers of cocoa beans, Cote D’Ivoire and Ghana have focused on shifting into
higher value stages of the chain to add value to their primary export commodity. Cote D’Ivoire
increased paste exports from US$355 million in 2005 to over US$1 billion in 2014, while Ghana has
also increased significantly from US$57 million to US$390 million in the same period. Indonesia has
also emerged as a leading exporter of early intermediates, surpassing Germany in 2013 to become
the fourth largest exporter globally. The country has steadily decreased its exports of unprocessed
beans as it increased its processing capacity (see Figure 7). These three developing countries
compete primarily with the Netherlands. As these major producing countries seek to add value to
their beans through processing, the supply of unprocessed beans on the global market could begin
to decline. This poses a challenge for non-producing countries seeking to enter the industry in
downstream processing stages of the chain.
13 Nestlé produces in Malaysia under the brands Milo and Kit Kat, Cadbury manufacture a number of chocolate
products and the Department of Islamic Development Malaysia certifies it Halal.
-
0.50
1.00
1.50
2.00
2.50
2005 2006 2007 2008 2009 2010 2011 2012 2013 2014 2015
Imp
ort
Valu
e, U
S$ b
illio
n
Netherlands USA Germany BelgiumMalaysia France Spain ItalySingapore Turkey Indonesia

The Philippines in the Cocoa-Chocolate Global Value Chain
11
Figure 7. Top Ten Cocoa Paste Exporters, by Value (US$ million), 2005-2015.
Source: UN Comtrade, HS2002- 1803; downloaded 10/25/2016
Developing countries have also slowly made advances into further downstream processing and
production of cocoa butter and powder, but this is still limited. This segment of the value chain has
long been dominated by the Netherlands, both in terms of volume and value. The Netherlands is a
global trade hub for cocoa beans and semi-finished products that usually are exported to
neighbouring countries (CBS, 2016). Nonetheless, non-traditional bases including Indonesia, Cote
D’Ivoire, Malaysia and Ghana have gained market share; these four have grown their market share
from 31% to 40% over the past decade, becoming the 2nd, 3rd, 4th and 7th largest suppliers in this
product category respectively from 2005 to 2015 (see Figure 8). Cocoa butter is primarily destined
to Belgium, Germany, the Netherlands, the UK, and the US.
-
200
400
600
800
1,000
1,200
2005 2006 2007 2008 2009 2010 2011 2012 2013 2014 2015
Exp
ort
Valu
e, U
S$ m
illio
n
Cote d'Ivoire Netherlands Ghana Indonesia France
Germany Malaysia Switzerland USA Belgium

The Philippines in the Cocoa-Chocolate Global Value Chain
12
Figure 8. Leading Cocoa Butter Exporters, by Value (US$ million), 2005-2015
Source: UN Comtrade, HS2002- 1803; downloaded 10/25/2016
Chocolate trade, on the other hand, occurs primarily between developed countries,
particularly those in Europe. While producing countries have made inroads into cocoa
intermediates trade, developed countries continue to dominate the exports and imports of
chocolate (see Figure 9 and Figure 10). Germany and Belgium lead exports while the US, Germany,
UK and France are the major importers. The market size of the chocolate sector in 2016 in
Western Europe accounts for US$35 billion14 and US$19 billion in the US (Euromonitor, 2016b).
14 The two largest consumers in Europe are the UK with US$8.6 billion and Germany US$ 7.8 billion
(Euromonitor, 2016b)
0
200
400
600
800
1000
1200
1400
1600
1800
2005 2006 2007 2008 2009 2010 2011 2012 2013 2014 2015
Exp
ort
valu
e,
US
$ m
illio
n
Netherlands Indonesia Cote d'Ivoire Malaysia France
Germany Ghana Brazil Singapore China

The Philippines in the Cocoa-Chocolate Global Value Chain
13
Figure 9. Leading Chocolate Exporters,
by Value (US$ million), 2005-2015
Figure 10. Leading Chocolate Importers by
Value (US$ million), 2005-2015
Source: UN Comtrade, HS2002- 1806; downloaded 10/25/2016
Regionally, Asian demand for final chocolate products has also increased. Between 2011
and 2016, regional demand increased from US$13 billion to US$14 billion in 2016 (Euromonitor,
2016b).15 Some US$3 billion was supplied through imports (UNComtrade, 2016). Table 1 highlights
imports for Asian nations. Chinese chocolate imports, for example, increased from US$64 million in
2005 to US$516 million in 2015. Asian countries have supported this significant increase in demand
primarily through establishing downstream capabilities in cocoa butter and powder production. The
region’s share of cocoa beans imports has remained relatively stable over the past ten years, as has
the import of cocoa butter. However, the region’s share of global imports of cocoa paste and liquor
has doubled over the past ten years. 70% of this is being supplied by Indonesia, Malaysia, Singapore
and Japan. Indeed, Indonesia and Malaysia’s exports of cocoa liquor to the region have expanded
from around US$66 million (2005) to over US$407 million (2015). Only a small share of cocoa
inputs is derived in developed country markets.
15 Euromonitor defines the Asian region as encompassing the following nations: Australia, Azerbaijan, China, Hong
Kong, India, Indonesia, Japan, Kazakhstan, Malaysia, New Zealand, Pakistan, Philippines, Singapore, South Korea,
Taiwan, Thailand, and Uzbekistan. For imports by select Asian nations see Table A-1 in the appendix.
0
1
2
3
4
5
2005 2007 2009 2011 2013 2015
US
$ b
illio
n
Germany Belgium Italy
USA Poland Canada
France Netherlands Switzerland
United Kingdom
-
1
1
2
2
3
3
2005 2007 2009 2011 2013 2015
US
$ b
illio
n
USA Germany United Kingdom
France Netherlands Canada
Belgium Poland Spain
Japan

The Philippines in the Cocoa-Chocolate Global Value Chain
14
Table 1. Cocoa-Chocolate Imports for Asian Countries by Segment, 2011-2015
Category Import Value (US$, million)
2010 2011 2012 2013 2014 2015
TOTAL 4966.25 5900.47 5838.26 5835.17 7035.65 5934.31
Cocoa Beans 1765.05 1840.26 1574.18 1371.89 1943.43 1330.27
Cocoa Liquor/Paste 339.99 464.87 393.15 453.78 517.63 518.35
Cocoa Butter 316.25 272.01 221.39 303.93 567.15 518.44
Cocoa Powder 441.29 645.17 668.33 475.62 407.21 368.48
Chocolate 2103.67 2678.15 2981.20 3229.96 3600.23 3198.76
Source: UN Comtrade, HS2002- 1801,1803,1804,1805,1806; downloaded 10/25/2016
2.4 Lead Firms and Governance16
At the same time as global trade trends have shifted, there has been significant restructuring of the
cocoa-chocolate value chain (Barrientos, 2015). The cocoa-chocolate GVC today is characterized
by two contrasting organizational structures: high degrees of concentration in the mid- and down-
stream stages, and considerable fragmentation of the upstream stages of production of cocoa beans
(see Box 3). A small number of branded chocolate companies dominate the global consumer
market, interacting with a similarly small number of mid-stream processors; these firms are highly
sophisticated with a global presence and are headquartered in developed country markets.17
Production of cocoa beans, on the other hand, is carried out by millions of small farmers in
developing countries who are generally underfinanced and under-educated. This has led to an
asymmetrical balance of power within the chain, two small groups of lead firms control how and
where value is created and distributed along the value chain, with smallholders obtaining an ever
smaller share of this growing industry (Barrientos, 2015). As a result, many producers are opting
out of the industry in favor of other higher paying crops or jobs. This structural challenge is creating
sustainability concerns for the chocolate industry. In addition, it raises concerns about whether and,
how, policymakers should promote participation in upstream production for small producers in
new countries.
16 The information on this section draws considerably on recent work carried out by Duke CGGC. See
(Abdulsamad et al., 2015) 17 The control of the cocoa-chocolate value chain by these two sets of actors at different nodes of the chain is
often referred to as a ‘bi-polar’ governance structure (Barrientos, 2015).

The Philippines in the Cocoa-Chocolate Global Value Chain
15
Box 3. Key Actors in the Cocoa-Chocolate Global Value Chain
The Cocoa-Chocolate GVC has three key types of actors:
Producers: Upstream production operations are undertaken by an estimated five million small
farms, producing cocoa on plots of 1-4 ha of land (ICCO, 2012), primarily in the Cote D’Ivoire
and Ghana. These small producers are heavily dependent on cocoa production, which can
account for as much as two-thirds of household income.
Cocoa Processors: The midstream counterparts in the processing segment dominate the
global supply chain of cocoa ingredients and are operational in both producer and consumer
countries. These lead firms are Barry Callebaut, Cargill and Archer Daniels Midland (ADM).
Brand Manufacturing Firms: Lead firms in the consumer markets such as Mondelez
International, Mars Inc., Nestlé, Ferrero and Hershey Co control high-value functions in brand
manufacturing and marketing.
Source: Authors.
This analysis examines the roles and relationships of the two groups of lead firms –brand
manufacturing firms and cocoa processors-, the source of their power and influence over the chain
and the implications of this for cocoa producers in developing countries.
Chocolate Production- Brand Manufacturing Firms
Global chocolate confection has become highly concentrated, controlled by just five
global brands: Mondelez International (15%), Mars Inc. (14%), Nestlé (12%), Ferrero (8%), and
Hershey Co. (7%) (Euromonitor, 2014). Together these companies account for 57% of the global
market.18 Each firm has an extensive network of manufacturing operations, as well as various brands
marketed in numerous countries around the world (see Table 2). Several of these brands gross
over US$1 billion in revenue annually (Euromonitor, 2014). For example, the leading brand,
Cadbury, owned by Mondelez International, is marketed in 41 countries, with an estimated US$6
billion annual global retail value (Euromonitor, 2014). It controls a remarkable share of the
chocolate confectionery markets in both developed and developing countries, such as: India (52%),
New Zealand (48%), South Africa (40%), Australia (36%), and the UK (24%) (Euromonitor, 2014).19
Overall in the industry, concentration is high; in some of the main markets, the top three firms
control as much as 60 to 80% (Euromonitor, 2012). With this strong market power, these firms
have formidable influence over the operations of the cocoa-chocolate value chain.
18 At the end of the 1990s, 17 firms controlled 50% of the global markets. This declined to 13 during the 2000s
(Dand, 1999; Fold, 2001). 19 Chocolate products manufactured by Mars Inc., the second largest brand manufacturer, are marketed in 80
countries under 29 brand names, including five of the billion-dollar global brands, namely, M&M’s, Snickers,
Galaxy/Dove, Mars, and Twix (OneSource, 2014). Kit-Kat, a major brand of Nestlé, is distributed in 62 countries
and annually generates nearly US$2 billion retail sales (Euromonitor, 2014).

The Philippines in the Cocoa-Chocolate Global Value Chain
16
Table 2. Global Chocolate Confectionery Markets and Key Brands
Company
Chocolate
Confectionery
Market
Top Five Brands
Brand Name
2013 Annual
Retail Sales
(US$ million)
# of
countries
marketed
Largest market
(US$ million)
Mondelez
International
75 Countries Cadbury 5,894 41 UK (2,465)
Milka 2,604 39 Germany (837)
Lacta 1303 6 Brazil (1,221)
Côte d'Or 600 10 France (296)
Alpen Gold 480 7 Russia (334)
Mars Inc. 80 Countries M&M's 3,092 65 USA (1,861)
Snickers 2,864 75 USA (1,154)
Galaxy/Dove 2,428 26 China (841)
Mars 1,722 59 USA (428)
Twix 1,220 64 USA (369)
Nestlé SA 76 Countries Kit Kat 1,890 62 UK (484)
Garoto 797 5 Brazil (722)
Nestlé 746 34 China (237)
Smarties 425 38 UK (132)
Especialidades 337 1 Brazil (338)
Source: (Euromonitor, 2014)
These firms derive power from their overall business portfolio in food and beverages,
which allows for large-scale cost efficiencies offered by economies of scope and
vertical-integration in confection. In addition to chocolate manufacturing, they typically operate
across many adjacent categories that use industrial chocolate, such as biscuits, bakery goods, and
beverages. Nestlé, the world’s largest food and beverage manufacturer, supports its product
portfolio with an extensive global presence, including 461 production facilities in 83 countries
(IBISWorld, 2014). Similarly, Mondelez International, operates across five consumer products,
manages a global network production and marketing infrastructure that incorporates 171
manufacturing facilities in 58 countries (OneSource, 2014). Besides the physical infrastructure,
brand manufacturers have mobilized remarkable workforce capabilities and sizeable annual research
budgets. Mondelez International’s research and development activities are carried out by 2,750 food
scientists, chemists, and engineers and was financed by a US$471 million budget in 2013
(OneSource, 2014). These scale economies remarkably lower average cost and create entry
barriers in these segments controlled by lead firms.
Intermediate Cocoa Processors Global supply chains for intermediate ingredients have become vertically integrated and highly
concentrated with a handful of trader-processor firms emerging. These firms draw on their internal
expertise and long-established capabilities in global supply chain management across multiple
commodities. In the cocoa sector, they operate vertically integrated supply chains that span from
the rural areas in cocoa producing countries to major portal cities housing advanced processing
facilities in Europe and North America. Once operated separately, between the 1970s and 2000,
trading and processing functions became increasingly integrated and began consolidating around a

The Philippines in the Cocoa-Chocolate Global Value Chain
17
small number of highly capable firms.20 By 2014, just three large trader-processors, Barry Callebaut
(23%), Cargill (15.3%), and ADM (now Olam)21 (12.7%), controlled approximately 51% of the cocoa
processed worldwide (Statista, 2014). Barry Callebaut cocoa is used in 25% of all consumer
products containing cocoa or chocolate (Barry Callebaut, 2016a).
Large cocoa processors leveraged long-established capabilities in management of global commodity
supply chains to solidify their competitive advantage in the cocoa-chocolate GVC. In particular,
internal expertise in logistics and bulk trade in grains was transferred to the cocoa sector. Beginning
in 1995, large processors started experimenting with containerized-bulk-cocoa transport (Dand,
1999). This new method resulted in major efficiency gains, lowering shipment costs by nearly 40%
(Dand, 1999; Tollens & Gilbert, 2003). By 1997, the transport cost was reduced to one-third when
mega-bulk shipment (bulk cocoa being loaded directly into the holds of specialized double-hulled
carriers) was introduced (Tollens & Gilbert, 2003). In effect, these developments galvanized further
consolidation in the chain because only a few large processors themselves were able to make direct
use of the mega-bulk shipment, requiring 3,000-10,000 ton minimum efficient scale (Dand, 2011).
Other exporters either had to use high cost traditional bag-based-export methods or to assign
their beans to one of these large firms. These large processors dictate where to establish their
operations, usually in the main cocoa producing countries in order to optimize transportation or
close to the end markets. For example, Olam has state-of-the-art cocoa processing factories turning
cocoa beans into liquors, butter and cake in Cote D’Ivoire, Nigeria, Ghana and Brazil and in
developed countries in Canada, Germany, Singapore, Spain, the Netherlands and the UK (Olam,
2017). Cargill has cocoa factories in Brazil, Ghana, Cote D’Ivoire, Indonesia, France, Germany,
Netherlands and UK (Cargill, 2017).
These processors have typically focused on the production of intermediary products with no
consumer-facing marketing activities. Nonetheless, in recent years, they have also moved into the
industrial production of chocolate. Barry Callebaut (40%) and Cargill (30%) together control 70% of
the industrial chocolate production in the open market (Statista, 2014). Under popular global
business-to-business brands, for instance, Barry Callebaut (Cacao Barry and other six brands),
Cargill (Gerken Cacao), and Olam (deZaan), cocoa processors supply industrial chocolate, as well
as cocoa powder, to customers such as specialty manufacturers, and artisanal producers, including
bakers, pastry chefs, hotels, restaurants and caterers (Euromonitor, 2012). Cargill has chocolate
production in Canada, US, Brazil, Belgium, France, Germany, the Netherlands and UK (Cargill,
2017).
Processors need to supply and respond to the demands of chocolate brand
manufacturers. With considerable purchasing power, together with inherent knowledge of the
cost structure of cocoa processing (Fair Labor Association, 2012), chocolate brand manufacturers
have developed strong price-negotiating positions with the larger trader-processors. They generally
require processors to report detailed information under specific supply contracts. The Nestlé
Cocoa Plan contracts, for example, representing 20% of cocoa volume Nestlé sources from Cote
d’Ivoire, requires contract suppliers to report on the volume, quality, and costs, as well as the
number of farmers trained (Fair Labor Association, 2012).
20 Between 1990-2000, the number of cocoa processors in Europe declined by more than 75%, falling from around
40 to just nine firms (Kaplinsky, 2004). 21 Olam International, a global commodity trader, acquired ADM’s cocoa business in 2015 (Olam, 2015).

The Philippines in the Cocoa-Chocolate Global Value Chain
18
Cocoa Bean Producers
By comparison, the upstream segment of the cocoa-chocolate GVC has a highly-
fragmented market structure. Cocoa production occurs on an estimated five million small
farms, producing cocoa on plots of 1-4 ha of land (ICCO, 2012). Local cocoa trade also involves
large number of local collectors or buying agents, often situated in captive relations or working on
commission for large traders.22 Income from cocoa farming is low. Since liberalization and the
dissolution of national marketing boards in producing countries, smallholder farmers have been
compelled to bear the increasing costs and risks of production. Farmers lost access to subsidized
inputs and services, including credit, extension, quality control and marketing. Expectation was that
removing the state would free the market for private actors to take over these functions—
reducing costs, improving quality, and eliminating inefficiencies. However, in most cases this did not
occur, leaving the majority of smallholders exposed to extensive market failures, high transaction
costs and risks, and service gaps (Barrientos, 2015; World Bank, 2008). As a result, cocoa farms
have since entered a period of perpetual underinvestment, decreasing productivity, and increased
incidences of pests and diseases. This has been an important contributing factor of the current
sustainability challenge (Barrientos, 2015).
Limited opportunities for farmers to increase value of their products. The structural
transformations described above in the mid- and downstream stages of the chain have created an
oligopolistic market for smallholders, who have experienced persistently declining cocoa prices and
a reduction in opportunities for value addition at the farm level (Barrientos, 2015). Furthermore,
critical quality control points gradually shifted from the farm gate to the processing stage, reducing
local buyer incentive to compensate farmers for better quality (Tollens & Gilbert, 2003). The
required scale of bulk transportation necessitated blending of variable-quality beans. Not willing to
sacrifice the cost advantage in transportation, large processors, instead, have developed internal
processing mechanisms to meet quality requirements of the downstream buyers (Tollens & Gilbert,
2003). These factors highlight the challenges for effective smallholder participation in the chain.
2.5 Standards & Certifications
In hopes to improve the returns for producers from participation in the cocoa chain, developing
country governments and producers alike have begun to turn to certifications for their products.
Fully understanding how certification schemes operate in the GVC, however, is important in
weighing whether the benefits outweigh the high costs. This section presents the evolution of
standards in the sector, highlights how different schemes affect market access and affect the bottom
line for producers.
Since the early 2000s, as in other high value agricultural products, different forms of standards
emerged in light of growing concern about the economic, social and environmental sustainability of
production in developing countries. These included industry codes of conduct, standard and
certification schemes, and multi-stakeholder initiatives (Bitzer et al., 2012). In particular, two key
factors drove the incorporation of standards and certifications into the cocoa-chocolate value chain:
First, the industry became the target of global campaigns by nongovernmental organizations
22 Total employment in the sector reaches approximately 14 million workers worldwide, with its three-quarter
concentrated in Africa (Abdulsamad et al., 2015).

The Philippines in the Cocoa-Chocolate Global Value Chain
19
(NGOs) and the media that made allegations of child labor and child trafficking on cocoa plantations
in West Africa (Schrempf-Stirling & Palazzo, 2013). The connection of valuable brands with child
exploitation posed serious threat to corporate reputation and sales(Schrage & Ewing, 2005).
Second, the internal threat to the sector in the form of farmer exit, low productivity, aging trees
and farmers, and a high incidence of pests and diseases fueled concerns over the future shortages of
cocoa supply (Barrientos, 2014, 2015; Barrientos & Asenso-Okyere, 2008)
Three main standards have emerged in the cocoa-chocolate GVC: Fairtrade, Rainforest Alliance,
and UTZ Certified, with a fourth, IFOAM also cited as an important certification for the sector
(Potts et al., 2014).23 These certifications are voluntary private standards, and producers can decide
whether or not to pursue these avenues for differentiation. The share of certified cocoa has
expanded dramatically over the past five years. Starting from a small base, mainly IFOAM and
Fairtrade, that accounted for less than one percent of global production in 2008 (KPMG, 2013;
Potts et al., 2014), the net volume of certified cocoa supply reached 22% of total production
worldwide in 2012 (Potts et al., 2014). 24 The rapid growth was fueled by industry corporate social
responsibility programs and UTZ and Rainforest Alliance NGOs, whose certifications expanded,
respectively, at compound annual growth rates of 363% and 223% between 2008 and 2012 (Potts et
al., 2014).
23 IFOAM works to ensure production relies on ecological processes, biodiversity and cycles adapted to local
conditions, rather than the use of inputs with adverse effects, certifying beans as organic. In 2011, 75% of IFORM
beans were sold as certified, amounting to 77,539MT of the 103,554MT produced (Potts et al., 2014). 24 This volume accounts for total certified production after adjustment for overlapping and multiple certifications
that together represented one-third of the total reported certified volume by the related organizations in 2012.

The Philippines in the Cocoa-Chocolate Global Value Chain
20
Table 3. Key Certifications: Volume of Certified Cocoa Produced and Sold by
Certification Scheme, 2012
Certification
Scheme
Production
(MT)
Bean Sales
by
Volume
(MT)
% Sold as
Certified
Certification key
objective
Companies
Committed
UTZ certified 534,614 118,641 22% Sets sustainability and
traceability standards that
stress the use of shade
trees, best practices for
drying and fermentation
and proper use of
fertilizer and pesticide
Barry Callebaut,
Cargill, Ferrero,
Hershey, Mars,
Mondelez, Nestlé,
and Olam
Rainforest
Alliance
405,000 205,784 51% Certification that seeks to
improve income and
promote sustainability by
setting minimum
production standards for
farmers
Nestlé, Ferrero,
Hershey, Barry
Callebaut, TESCO,
Mars, Olam and
Cargill
Fairtrade
International
175,900 68,300 39% Helping smallholders and
farmer associations
receive higher prices
from buyers while
promoting sustainable
development and growing
practices
Barry Callebaut, ,
Cargill, Ferrero,
Hershey, Mars,
Mondelez, Nestlé,
and Olam
Total * 1,219,068 470,264 -- -- --
Total Certified
(Adjusted for
multiple
certifications) **
890,000 300,000 33% -- --
*Totals include IFOAM data for 2011
**Almost one-third of total certified production represented overlapping certification. As reported by the
individual certification schemes, certified production approximately accounted for 30% of global cocoa production.
Adjusted production levels of certified cocoa amounted to 22% of global production.
Source: (Potts et al., 2014)
The global demand for certified cocoa, however, trailed far behind the available supply in 2012.
Although in some major markets, such as the UK, there was ten-fold growth in fair chocolate sales
between 2008 and 2010 (Barrientos, 2015), just one-third of the certified supply was actually sold as
certified (see Table 3). The effective global market share of certified cocoa still remains marginal,
just 7.3% of the estimated 4.1 million ton cocoa produced worldwide in 2012 (FAOSTAT, 2014;
Potts et al., 2014). Furthermore, the share of consumer price that accrues to a certified cocoa
producer is still marginally small, not much different from conventional cocoa (ITC, 2011). The
more significant benefits continue to accrue to the lead firms. Given the current low demand for
certified cocoa, the relatively low pay offs and at times high cost of certification – such as
investment in infrastructure, and traceability systems which is often born by the producers
themselves (KPMG, 2011), it is debatable whether the benefits outweigh the costs.

The Philippines in the Cocoa-Chocolate Global Value Chain
21
Several studies have indicated that even though the price received for certified cocoa may not differ
from commodity cocoa (ITC, 2011), participation in the certification process has important indirect
benefits – particularly with respect to farm productivity. Training to farmers, a criterion required by
certifying agencies, can help improve yields, given the absence of, or dysfunctional, extension
services (Kessler et al., 2012). One recent study by the Committee on Sustainability Assessment
(COSA) reports the differences observed across a number of indicators between certified and non-
certified cocoa and coffee farmers in 12 countries (COSA, 2013). Drawing on data points derived
from between 3,500 to 16,000 farm surveys per country, the study noted that certified famers
demonstrated better training in farming techniques, improved farm practices (soil and water
conservation, conserving biodiversity), higher yield (+14%) and a modest difference in net income
(+7%) (COSA, 2013).
Nonetheless, many of the leading brands have made certification commitments, often targeting a
specific percentage of cocoa-sourcing by 2020 (Barrientos, 2015). Five of the top ten chocolate
manufacturers, including Nestlé, Ferrero, Hershey and Mars have committed to buy 100% UTZ
certified cocoa by 2020 (UTZ, 2017). Mondelez International is already the leading buyer of
Fairtrade certified cocoa, and Mondelez brand, Cadbury, signed an agreement with Fairtrade in
November 2016 to improve the livelihood of cocoa farmers (Cadbury, 2016b; Mondelez
International, 2016). Even private label firms have committed to procure only certified cocoa; for
example, in July 2016, Tesco, the largest supermarket chain in Europe, announced that all cocoa
required for its private label chocolate products sold in the UK will be from Rainforest Alliance
certified sources by the end of 2018 (Tesco, 2016). At a national level, governments of the
Netherlands and Germany have also made serious commitments to sourcing certified cocoa
(Barrientos, 2015). With these major buyers signing on to almost exclusively source certified cocoa,
demand in the long term is poised to rise significantly and certification will no longer be a
differentiating factor in the industry, but a requirement for market access.
Box 4. Key Takeaways
Strong and rising global demand in the industry is a major advantage in the industry; however,
sustainable production is becoming more and more difficult. The consolidation of the mid- and
downstream segments of the value chain, with a very small number of companies dictating how
producers must cultivate their crops while using their economies of scale and scope to minimize the
price paid to producers, undermines smallholder participation. Despite high demand for chocolate,
producers often undertake higher cost production for a lower farm gate price. Furthermore, the
increased demand and commitment by lead firm to source only certified cocoa beans adds further
challenges for small producers.
At the same time, high levels of domestic production appear to be vital for driving downstream
production opportunities. Leading producing countries are strongly incentivizing ‘origin grindings’, which
ultimately could reduce global availability of raw cocoa beans. The opportunities in the short-term for
processing remain in the production of cocoa butter and powder and chocolate manufacturing. Large
processors and chocolate manufacturers with global operations dominate these segments; these firms
evaluate location decisions according to availability of supply of raw materials, costs of production, and
proximity to major markets.

The Philippines in the Cocoa-Chocolate Global Value Chain
22
3. The Philippines and the Cocoa-Chocolate Global Value Chain
The Philippines participation in the cocoa-chocolate GVC is limited, despite many competitive
advantages. The country has produced cocoa for centuries and has good climatic and geographical
conditions for its production. However, exports remain low; globally, the country ranks 72nd in
exports with a global market share of less than 0.01% (UNComtrade, 2016). In 2014, only eight
Filipino firms participated in the cocoa-chocolate GVC (PSA, 2007-2014).25 The growing global
demand discussed in earlier sections represents an opportunity for the Philippines to grow its
economy; however, it must first address important constraints along the value chain to ensure
efforts to promote the industry can provide for sustainable long-term engagement in the sector.
Production of cocoa beans and farm-level issues are the primary challenges to the Philippines’
participation in the cocoa-chocolate value chain, constraining upgrading into higher processing
stages. Production of cocoa beans is limited due to low quality seedlings, inefficient farm-level
processing techniques and limited access to capital and training for farmers. An aging farmer
population and younger generations seeking employment outside the agriculture sector further limit
production. These issues undermine the supply of cost-competitive raw cocoa beans for the
manufacturing segments (Field Research, 2016).26 Cocoa bean yields are well below the global
average and there are not enough domestic beans to justify either “origin grindings” for export or
even for the domestic market. As a result, grinding capacity is limited in the Philippines, and the
number of large scale grinding firms is shrinking. The primary role the Philippines has played in the
cocoa-chocolate GVC in recent years is as an importer of intermediate and final products for
domestic consumption.
This section seeks to further understand the depth and breadth of GVC participation in the
Philippines to provide a foundation for analyzing how the country can take advantage of available
opportunities. First, using trade and firm-level data, the current products and exports are examined.
It then outlines the structure of the industry and key firms active in the country at each stage of the
value chain. It concludes with advantages and constraints that will shape future participation in the
cocoa-chocolate GVC.
3.1 Current Participation in the Cocoa-Chocolate Global Value Chain
Despite a history of cocoa bean production dating back to the 17th century (Philippine Cacao,
2016), the Philippines’ current output is limited compared to other global and even regional players,
generating a total of just over US$24 million in exports in 2015 (UNComtrade, 2016). While
exports grew steadily over the last decade, increasing by 288% from 2005 to 2015, the nation’s
participation in the GVC remains small compared to other nations in the region. Table 4 details
these exports by value chain stage in both volume and value.27
25 Participation in the coco-chocolate GVC is defined as export sales over US$500,000. 26 Large-scale grinding operations require approximately 40,000 and 50,000MT of raw materials in order to
operate at competitive economies of scale (Field Research, 2016). 27 Table A-2 in the Appendix profiles top export destinations by GVC segment.

The Philippines in the Cocoa-Chocolate Global Value Chain
23
Table 4. Export Volume and Value of Philippines Cocoa Exports, 2005-2014
Category Export Value (US$, million) Export Volume (MT)
2005 2007 2009 2011 2013 2015 2005 2007 2009 2011 2013 2015
TOTAL 6.28 9.54 11.5 17.1 24.2 24.4 2.46 3.09 3.09 4.68 7.81 6.33
Cocoa Beans .09 .14 .72 1.33 2.00 5.84 53 75 259 425 2,235 1,912
Cocoa
Liquor/Paste
.28 .58 1.42 1.51 .43 .004 141 271 519 381 142 1
Cocoa Butter 3.25 3.21 3.06 5.19 4.03 3.30 940 720 549 1,183 918 561
Cocoa Powder .07 .05 .04 3.01 .13 .47 27 30 16 765 81 403
Chocolate 2.58 5.56 6.22 6.09 17.6 14.8 1,301 1,996 1,746 1,928 4,436 3,450
Source : UN Comtrade based on HS codes 1801, 1803, 1804, 1805, 1806. Retrieved on October 25, 2016.
The current position of Philippines in the cocoa-chocolate GVC is illustrated in Figure 11 by the red
rectangles. These are segments where 2015 exports were above US$1 million (UNComtrade,
2016). In addition, each segment includes the number of firms exporting over US$500,000. Overall,
few Filipino firms participate in the cocoa-chocolate GVC—only 8 firms reported exports over
US$500,000 in 2014 (PSA, 2007-2014).
Figure 11. Philippines Participation in the Cocoa-Chocolate GVC
Source: Authors
This section details this participation in the value chain, exploring recent trends in the Philippines in
three relevant segments: production of cocoa beans, mid-stream processing and chocolate
manufacturing.

The Philippines in the Cocoa-Chocolate Global Value Chain
24
Production of Cocoa Beans: Production peaked in the 1990s at 35,000 tons and has since
declined due to aging trees, depressed producer prices and climatic conditions. As a result, by 2015,
the Philippines produced only 6,020 tons of cocoa beans (Field Research, 2016). Statistics on
production are inconsistent. Industry players estimate production to be between 10,000 to 12,000
tons (Field Research, 2016). However, the Philippine Statistical Authority (PSA) places the number
lower, reporting approximately 6,000 tons in 2015 (PSA, 2016).
Production data indicates constant harvest despite increases in production area by over 3000 ha
from 2005 to 2015 (see Figure 12). Yields grew marginally at the beginning of this period, increasing
from 530 kg/ha in 2005 to 538 kg/ha in 2009, but subsequently declined, with yields of 433 kg/ha
reported in 2015 (PSA, 2016). Declines in productivity could reflect planting of new trees that are
not matured; however, numbers over the last decade all indicate the Philippines is well below global
productivity standards of 800-1,000 kg/ha (Fernandez-Stark & Bamber, 2012). Current initiatives as
part of the harmonized industry road map seek to increase production to 100,000MT by 2022
(Philippine Cacao, 2016). However, it is too early to determine the effectiveness of programs
designed to help reach this goal.
Figure 12. Philippines Cocoa Bean Production, 2005-2015
Source: Philippine Statistical Authority based on Cacao production. Retrieved on January 5, 2017.
The primary variety of cocoa bean grown in the Philippines is Trinitario, accounting for nearly 80%
of all beans (Field Research, 2016). Trinitario beans, a mid-value hybrid bean, have a higher
resiliency than the Criollo variety, and a higher quality and taste characteristics than Forastero
beans (see Box 2). Geographically, the production of cocoa beans is highly concentrated. Mindanao
accounts for 90% of cocoa bean production in the country, with almost 80% of production
occurring in the Davao region. However, production is expanding to new areas (Field Research,
2016).
0
100
200
300
400
500
600
0
2000
4000
6000
8000
10000
12000
14000
16000
2005 2006 2007 2008 2009 2010 2011 2012 2013 2014 2015
Yie
ld (
kg/H
a)
Are
a a
nd
Pro
du
cti
on
(h
a,
MT
)
Area (Ha) Production (MT) Yield (kg/Ha)

The Philippines in the Cocoa-Chocolate Global Value Chain
25
Smallholders are the primary growers of cocoa beans in the country, accounting for over 90% of
production (Field Research, 2016). No official census of the number of cocoa bean farmers exists,
however, industry experts estimate 10,000 to 15,000 cocoa bean growers cultivate an aggregate
area of 11,200 ha or 3.88 million trees (Philippine Cacao, 2016). This is equivalent to an average of
0.9 ha or 346 trees per farmer. At an average production of 510 kg/ha, each grower harvests 454 kg
per year (DA-HVCDP, 2016; Field Research, 2016; PSA, 2016).28
Most locally produced cocoa beans are used domestically in the production of tablea and artisanal
chocolate,29 with little available for commercial grinding. The Philippines exported only 1,912 tons in
2015, although in value terms, cocoa beans exports grew considerably over the past decade, from
almost no exports in 2005 (less than US$100,000) to nearly US$6 million in 2015 as a result of
rising global prices (UNComtrade, 2016). Interestingly, the Philippine’s increase in export value is
the result of both increased export volumes and increased unit value (UNComtrade, 2016). Cocoa
bean exports go mainly to regional countries. In 2015, 99% of all cocoa beans went to Malaysia and
Thailand (UNComtrade, 2016). The export of cocoa beans is concentrated with only four firms
exporting cocoa beans more than US$500,000 in 2014 (PSA, 2007-2014). The largest export firms
involved in cocoa bean export are Kennemer Foods International, with an estimated 2,000 tons in
exports per year, Casco Commodities with an estimated 1,500 tons in exports, and Chokolate de
San Isidro with an estimated 500-700 tons in exports per year (Field Research, 2016). These
numbers, however, reflect higher export volumes than those reported in UN Comtrade, making it
difficult to corroborate firm information.
Mid-Stream Processing: With a lack of domestic supply of cocoa beans, and consolidation of this
node of the GVC at the global level, the number of firms who do large scale grinding in the country
has dropped. In the 1990s, 13 firms had grinding operations in the Philippines; by 2005, the number
decreased to just three: Commonwealth Foods, Nestlé, and Cocoa Specialties (Field Research,
2016). By 2015, only two large-scale grinders were operating in the Philippines:30 Commonwealth
Food and TP Food. Commonwealth Foods imports its beans, as does TP Food, although the latter
continues to buy some local beans. TP Foods relies on Indonesia for its beans source; Indonesian
beans have increased in costs since the country implemented an export tax in 2010 (see Section
4.2)(Field Research, 2016). As firms reduced their local capacity, exports of cocoa liquor and paste
have also been reduced to insignificant levels; in 2015, the country exported just US$4,000 in this
product category (UNComtrade, 2016). 31 Only one firm exported cocoa butter at amounts above
US$500,000 in 2014. Exports from cocoa butter totaled US$3.4 million in 2015 with exports going
to major chocolate producers in the US and Western Europe (UNComtrade, 2016).
28 The Department of Agriculture’s High Value Commercial Crop Development Program estimates that the 2013
farm gate price of PHP 65/kg (US$1.31) resulted in annual gross earnings of PHP 29,500 (US$596.15) per farmer
(DA-HVCDP, 2016) Comparatively, in 2013 palm oil had a farm gate price of PHP 3.86/kg (US$0.08) and Robusta
coffee’s farm gate price was PHP 67.84 (US$1.37) (PSA, 2016). 29 Some chocolate makers, like Antonio Pueo, and several tablea firms have small grinding operations in the
Philippines. 30 Since 2005, Cocoa Specialties closed their grinding operations and Nestlé closed their grinding group. They now
buy only powder (Field Research, 2016). 31 In the Philippines, most cocoa bean production goes towards domestic consumption in the form of chocolate
and tablea. Tablea is a traditional Filipino product made cocoa beans that are roasted, ground and molded nibs of
fermented pure (100%) cocoa beans. No official data on production is available, but industry experts estimate
production to be less than 1,361 tons annually (Field Research, 2016).

The Philippines in the Cocoa-Chocolate Global Value Chain
26
Chocolate Production: Chocolate exports, although minimal, at just US$17 million in 2015,
accounted for the Philippines’ most significant participation in the GVC (UNComtrade, 2016). The
largest buyer of Philippine chocolate in 2015 was the US, buying over half of all exports. The bulk of
these exports are from the top five firms, which together account for 94% of all chocolate exports
(PSA, 2007-2014).32 Notable exporters include Universal Robina, Malagos Agri-Ventures, Antonio
Pueo, Kablon Farm Foods, Dalareich Food Products, and Chokolate de San Isidro (Field Research,
2016). However, generally speaking, these chocolate exporters do not source inputs from local
suppliers. Rather they prefer to use imported powder and beans compared to domestic supply
because of issues with supply quantity (Field Research, 2016). Although several MNCs have
operations in the Philippines, these are import-based operations to serve the local market.
Chocolate demand in the county is high (see Box 5) and is served by many local and global
companies. The strong local demand can serve as a driver for export capabilities by spurring
investments in the industry.
Box 5. Strong Domestic Demand: A Potential Development Ground for Export
Capabilities
Domestic demand for chocolate is increasing, mirroring the global trend. Table 5 shows the steady retail
growth of chocolate in the internal market since 2011. Demand is highest from October to February,
largely due to holidays where chocolate consumption is customary. These months of increased demand
correlate with harvest seasons. Philippine consumers prefer imported chocolate products, but
increasingly domestic firms have been able to differentiate their products and increase demand by
promoting single-origin chocolates to consumers (Euromonitor, 2016a). Chocolate consumption is
varied with most sales (54.14% of total chocolate sales in 2015) from countlines- boxed chocolate in
individual packages for resale at retail locations. Chocolate bars and chocolate pouches -individual sized
candies packaged for home consumption, are the next largest retail categories are also high selling
categories with 21.5% and 17.6% respectively (Euromonitor, 2016a).
Table 5. Retail Sales of Chocolate in the Philippines by Category, 2011-2015
Category Sales (US$, millions)
2011 2012 2013 2014 2015
Total Chocolate Confectionery 231.3 242.5 261.7 287.3 306.3
Chocolate Pouches and Bags 45.4 46 46.8 50.1 54.1
Boxed Assortments 22.1 20.8 21.1 21.61 22.4
Countlines 106.4 117.1 133.5 152.8 165.8
Chocolate Tablets or Bars 57.5 58.6 60.4 62.8 65.9
Source: (Euromonitor, 2016a)
Note: Conversion to US$ is based on an exchange rate of PHP 49.77 per USD
The country is a net importer in all segments except cocoa beans (see Table 6). Imports to the nation
grew 210% between 2007 and 2015. Chocolate and cocoa powder imports both increased by 261% and
255% respectively from 2007 to 2015 (UNComtrade, 2016). Growth in these sectors reflects strong
local demand for finished goods and a lack of local processing capacity in mid-stream stages of the value
chain.
Cocoa powder is also concentrated and regionally focused, with 85% of cocoa powder coming from
Malaysia, Indonesia, and Singapore in 2015 (UNComtrade, 2016). Chocolate is less concentrated with
the top three sourcing nations accounting for 52% of all Philippine exports.
32 27 firms registered chocolate exports in 2014 but only 3 exported over US$500,000.

The Philippines in the Cocoa-Chocolate Global Value Chain
27
Table 6. Philippines Cocoa-Chocolate GVC Import Value, 2007-2015
Category Import Value (US$, million) Share of Total Cocoa Import
2007 2009 2011 2013 2015 2007 2009 2011 2013 2015
TOTAL 42.6 58.7 106.0 82.9 132.0 -- -- -- -- --
Cocoa Beans .17 .05 1.07 .58 .88 0.41% 0.08% 1.01% 0.70% 0.66%
Cocoa Liquor/Paste 5.8 10.1 17.9 1.9 0.8 13.6% 17.2% 16.9% 2.34% 0.59%
Cocoa Butter .33 .52 1.53 .83 0.21 0.76% 0.89% 1.44% 1.00% 0.16%
Cocoa Powder 11.9 21.3 54.7 41.0 42.1 27.9% 36.3% 51.6% 49.4% 31.9%
Chocolate 24.4 26.7 30.9 38.6 88.1 57.4% 45.5% 29.1% 46.5% 66.7%
Source: UN Comtrade based on HS codes 1801, 1803, 1804, 1805, 1806. Retrieved on October 25, 2016.
Note: Data on the Philippines’ 2005 cocoa imports are not available in the UN Comtrade database.
3.2 Key Firms & Industrial Organization in the Philippines Cocoa-Chocolate
Sector
Securing cocoa beans is a major requirement for participation in the cocoa-chocolate GVC in the
Philippines. Cocoa bean aggregators and exporters are the main coordinators of the industry and
have most of the power compared to smallholder producers which are largely fragmented. Cocoa
bean aggregators use a variety of sourcing methods to supply beans including contract growing,
open market buying, and managed farms.
The largest cocoa bean exporter by volume in 2015 was Kennemer Foods International (KFI) (Field
Research, 2016). KFI, a Dutch owned company, gets cocoa beans through contract growing
covering 2,000 ha, open market buying and managed farms. Under the contract growing approach,
KFI sells cocoa bean growers the necessary inputs and seedlings and offers guaranteed buy-back
contracts and training to increase yields and quality (Bakker, 2015). It also offers financial assistance
when needed for farm improvements. On the open market, KFI purchases wet and dry beans at
various buying stations and post-harvest facilities in the country. Finally, the firm operates company
farms, hiring workers to cultivate cocoa beans and engaging in revenue sharing programs (Sun Star
Davao, 2016). Many of Kennemer’s exported cocoa beans go to Malaysia, Singapore and Indonesia.
In addition to cocoa bean export, Kennemer partners with the global chocolate manufacturer- Mars
in the country (Field Research, 2016). Casco Commodities, another cocoa bean exporter, primarily
supplies European markets primarily and partners with the global processor Barry Callebaut (Sun
Star Davao, 2016).
Aggregation for export remains difficult; local farmers prefer to sell their beans for domestic use
rather than export due to higher domestic prices. The estimated 2016 global market price for
cocoa beans is approximately PHP 140/kg (US$2.81) but local buyers will buy cocoa beans at PHP
150-160/kg (US$3.01-3.21), depending on the quality and grading of the bean (Field Research, 2016).
3.3 Advantages and Challenges for Upgrading in the Philippines
The Philippines participation in the cocoa-chocolate GVC is small but growing. Increased
participation is possible due to several advantages, including favorable environments for bean
production across the country as well as its strategic location close to emerging consumer markets

The Philippines in the Cocoa-Chocolate Global Value Chain
28
throughout Asia. However, the nation must address issues of low cocoa bean productivity and lack
of coordination among value chain actors before moving to processing stages of the value chain.
3.3.1 Advantages
The Philippines’ most pronounced strengths in the cocoa-chocolate GVC relate to the geographic
conditions that allow the growth of higher value cocoa beans across the nation. The most
prominent include the following:
1. Geographic conditions provide large potential production area. Cocoa beans may be
widely produced in the Philippines and do well as intercrops (Field Research, 2016). The majority of
production occurs in the southern island of Mindanao, but increasingly production is spreading to
other parts of the nations (Field Research, 2016). The climate, rainfall, and average temperature of
the nation promote cocoa bean growth. Furthermore, these conditions are present across the
nation and not concentrated in select areas. ICCO estimates that the entire nation falls within the
geographic area where cocoa production is possible (ICCO, 2017b). Furthermore, as a shade crop
cocoa does well in intercropping schemes with many other agricultural products of the Philippines,
such as coconuts and bananas.
2. Ability to grow all of the three main cocoa bean types. The majority of cocoa beans are
mid-value, Trinitario beans. All of the three varieties of beans are present and grown in the nation,
though Trinitario beans are the most prominent. Criollo beans are mainly from older trees that are
lower yield but are still produced. Higher value varieties of Forastero beans are beginning to be
planted on some farms (Field Research, 2016). The suitability of the country for diverse types of
cocoa beans helps in diversification efforts and will minimize the risks and challenges associated with
planting only one variety. A strong focus on Trinitario beans in expansion initiatives could be
sufficient to make the nation competitive on the global market.
3.3.2 Challenges
The Philippines’ competitive challenges in the cocoa sector are especially formidable in upstream
segments of the chain. The lack of an adequate local supply of cocoa beans has undermined the
processing segment and led to several operations shutting down. Downstream firms cite the lack of
stable production as a major constraint preventing growth or entry into export markets. The
following section outlines the most prominent constraints.
1. Lack of modern production operations in agriculture. The agricultural stage of cocoa
production in the Philippines is plagued by numerous issues, which have undermined its growth and
further participation in the GVC. The industry is dominated by aging, smallholder producers on
small plots of land using outdated farming techniques. The average age of Filipino farmers is 57
(DAR, 2013). Consequently, many are hesitant to adopt new technologies because of the limited
time to see returns on investment. Incomplete land reform programs mean that many farmers do
not yet have titles to their land, and thus have no collateral to obtain the loans necessary to
implement more modern agricultural techniques to improve farm yields and minimize post-harvest
loss (Field Research, 2016).33 As a result, some farmers lack the capital to upgrade to modern
33 Estimates suggest that for every hectare you need approximately PHP 80,000 (US$1606) to initiate the planting
of cacao, and an additional PHP 30,000 (US$602) each additional year to maintain the land (Field Research, 2016).

The Philippines in the Cocoa-Chocolate Global Value Chain
29
farming techniques including securing proper fertilizers or seeds. Others are reluctant to change
farming techniques from traditional modes (Field Research, 2016). Many farms thus are not
implementing advanced-farming techniques. No official statistics are available, but industry
association representatives estimate that only 20% of cocoa farmers have shifted to new
technologies to help increase productivity (Field Research, 2016).
Uptake of certifications has also been low, due to the high associated costs, despite the accelerated
tendency in the global market to source only from certified operations. Few operations are
certified, one of the more notable firms to have certification is Chokolate de San Isidro (DTI-BOI,
2016; Field Research, 2016). The DA promotes its own GAP practices for cocoa but farmers also
struggle to produce the capital needed to achieve and maintain these certifications.
2. Lack of economies of scales. Production is fragmented among many small farmers creating
problems of access to markets and decreasing bargaining power. It is estimated that in the
Philippines there are among 10,000-15,000 cocoa bean farmers. There are some cooperatives in the
country that are coordinating efforts to reduce transaction costs. However, one of the main
concerns is that side-selling threatens value chain coordination efforts. It is difficult for cooperatives
to achieve quantities needed to meet contracts because farmers often sell on the side cocoa beans
to traders who offer higher prices or will buy unfermented beans giving farmers quicker access to
cash. As a result, farmer associations, who are the principle organizers of farmers, are limited in
their ability to aggregate harvest and implement new post-harvest techniques that can improve the
quality and quantity of output in production.
Membership in farmer associations is low compared to other nations. One of the larger associations
in the nation Subasta Integrated Farmers Multi-Purpose Cooperative has over 100 members (Field
Research, 2016). Cocoa cooperatives in other producing countries are much larger. For example
CONACADO, a cooperative in the Dominican Republic has approximately 10,000 members
(Fernandez-Stark & Bamber, 2012). Subasta sells through exclusive buying contracts, open markets
and under their own product line (Field Research, 2016).
3. Underdeveloped post-harvest fermentation and drying techniques lead to reductions
in quality and amount of beans suitable for processing. Proper fermentation and drying is
essential for protecting the quality of the cocoa bean and preventing post-harvest losses. This
increases the selling price for farmers; unfermented beans sell for PHP 40-60/kg (US$0.80-1.20)
compared to the fermented beans selling price of PHP 140-190/kg (US$2.81- 3.81) (Field Research,
2016). However, access to equipment for drying, such as solar dryers, is limited, despite some
increases through cocoa revitalization programs.
4. GVC actors lack coordination. While there are a number of programs and initiatives
underway to support the growth of the cocoa sector, these efforts not aligned. The lack of
coordination occurs both among government actors as well as industry associations in the
Philippines. Table 7 highlights the range of public stakeholders that are engaged in the industry.

The Philippines in the Cocoa-Chocolate Global Value Chain
30
Table 7. Key Stakeholders Engaged in the Cocoa-Chocolate GVC
Actor Description Role
Department of Agriculture
(DA)
Public sector unit responsible for developing
and implementing agricultural policy in the
industry
Provides technical assistance and
other support to smallholders in
the country; carried out a road-
mapping exercise for the cocoa
industry in 2012
Department of Agriculture,
High Value Crops Development
Program (DA-HVCDP)
Program is designed to work closely with
private sector, particularly smallholders and
farmers
Through the provision of
extension services, goals include
food security, expansion of
private sector investment and
income as well as improved
production techniques. Cocoa is
a priority commodity
Department of Science and
Technology (DOST)
Government agency that promotes and
assists with, scientific and technological
research and development in areas identified
as vital to the country's development. It also
facilitates technology transfer in the
Philippines
Helps in research and
development as well as the
transfer of new production
inputs and techniques to
improve producer
competitiveness via PCAARRD34
Department of Trade and
Industry (DTI)
The Board of Investments, reviews and
approves applications for investment
incentives for the industry
Coordinating agency of technical
working groups to overcome
industry-binding constraints,
DTI-Davao is leading
implementation of the
harmonized roadmap
CIDAMI Local NGO that links private and
government sectors, non-government
organizations, and all cocoa stakeholders
across Mindanao and expanding to rest of
nation
Provide knowledge, technical
assistance, and relevant key
information to all value chain
actors
ACDI/VOCA International NGO focused on improving the
livelihoods of poor in developing countries by
connecting them with international markets
Lead of the MinPACT project
focused on coffee, cacao and
coconut.
Philippine Council for
Agriculture and Fisheries
(PCAF) Sub-Committee on
Cocoa
Sub-committee of the DA that focuses on
growing and promoting the cocoa industry by
bringing together actors across the value
chain
Convenes the private sector to
discuss how to develop,
recover, and grow the cacao
industry through strategic policy
interventions
CocoaPhil Local NGO that links farmers, processors,
buyers and others to promote integration
and sustainable development of the cocoa
sector
Provides data, technical
assistance, technology
promotion, and operates post-
harvest centers as part of
training program for farmers
Source: Authors
Government Coordination: The DA and the DTI are both undertaking efforts to strengthen the
Philippines position in the cocoa-chocolate GVC; however, they do not have a united strategy to
upgrade the sector. DA initiatives have been focused on improving production and DTI efforts have
34 PCAARRD (Philippine Council for Agriculture, Aquatic and Natural Resources Research and Development) is a
council under DOST that formulates policies, plans, projects, and strategies for S&T development in the
agriculture, forestry, aquatic and natural resources sectors

The Philippines in the Cocoa-Chocolate Global Value Chain
31
focused in the processing sector. With limited coordination duplications of effort or plans that are
contradictory arise. Processors, for example, rely on imports from abroad due to lack of local
production, which are often much cheaper than those in the Philippines. Attempts at collaboration
exist, such as the recently harmonized road map, but disparate bodies continue to struggle to
collectively promote the industry (Field Research, 2016).
Industry Association Coordination: Two major industry associations help coordinate the industry
and link actors along the value chain: CocoaPhil and CIDAMi. Both were established in the recent
resurgence of the industry but operate as separate entities.
In 2003, after a period of decline, the Philippine government secured a grant from USAID to
organize the Cocoa Foundation of the Philippines (CocoaPhil) to reestablish participation in the
sector (Field Research, 2016). CocoaPhil currently runs trainings and research for new end
products for cocoa supplies. It also buys beans in its Cacao Agri-Business Zones located in Davao
City, Compostella Valley and Zamboanga Del Norte. Beans are used for training and postharvest
technology research via collaborations with the Department of Agriculture.
Following the establishment of CocoaPhil, the United States Department of Agriculture (USDA)
funded the Success Alliance Project which sought to increase competitiveness in cocoa, coffee, and
coconut by improving post-harvesting systems and handling practices. ACDI/VOCA, an
international economic development organization with expertise in agriculture implemented the
project in Mindanao. In addition to initiatives focused on increased value capture for farms by
building solar dryers in cocoa farms, ACDI/VOCA also helped establish the Cacao Industry
Development Association of Mindanao, Inc. (CIDAMi). CIDAMi, an advocate for the cocoa industry
in Mindanao, convenes actors along the value chain to increase the competitiveness of Mindanao in
cocoa. It is now expanding outside of Mindanao (Field Research, 2016).
The goal of both groups is to harness its convening power to grow the cocoa industry. However,
they often do not collaborate, creating inefficiencies in the industry. Furthermore, without a unified
plan, duplication and inconsistencies arise. More coordination between the actors would help create
efficiencies.
4. Upgrading: Lessons for Philippine Upgrading from Global Experiences
In order for the Philippines to successfully establish a position for itself as an integrated player in the
cocoa- chocolate global value chain, it needs to upgrade its current operations in the industry. By
adopting new technologies, producing a new product or engaging in an entirely new set of activities,
upgrading can also allow actors in the GVC to capture greater value from their participation
(Humphrey & Schmitz, 2002). In agribusiness chains such as cacao, this can be achieved in a number
of different ways; for example, by improving the agro practices to cultivate cacao; introducing new
technologies such as irrigation; or moving to processing stages of the chain such as cocoa liquor and
cocoa butter. Due to the growing sustainability challenge in the industry, process upgrading in the
agricultural production segment – that is increasing productivity has been a central challenge for
most countries. International demand is high and cacao-producing countries all have in place special
programs to increase agricultural productivity. These programs are not only led by country
governments, but also by firms and NGOs. Table 8 summarizes the key upgrading trajectories that
have typcially been pursued by countries in the cocoa GVC.

The Philippines in the Cocoa-Chocolate Global Value Chain
32
Table 8. Selected Upgrading Strategies in the Cocoa-Chocolate GVC
Upgrading
Trajectory
Description
PROCESS
UPGRADING
(AGRICULTURE)
Primarily focused on increasing the quantity of beans harvested from the trees. Replacing aging trees can
considerably increase production; improved fertilizer and irrigation techniques, pruning and weed control
as well as shade coverage can also all boost production. Achieving this upgrading requires access to
training to familiarize producers with new production methods and affordable finance to support the
integration of new techniques into the production operations.
Example. In 2012, ten of the leading cocoa processors and chocolate brand manufacturers (developed
country firms) agreed on sharing GAPs to meet growing demand and address declining productivity.
Mondelez International, the world’s largest chocolate manufacturer, has committed US$400 million to
cocoa sustainability programs in six nations: Ghana, Cote d’Ivoire, Indonesia, the Dominican Republic,
India, and Brazil; the goal is to work with as many as 200,000 cocoa farmers by 2022.
Example. Between 2009 and 2012, several companies together with CONACADO, the national
confederation of cocoa producers in the Dominican Republic launched an initiative to increase
productivity via the rehabilitation and rejuvenation of cocoa plantations. Even before new plants reached
maturity, the introduction of organic fertilizer, weeding and pruning had boosted output by up to 77%,
increasing productivity to competitive global levels (Fernandez-Stark & Bamber, 2012).
PRODUCT
UPGRADING
(AGRICULTURE)
Shifting into the production of fine cocoa beans; these include replacement of regular varieties for higher
value ‘fine’ cocoa variety as well as improving the quality of production of regular cocoa beans. These
cocoa beans yield higher returns on average than commodity cocoa beans.
Example. Capitalizing on the growing demand for premium chocolate, Ecuadorian farmers shifted
production to fine or flavored cocoa beans, known as cocoa Arriba. Because of its high quality and unique
taste profile it is able to obtain above market prices and is used in niche chocolate manufacturing. In
2012, the government established a national program dedicated to increase yields via industrialization and
increased production. It now supplies over 65% of all Arriba cocoa consumed globally (Nestle, 2012).
INITIATION OF
ORIGIN
GRINDINGS:
FUNCTIONAL
UPGRADING
Installation of roasting and grinding operations, allowing for in-country intermediate processing and value
addition to cocoa beans. Traditionally, cocoa beans have been harvested, fermented and dried before
being shipped in bulk to processing facilities in developed countries. Increasingly, cocoa producing
countries are providing primary processing before shipping. On average, over the past ten years, the value
of 1kg of cocoa paste exports has been 16% higher than the value of 1kg of cocoa beans.
Example. In Cote D’Ivoire, the government instituted tax incentives for grinders to establish operations in
the country in the 1990s; these were in place for 20 years until 2012 (Monnier, 2015). By 2016, 12
grinders with 720,000T of capacity were operating locally, of which market leaders Barry Callebaut, Olam
International, Cargill and Cemoi are the largest (Aboa & Kpodo, 2016). New policy initiatives include tax-
incentives for grinders expanding their capacity, and a secondary market limiting access to the mid-crop
to locally based grinders to improve their competitiveness (Monnier, 2016). In addition, the country is
implementing export taxes on unprocessed and early-processed products to try and drive upgrading into
even higher stages of the chain (Monnier, 2016). The country aims to process 50% of the country’s output
by 2020.
COCOA
BUTTER
PRODUCTION:
FUNCTIONAL
UPGRADING
Initiation of the production of cocoa butter. This mid-stream value chain activity adds value to
intermediates in the cocoa-chocolate global value chain. Adding pressing functions require a high
investment in sophisticated equipment, skilled labor to run and manage the machinery. It also consumes
high levels of energy.
Example. Indonesia became the world’s third largest producer of cocoa beans during the 1980s and 1990s.
In 2010, the government led an initiative to add value to production by implementing an export tax on
unprocessed beans of between 5-15% depending on the world prices. Between 2009 and 2012, processing
capacity doubled; investors included domestic and regional grinders. Subsequently, global processors
Barry Callebut and Cargill made large-scale investments in grinding and cocoa butter operations in the
country, and began to link these with industrial chocolate operations supplying Indonesian food and
beverage manufacturers serving the domestic and regional markets (Barry Callebaut, 2016b; Cargill, 2014).
In 2010, the country exported US$260 million in cocoa butter and after the export tax on unprocessed
beans, the cocoa butter exports increased to almost US$800 million in 2015.
Source: Duke CGGC.
The potential upgrading trajectories open to a country at any one time, however, depend on the
country’s specific position in the value chain, a wide range of institutional factors, including
infrastructure, the business environment, and trade and investment policy and importantly, the

The Philippines in the Cocoa-Chocolate Global Value Chain
33
governance structure of the chain (Bamber et al., 2013; Gereffi et al., 2005). For example, functional
upgrading- incorporating additional functional activities of the chain (e.g. moving into roasting or
branding activities), while a highly sought after trajectory by developing countries, is often difficult
for them to pursue because there tend to be higher barriers to entry in the higher-value stages of
GVCs due to higher capital, skill and raw material requirements on the supply side and
concentrated markets on the buy side. In developing countries, product and process upgrading can
be more attainable as short to mid-term goal since they often require relatively minor investments
in skills, equipment, or adjustments to the production process. In analyzing different prospective
paths to upgrading in the cacao industry that could be pursued by the Philippines, it is therefore
useful to look more in depth at specific country examples from countries at similar levels of
development and facing similar questions of how to upgrade in the cocoa-chocolate GVC.
The upgrading experiences of two countries, Ecuador and Indonesia, are thus examined. Each
represents a successful case of the principal upgrading trajectories followed in the industry. Ecuador
represents a case of process and product upgrading. Beginning in the 2000s, the nation improved
productivity in cocoa beans. It also began focusing on higher value production, including single origin
chocolate of fine flavor cocoa beans to increase value addition. Indonesia, on the other hand,
represents a case of functional upgrading. Through policy interventions, Indonesia is promoting the
move from exporting cocoa beans to processing beans in country. Both Ecuador and Indonesia
offer insights for the Philippines on how to upgrade in the cocoa-chocolate GVC. Table 9 highlights
key indicators in the industry for each nation.
Table 9. Selected Indicators Related to the Cacao Sector in Ecuador, Indonesia,
and the Philippines
Indicator Ecuador Indonesia Philippines
GDP/Capita (2015, Current US$) World
Bank
US$6,205.10 US$5,814.80 US$2,904.10
Cocoa Bean Production Volume
(2014/2015) (ICCO)
250,000 MT 325,000 MT No data
Cocoa Bean Exports Volume (MT, 2015)
(UNComtrade ) 220,286 58,297 1,912
Primary Export Product (2015)
(UNComtrade)
Cocoa Bean Cocoa Butter Chocolate
Cocoa Bean Exports (US$, 2015)
(UNComtrade)
694,130,613
180,339,289.00 5,843,016
Unit Value Cocoa Bean Exports (US$/kg)
(UNComtrade)
US$3.15 US$3.09 US$3.06
Source:(ICCO, 2016b; UNComtrade, 2016; World Bank, 2016)

The Philippines in the Cocoa-Chocolate Global Value Chain
34
4.1 Ecuador—Increasing Value by Process and Product Upgrading
In 2015, Ecuador was the 3rd largest exporter of cocoa beans in the world by value and 4th largest in
volume, exporting 220,300 tons (UNComtrade, 2016).35 It is currently the largest exporter in Latin
America, surpassing traditional export markets in the region such as Brazil, Peru, and Colombia
(USDA, 2015). Cocoa beans are a key contributor to export revenue, and represent approximately
4% of the country’s total exports (UNComtrade, 2016). Ecuador is the world’s largest producer of
“fine or aromatic” cocoa, and accounts for about 60% of global exports of this higher value crop
(Hernández et al., 2014).
Ecuador’s participation in the cocoa-chocolate GVC is almost exclusively as an exporter of cocoa
beans. Of the estimated 255,000 tons produced in 2015, approximately 88% were exported as
fermented and dried (USDA, 2015). Only 12% is processed domestically and the grinding capacity in
the country is very small. Just 2% of cocoa goes into chocolate production and only 1% of that
chocolate is exported (Bain & Company, 2015). Like the Philippines, cocoa production can occur in
almost all parts of the country, with the exception of the highlands area (Kooij, 2013). Furthermore,
production of cocoa occurs on small and middle-sized farms (Nestle, 2017). Smallholders produce
about 90% of Ecuador’s total cocoa bean output. On average, these smallholders cultivate 2 ha/farm
in the mountains and 10 ha/farm at the coast (Cepeda et al., 2013).36
Ecuador’s upgrading in the cocoa-chocolate GVC can be divided into two key trajectories: (i)
Process Upgrading: increased productivity of cocoa beans; and (ii) Product Upgrading: focus on
higher quality to increase selling price. As part of its focus on increased productivity and quality,
Ecuadorian farms are pursuing several certifications for sustainability. The country is also seeking
denomination of origin certification for the “Arriba” variety of coca bean, as well as for single
source cocoa. These branding efforts, although still pending their outcomes, will support the
country’s product upgrading. The two trajectories Ecuador followed to increase competitiveness
are examined in further detail below.
(i) Process Upgrading for Increased Productivity: Production in Ecuador has been consistently increasing
since 2008 (USDA, 2015). Production increased 154% from 2008 to 2014, growing from 94,300 to
240,000 tons (USDA, 2015). Exports also rose in this time period (see Figure 13); increasing by
approximately 363% in value and 154% in volume between 2005 and 2015 (the largest gains
occurred after 2010) (UNComtrade, 2016). Increases in production, and consequently exports,
reflect the results of several different programs, although two stand out - the National Cocoa Plan,
and Nestlé’s Cocoa Plan. These programs worked closely with small and medium farms to replace
older plantations with lower productivity and expand production areas while simultaneously
improving quality (Cepeda et al., 2013; USDA, 2015).
In addition, there has been a drive towards international certification, that has helped promote sales
and capture value, as well as improve the sustainability of the industry. Ecuador is working on
increasing the amount of certified growers in the country to match global demand for sustainably
sourced cocoa (Potts et al., 2014). In 2012, it supplied 2% of the world’s certified cocoa beans and
5% of the world total supply of cocoa (Potts et al., 2014).37 The promotion of certification among
35 This represents 115 times more export volumes than the current Philippine exports. 36 Middle-sized farms, by comparison, are 11 to 50 ha in size and employ hired labor. 37 By comparison, Cote D’Ivoire, the largest exporter of beans in 2012 accounted for 50% of all certified cocoa
beans. Indonesia, the third largest exporter supplied 4% of all certified cocoa beans exported (Potts et al., 2014).

The Philippines in the Cocoa-Chocolate Global Value Chain
35
producers reflects the shift among global chocolate manufactures for sustainably sourced cocoa
beans. By 2012, it was estimated that 15%-20% of the cocoa produced in Ecuador was certified
under one or more of the voluntary sustainability initiatives: Organic, Fair Trade, UTZ, and Rain
Forest Alliance (Larrea & Lynch, 2012).
Figure 13. Ecuadorian Cocoa Bean Exports, 2005-2015
Source: UN Comtrade based on HS codes 1801. Retrieved on October 25, 2016.
(ii) Product Upgrading: Focus on High Quality Cocoa Beans: Increased production in the country was
complemented by a focus on fine flavor cocoa beans. Today, the country produces mainly two types
of medium and high quality beans: Arriba,38 a Forastero clone and the Coleccion Castro Naranjal
(CCN-51), a Forastero-Trinitario hybrid. Arriba cocoa beans represent 37% of national production
while CCN-51 accounts for 36% of national production (USDA, 2015). Arriba beans have a special
designation of fine or flavor cocoa beans, referring to their unique taste profile and are used for
premium quality chocolate production (ICCO, 2017a). In Ecuador, the National Institution of
Standards (INEN) sets standards regarding the quality of cocoa beans. It has classified cocoa beans
into 5 classes, corresponding to quality standards as well as other factors, including the size and
weight of the bean, as well as post-harvesting techniques (Kooij, 2013).
Improved production techniques incorporated in process upgrading helped to maintain the quality
levels through harvesting and post-harvest fermentation and drying. The result of the focus on
producing fine flavored beans is a 59.3% growth in per unit value from 2005 to 2015, with the unit
price of exports increasing from US$1.73/kg in 2005 to US$3.15 in 2015 (UNComtrade, 2016).
Together, process and product upgrading have helped to boost overall export value and volume of
cocoa beans in Ecuador. Export volume has increased 2.5 times, while exports value has increased
4.3 times by more than half a billion dollars (UNComtrade, 2016). The following section looks at
the programs and policies that helped to grow the industry in Ecuador.
38 Also known as “National”.
-
100
200
300
400
500
600
700
800
-
50,000
100,000
150,000
200,000
250,000
2005 2007 2009 2011 2013 2015
Valu
e (
US
$ m
illio
n)
Net
Weig
ht
(MT
)
Weight (MT) Value (US$ million)

The Philippines in the Cocoa-Chocolate Global Value Chain
36
Policies and Programs for Upgrading
Ecuador’s current position in the cocoa-chocolate GVC is the result of specific policy interventions
to build the industry lead by the government, private sector and NGOs. Key actors include the
Ministry of Agriculture, Livestock, Aquaculture and Fisheries (MAGAP), which facilitates, regulates
and manages agricultural production; the Ministry of Industry and Productivity, Ministry of Foreign
Relations, Trade, and Integration, and ProEcuador which manages industrialization and export
promotion; the National Institution of Standards (INEN) which controls the quality of cocoa beans;
and a number of associations that promote the development of cocoa including the National
Association of Cocoa Exporters (ANECACAO), the largest association that represents exporters.
ANECACAO provides a range of services including industry data, technical assistance, marketing of
Ecuadorian cocoa, and provides policy advice. These organizations work together with private
sector actors, including cocoa bean aggregators, exporters and a handful of processors to direct the
industry.
Table 10 highlights several major initiatives used to drive growth in Ecuador. Increased production
is the result of a combination of government and private sector programs that sought to increase
plantings, improve farming techniques and to boost the sustainability of the industry. At the same
time, other programs sought to increase the quality of harvests and to capitalize on the unique
cocoa bean varieties grown in the country to capture higher values. The main goal of each of these
initiatives is to promote Ecuador’s cocoa. The National Cocoa Program served as an umbrella
program to help coordinate production activities for cocoa bean export, while other programs
focused on production of the Arriba bean or product upgrading through improved quality and
branding.
Table 10. Major Policies in Ecuador's Cocoa Industry
Initiative Year Description
National Cocoa
Program
2
0
1
3
To establish links with organizations working towards the commercialization
in cocoa such as: INIAP (Investigation), MAGAP (Production), MIPRO
(Industrialization), IEPI (Denomination of Origin) and MRECI-PROECUADOR
(Promotion of exports and commercial protection)
National
Program of Fine
Aroma Cacao
2
0
1
2
To position Ecuador as the leading producer and exporter "Cocoa Arriba"
Increase sustainable production, productivity and export of ‘Arriba’ cocoa
Develop and implement efficient quality processes in the value chain.
Promote national industrialization and "Cocoa Arriba", and promote domestic
consumption.
Increase international market share and diversification
Abidjan Cocoa
Declaration
2
0
1
2
Ecuador signed the declaration to improve sustainable cocoa economy
Geographical
Indication (PGI)
Status for ‘Cacao
Arriba’
2
0
1
4
Applied to the EU commission
Part of negotiations to add Ecuador to an existing trade agreement between
EU member states and Colombia and Peru
Source: Adapted from Ahmed and Hamrick (2015).

The Philippines in the Cocoa-Chocolate Global Value Chain
37
(i) Process Upgrading for Increased Productivity: The most notable push for process upgrading occurred
under the National Cocoa Program in 2013, which helped coordinate efforts in the industry. This
plan involves the participation and coordination of key stakeholders in the value chain, from cocoa
producers to cocoa processors, including also R&D and other government agencies. The
overarching goal of the plan was to promote cocoa production by working with agencies along the
value chain to steer the industry towards larger scale production and export. Specifically the
program sought to increase farm level interventions to improve farming practices, such as pruning,
in order to meet export requirements (Freire, 2013).
In addition, Ecuador is promoting policies that support sustainability initiatives in the country. To
accomplish this aim, the country established several initiatives. For example, as part of the National
Program of Fine Aroma Cacao, in 2012 the government led a cocoa pruning campaign. The program
sought to expand planting of cocoa trees to new areas, replant trees in aging farms, and implement
new farming protocols to increase existing production. Pruning, an essential task to maintain high
yields and sustain productivity of trees, was especially encouraged through the program. The
government partnered with over 500 producer associations to help the estimated 30,000
smallholders in the nation increase pruning of cocoa trees. A total of approximately 19 million
cocoa trees were pruned during the program (Freire, 2013). At the project close, over 60,000 ha of
new plantations were established, with 284,000 ha receiving improvements and 600 production
protocols distributed to various farmer associations in the country (Freire, 2013). Additionally,
programs helped to promote sustainable farming practices including proper use of fertilizer and
other farm techniques to help promote sustainability.
Beyond government-sponsored programs, private sector initiatives are also facilitating process
upgrading. In 2011, Nestlé implemented its sustainability and growth program, Cocoa Plan in the
country. The plan seeks to improve traceability from cocoa bean farmer to consumer and facilitate
certification for sustainability (Nestle, 2012). It also provides technical assistance on best practices
for farmers on all farm level activities, from seed planting and tree maintenance to harvesting and
fermentation of beans (Nestle, 2017) and providing no interest loans and inputs to farmers (Nestle,
2017). The program has allowed over 380 farms become UTZ certification in Ecuador (Nestle,
2012).
(ii) Product Upgrading: Focus on High Quality Cocoa Beans: Ecuador’s increased participation in the
cocoa-chocolate GVC is also through a focus on quality. The Arriba cocoa bean is recognized by the
International Cocoa Organization (ICCO) as a fine or flavor bean, commanding higher prices
compared to other bean varieties and being well suited for premium chocolate production (ICCO,
2017a). The government has taken many steps to help brand Arriba beans as unique, and safeguard
their position on the global market.
The government is investing over US$80 million in the next 10 years for development of fine flavor
cacao in the country (Cepeda et al., 2013). Money designated for fine flavor cocoa aims to maintain
and expand its position as global supplier of the fine flavor cocoa. In 2015, Ecuador accounted for
2/3 of the global supply and hopes to increase its production (Nieburg, 2015a).
In 2011, the government established the Association of Producing Countries of Fine Aroma Cocoa
(FINACAO) along with other countries in the region who produce fine flavor cocoa.39 It is
39 Other member nations include Bolivia, Colombia, Costa Rica, Nicaragua, Peru and Venezuela.

The Philippines in the Cocoa-Chocolate Global Value Chain
38
headquartered in Ecuador. The objective of the organization is to build capacity among small and
medium size producers to help them capture higher value and sustainably cultivate fine flavor cocoa
through improvements in harvest quality and international cooperation (Kooij, 2013).
The government is also seeking to distinguish Arriba cocoa from other cocoa beans to capture
higher value. In 2005, the Ministry of Agriculture declared Arriba cocoa beans a “Product Symbol of
Ecuador,” affirming the importance of cocoa in the nation (ANECACAO, 2015). Subsequently, the
government sought denomination of origin protection for the Arriba bean. As part of trade
negotiations between the EU, Ecuador, Colombia, and Peru, Ecuador sought to achieve a Protected
Geographical Indication (PGI) Status for its Arriba bean. PGIs are labels that convey quality to
consumers by linking it to the geographic regions of production (WIPO, 2015). Once designated,
countries agree to only allow products from the PGI region to carry the name.
4.2 Indonesia—Increasing value by Functional Upgrading and Process Upgrading
Indonesia has a long history in the cocoa-chocolate GVC. Production occurs in several islands in the
nation, with 65% of cocoa plantations in the island of Sulawesi and another 15% in Sumatra (Taylor,
2012). With major pushes for cocoa beans beginning in the 1980s (Neilson & Mckenzie, 2016),
Indonesia quickly became an industry leader, and has been one of the top global exporters of cocoa
beans, behind Cote d’Ivoire and Ghana for much of the recent past (Indonesia Investments, 2017).
Cocoa bean exports grew steadily until 2010, peaking at 535 million tons in 2007. Export value also
increased, topping US$1billion in 2010 (UNComtrade, 2016).
Starting in 2010, as a result of stable cocoa bean supply and government policies, the nation began
to upgrade into cocoa processing. Following the introduction of a tax on cocoa beans exports and
imports in April 2010 to encourage the processing of the beans in the country (GBG Indonesia,
2014), exports of cocoa beans declined from over US$1billion to just US$180 million in 2015
(UNComtrade, 2016). During the same period, the country saw substantial increases in the export
of cocoa liquor/paste and cocoa butter, indicating an upgrading trend towards processing in the
country. More recently, efforts to improve farming techniques and replace aging trees to help
increase the supply of cocoa beans have been undertaken. Many large multinational cocoa
processors are expanding or entering the nation, citing perceived long-term growth in cocoa bean
supply for the nation and increasing regional demand for chocolate as major drivers of their
investments (Nieburg, 2015b).
Indonesia’s upgrading from a global supplier of cocoa beans to exporting semi-processed cocoa
products is the result of two key trajectories: (i) Functional upgrading: spurring domestic processing
via export taxes on domestic cocoa beans and (ii) Process upgrading: farm level interventions by both
the public and private sector to increase productivity and replace aging trees. These are examined
in further detail below:
(i) Functional upgrading via export and import taxes on cocoa beans: Similar to Cote d’Ivoire and Ghana,
Indonesia leveraged its strong role as a leading producer and exporter of cocoa beans to upgrade
into processing. Following a strong history of cocoa bean exports, the nation entered into a new
phase of the cocoa-chocolate GVC, semi-processed cocoa product exports.
The move from cocoa bean to the export of semi-processed cocoa products (see Figure 14)
highlights the functional upgrading path Indonesia is taking to increase competitiveness in the

The Philippines in the Cocoa-Chocolate Global Value Chain
39
sector.40 During this time, export value increased for both cocoa liquor/paste and butter. Cocoa
liquor/paste exports increased nearly tenfold, from approximately US$25.5 million in 2005 to
US$281 million in 2015. Cocoa butter exports rose from US$198.5 million to almost US$800
million in 2015, representing a growth of over 300% (UNComtrade, 2016). They also grew in
export volume. Cocoa liquor/paste increased from just 4% of total export volumes to 28.2% in
2015. Cocoa butter grew from 8.3% to 39.8% of export volume in the same time period
(UNComtrade, 2016). This was driven by a significant increase in grinding capacity, which doubled
between 2010 and 2015 reaching 370,000MT (see Table 11) (ICCO, 2016b). Cocoa bean grinding
increased 95% from 2010 to 2015, growing from 190,000MT in 2010 to 370,000MT in 2015 (ICCO,
2016b). Similarly, export volumes for cocoa butter and paste also grew by approximately 358% and
208% respectively.
Figure 14. Indonesia's Exports by Cocoa-Chocolate GVC Segment, (US$ million)
2005-2015
Source: UN Comtrade based on HS codes 1801,1803, 1804, 1805, &1806. Retrieved on October 25, 2016.
Cargill, Barry Callebaut, JB Cocoa and PT Bumitangerang Mesindotama all have multi-million dollar
investments in grinding operations in Indonesia (Taylor & Supriatna, 2014).41 Several of these firms
are increasing investment. For example, Cargill, which first began cocoa operations in 1995,
invested in a new US$100 million cocoa processing plant in 2014 citing estimated cocoa bean supply
from the nation (Indonesia Investments, 2015). The plant will have an initial capacity of 70,000 tons
a year and will source beans from Sulawesi (Indonesia Investments, 2015). Additionally, Barry
Callebaut invested in new cocoa processing and chocolate manufacturing operations in the country
(Barry Callebaut, 2016b; Taylor, 2012).
40 See Appendix for Export Volume data (Figure A-3) and Export Unit Value (Table A-3). 41 JB Cocoa is a Malaysian based processing firm that entered Indonesia in 2015. PT Bumitangerang Mesindotama is
an Indonesia based multinational with operations in over 50 nations.
-
200
400
600
800
1,000
1,200
1,400
1,600
1,800
2,000
2005 2006 2007 2008 2009 2010 2011 2012 2013 2014 2015
Exp
ort
Valu
e (
US
$,
Millio
n)
Cocoa Beans Cocoa Liquor/Paste Cocoa Butter Cocoa Powder Chocolate

The Philippines in the Cocoa-Chocolate Global Value Chain
40
Table 11. Indonesia's Cocoa and Grinding by Volume (MT), 2010-2015
Year Production (MT) Grinding (MT)
2010 440,000 190,000
2011 440,000 270,000
2012 410,000 255,000
2013 375,000 340,000
2014 325,000 335,000
2015 330,000 370,000
Source: (ICCO, 2016b)
(ii) Process Upgrading via farm-level interventions: While processing was boosted, the share of total
export volume of cocoa beans in the Cocoa-Chocolate GVC for Indonesia declined dramatically,
from 83% in 2005 to 15% in 2015 (UNComtrade, 2016) as raw material shifted towards local
processing. The volume of cocoa bean exports dropped from 486,000 tons in 2005 to 58,000 tons
in 2015 (UNComtrade, 2016). Export values for beans dropped nearly 73% despite more than
doubling in per unit value from US$1.36 toUS$3.09 (UNComtrade, 2016). While processing played
a central role in this reduction of exports, the country also experienced a decline in production.
Between 2010 and 2015, production declined from 440,000 tons to 330,000 tons (ICCO, 2016b).
Like other cocoa producing nations, output from mature cocoa trees is tapering off and farmers are
moving to other crops (Neilson & Mckenzie, 2016). As a result of these production challenges, the
supply of cocoa beans declined, which strains the country’s productive capacity and spurred
programs to increase domestic supplies (GBG Indonesia, 2016). In an effort to reduce import
dependency and to spur local production, the Indonesian government began collaborating with
farms and the private sector to increase yields in the country.
Like many nations, including the Philippines, smallholders account for 95% of all production area of
cocoa beans.42 The remainder of the land is state-owned or held by private firms. The majority of
cocoa trees in the nation are aging, with most planted in the 1980s. As a result, many were
increasingly susceptible to diseases that threaten yields (Taylor, 2012). This was further complicated
by the use of poor farming techniques among many smallholders. As a result of these challenges
new programs to improve yields and promote production have been launched in recent years.
These programs seek to encourage planting of new seedlings, increased fertilizer use and
investments in irrigation and machinery for farms. Recent collaborations between farmers and large
processors and chocolate manufactures, such as Mars, are also addressing these challenges via
programs that promote knowledge transfer to farmers.
Policies and Programs for Upgrading
After achieving a stable and large supply of cocoa beans domestically, several approaches by both
the government and private sector helped spur upgrading in the nation. Through taxes and
inspection requirements for cocoa beans, the government helped to incentivize movement into the
processing segments of the GVC. At the same time, it sought to continue to bolster production and
address concerns of declining productivity. This was met with a simultaneous push by private sector
processors and manufacturers in the nation who began working more closely with farmers to help
safeguard supplies of cocoa beans and meet the growing global demand for certification.
42 Smallholder production occurs generally on farms smaller than 2 Ha (Neilson & Mckenzie, 2016).

The Philippines in the Cocoa-Chocolate Global Value Chain
41
(i) Functional upgrading via export taxes and government promotion. The functional upgrading from the
export of unprocessed beans to cocoa liquor/paste and cocoa butter is the result of policies to
encourage processing of domestic cocoa beans to increase value addition. In 2007, functional
upgrading into cocoa processing was identified as a priority for the country. The government
included cocoa processing as one of its 6 agri-based sectors to promote abroad to attract investors.
It began this with a series of tax incentives and tax holidays for up to 6 years to attract processors
(Johnson, 2011). In particular, in April 2010, the Indonesian government introduced a progressive
tax on all cocoa bean exports. The goal was to redirect local supply to processing in an attempt to
move into higher value activities along the value chain. The tax, reported at 10% in June 2016
(Nangoy, 2016) can rise to a maximum of 15% (GBG Indonesia, 2014).
Beyond taxes, in 2014 the government announced the creation of a special economic zone (SEZ) in
Palu, on the cocoa producing island of Sulawesi (BKPM, 2017). In addition to the strategic location
on a major cocoa producing island (65% of nation’s total), the SEZ also is located close to a major
port with easy access to neighboring markets, including the Philippines and Malaysia (BKPM, 2017).
The SEZ focuses on agri-processing and includes cocoa processing. It offers tax allowances and VAT
exemption as well as supporting infrastructure needed to be competitive (BKPM, 2017).
(ii) Process Upgrading via farm-level interventions. Increased productivity and cocoa bean supply is
needed to both supply the country’s new host of processors and to reduce Indonesia’s exposure to
volatile global cocoa bean prices (GBG Indonesia, 2014). At approximately the same time the
country began fostering upgrading into processing, the government began to focus on increased
harvesting through farm level programs. The National Cocoa Rehabilitation program was the first
government program addressing productivity, and focused on harvest intensification via increased
fertilization and planting of seedlings to replace aging trees (Neilson & Mckenzie, 2016). Investments
in the program reached over US$350 million (GBG Indonesia, 2014). The program attempted to
encourage farmers to adopt modern agriculture practices, by distributing free fertilizer (Taylor &
Supriatna, 2014). However, some noted the program suffered from poor quality planting material
and the absence of trained technical support for farmers (Neilson & Mckenzie, 2016). As a
continuation of the program, the government announced in 2014 it would seek to continue
improvements of planting material and fertilizer use while also investing in irrigation and machinery
on farms (Indonesia Investments, 2015).
In addition to supporting productivity growth, the government imposed a tax on imported cocoa
beans, in addition to requiring strict quality regulations including laboratory inspection for
contamination to help boost demand for local beans. According to the Indonesian Cocoa Industry
Association, the total cost of import duties and tax amounts to roughly 17.5% (Munthe, 2016).
Farmers, see the import tax as a way to promote use of domestic beans and encourage continued
cultivation of the crop (GBG Indonesia, 2014).
Cooperation with local farms as a strategy to improve bean production and advances the
competitiveness of in-country processors is also a priority for MNCs in the country. With
increased demand for sustainable certifications globally, the private sector is now working directly
with farmers to increase yields in sustainable ways. Certification typically follows a top-down
approach in the nation where farmers are trained by exporters and processors on compliance with
requirements.

The Philippines in the Cocoa-Chocolate Global Value Chain
42
In addition, the government has also partnered with several MNCS, especially large processors and
chocolate manufactures. Mondelez’s Cocoa Life (see Box 1) expanded programs into the nation
focusing on improving the productivity of farms. Box 6 details how Mars is increasing collaboration
with farmers using centralized knowledge centers to diffuse knowledge. Additionally, Barry
Callebaut has several sustainability initiatives in the country including programs to increase the
number of cocoa farmers trained in good agriculture practices from 20,000 to 50,000 by 2020
(Bamford, 2016). The company is also increasing the number of cocoa nurseries and more than
doubling the premiums paid for certified cocoa beans to promote more sustainable harvesting
(Bamford, 2016). It is currently increasing the number of field staff to coordinate programs.
Box 6. Mars Participation with Cocoa Farmers in Indonesia
Mars is encouraging productivity increases with the establishment of Cocoa Development Centers
(CDCs) in the nation to help diffuse knowledge of sustainable modern farming practices. As of 2014
there were 4 centers in the nation with plans to add 16 additional CDCs by 2017. CDCs offer hubs
for technology demonstrations and trainings on best practices in cocoa for farmers. They connect to
farmers via cocoa village clinics (CVCs), rural enterprises that are self-sustaining operations. CVCs
work directly with farmers providing extension services and trainings and selling inputs. They are
supported by the Mars funded Cocoa Academy, a centralized training institute in good agricultural
practices and business management. CDCs are operated by processors and overseen by farming
experts in the community. They support rural enterprises seeking to increase participation in the
cocoa sector. The strength of CDCs is their ability to network and provide incentives for actors
across the value chain from farmers to processors and manufacturers.
Source: (Neilson & Mckenzie, 2016).
4.3 Key Lessons for the Philippines
Countries around the world compete fiercely for upgrading in GVCs, the cocoa-chocolate value
chain is no exception. Governments, firms and civil society organizations push and create programs
and policies to encourage the industry upgrading.
The cases presented above offer examples of how two particular countries are moving up in the
value chain. One of the most important upgrading that Indonesia and Ecuador are pursuing is
process upgrading at the agricultural level. This is a response to the global trend in which cocoa
production has remained constant in the past 10 years while demand continues increasing. Almost
all producing countries are implementing policies and programs to boost productivity. Thus, in
order to effectively participate in the cocoa-chocolate value chain, the minimum requirement for
developing countries is to have a stable and larger supply of cocoa. Nations that are able to increase
their cocoa production will be able to upgrade and move to other segments of the value chain.
While both Ecuador and Indonesia have focused on increased productivity, they have different
reasons for doing so. In the case of Ecuador, the policies have focused on increasing export gains
through increased productivity and quality. This can be seen in the boom of cocoa beans exports.
The exports of cocoa beans in the country increased almost three times, a very rare phenomenon
in an industry where production is almost stagnant. The nation also sought to diversify beans in
country to enter traditional and niche markets. Indonesia presents a different approach; the country
is implementing policies to boost production in order to have sufficient raw materials to support its

The Philippines in the Cocoa-Chocolate Global Value Chain
43
newly installed processing capacity. In an industry in which the main raw material is scarce, it is
increasingly important for countries to make sure they produce internally to supply the processing
stages that the country aims to pursue. Thus, if the Philippines seeks to participate in the cocoa-
chocolate value chain, it must focus on expanding and improving the agro production of cocoa
beans.
The second level of upgrading differs in Indonesia and Ecuador. The Latin American country decided
to upgrade improving and taking advantage of the quality of its bean. Ecuador was able to double
the price of its beans in the past decade focusing on a niche market of fine cacao that is highly
demanded in European countries. Therefore, Ecuador upgrading story has been focusing in excelling
in agricultural production to supply more and better quality cocoa beans to the world. It also
sought to establish diverse marketing channels for various beans to help capture value from niche
markets while still participating in traditional cocoa bean chains.
On the other hand, Indonesia’s second level upgrading emphasizes the processing stages of the
cocoa chocolate value chain. The country increased the value of its exports by locally processing
the cocoa beans produced domestically through a multi-stakeholder approach led by the
government that implemented taxes to encourage the manufacturing of the beans. It further
spurred the shift to processing via the establishment of SEZ with an agricultural processing focus on
islands with high levels of cocoa bean production Five years after the policies were established, the
country increased their exports of cocoa liquor four times and exports of cocoa butter increased
three times. It is also important to highlight that the country established an import tax on cocoa
beans to disincentive the import of the raw material in order to encourage the processing of local
beans.
5. Upgrading Trajectories Recommendations
Typical upgrading trajectories around the world in the agro-processing sector follow a linear path,
in which once there is a stable and competitive production of the crop then the nation move to the
processing stages (manufacturing) of the chain (Fernandez-Stark et al., 2012; Lee et al., 2012). This
section outlines potential upgrading trajectories for the Philippines in the short and medium term.
Short term, the nation should focus on improving production in volume and quality. Once this is
achieved, it can move into higher value processing segments of the value chain.
1. Short Term Process Upgrading (agriculture): Taking the lead from major cocoa bean
producers, the Philippines needs to improve their agriculture production to be competitive
and participate in the cocoa-chocolate GVC. The starting point for the country is to expand
and improve the productivity. Aging trees, and inefficient agricultural operations have
undermined productivity of the sector. Increasing the production can first satisfy the
domestic market and later the international market. This should be the very first step that
the country should follow. Efforts to boost processing at this stage will likely drive less
expensive beans imports from other countries, and undermine production efforts at home.
2. Short Term Process Upgrading (certification): Taking the lead from major cocoa
bean producers, the Philippines needs to seek certification from the international certifying
organizations, such as UTZ and Rainforest Alliance. While these certifications do not
command a high price premium in the market, the commitment of several global cocoa
processors and chocolate manufacturers to source only certified beans by 2020 represent a

The Philippines in the Cocoa-Chocolate Global Value Chain
44
potential shift in the global demand market and new requirement for export. The Philippines
needs to begin assisting farmers now to meet the requirement of these organizations to
ensure competitiveness as production increases.
3. Short Term Product Upgrading: Continue to encourage the diversification of cocoa
bean variety in the nation. Since the geography of the Philippines allows for the cultivation of
the three major types of beans: Trinitario, Criollo and Forastero, it is advisable that the
country can diversify risks by having all varieties that can go to different end markets. The
majority of attention should go towards diversifying into Forastero beans as demand for
Criollo beans is a niche market with relatively small demand. Furthermore, it is advisable to
explore high value hybrids to take advantage of new markets and new cocoa bean varieties.
4. Medium Term Functional Upgrading (manufacturing): Once the country is able to
meet the minimum requirements of cocoa production, manufacturing of the beans will be
the next step. As other lead countries such as Ghana, Cote D’Ivoire, and Indonesia have
attracted investment from big processors once they secured a good and stable production
volume. Olam, Cargill and Barry Callebaut are present in these countries having state-of-the
art factories and training specialists to run these cocoa plants that produce cocoa liquor and
butter. Thus, this functional upgrading, moving to higher stages of the value chain will
provide additional exports revenue and also new jobs for the country.
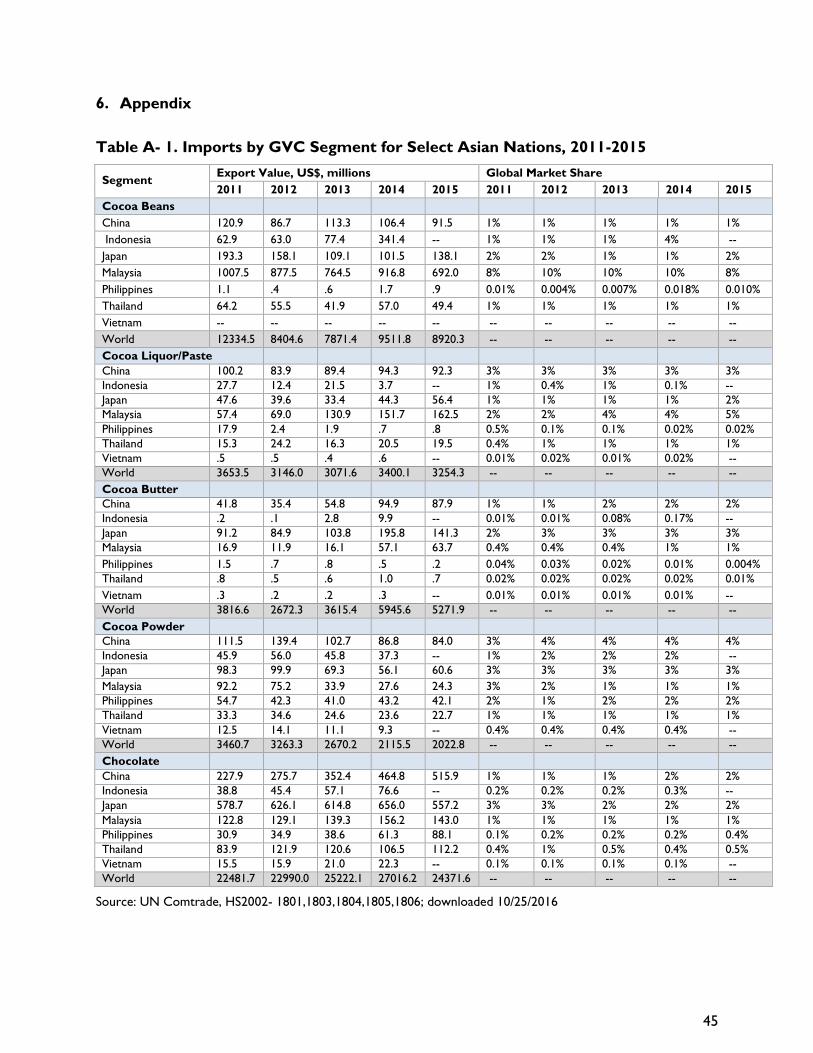
45
6. Appendix
Table A- 1. Imports by GVC Segment for Select Asian Nations, 2011-2015
Segment Export Value, US$, millions Global Market Share
2011 2012 2013 2014 2015 2011 2012 2013 2014 2015
Cocoa Beans
China 120.9 86.7 113.3 106.4 91.5 1% 1% 1% 1% 1%
Indonesia 62.9 63.0 77.4 341.4 -- 1% 1% 1% 4% --
Japan 193.3 158.1 109.1 101.5 138.1 2% 2% 1% 1% 2%
Malaysia 1007.5 877.5 764.5 916.8 692.0 8% 10% 10% 10% 8%
Philippines 1.1 .4 .6 1.7 .9 0.01% 0.004% 0.007% 0.018% 0.010%
Thailand 64.2 55.5 41.9 57.0 49.4 1% 1% 1% 1% 1%
Vietnam -- -- -- -- -- -- -- -- -- --
World 12334.5 8404.6 7871.4 9511.8 8920.3 -- -- -- -- --
Cocoa Liquor/Paste
China 100.2 83.9 89.4 94.3 92.3 3% 3% 3% 3% 3%
Indonesia 27.7 12.4 21.5 3.7 -- 1% 0.4% 1% 0.1% --
Japan 47.6 39.6 33.4 44.3 56.4 1% 1% 1% 1% 2%
Malaysia 57.4 69.0 130.9 151.7 162.5 2% 2% 4% 4% 5%
Philippines 17.9 2.4 1.9 .7 .8 0.5% 0.1% 0.1% 0.02% 0.02%
Thailand 15.3 24.2 16.3 20.5 19.5 0.4% 1% 1% 1% 1%
Vietnam .5 .5 .4 .6 -- 0.01% 0.02% 0.01% 0.02% --
World 3653.5 3146.0 3071.6 3400.1 3254.3 -- -- -- -- --
Cocoa Butter
China 41.8 35.4 54.8 94.9 87.9 1% 1% 2% 2% 2%
Indonesia .2 .1 2.8 9.9 -- 0.01% 0.01% 0.08% 0.17% --
Japan 91.2 84.9 103.8 195.8 141.3 2% 3% 3% 3% 3%
Malaysia 16.9 11.9 16.1 57.1 63.7 0.4% 0.4% 0.4% 1% 1%
Philippines 1.5 .7 .8 .5 .2 0.04% 0.03% 0.02% 0.01% 0.004%
Thailand .8 .5 .6 1.0 .7 0.02% 0.02% 0.02% 0.02% 0.01%
Vietnam .3 .2 .2 .3 -- 0.01% 0.01% 0.01% 0.01% --
World 3816.6 2672.3 3615.4 5945.6 5271.9 -- -- -- -- --
Cocoa Powder
China 111.5 139.4 102.7 86.8 84.0 3% 4% 4% 4% 4%
Indonesia 45.9 56.0 45.8 37.3 -- 1% 2% 2% 2% --
Japan 98.3 99.9 69.3 56.1 60.6 3% 3% 3% 3% 3%
Malaysia 92.2 75.2 33.9 27.6 24.3 3% 2% 1% 1% 1%
Philippines 54.7 42.3 41.0 43.2 42.1 2% 1% 2% 2% 2%
Thailand 33.3 34.6 24.6 23.6 22.7 1% 1% 1% 1% 1%
Vietnam 12.5 14.1 11.1 9.3 -- 0.4% 0.4% 0.4% 0.4% --
World 3460.7 3263.3 2670.2 2115.5 2022.8 -- -- -- -- --
Chocolate
China 227.9 275.7 352.4 464.8 515.9 1% 1% 1% 2% 2%
Indonesia 38.8 45.4 57.1 76.6 -- 0.2% 0.2% 0.2% 0.3% --
Japan 578.7 626.1 614.8 656.0 557.2 3% 3% 2% 2% 2%
Malaysia 122.8 129.1 139.3 156.2 143.0 1% 1% 1% 1% 1%
Philippines 30.9 34.9 38.6 61.3 88.1 0.1% 0.2% 0.2% 0.2% 0.4%
Thailand 83.9 121.9 120.6 106.5 112.2 0.4% 1% 0.5% 0.4% 0.5%
Vietnam 15.5 15.9 21.0 22.3 -- 0.1% 0.1% 0.1% 0.1% --
World 22481.7 22990.0 25222.1 27016.2 24371.6 -- -- -- -- --
Source: UN Comtrade, HS2002- 1801,1803,1804,1805,1806; downloaded 10/25/2016

46
Table A- 2. Profile of Leading Philippine Cocoa-Chocolate Export Markets, 2007-
2015
Export Value (US$, millions) % of GVC Segment Export
2007 2009 2011 2013 2015 2007 2009 2011 2013 2015
Cocoa Beans
Malaysia -- .30 .27 1.53 4.00 -- 41.4% 20.3% 76.2% 68.4%
Thailand .14 .26 .29 -- 1.78 99.6% 35.9% 22.0% -- 30.5%
USA -- .02 .04 .04 .04 -- 2.5% 3.3% 2.0% 0.7%
New Zealand -- -- -- -- .01 -- -- -- -- 0.2%
Netherlands -- .14 .38 .18 -- -- 20.0% 28.9% 8.9% --
Canada -- -- .02 .01 -- -- -- 1.6% 0.5% --
Singapore -- -- -- .07 -- -- -- -- 3.3% --
Germany -- -- -- .07 -- -- -- -- 3.4% --
Belgium -- -- .31 -- -- -- 23.7% -- --
Indonesia -- -- -- .11 -- -- -- -- 5.5% --
World .14 .72 1.33 2.00 5.84 100% 100% 100% 100% 100%
Cocoa Butter
USA 1.62 1.45 1.78 1.44 2.12 50.5% 47.5% 34.3% 35.7% 64.3%
Germany -- .11 1.38 -- .62 -- 3.6% 26.5% -- 18.6%
Netherlands -- 1.10 1.11 1.62 .54 -- 35.9% 21.3% 40.3% 16.2%
Canada -- -- -- -- .03 -- -- -- -- 0.9%
Malaysia -- .02 -- -- -- 0.7% -- -- --
Aruba .01 -- -- -- -- 0.2% -- -- -- --
Australia .07 -- -- -- -- 2.2% -- -- -- --
France 1.51 .38 .27 .18 -- 47.1% 12.3% 5.2% 4.6% --
United Kingdom -- -- .65 .78 -- -- -- 12.6% 19.5% --
World 3.21 3.06 5.19 4.03 3.30 100% 100% 100% 100% 100%
Chocolate
USA .09 .12 .54 9.86 8.42 1.56% 1.92% 8.91% 56.18% 57.01%
Thailand 2.39 2.87 .67 .94 .84 42.9% 46.1% 11.0% 5.3% 5.7%
Rep. of Korea .03 .04 .45 .42 .78 0.5% 0.6% 7.3% 2.4% 5.2%
Maldives .01 -- -- -- .67 0.1% -- -- -- 4.5%
China, Hong Kong SAR .21 .23 .48 .39 .65 3.8% 3.7% 7.8% 2.2% 4.4%
Mauritius .34 .43 .57 .61 .47 6.1% 7.0% 9.3% 3.5% 3.2%
China .51 .01 .09 .08 .36 9.1% 0.1% 1.5% 0.5% 2.5%
Brunei Darussalam -- -- -- 1.41 .29 -- -- -- 8.0% 2.0%
Unspecified Asian
nations .46 .46 .90 .51 .23 8.3% 7.4% 14.8% 2.9% 1.6%
Malaysia .26 .10 .54 .12 .20 4.7% 1.7% 8.9% 0.7% 1.3%
Australia .51 1.06 .22 .22 .14 9.2% 17.0% 3.5% 1.3% 0.9%
United Arab Emirates .04 .08 .39 .59 -- 0.7% 1.2% 6.4% 3.4% --
World 5.56 6.22 6.09 17.55 14.77 100% 100% 100% 100% 100%
Source: UN Comtrade based on HS codes 1801, 1803, 1804, 1805, 1806. Retrieved on October 25, 2016.

47
Table A- 3. Indonesian Export Unit Price (US$/kg), 2005-2015
2005 2006 2007 2008 2009 2010 2011 2012 2013 2014 2015
Cocoa Beans $1.36 $1.40 $1.72 $2.50 $2.56 $2.88 $2.98 $2.48 $2.45 $3.16 $3.09
Cocoa Paste $1.10 $0.66 $0.86 $1.11 $1.78 $3.30 $4.06 $3.78 $2.87 $2.72 $2.64
Cocoa Butter $4.07 $3.96 $4.68 $6.37 $6.24 $5.59 $4.42 $3.00 $3.73 $4.36 $5.32
Cocoa Powder $1.18 $1.04 $1.09 $1.13 $1.68 $3.02 $3.95 $4.07 $2.88 $1.92 $1.99
Chocolate $2.15 $2.21 $2.21 $1.85 $2.39 $2.71 $3.12 $3.08 $2.67 $3.07 $2.91
Source: UN Comtrade based on HS codes 1801,1803,1804,1805, and 1806. Retrieved on October 25, 2016.
Figure A- 1. Indonesian Export Volumes (MT) by Cocoa-Chocolate GVC Segment,
2005-2015
Source: UN Comtrade based on HS codes 1801,1803, 1804, 1805, &1806. Retrieved on October 25, 2016
- 100 200 300 400 500 600 700
2005
2006
2007
2008
2009
2010
2011
2012
2013
2014
2015
Export Volume, 1000 MT
Cocoa Beans Cocoa Liquor/Paste Cocoa Butter Cocoa Powder Chocolate

48
7. Bibliography
Abdulsamad, Ajmal, Lukas Brun and Gary Gereffi. (2013). Realizing the Potential of African
Agriculture: Innovations and Market Access for Smallholder Farmers. Durham, NC: Center
on Globalization, Governance and Competitiveness, Duke University. May.
http://www.cggc.duke.edu/pdfs/AgriculturalInnovations_and_MarketAccess_for%20_Smallho
lders_in_Africa.pdf.
Abdulsamad, Ajmal, Stacey Frederick, Andrew Guinn, and Gary Gereffi. (2015). Pro-Poor
Development and Power Asymmetries in Global Value Chains. Durham, NC: Center on
Globalization, Governance and Competitiveness, Duke University September.
http://www.cggc.duke.edu/pdfs/Pro-
PoorDevelopment_and_PowerAsymmetries_inGlobalValueChains_Final.pdf.
Aboa, Ange and Kwasi Kpodo. (2016). Cocoa Grinders in Ivory Coast, Ghana hit hard by poor bean
quality. Reuters. June 14 from http://www.reuters.com/article/us-ivorycoast-ghana-cocoa-
idUSKCN0Z029E.
Ahmed, Ghada and Danny Hamrick. (2015). Review of Ecuador’s Agri-Industries Global Value
Chains: Bottlenecks and Roadmap for Implementation. Washington, D.C.: World Bank.
Amores, Freddy, David Butler, Gladys Ramos, Darin Sukha, Susana Espin, Alvaro Gomez, Alexis
Zambrano, Neil Hollywood, Robert Van Loo, and Edward Seguine. (2007). Project to
determine the physical, chemical and organoleptic parameters to differentiate between fine
and bulk cocoa. (Project Completion Report). Quevedo, Ecuador: Instituto Nacional
Autónomo de Investigaciones Agropecuarias. pp. 15. 15 August 2007.
ANECACAO. (2015). ANECACAO’s Achievements. Retrieved January 12, 2017, from
http://www.anecacao.com/index.php/en/quienes-somos/logros-de-anecacao.html.
Bain & Company. (2015). Visión Agroindustrial 2025.
Bakker, Simon. (2015). "Kennemer Foods International". Paper presented at the Global Value
Chains, Industrial Policy, and SME Integration in GVCs: Transformation Strategies for More
Inclusive and Sustainable Growth. Makati City, Philippines.
Bamber, Penny and Karina Fernandez-Stark. (2012). Supporting The Competitiveness of Central
American Coffee. Durham, NC: Duke University Center on Globalization, Governance and
Competitiveness. July. http://www.cggc.duke.edu/pdfs/COFFEE_final_2012ENG.pdf.
Bamber, Penny, Karina Fernandez-Stark, Gary Gereffi, and Andrew Guinn. (2013). Connecting Local
Producers in Developing Countries to Regional and Global Value Chains. Paris: Organisation
for Economic Co-operation and Development.
http://www.cggc.duke.edu/pdfs/Bamber_GVCsandDCs_2013.pdf.
Bamford, Vince. (2016). Barry Callebaut Ramps Up Indonesia Cocoa Sustainability Program.
Confectionery News. June 3 Retrieved January 10, 2017, from
http://www.confectionerynews.com/Manufacturers/Barry-Callebaut-ramps-up-Indonesia-
cocoa-sustainability-program.
Barrientos, Stephanie. (2014). "Gendered Global Production Networks: Analysis of Cocoa–
Chocolate Sourcing." Regional Studies, 48(5): 791-803.
Barrientos, Stephanie. (2015). Beyond Fairtrade: Why are chocolate companies pursuing social
sustainability in cocoa sourcing? In M. Squicciarini & J. Swinnen (Eds.), The Economics of
Chocolate. Oxford: Oxford University Press.
Barrientos, Stephanie and Kwadwo Asenso-Okyere. (2008). Mapping Sustainable Production in
Ghanian Cocoa: Institute of Development Studies and The University of Ghana.
Barry Callebaut. (2016a). Barry Callebaut at a Glance. from https://www.barry-callebaut.com/about-
us/company-overview/barry-callebaut-glance.

49
Barry Callebaut. (2016b). Barry Callebaut Celebrates Grand Opening of its First Chocolate Factory
in Indonesia. Barry Callebaut. October 5 from https://www.barry-
callebaut.com/news/2016/10/barry-callebaut-celebrates-grand-opening-its-first-chocolate-
factory-indonesia.
Barry Callebaut. (2016c). From Cocoa to Chocolate. Retrieved October 25, 2016, from
https://www.barry-callebaut.com/chocophilia/cocoa-chocolate.
Bitzer, Verena, Pieter Glasbergen and Pieter Leroy. (2012). "Partnerships of a Feather Flock
Together? An Analysis of the Emergence of Networks of Partnerships in the Global Cocoa
Sector." Global Networks, 12(3): 355-374.
BKPM. (2017). Special Economic Zone Palu: The Main Trading Channel in Asia Pacific. Jakarta,
Indonesia: Indonesia Investment Coordinating Board (BKPM). http://www.pma-
japan.or.id/bundles/bsibkpm/download/Palu_91.pdf.
Cadbury. (2016a). Chocolate Making. Retrieved October 25, 2016, from
https://www.cadbury.com.au/about-chocolate/chocolate-making.aspx.
Cadbury. (2016b). Cocoa Life Sustainability Programme Expands to Cover Cadbury Chocolate
through new Partnership with Fairtrade: Cadbury; Fairtrade.
http://files.shareholder.com/downloads/AMDA-1A8CT3/2549828910x0x917898/8119E880-
2689-45BF-BFDD-EB10205665AD/Cocoa_Life_announcement_-_GLOBAL.pdf.
Cargill. (2011). Cargill Marks Major Milestone in Vietnam's Development as a New Sustainable
Cocoa Producer. Retrieved February 7, 2017, from
http://www.cargill.com.vn/en/news/NA3040827.jsp.
---. (2014). Cargill Officially Opens Cocoa Processing Facility in Indonesia to Serve Growing Asian
Market. Cargill. December 10 from
http://www.cargill.com/news/releases/2014/NA31714473.jsp.
---. (2017). Cargill Cocoa and Chocolate Locations. Retrieved January 12, 2017,
CBS. (2016). Dutch Chocolate Exports Spreading. The Hauge, Netherlands: Statistics Netherlands
(CBS) https://www.cbs.nl/en-gb/news/2016/51/dutch-chocolate-exports-spreading.
Cepeda, Dario, Barry Pound, Gaspard Kajman, Valerie Nelson, Diana Cabascango, Adrienne Martin,
Maritza Chile, Helena Posthumus, Gabriela Caza, Isabel Mejia, Freddy Montenegro, Laura
Ruup, Gabriela Ana Velastegui, Yesenia Tiaguaro, Mercedes Valverde, and Andrea Ojeda.
(2013). Assessing the Poverty Impact of Sustainability Standards: Ecuadorian Cocoa. June
2013.
Coco Marketing Company. (2012). Cocoa Marketing Company (Gh) Limited. Retrieved February
16, 2017, from http://www.cocoamarketing.com/.
Cocoa & Chocolate Online. (2016). Cocoa Liquor History. Cocoa & Chocolate Online Manual
Retrieved January 12, 2017, from
http://www.cacaochocolade.nl/main.php?lng=1&p=inhoud&h=3&g=1&s=1&z=0&sp=.
COSA. (2013). The COSA Measuring Sustainability Report: Coffee and Cocoa in 12 Countries:
Committee On Sustainable Assessment.
DA-HVCDP. (2016). Cacao Commodity Profile. Manila: Department of Agriculture-High Value
Crops Development Program (DA-HVCDP) Republic of the Philippines.
Daly, Jack, Penny Bamber and Gary Gereffi. (2017). The Philippines in the Natural Rubber Global
Value Chain. Durham, NC: Center on Globalization, Governance and Competitiveness,
Duke University.
Dand, Robin. (1999). The International Cocoa Trade. Boca Raton, FL; Cambridge, England: CRC Press;
Woodhead Pub.
Dand, Robin. (2011). The International Cacao Trade. Cambridge, UK; Philadelphia, PA: Woodhead
Pub.

50
DAR. (2013). To Win Back Youth To Farming, Show ‘em There’s Cash In Agriculture Manilia:
Department of Agrarian Reform; Republic of the Philippines.
DTI-BOI. (2016). Processed Food Industry Roadmap: Tablea. Manila: Department of Trade and
Industry-Board of Investments (DTI-BOI). February.
Duyvis Wiener. (2017). The Most Advanced Technology Available for Cocoa Pressing. Retrieved
January 12, 2017, from http://duyviswiener.com/cocoa-processing/cocoa-pressing/.
Euromonitor. (2012). Cocoa Ingredients: Difficult Times for these Prized Ingredients: Euromonitor
International.
Euromonitor. (2014). Euromonitor Global Market Information Database. Retrieved September
2014, from Euromonitor International.
Euromonitor. (2016a). Chocolate Confectionery in the Philippines: Euromonitor International.
Euromonitor. (2016b). Euromonitor Global Market Information Database: Passport Database.
Fair Labor Association. (2012). Sustainable Management of Nestlé’s Cocoa Supply Chain in the Ivory
Coast—Focus on Labor Standards: Fair Labor Association.
Fairtrade Foundation. (2016). Fairtrade and Cocoa.
http://www.fairtrade.org.uk/~/media/fairtradeuk/farmers%20and%20workers/documents/coc
oa%20commodity%20briefing_online7.pdf.
FAOSTAT. (2014). Food and Agricultural Oranization of the United Nations, Statistics Division.
Ferdman, Roberto. (2014). The Worlds Biggest Chocolate Maker Says We Are Running Out of
Chocolate. Washington Post. from
https://www.washingtonpost.com/news/wonk/wp/2014/11/15/the-worlds-biggest-chocolate-
maker-says-were-running-out-of-chocolate/.
Fernandez-Stark, Karina and Penny Bamber. (2012). The Competitiveness of Small Organic Cocoa
Producers of the National Confederation of Dominican Cocoa Producers. Durham, N.C.:
Duke University Center on Globalization, Governance and Competitiveness. December.
http://www.cggc.duke.edu/pdfs/Duke_CGGC_DR_CACAO_English.pdf.
Fernandez-Stark, Karina, Penny Bamber and Gary Gereffi. (2012). Inclusion of Small- And Medium-
Sized Producers in High-Value Agro-Food Value Chains. Durham, NC: Center on
Globalization, Governance and Competitiveness, Duke University. May.
http://cggc.duke.edu/pdfs/2012-
05_DukeCGGC_InclusiveBusiness_and_HighValueAgricultureValueChains_v2.pdf.
Field Research. (2016). Philippines Field Research. Personal communication with K. F.-S. D. H. J.
Daly. November.
Fold, Niels. (2001). "Restructuring of the European Chocolate Industry and its Impact on Cocoa
Production in West Africa." Journal of Economic Geography, 1(4): 405-420.
Freire, Jaime. (2013). "The Multiciplity of Standards in Cocoa Market: Finding a way forward for
Promoting Sustainable Cocoa". Paper presented at the International Workshop on Cocoa
Certification. June 24-27.
GBG Indonesia. (2014). Indonesia's Booming Cocoa Industry Puts Farmers to the Test: Global
Business Guide (GBG) Indonesia.
http://www.gbgindonesia.com/en/agriculture/article/2014/indonesia_s_booming_cocoa_indu
stry_puts_farmers_to_the_test.php.
GBG Indonesia. (2016). Indonesia's Cocoa Industry: Lack of Supply Still Hampers Growth and
Investment: Global Business Guide (GBG) Indonesia.
http://www.gbgindonesia.com/en/agriculture/article/2016/overview_of_indonesia_s_cocoa_i
ndustry_lack_of_supply_still_hampers_growth_and_investment_11670.php.
Gereffi, Gary, John Humphrey and Timothy Sturgeon. (2005). "The Governance of Global Value
Chains." Review of International Political Economy, 12(1): 78-104.

51
Ghana Cocoa Board. (2017). Our Subsidiaries/Divisions. Retrieved February 16, 2017, from
https://cocobod.gh/oursubsidiaries.php.
Hawkins, Doug and Yingheng Chen. (2014). Giant on a Pinhead: A Profile of the Cocoa Sector:
Hardman and Company. May. http://themarketmogul.com/wp-
content/uploads/2015/03/Cacao-Giant-on-a-pinhead-May14-FINAL.pdf.
Hernández, René A., Jorge Mario Martínez-Piva and Nanno Mulder. (2014). Global value chains and
world trade Prospects and challenges for Latin America. Santiago, Chile: Economic Commission
for Latin America and the Caribbean (ECLAC).
Humphrey, John and Hubert Schmitz. (2002). "How Does Insertion in Global Value Chains Affect
Upgrading in Industrial Clusters?". Regional Studies, 36(9): 1017-1027.
IBISWorld. (2014). Global Candy & Chocolate Manufacturing: IBISWorld Global Industry Report.
ICCO. (2012). How Many Smallholders Are There Worldwide Producing Cocoa? . Retrieved
October 24, 2016, from http://www.icco.org/faq/57-cocoa-production/123-how-many-
smallholders-are-there-worldwide-producing-cocoa-what-proportion-of-cocoa-worldwide-
is-produced-by-smallholders.html.
---. (2014). What Time of Year is Cocoa Harvested? Retrieved October 25, 2016, from
http://www.icco.org/faq/58-cocoa-harvesting/131-what-time-of-year-is-cocoa-harvested.html.
---. (2016a). ICCO Panel Recognizes 23 Countries as Fine And Flavour Cocoa Exporters. Retrieved
January 28, 2017, from https://www.icco.org/about-us/icco-news/319-icco-panel-recognizes-
23-countries-as-fine-and-flavour-cocoa-exporters.html.
---. (2016b). ICCO Quarterly Bulletin of Cocoa Statistics, Vol. XLII, No. 3, Cocoa year 2015/16.
London, UK: International Cocoa Organization (ICCO).
---. (2016c). Processing Cocoa. Retrieved October 25, 2016, from https://www.icco.org/about-
cocoa/processing-cocoa.html.
---. (2017a). Fine or Flavour Cocoa. Retrieved January 12, 2017, from https://www.icco.org/about-
cocoa/fine-or-flavour-cocoa.html.
---. (2017b). Growing Cocoa. Retrieved January 17, 2017, from http://www.icco.org/about-
cocoa/growing-cocoa.html.
Indonesia Investments. (2015). An Update on Indonesia's Cocoa Bean Production & Export. Delft,
Netherlands: Van der Schaar Investments http://www.indonesia-
investments.com/news/todays-headlines/an-update-on-indonesia-s-cocoa-bean-production-
export/item5192?
Indonesia Investments. (2017). Cocoa. Delft, Netherlands: Van der Schaar Investments
http://www.indonesia-investments.com/business/commodities/cocoa/item241.
Ingram, Verina, Yuca Waarts, Lan Ge, Simone van Vugt, Linda Puister-Jansen Lucia Wegner,
Francois Ruf, and Roger Tanoh. (2014). Impact of UTZ Certification of Cocoa in Ivory
Coast (No. LEI Report 2014-010). Wageningen, Netherlands: LEI Wageningen UR.
https://www.utz.org/wp-content/uploads/2016/03/Impact-of-UTZ-certification-of-cocoa-in-
Ivory-Coast_2014.pdf.
International Cocoa Organization. (2014). The Cocoa Market Situation: International Cocoa
Organization,,. July 24,2014. https://www.icco.org/about-us/international-cocoa-
agreements/doc_download/1383-cocoa-market-situation-24-july-2014.html.
ITC. (2011). The Impacts of Private Standards on Global Value Chains - Part I: International Trade
Center.
Johnson, Constance. (2011). Indonesia: Tax Holiday for Innovators. Washington D.C: The Law
Library of Congress. August. http://www.loc.gov/law/foreign-news/article/indonesia-tax-
holiday-for-innovators/.

52
Kaplinsky, Raphael. (2004). Competition Policy and the Global Coffee and Cocoa Value Chains:
Institute of Development Studies University of Sussex, and Center for Research in
Innovation Management, University of Brighton.
Kessler, Jan Joost, Johan Brons, Lenneke Braam, Marijke van Kuijk, and Pim Pelders. (2012). Social &
Economic Effects of Value Chains of Tropical Agro-commodities & Sustainability Initiatives:
Final Report: Aidenvironment.
Kooij, Susanne van der. (2013). Market study of fine flavour cocoa in 11 selected countries – revised
version. Amsterdam: Royal Tropical Institute. October 2013.
KPMG. (2011). Sustainable Cocoa Fund Study. Section II - Segmentation and Intervention Options.
---. (2013). Moving the Bars: Sustainability Brought to the Forefront in the Cocoa Chain: KPMG
Evaluation of the 2008-2012 Cocoa Invetment Program.
---. (2014). A Taste of the Future: KPMG International. June.
https://assets.kpmg.com/content/dam/kpmg/pdf/2014/06/taste-of-the-future.pdf.
Lamb, Harriet. (2014). There is a Solution to the Looming Chocolate Shortage - Pay Farmers a Fair
Price. The Guardian. from https://www.theguardian.com/sustainable-business/fairtrade-
partner-zone/2014/nov/21/there-is-a-solution-to-the-looming-chocolate-shortage-pay-
farmers-a-fair-price.
Larrea, Cristina and Matthew Lynch. (2012). A Brief Overview of the Sustainable Cocoa Sector in
Latin America and the Caribbean. Montreal, Canada: Finance Alliance for Sustainable Trade
Lee, Joonkoo, Gary Gereffi and Janet Beauvais. (2012). "Global value chains and agrifood standards:
challenges and possibilities for smallholders in developing countries." Proceedings of the
National Academy of Sciences, 109(31): 12326-12331.
Malaymail Online. (2014). Malaysia Aspires to be Main Chocolate Producer in Asia by 2020.
Malaymail Online. May 7 Retrieved January 12, 2017, from
http://www.themalaymailonline.com/money/article/malaysia-aspires-to-be-main-chocolate-
producer-in-asia-by-2020.
Mondelez International. (2016). Cocoa Life: The Challenge and Our Role. Retrieved December 18
from http://www.mondelezinternational.com/well-being/sustainable-resources-and-
agriculture/agricultural-supply-
chain/~/media/MondelezCorporate/Uploads/downloads/MDLZCocoaLifeFactSheet.pdf.
Monnier, Olivier. (2015). Cote d’Ivoire’s Grind Hits a Bump The Africa Report. October 28 from
http://www.theafricareport.com/West-Africa/cote-divoires-grind-hits-a-bump.html.
Monnier, Olivier. (2016). Ivory Coast Grants Tax Incentives for Cocoa Processors. Bloomberg. June
30 from https://www.bloomberg.com/news/articles/2016-06-30/ivory-coast-grants-cocoa-
access-tax-breaks-for-local-processing.
Munthe, Bernadette C. (2016). Indonesia Cocoa Industry Expects to Process less Beans this Year.
Daily Mail. November 22 Retrieved January 9,2017, from
http://www.dailymail.co.uk/wires/reuters/article-3959808/Indonesia-cocoa-industry-expects-
process-beans-year.html.
Nangoy, Fransiska. (2016). Indonesia keeps Palm Oil, Cocoa Bean Export Taxes Unchanged for
June. Reuters. May 31 Retrieved January 10, 2017, from
http://www.reuters.com/article/indonesia-palmoil-tax-idUSL4N18S1WS.
Neilson, Jeffrey and Fiona Mckenzie. (2016). Business-oriented outreach programmes for sustainable
cocoa production in Indonesia: an institutional innovation. In A. S. P. Allison Loconto, Pilar
Santacoloma (Ed.), Innovative markets for sustainable agriculture: How innovations in market
institutions encourage sustainable agriculture in developing countries (pp. 17-35). Rome: Food and
Agriculture Organisation of United Nations.

53
Nestle. (2012). Growing Sustainable Fine Cocoa. Retrieved January 12, 2017, from
http://www.nestle.com/csv/case-studies/allcasestudies/sustainable-fine-cocoa-growing-
ecuador.
---. (2017). El Plan Cacao. Retrieved January 12, 2017, from
http://ww1.nestle.com.ec/csv/desarrollorural/plancacao.
Nieburg, Oliver. (2015a). Big Chocolate Companies Eye Ecuador for Single Estate Cocoa. says
Hacienda Victoria. Confectionery News. October 7 Retrieved January 12, 2017, from
http://www.confectionerynews.com/Commodities/Chocolate-firms-eye-Ecuador-for-single-
estate-cocoa-Hacienda-Victoria.
Nieburg, Oliver. (2015b). 'We Cannot let Indonesia Fail': Mars Stresses Asia's Importance in
Meeting Future Cocoa Demand. Confectionery News. April 29 Retrieved January 10, 2017,
from http://www.confectionerynews.com/Commodities/What-is-the-future-of-cocoa-
growing-in-Asia.
Olam. (2015). Olam International Closes ADM Cocoa Acquisition to Create Globally Integrated
Cocoa Business. from http://olamgroup.com/news/olam-international-closes-adm-cocoa-
acquisition-create-globally-integrated-cocoa-business-2/#sthash.jpEpJGz8.dpbs.
---. (2017). Cocoa Processing. from http://olamgroup.com/products-services/confectionery-
beverage-ingredients/cocoa/processing/.
Oluwasola, Oluwemimo. (2011). Olam Nigeria Limited: Insight into Innovative Business for Profit
Maximization, Employment Generation and Development of the Farm Sector. New York,
NY: United Nations Development Programme (UNDP).
http://www.growinginclusivemarkets.org/media/cases/nigeria_olam_2011.pdf.
OneSource. (2014). OneSource Global Business Browser. Retrieved September 2014, from
OneSource.
Philippine Cacao. (2016). Philippine Cacao Industry Roadmap, 2016-2022.
Potts, Jason, Mattew Lynch, Ann Wilkings, Gabriel Huppé, Maxine Cunningham, and Vivek Voora.
(2014). The State of Sustainability Initiatives Review 2014: Standards and the Green
Economy: International Institute for Sustainable Development and the International Institute
for Environment and Development.
PSA. (2007-2014). Firm-Level Trade Data. Manila: Philippines Statistics Authority (PSA).
---. (2016). CountrySTAT Philippines. Manila: Philippine Statistics Authority (PSA).
Schrage, Elliot J and Anthony P Ewing. (2005). "The Cocoa Industry and Child Labour." The Journal of
Corporate Citizenship(18): 99.
Schrempf-Stirling, Judith and Guido Palazzo. (2013). "Upstream Corporate Social Responsibility: The
Evolution From Contract Responsibility to Full Producer Responsibility." Business & Society,
55(4).
Squicciarini, Mara and Johan Swinnen. (2016). The Economics of Chocolate: Oxford University Press.
Statista. (2014). Global Statistical Platform Retrieved September 2014, from Statista Inc.
Sun Star Davao. (2016). Davao remains as top cacao producer. Sun Star Davao. February 25
Taylor, Michael. (2012). Factbox: Snapshot of Indonesia's Cocoa Industry. Reuters. October 15
Retrieved January 12, 2017, from http://www.reuters.com/article/us-indonesia-cocoa-
factbox-idUSBRE89E1DL20121015.
Taylor, Michael and Yayat Supriatna. (2014). Indonesia Import Duty Decision set to shake up Global
Cocoa Supply. Reuters. April 8 Retrieved December 22, 2016, from
http://www.reuters.com/article/indonesia-cocoa-imports-idUSL3N0N00UQ20140408.
Technoserve. (2015). Building a Sustainable and Competitive Cocoa Value Chain in Peru.
Washington DC: Technoserve. http://www.technoserve.org/files/downloads/case-study-
building-a-sustainable-and-competitive-cocoa-value-chain-in-peru.pdf.

54
Tesco. (2016). Tesco to Source Rainforest Alliance Certified™ Cocoa for All of its Own Label
Chocolate in the UK. Retrieved January 12, 2017, from
https://www.tescoplc.com/news/news-releases/2016/tesco-rainforest-alliance-certified-
cocoa/.
Tollens, Eric F. and Christopher L. Gilbert. (2003). "Does Market Liberalisation Jeopardise Export
Quality? Cameroonian Cocoa, 1988–2000." Journal of African Economies, 12(3): 303-342.
UNComtrade. (2016). World Cocoa Imports by All Reporters and Partners, 2005-2015 (based on
HS2002). Retrieved October 25, 2016, from United Nations Statistics Division (UNSD)from
UNCTAD. (2016). Cocoa Industry: Integrating Small Farmers into the Global Value Chain: United
Nations
USDA. (2015). Ecuador Cocoa Update and Outlook. Quito: United States Department of
Agricutlure. February 18 2015.
UTZ. (2017). UTZ Cocoa. Retrieved January 12, 2017, from https://www.utz.org/what-we-
offer/certification/products-we-certify/cocoa/.
UTZ Certified. (2011). First UTZ Certified Cocoa Farms in Vietnam. Retrieved February 9, 2017,
from https://utzcertified.org/newsroom/utz-in-the-news/2100-first-utz-certified-cocoa-farms-
in-vietnam?offset=115&lang=en.
VDMA. (2009). Guideline: Energy Efficiency in the Confectionery Industry: Verband Deutscher
Maschinen- und Anlagenbau, Mechanical Engineering Industry Association (VDMA).
October.
https://nuv.vdma.org/documents/256988/1137998/3_Guideline+Energy+Efficiency+in+the+C
onfectionery+Industry.pdf/bfc0ac7e-0569-4d59-803a-af26c9aec471.
Webber, M.J. (2009). Chocolate Marketing and Other Aspects of the Confectionary Industry
Worldwide. In S. Beckett (Ed.), Industrial Chocolate Manufacture and Use: Fourth Edition (pp.
636-655). Oxford: Blackwell Publishing Ltd.
Williams, Pam and Jim Eber. (2012). Raising the Bar: The Future of Fine Chocolate: BookBaby.
WIPO. (2015). Geographical Indications. Retrieved June 28, 2016,
World Bank. (2008). World Development Report: Agriculture for Development: World Bank.
World Bank. (2014). World Bank Commodity Price Data (the Pink Sheet). Retrieved November
2014, from http://data.worldbank.org/data-catalog/commodity-price-data.
World Bank. (2016). World Development Indicators. Retrieved December 2016, from
http://data.worldbank.org/data-catalog/world-development-indicators.
World Cocoa Foundation. (2014, April). Cocoa Market Update. from
http://www.worldcocoafoundation.org/wp-content/uploads/Cocoa-Market-Update-as-of-4-
1-2014.pdf.
World Cocoa Foundation. (2016). Cocoa Value Chain: From Farmer to Consumer. Retrieved
October 24, 2016, from http://www.worldcocoafoundation.org/about-cocoa/cocoa-value-
chain/.