co - national energy technology laboratory library/events/2017/carbon...performed a grid sensitivity...
TRANSCRIPT


CO2 STORAGE EFFICIENCY IN DEEP SALINE FORMATIONS – STAGE 2
US DOE DE-FE0024233IEAGHG- IEA/CON/16/234
Lawrence J. PekotEnergy & Environmental Research Center
U.S. Department of EnergyNational Energy Technology Laboratory
Mastering the Subsurface Through Technology Innovation, Partnerships and Collaboration:Carbon Storage and Oil and Natural Gas Technologies Review Meeting
August 1–3, 2017

3
PRESENTATION OUTLINE
• Background/setting– Phase one– Phase two (this project)
• Work program– Minnelusa Sandstone, Powder River Basin– Bunter Sandstone, UK sector North Sea– Cost/benefit analysis– Solubility sensitivity study
• Summary and conclusions

4
TECHNICAL STATUS
• Primary technical issue: Dynamic simulation results can approach static calculations of CO2 storage efficiency factors for basin-scale deep saline formations (DSFs). However, the number of wells needed to accomplish this is very large, 100’s to 1000’s, and the time frame is long, 100’s to 1000’s of years (results of the Stage 1 study). Stage 2 (this work) investigated the storage efficiency practically achievable within a limited time, 50 years, and a limited area, approximately 1000 km2.
• Secondary issue: CO2 solubility in formation brine is well known, but simulation results may overstate this effect depending on grid cell size. The Stage 2 study performed a grid sensitivity study to investigate the issue.

5
TECHNICAL STATUS
• The CO2 storage resource/ capacity classification system highlights a wide range for CO2storage resource estimates, depending upon the level of evaluation and resource quality.
• To date, little work performed to describe practical storage capacity and efficiency. This project addresses this issue to advance the state-of-the-art in understanding DSF storage capacity estimations.

6
TECHNICAL STATUS
• For both Minnelusaand Bunter, simulation cases run to determine the number of wells needed to maximize CO2 storage in 50 years within the simulated area.
Bunter Minnelusa
7
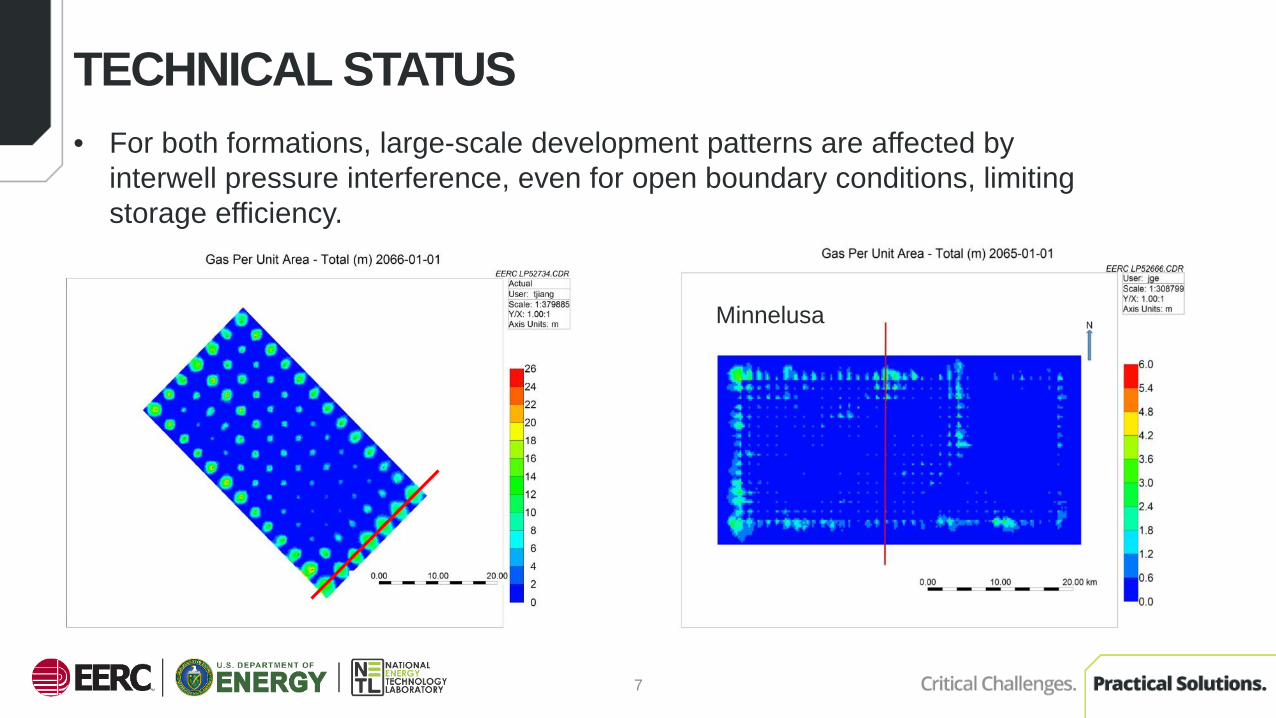
TECHNICAL STATUS• For both formations, large-scale development patterns are affected by
interwell pressure interference, even for open boundary conditions, limiting storage efficiency.
Bunter Minnelusa

8
TECHNICAL STATUS• For both formations, large-scale development patterns are affected by
interwell pressure interference, even for open boundary conditions, limiting storage efficiency.
Bunter
Minnelusa

9
TECHNICAL STATUS
• For both formations, the best well locations (khbased) were selected first, with progressively weaker locations added.
• 20% of the wells provide over 60% of injection.
• Achievable dynamic storage efficiency factor was lower than estimated volumetric efficiency.
BunterEstimated volumetric efficiency 14%
MinnelusaEstimated volumetric efficiency 7.44%

10
TECHNICAL STATUS
• For both formations, higher well density ultimately results in diminishing returns in terms of additional CO2 injected.
• Cost/benefit analysis was applied to estimate a cost factor for each drilling scenario for each formation.
• Different cost models were identified. – For the onshore Minnelusa: the DOE NETL (2014) model was used.– For the offshore Bunter: the Energy Technology Institute (ETI) developed detailed
cost estimates for offshore UK storage (2016) and these were used to create Bunter cost estimates.

11
TECHNICAL STATUS• For both formations, cost factor escalates as more wells/platforms are
developed in progressively less favorable locations. Cost curves are very similar, yet apply to two very different formations, locations, and used different cost methodologies. Again, 20% of maximum well count provides most of the achievable storage before costs rise sharply.
MinnelusaBunter

12
TECHNICAL STATUS• Solubility sensitivity study using the
Minnelusa simulation showed large increase in dissolved CO2 with increasing grid cell size.
• Variation due to cell size is greater than variations due to uncertainty in brine salinity or temperature.

13
ACCOMPLISHMENTS TO DATE
• Work program completed as designed; report in final peer review stage.• Determined maximum dynamic storage efficiency factors for a realistic
injection period, 4.75% and 4.66% for the Minnelusa and Bunter, respectively.• Determined practical storage efficiency factors for realistic, large-scale, early
injection projects, 3.4% and 2.9% for the Minnelusa and Bunter, respectively.• Practical storage efficiency factors are considerably lower than volumetric
factors, but higher than closed system estimates.• Simulation grid effects can have a larger impact on estimates of CO2
dissolution than uncertainty in brine salinity or reservoir temperature.

14
LESSONS LEARNED
• The work provides a valuable step toward determining practical storage capacity and storage efficiency factor estimates.
• Generally agreed constraints to define “practical” need to be developed.• Cost data and cost estimates for DSF storage remain fragmented, incomplete,
proprietary, or presented in inconsistent terms, hindering reliable cost estimation efforts.
• Interwell pressure interference significantly reduces storage efficiency factors, even for initial projects in areas with open geologic boundaries.
• Numerical grid effects can add considerable uncertainty in calculation of CO2dissolution. More work is needed to develop mitigating methodology.

15
SYNERGY OPPORTUNITIES
• The topic of CO2 storage efficiency factors for DSFs has been under development for several years and is still evolving. It has been featured prominently in the DOE Carbon Utilization and Storage Atlas and is an active area of research by IEAGHG. This project makes direct contribution to the topic and can be expected to help move research in the direction of understanding practical storage capacity and practical storage efficiency factors.

16
PROJECT SUMMARY
• Volumetric and/or dynamic storage efficiency factors may not be representative of the achievable storage efficiency when injection is governed by practical project operating constraints.
• Reliable estimates of practical storage capacity and storage efficiency need widely accepted standards for the definition of practical.
• Cost estimation for DSF storage projects remains single project specific and dependent on the skill and experience of the estimator. Available cost data are limited, and general methods for estimation are still evolving.
• Estimates from simulation of CO2 dissolution may be inaccurate because of numerical grid effects and should be carefully verified.

17
APPENDIX

18
BENEFIT TO THE PROGRAM
• This project is supporting the Office of Fossil Energy goals of advancing foundational science, innovating energy technologies, and informing data-driven policies that enhance U.S. economic growth and job creation, energy security, and environmental quality by developing and advancing the effectiveness of carbon storage technologies, reducing challenges to their implementation, and preparing them for widespread commercial deployment.
• The research project has used numerical simulation and cost/benefit analysis to demonstrate that significant difference exists between volumetric and dynamic storage capacity and efficiency estimates and what can be practically achieved during the life of an injection project. The work provides a step toward defining Practical Storage Capacity and efficiency as shown in the CO2 storage resource/capacity classification system. Ultimately, this will clarify estimates of storage capacity that can actually be achieved for a given area.

19
PROJECT OVERVIEW – GOALS AND OBJECTIVES
• The proposed project will build upon the framework established through Stage 1 project work (IEAGHG, 2014) to improve the understanding of the CO2 storage resource/capacity and efficiency that may be achievable in a limited geologic storage area within a time frame of 50 years. Stage 1 compared volumetrically and dynamically derived effective CO2 storage efficiency factors on a basin-wide scale for injection programs requiring hundreds to thousands of years. The overall goal of the proposed Stage 2 work is to create similar comparisons, but limited by a range of constraints designed to reflect timing and realities of potential large-scale commercial injection projects (e.g., shorter injection period). Additionally, a remaining technical concern from the Stage 1 study will be addressed: specifically, the uncertainty of the effect that grid cell size has on calculation of CO2 dissolved in formation brine.

20
ORGANIZATION CHART
Lawrence PekotPrincipal Engineer, EERC
Principal Investigator
James CraigSenior Geologist, IEAGHG
Jerry CarrSubtask Manager, US DOE
Nicholas BosshartSenior Geologist, EERC
Scott AyashPrincipal Project Manager, EERC
Lonny JacobsenSenior Engineer, EERC
Neil DotzenrodGeomodeler, EERC
Charlie GoreckiDirector, EERCProject Advisor
Jun GeReservoir Engineer, EERC
Todd JiangReservoir Engineer, EERC
Heidi VettlisonProject Specialist, EERC

21
GANTT CHART
M2M1D1 D2
D1- Draft Final ReportD2- Final ReportM1- IEAGHG Comments ReceivedM2- Results Presented in an Open Forum

22
BIBLIOGRAPHY
• Publication:– To be published as a report by IEAGHG upon completion of peer review process under the title of “CO2 Storage
Efficiency in Deep Saline Formations – Stage 2”

ACKNOWLEDGMENTThis material is based upon work supported by the U.S. Department of Energy
National Energy Technology Laboratory under Award No. DE-FE024233.This material is also based on work supported by the International Energy Agency’s
Greenhouse Gas R&D Programme under contract No. IEAGHG- IEA/CON/16/234
DisclaimerThis presentation was prepared as an account of work sponsored by an agency of the United States Government.
Neither the United States Government, nor any agency thereof, nor any of their employees, makes any warranty, express or implied, or assumes any legal liability or responsibility for the accuracy, completeness, or usefulness of
any information, apparatus, product, or process disclosed or represents that its use would not infringe privately owned rights. Reference herein to any specific commercial product, process, or service by trade name, trademark, manufacturer, or otherwise does not necessarily constitute or imply its endorsement, recommendation, or favoring by the United States Government or any agency thereof. The views and opinions of authors expressed herein do
not necessarily state or reflect those of the United States Government or any agency thereof.Copyrighted information used to generate project results was taken from the Strategic UK CCS Storage
Appraisal Project, funded by DECC, commissioned by the ETI and delivered by Pale Blue Dot Energy, Axis Well Technology and Costain. The open license governing the ETI copyrighted
information can be found here: https://s3-eu-west-1.amazonaws.com/assets.eti.co.uk/legacyUploads/2016/04/ETI-licence-v2.1.pdf.

24
CONTACT INFORMATION
Energy & Environmental Research CenterUniversity of North Dakota15 North 23rd Street, Stop 9018Grand Forks, ND 58202-9018
www.undeerc.org701.777.5376 (phone)701.777.5181 (fax)
Lawrence PekotReservoir Engineering Group [email protected]

THANK YOU!
