co-benefits of waste management: a case of surat, india ... · co-benefits of waste management: a...
TRANSCRIPT

Co-benefits of Waste Management: A Case of Surat, India
School of Planning and Architecture, Bhopal, India

Introduction Co Benefit Approach Co Benefit Approach Initiatives In India Urban Waste Management Scenario in India Policy Drivers and Implementation Profile of Surat Solid waste management in Surat Sewage management in Surat Methane Generation from Sewage Co-Benefits from STP Based Power generation Way forward

Urban Population is Increasing and it induces various environmental issues like Climate Change India has over 1.21 billion people (2011 census) Rural – Urban distribution: 68.84% & 31.16% Level of urbanization increased from 27.81% in 2001 Census to 31.16% in 2011 Census
Source: Census of India 2011
Particulars 2001 2011 2021* 2026* Total Population (million) 1028.61 1,210 1339.74 1399.83 Urban Population (million) 286.12 377.94 432.61 534.8 Urban (%) 27.82 31.16 32.29 38.21 Projected Population Source:http://censusindia.gov.in/2011

The Intergovernmental Panel on Climate Change (IPCC) Third Assessment Report on mitigation says: “co-benefits” as benefits intended as the primary objective of certain actions or policies from those that are secondary or incidental to it are named simply as “ancillary benefits.”
There are Eight National Missions which form the core of the National Action Plan on Climate Change for achieving important goals in the context of climate change. The missions are: National Solar Mission (Ministry of New & renewable energy) National Mission for Enhanced Energy Efficiency (Ministry of New & renewable energy) National Mission on Sustainable Habitat (MoUD& MoHUPA) National Water Mission (Ministry of Water Resources) National Mission for Sustaining the Himalayan Ecosystem (Ministry of Science & Technology) National Mission for a Green India Ministry (Ministry of Environment and Forests) National Mission for Sustainable Agriculture (Ministry of Agriculture) National Mission on Strategic Knowledge for Climate Change (Ministry of Science & Technology)

As per estimates, 115000 MT of solid waste is generated daily in the country. Yearly increase is about 5% annually. Per capita waste generation in cities varies from 0.2 kg to 0.6 kg per day depending upon the size of population. ULBs spend about Rs. 500 to Rs.1500 per ton on solid waste collection, transportation, treatment and disposal
Type of cities (2005) MT/day % of total waste
The 7 mega cities 21100 18.35
The 28 metro cities 19643 17.08
The 388 class I towns 42635 37.07
Total 83378 72.5 Source: Position paper on the solid waste management sector, Department of Economic Affairs, Ministry of Finance Government of India

Parameters Class I Cities Class II Towns Total Number (as per 2001 census) 423 498 921 Population (millions) 187 37.5 224.5 Water Supply (MLD) 29782 3035 32817 Water Supply (lpcd) 160 81 146 Wastewater generated (MLD) 23826 2428 26054 Wastewater generation (lpcd) 127 65 116 Wastewater treated (MLD) 6955 (29%) 89 (3.67%) 7044 (27%) Wastewater untreated (MLD) 16871 (71%) 2339 (96.33%) 19210 (73%)
(lpcd: Liters per-capita per day, MLD: Million Liters Per Day Source: Planning Commission, Eleventh Five-Year Plan Drinking Water and Sanitation in the Eleventh Plan period
As per assessment made by the Central Pollution Control Board (CPCB) on the status of wastewater generation and treatment in Class I cities and Class-II towns during 2003- 04 about 26,254 MLD of wastewater is generated in 921 Class I cities and Class II towns in India (housing more than 70% of urban population). The wastewater treatment capacity developed so far is about 7044 MLD – accounting for 27% of waste water generated in these two classes of urban centers.
Local governments bear the sole responsibility for solid waste sewage management in India. According to the 74th Amendment Act of 1992, Article 243-W, Entry 6, Schedule 12, the Constitution empowers urban local bodies, known as Municipal Corporations, Municipal Councils, or Nagar Panchayats depending on the size of the population The responsibility under the MWS Rules, 2000 lies with the ULBs and the concerned Departments of Municipal affairs/urban development and collectors are overall responsible to enforce the provisions of these rules. Jawaharlal Nehru National Urban Renewal Mission (JNNURM) covering 63 cities with population above one million as per 2001 census including 35 metro cities and other State capitals and culturally important towns. Ministry of Ministry of New and Renewable Energy, Government of India is providing financial assistance of setting up of renewable energy plants
PPP options are enabled. various services being provided on PPP basis under SWM are Door to door collection, street sweeping, storage and Transportation, Development of Transfer Station, waste processing, integrated treatment and Disposal and Integrated Solid waste management .
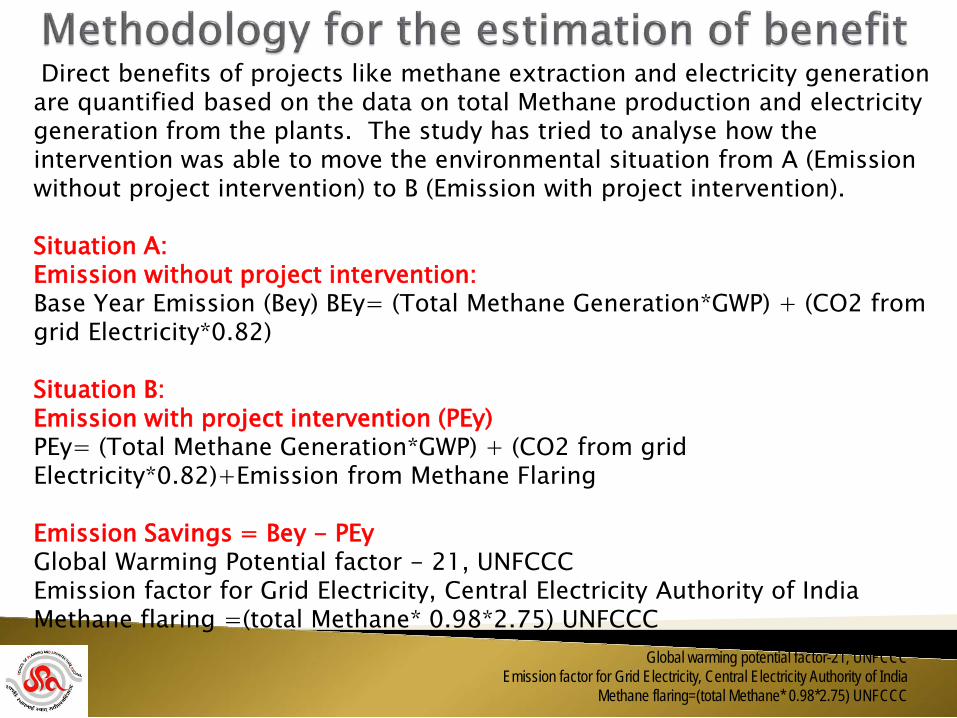
Direct benefits of projects like methane extraction and electricity generation are quantified based on the data on total Methane production and electricity generation from the plants. The study has tried to analyse how the intervention was able to move the environmental situation from A (Emission without project intervention) to B (Emission with project intervention). Situation A: Emission without project intervention: Base Year Emission (Bey) BEy= (Total Methane Generation*GWP) + (CO2 from grid Electricity*0.82) Situation B: Emission with project intervention (PEy) PEy= (Total Methane Generation*GWP) + (CO2 from grid Electricity*0.82)+Emission from Methane Flaring Emission Savings = Bey - PEy Global Warming Potential factor - 21, UNFCCC Emission factor for Grid Electricity, Central Electricity Authority of India Methane flaring =(total Methane* 0.98*2.75) UNFCCC
Global warming potential factor-21, UNFCCC Emission factor for Grid Electricity, Central Electricity Authority of India
Methane flaring=(total Methane* 0.98*2.75) UNFCCC

Sr. No. Description 1951 1961 1971 1981 1991 2001
1 Area (Sq.Km) 8.2 8.2 33.9 55.6 111.2 112.3
2 Population (Million) 0.2 0.3 0.5 0.8 1.5 2.4
3 Growth Rate (%) - 29.1 63.8 64.8 93 62.4
4 Density (Person/Sq.Km) 27,284 35,211 13,934 13,977 13,489 21,677
Source: City Development Plan, Surat
0
0.5
1
1.5
2
2.5
1951 1961 1971 1981 1991 2001
Surat is on of the fast growing cities of India
Po
pu
lati
on
(Mill
ion
)
Year

Year
Primary Collection
MSW Disposed per day (M.T.)
Container Door to Door No. of Container Spots
No. Vehicles
No. Trips per day
MSW Lifted per day (M.T.)
No. Vehicles
No. Trips per day
MSW Lifted per day (M.T.)
2004-05 1548 65 775 750.000 95 255 210.168 1078.118 2005-06 1290 61 600 580.000 125 317 296.306 1010.463 2006-07 1247 61 580 560.000 180 442 447.595 1689.941 2007-08 1193 63 555 502.000 213 514 584.006 1093.719 2008-09 1120 60 500 430.000 225 568 644.626 1121.208 2009-10 1120 61 490 409.910 238 578 649.716 1076.783 2010-11 1120 65 515 486.897 238 566 617.229 1152.732 Source: Surat Municipal Corporation
Initiatives:- Primary Collection, transportation & Transfer station Secondary Transportation. Final disposal. Treatment of Solid Waste.

Coverage: 140.00 sq.km. 69.00 %
Population catered: 3.85 millions i.e. 87.60 % (As per census 2001)
Estimate Present Population catered is 4.40 millions
Length of sewer network: >1300 km.
Existing Sewage Pumping Stations: 32 Nos
Existing Sewage Treatment Plants: 8 nos.
(i) Anjana Sewage Treatment Plant 82.50 MLD capacity
(ii) Bhesan Sewage Treatment Plant 100.0 MLD capacity
(iii) Bhatar Sewage Treatment Plant 120.0 MLD capacity
(iv) Karanj Sewage Treatment Plant 100.0 MLD capacity
(v) Singanpore Sewage Treatment Plant 100.0 MLD capacity
(vi) Bamroli Sewage Treatment Plant 100.0 MLD capacity
(vii) Asarma Sewage Treatment Plant 15.0 MLD capacity
(viii) Khajod Sewage Treatment Plant 25.0 MLD capacity
Out of the total city area of 112.27 sq.km., 92.19 % area and 97.10 % of the present population have been covered with sewerage systems.
Source: Surat Municipal Corporation
Domestic Sewage
Grit Chamber
Primary Clarifier
Aeration Tank
Activated Sludge
Primary Sludge
Secondary Clarifier
Treated Sewage
Sewage gas Holder
Sludge drying Beds/dewatering
Sludge Thickener unit
Anaerobic Sludge Digester
Secondary Sludge
Electricity for Captive purpose
Biogas Engine Generator set
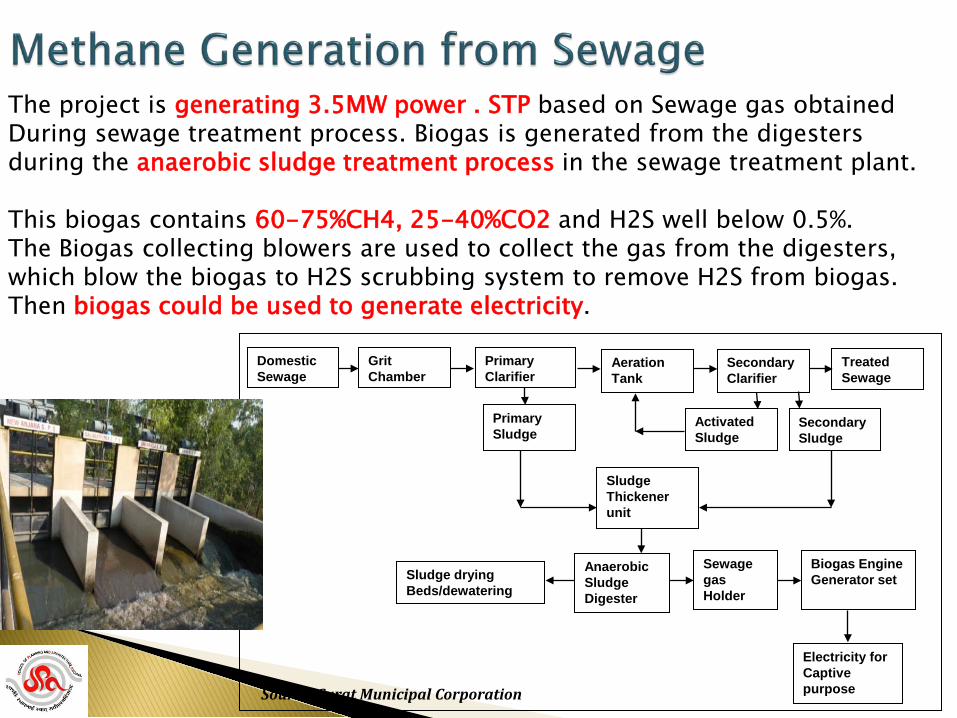
The project is generating 3.5MW power . STP based on Sewage gas obtained During sewage treatment process. Biogas is generated from the digesters during the anaerobic sludge treatment process in the sewage treatment plant. This biogas contains 60-75%CH4, 25-40%CO2 and H2S well below 0.5%. The Biogas collecting blowers are used to collect the gas from the digesters, which blow the biogas to H2S scrubbing system to remove H2S from biogas. Then biogas could be used to generate electricity.
Source: Surat Municipal Corporation

Capacity of sewage based power plants in Surat
Sl.No. Name of the Plant Year of Establishment
Sewage Treatment Capacity
Biogas power capacity of the Plant
1 Anjana Sewage Treatment Plant 2003 82 MLD 0.5 MW
2 Bhatar Sewage Treatment Plant 2008 120 MLD 1 MW
3 Karanj Sewage Treatment Plant 2008 100 MLD 1 MW
4 Singanpore Sewage Treatment Plant 2008 100 MLD 1 MW Source: Surat Municipal Corporation
The project falls under the following categories: Methane recovery in wastewater Treatment’. The project activity involves the measure that recovers methane from biogenic organic matter in wastewater by means of Introduction of biogas recovery. Renewable electricity generation. The project activity involves installation of three 1MW sewage gas based power plants at Bhatar, Karanj and Singanpore generated during treatment of sewage of Surat Municipal Corporation.

Month wise production of Biogas and electricity from STP Based biogas power plants in Surat Anjana Karanj Singanpore Bhatar
Month KWH GAS M3 KWH GAS M3 KWH GAS M3 KWH GAS M3 Oct-08 52026 30604 345113 203008 202603 119178 125704 73944 Nov-08 142743 83966 203249 119558 214752 126325 130193 76584 Dec-08 194290 114288 306171 180101 253650 149206 67880 39929 Jan-09 230461 135565 277271 163101 309637 182139 191525 112662 Feb-09 214697 126292 273064 160626 273493 160878 107998 63528 Mar-09 254398 149646 269088 158287 311758 183387 124604 73296 Apr-09 212759 125152 273130 160665 180952 106442 59694 35114 May-09 215192 126584 311602 183295 270161 158918 144644 85085 Jun-09 229530 135018 267403 157296 269008 158240 169935 99962 Jul-09 224595 132115 148347 87263 222092 130642 89598 52705 Aug-09 251490 147935 0 160280 251770 148100 67527 39722 Sep-09 209040 122965 146304 86061 118371 69630 90709 53358 Total 2431221 1430130 2820742 1819541 2878247 1693085 1370011 805889 Surat Municipal Corporation

Reduction Fossil fuel emissions If the Captive Power Plant was not established, these Sewage Treatment Plants would have taken Power from thermal electricity sources and it would have added more carbon dioxide into the atmosphere because of electricity generation using coal or diesel.
Particular Anjana STP Karanj STP Singanpore STP Bhatar STP Base line Emission CO2 in Tonnes 27581.94 32406.17 36638.69 30351.46
Project Emission of CO2 in Tonnes
4737.88 5702.99 6086.08 5886.37
CO2 Savings in Tonnes 22844.06 26703.18 30888.50 32067.67 Power Consumption from Grid (%) 51.16 49.61 45.49 31.21
Power Consumption from Biogas Plant (%)
48.84 50.39 54.51 68.79
Money Savings due to reduction in grid electricity usage($)
101168.66 127050.38 93128.38 97769.90
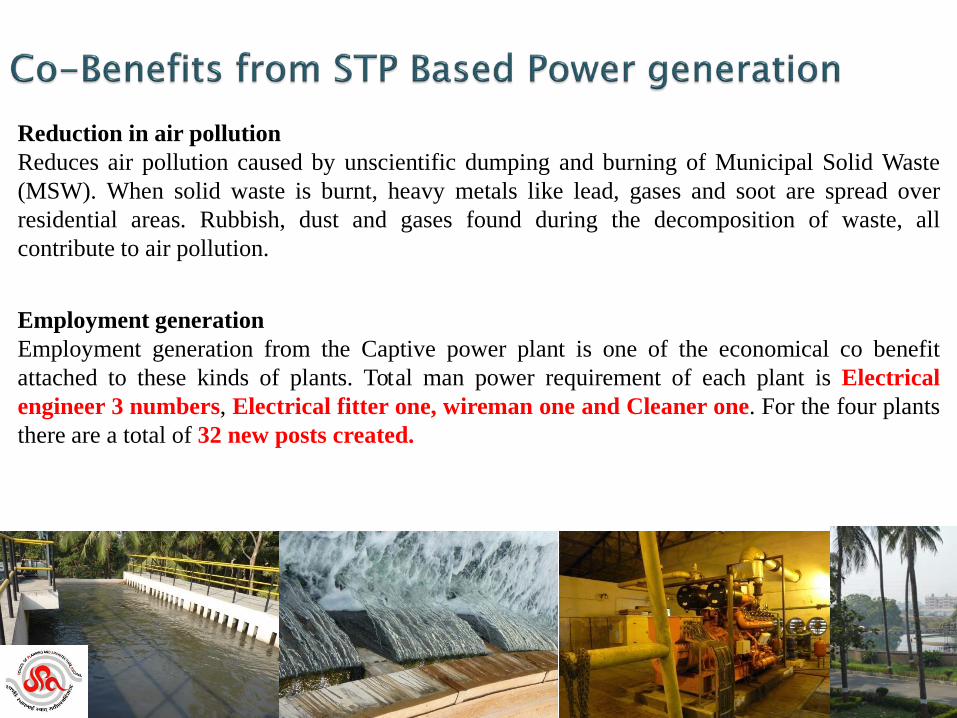
Reduction in air pollution Reduces air pollution caused by unscientific dumping and burning of Municipal Solid Waste (MSW). When solid waste is burnt, heavy metals like lead, gases and soot are spread over residential areas. Rubbish, dust and gases found during the decomposition of waste, all contribute to air pollution.
Employment generation Employment generation from the Captive power plant is one of the economical co benefit attached to these kinds of plants. Total man power requirement of each plant is Electrical engineer 3 numbers, Electrical fitter one, wireman one and Cleaner one. For the four plants there are a total of 32 new posts created.

Reduction in water pollution Proper treating of sewage by following the laid down standards and norms by MoUD CPHEEO, CPCB and GPCB has paved way for improvement in water quality in the water bodies of municipal corporation area. Reduction in Contamination of ground water If the sewage generated in the city is not treated there will be some amount of percolation of contaminated water in to the aquifers and eventually it would be ground water resources.
STP Raw Sewage Treated Sewage Temp. pH SS TDS COD BOD Temp. pH SS TDS COD BOD
Singanpore August
MIN 27.0 7.30 273 465 370.0 186.0 26.9 6.79 56 300 110.0 67.0 MAX 29.0 7.41 340 895 585.0 334.2 29.4 7.98 156 900 268.2 115.0 AVG 28.1 7.37 311 672 490.4 269.0 28.3 7.74 108 655 206.8 91.0
Singanpore April
MIN 30.6 7.31 321 560 500.0 200.0 30.4 7.72 90 768 150.0 73.0 MAX 38.2 7.60 364 1000 632.6 296.4 38.5 8.09 185 1120 286.2 120.0 AVG 34.3 7.40 343 811 535.1 236.6 34.7 7.93 136 938 233.3 97.7
Source: Surat Municipal Corporation

Reduction in occurrence of contagious diseases This project has Till 2006, out of the total city area of 112.27 sq. km., 92.19 % area and 97.10 % of the present population have been covered with sewerage systems. This ensures the pretension of other health issues in the corporation area. In 1994, a pneumonic plague epidemic brockout in Surat and resulted loss of life of several people. These kinds of issues have come down in the city due to the concerted efforts of various stake holders in the Surat City Administration Surat Municipal Corporation Production of Organic waste Waste from the Bio gas production chamber is converted in to organic manure And sold to the farmers in the neighbouring areas.
ANJANA STP KARANJ STP SINGANPORE STP BHATAR STP
Total Organic Manure Generated in Tonnes (Million) 4.44 6.18 4.7 2.5

This is on of the sustainable way of reducing the anthropogenic impact on environment Other than the indented benefits of sewage treatment and biogas based electricity generation, it helps the reduction of CO2, Reduction in Air and water pollution, reduction of contagious diseases. Production of organic manure etc There is a great possibility of replicating the success story of Surat municipal Corporation in other municipal corporations in India. As per 2011 census India has 378 Million urban population Urban Population (million) 378
Water Supply (LPCD) 160
Total Urban water Supply 60470.4
Waste Water (MLD) –(80% of water Supply) 48376.32
