cms web interface user guide · pdf filethe cms web interface is a user-friendly, secure,...
TRANSCRIPT
1
CMS Web Interface User Guide
Last updated: 1/22/18

1
Table of Contents
Introduction ............................................................................................... 6
CMS Web Interface Enhancements for 2017 .................................................................. 6
Excel Template Simplification ................................................................................... 6
Automatic Saving of Data ......................................................................................... 6
One Beneficiary Sample File ...................................................................................... 6
How It Works ............................................................................................................... 6
Accessing the CMS Web Interface .......................................................................... 9
For Groups ......................................................................................................... 12
For APM Entities: Accountable Care Organizations (ACOs) .............................................. 17
What You Can Do in the CMS Web Interface .............................................................. 19
Review the CMS Web Interface Timeline .................................................................... 19
View Progress ............................................................................................... 21
Progress indicators ................................................................................. 22
To Do Cards ................................................................................................ 23
Measure Progress Cards ............................................................................ 31
Activity Cards ....................................................................................... 38
Test Data ........................................................................................ 39
Report Data ..................................................................................... 40
View Sample ..................................................................................................... 40
Beneficiary Details ....................................................................................... 41
Filter Sample by Measure .......................................................................... 44
Filter Sample by Other Criteria ......................................................................... 44
Sort Sample ................................................................................................ 45
Edit Beneficiary Demographic Information ........................................................... 46
Report Data Via Excel ............................................................................................ 49
Download Sample ......................................................................................... 49
Upload Data ................................................................................................ 51
Resolve Errors ....................................................................................... 52

2
Auto-generate your own Excel file ..................................................................... 53
Report Data via Manual Data Entry ............................................................................ 54
Manually Enter Data by Beneficiary .................................................................... 55
Manually Enter Data by Measure .................................................................. 59
View Reports ............................................................................................... 63
Measure Rates ....................................................................................... 64
Activity Log .......................................................................................... 69
Data Confirmation ........................................................................................ 72
Manage Group .............................................................................................. 73
Manage Clinics ...................................................................................... 73
Manage Providers ......................................................................................... 80
Getting Help and Support .................................................................................. 86
Frequently Asked Questions .................................................................................... 86
Contact the Quality Payment Program ................................................................ 86
Useful Resources ........................................................................................... 87
Excel Template User Guide ............................................................................ 87
Excel Demonstration Video ............................................................................ 87
CMS Web Interface Demonstration Video Series ................................................... 87
3
Figure 1 – Quality Payment Program Website Landing Page ............................................... 9
Figure 2 - Sign-In Screen .......................................................................................... 10
Figure 3 – Log-In Verify Code Screen .................................................................................. 11
Figure 4 - QPP Account Dashboard ............................................................................ 12
Figure 5 - Group Reporting Dashboard ....................................................................... 13
Figure 6 - Group Quality Dashboard .......................................................................... 14
Figure 7 - Go Back to Account Dashboard .................................................................. 15
Figure 8 - Go Back to Group Reporting Dashboard ..................................................... 16
Figure 9 - QPP Account Dashboard ............................................................................. 17
Figure 10 - Go Back to Account Dashboard .................................................................... 18
Figure 11 - CMS Web Interface Milestone Timeline ................................................................. 19
Figure 12 - CMS Web Interface View Progress Page at Each Milestone ........................................ 21
Figure 13 - CMS Web Interface Progress Indicators .......................................................... 22
Figure 14 - Reporting in Progress To Do Card When Minimum Not Met ........................................ 23
Figure 15 - Reporting in Progress To Do Card When Minimum Is Met ......................................... 24
Figure 16a - Excel Errors To Do Card with Errors Present ........................................................ 25
Figure 16b - Excel Errors List of Errors ............................................................................... 26
Figure 17 - Excel Errors To Do Card with No Errors ................................................................ 27
Figure 18a - Tip for Improvement To Do Card with Tips Present ............................................... 28
Figure 18b - Tips for Improvement .. ................................................................................ 29
Figure 19 - Tips for Improvement To Do Card with No Tips Available .......................................... 30
Figure 20 - Measure Progress Cards on View Progress Page ................................................ 31
Figure 21 - Measure Progress Card Details .....................................................................32
Figure 22 - Minimum Required Rank Indicator ................................................................. 33
Figure 23 – Measure Performance Rate on Measure Progress Card ....................................... 34
Figure 24 - MIPS Measure Score and Benchmarks on Measure Progress Card ............................ 35
Figure 25 - Manually Enter Data for a Measure from the View Progress Page ............................. 36
Figure 26 - Sort Measure Cards on View Progress Page......................................................37
Figure 27 - Activity Cards on View Progress Page ........................................................... 38
Figure 28 - Test Period Indicator ................................................................................39
Figure 29 - Report Data Page ....................................................................................40
Figure 30 - Beneficiary Sample List ............................................................................. 41
Figure 31 - Tab Options on Beneficiary Sample List ............................................................... 43
Figure 32 - Filter Beneficiary Sample List by a Measure ..................................................... 44
Figure 33 - Filter Beneficiary Sample List by Another Criterion ................................................. 45
Figure 34 - Sort Beneficiary Sample List .......................................................................46
Figure 35 - Edit Beneficiary Demographic Information ...................................................... 47
Figure 36 - Beneficiary Demographic Information Edit Screen ............................................. 48
Figure 37 - Navigate to Report Data Page ............................................................................. 49

4
Figure 38a - Download Beneficiary Sample in Excel Format ................................................ 50
Figure 38b - Select Download Option .......................................................................... 51
Figure 39 – Upload Beneficiary Sample ........................................................................ 52
Figure 40 - Excel Errors Tab on Report Data Page ........................................................ 53
Figure 41 - Auto-save Indicator during Manual Data Entry ................................................. 54
Figure 42 - Continue Where You Left Off ..................................................................... 55
Figure 43 - View for which Measures a Beneficiary is Ranked in the Minimum .......................... 56
Figure 44a – Back to List ... .................................................................................... 57
Figure 44b - See Beneficiary List in Medicare ID Order While Entering Data Manually by Beneficiary.. 57
Figure 45 - Search for a Specific Beneficiary while Entering Data Manually by Beneficiary ........... 58
Figure 46 - Active and Inactive Question Fields When Entering Data Manually .............................. 58
Figure 47 - Real-time feedback on Data Input ............................................................... 59
Figure 48 - Jump to Incomplete Ranks Within a Measure .................................................. 60
Figure 49 - View Whether the Ranked Beneficiary is in the Minimum Reporting Requirement ........... 60
Figure 50 - See Beneficiary List in Rank Order While Entering Data Manually by Measure ................. 61
Figure 51 - Active and Inactive Question Fields When Entering Data Manually .............................. 62
Figure 52 - Real-time Feedback on Data Input ............................................................... 62
Figure 53 - Navigate to View Reports ......................................................................... 63
Figure 54 - Choose a Report to View .......................................................................... 64
Figure 55 - Measure Rates Report .............................................................................. 65
Figure 56 - Measure Cards on the Measure Rates Report................................................... 66
Figure 57 - Measure Rates Report Detailed Breakdown .................................................... 68
Figure 58 - Measure Rates Report Detailed Breakdown Row Close-up ................................... 69
Figure 59 - Filter Activity Log .................................................................................. 69
Figure 60 - Filter Activity Log by Time Frame ................................................................ 70
Figure 61 - Access Detailed View of Each Activity in the Activity Log ......................................... 70
Figure 62 - Jump to Area of Logged Activity to Make Changes ............................................ 71
Figure 63 - Data Confirmation Report ......................................................................... 72
Figure 64 - Navigate to Manage Group ........................................................................ 73
Figure 65 - Edit or Delete a Clinic .................................................................................... 74
Figure 66 - Add a New Clinic .................................................................................... 75
Figure 67 - Add a New Clinic Screen Details .................................................................. 76
Figure 68 - Download Clinic List in Excel Format ............................................................ 77
Figure 69 - Search for a Specific Clinic ........................................................................ 78
Figure 70 - Sort Clinic List ....................................................................................... 79
Figure 71 - Navigate to Manage Providers .......................................................................... 80
Figure 72 - Manage Providers Screen .......................................................................... 81
Figure 73 - Add a New Provider ................................................................................ 82
Figure 74 - Download Providers List in Excel Format ............................................................. 83

5
Figure 75 - Search for a Specific Provider .................................................................... 84
Figure 76 - Sort the Provider List .............................................................................. 85
Figure 77 - Navigate to the Frequently Asked Questions ........................................................ 86
Figure 78 - CMS Web Interface Excel Demonstration Video ............................................... 87

6
Introduction The CMS Web Interface is a user-friendly, secure, internet-based data submission mechanism for Accountable Care
Organizations (ACOs) and groups of 25 or more clinicians to report quality data to the Quality Payment Program
beginning in 2017. It replaces the Physician Quality Reporting System (PQRS) Group Practice Reporting Option (GPRO)
Web Interface.
This user guide shows you how to access the CMS Web Interface, report data, view quality data reporting progress, and
how to get help using the CMS Web Interface. This guide does not contain any real data and only shows fictional
information for demonstration purposes.
CMS Web Interface Enhancements in 2017
We reached out to groups and ACO users to understand their experience using the Group Practice Reporting Option (GPRO)
Web Interface under the legacy Physician Quality Reporting System (PQRS). After hearing from users, we made significant
changes to simplify and improve the reporting experience for the Quality Payment Program.
For returning users who reported for the legacy program via the GPRO Web Interface, ACOs and groups will notice a
few significant differences in the CMS Web Interface.
Excel Template Simplification
To help simplify the process, we eliminated the need to convert to .xml. Instead, you can use the simple, intuitive Ex-
cel template to help reduce the possibility of upload errors. See the Excel Template User Guide for more information
on how to download and upload your beneficiary sample using the Excel template.
Automatic Saving of Data
As you enter data into the CMS Web Interface using either Excel upload or manual data entry, your progress will
automatically be saved with each step--no need to press a submit button. When the submission period closes on
March 16, 2018 at 8:00pm Eastern Standard Time (EST), you will no longer be able to make changes to your data
and your submission will be considered final.
One Beneficiary Sample File
This year, there is just one Excel file that contains your beneficiary sample list. The “CARE 3: Documentation of
Current Medications in the Medical Record” measure from last year that required a second visit-level file has been
retired, so you will only need to upload one file. Please note that in addition to being able to download your beneficiary
samples within the CMS Web Interface beginning January 8, the Beneficiary Sample Files will also be transferred to
Shared Savings Program and Next Generation Accountable Care Organizations on January 8; this transfer happens
outside of the CMS Web Interface.
How it works
CMS generates a sample of beneficiaries for each of the quality measures that are pre-populated in the CMS Web
Interface. To assess which beneficiaries to include in each sample, CMS reviews the Medicare claims submitted by
your organization during the performance period and creates a sample of beneficiaries for each measure based on
the measure criteria. Your group is then asked to report on that sample of beneficiaries.

7
There are 15 quality measures required in the CMS Web Interface including one 2-part composite measure:
• CARE-1: Medication Reconciliation Post-Discharge
• CARE-2: Screening for Future Fall Risk
• DM: Diabetes Mellitus composite measure composed of:
o DM-2: Hemoglobin A1c
o DM-7: Eye Exam
• HTN-2: Controlling High Blood Pressure
• IVD-2: Ischemic Vascular Disease: Use of Aspirin or Another Antiplatelet
• MH-1: Depression Remission at Twelve Months
• PREV-5: Breast Cancer Screening
• PREV-6: Colorectal Cancer Screening
• PREV-7: Influenza Immunization
• PREV-8: Pneumococcal Vaccination Status for Older Adults
• PREV-9: Body Mass Index (BMI) Screening and Follow-Up Plan
• PREV-10: Tobacco Use: Screening and Cessation Intervention
• PREV-12: Screening for Depression and Follow-Up Plan
• PREV-13: Statin Therapy for the Prevention and Treatment of Cardiovascular Disease
For each measure, you’ll be asked to provide the required data for the first 248 consecutive beneficiaries ranked in
that measure, or all beneficiaries in the sample if you have fewer than 248 ranked in the measure.
If you are participating in the Merit-based Incentive Payment System (MIPS), your CMS Web Interface reporting will
contribute to your Quality performance category score, which in turn will count toward your final MIPS score.
Groups and Advanced Alternative Payment Model (APM) Entities that do not complete the minimum reporting
requirement for at least one measure in the CMS Web Interface will receive a MIPS Quality performance category
score of 0.
See the 2017 Quality Payment Program Final Rule (beginning on p. 107) for more information on the quality reporting
requirements through the CMS Web Interface.
Data submission considerations
Some beneficiaries may be skipped because they no longer qualify for a given measure. In order to account for these
skipped beneficiaries CMS may create an oversample, resulting in more than the required 248 beneficiaries ranked in
each measure. Any beneficiary above the 248 mark is considered part of the oversample and is not required to be
completed to get a score for the measure. However, if you skip any beneficiary in the 248 total “minimum,” beneficiaries
ranked above 248 will move into the “minimum” range and will need to be completed.
• Beneficiaries must be reported in consecutive order until you have submitted data on a total “minimum” of 248
consecutively ranked beneficiaries
• If you need to skip a beneficiary in the 248 minimum for the measure, your minimum requirement will increase to 249
in order to report all required data for a total of 248 consecutively ranked beneficiaries
• The more beneficiaries you skip in the minimum, the higher the minimum rank will be for you to complete your
reporting requirement for the measure
When there are fewer than 248 beneficiaries ranked for a measure, you must report all required data for all beneficiaries
in the measure’s sample to be scored on the measure.

8
This page is intentionally left blank

9
Accessing the CMS Web Interface Your path to accessing the CMS Web Interface will differ slightly based on whether you are an Accountable Care
Organization (Medicare Shared Savings Program or Next Generation) or participating in MIPS as a group.
Signing into the CMS Web Interface (all users):
• Go to qpp.cms.gov and click on “Sign In” at the top right corner (Figure 1).
Figure 1. Quality Payment Program Website Landing Page

10
• Enter your EIDM username and password (Figure 2).
NOTE: Don’t have an EIDM account? Review the Enterprise Identity Data Management (EIDM) User Guide (Groups) or Enterprise Identity Data Management (EIDM) ACO User Guide (ACOs).
Figure 2. Sign-in Screen
• If you have already provided your mobile phone number, you will get a verification code sent to your mobile
phone. Once you receive the code, enter the number into the “One-Time Code” field and click on “Submit
Code” (Figure 3). If you have not yet provided your phone number, you will be prompted to provide a phone
number before you can receive and enter your verification code.

11
Figure 3. Log-In Verify Code Screen

12
For Groups
Once logged in, if you are part of a Group, you will see the Account Dashboard which will list all the practices for
which you can report data; this is based on permissions/roles associated with your EIDM account.
1. Select “Report as a group” next to the Group for which you’d like to report quality data through the CMS Web
Interface (Figure 4).
Figure 4. QPP Account Dashboard

13
2. Next, select “Start Reporting” under the Quality Measures title (Figure 5).
Figure 5. Group Reporting Dashboard
14
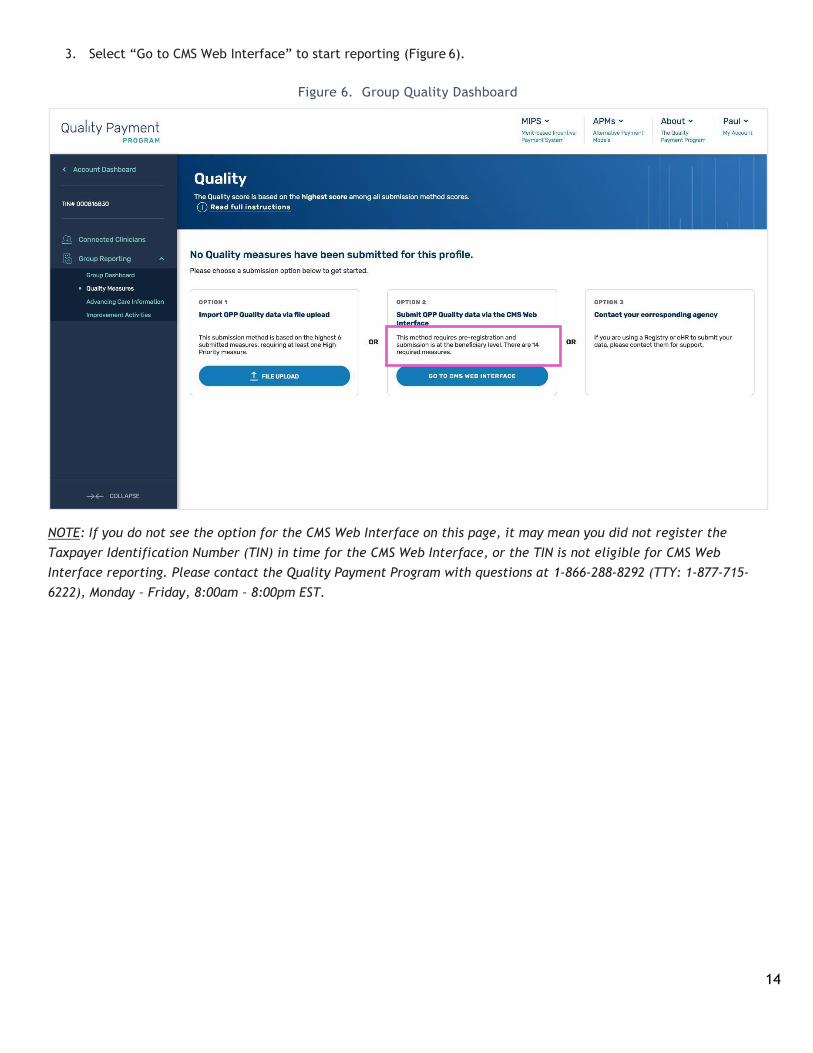
3. Select “Go to CMS Web Interface” to start reporting (Figure 6).
Figure 6. Group Quality Dashboard
NOTE: If you do not see the option for the CMS Web Interface on this page, it may mean you did not register the
Taxpayer Identification Number (TIN) in time for the CMS Web Interface, or the TIN is not eligible for CMS Web
Interface reporting. Please contact the Quality Payment Program with questions at 1-866-288-8292 (TTY: 1-877-715-
6222), Monday – Friday, 8:00am – 8:00pm EST.

15
4. You can go back to the Account Dashboard at any time by clicking the “Account Dashboard” item at the top
of the left-hand navigation (Figure 7).
Figure 7. “Go Back” to Account Dashboard
16
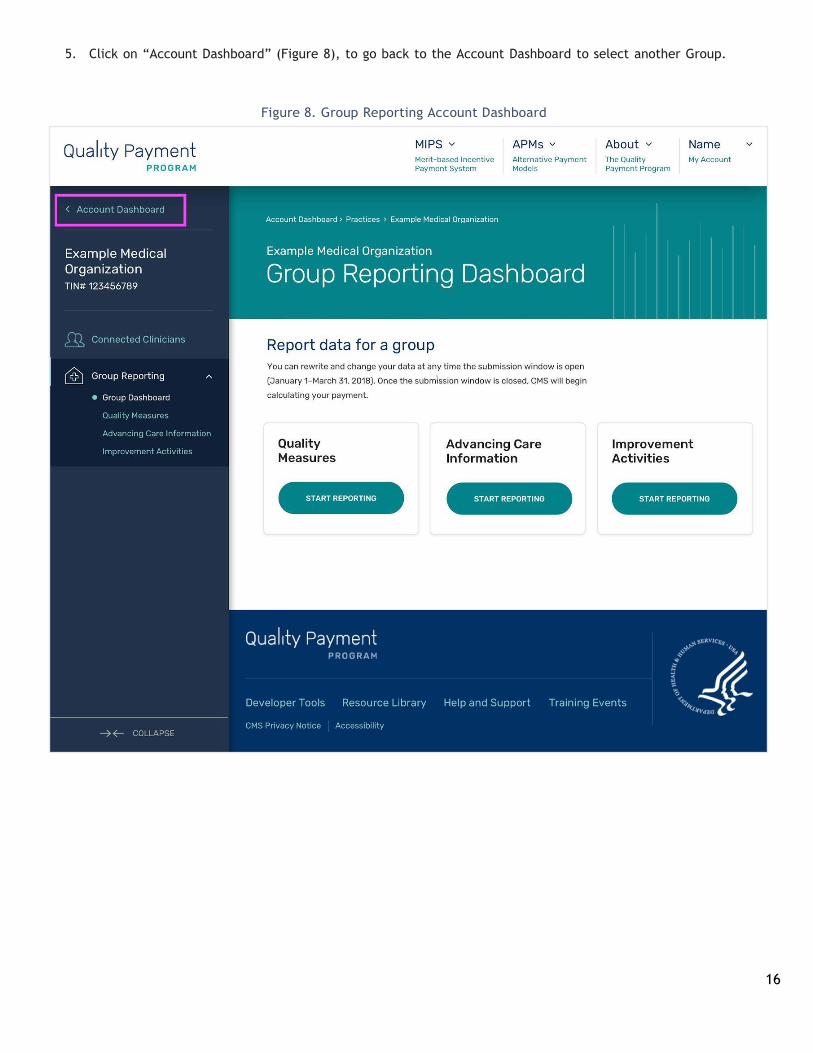
5. Click on “Account Dashboard” (Figure 8), to go back to the Account Dashboard to select another Group.
Figure 8. Group Reporting Account Dashboard
17
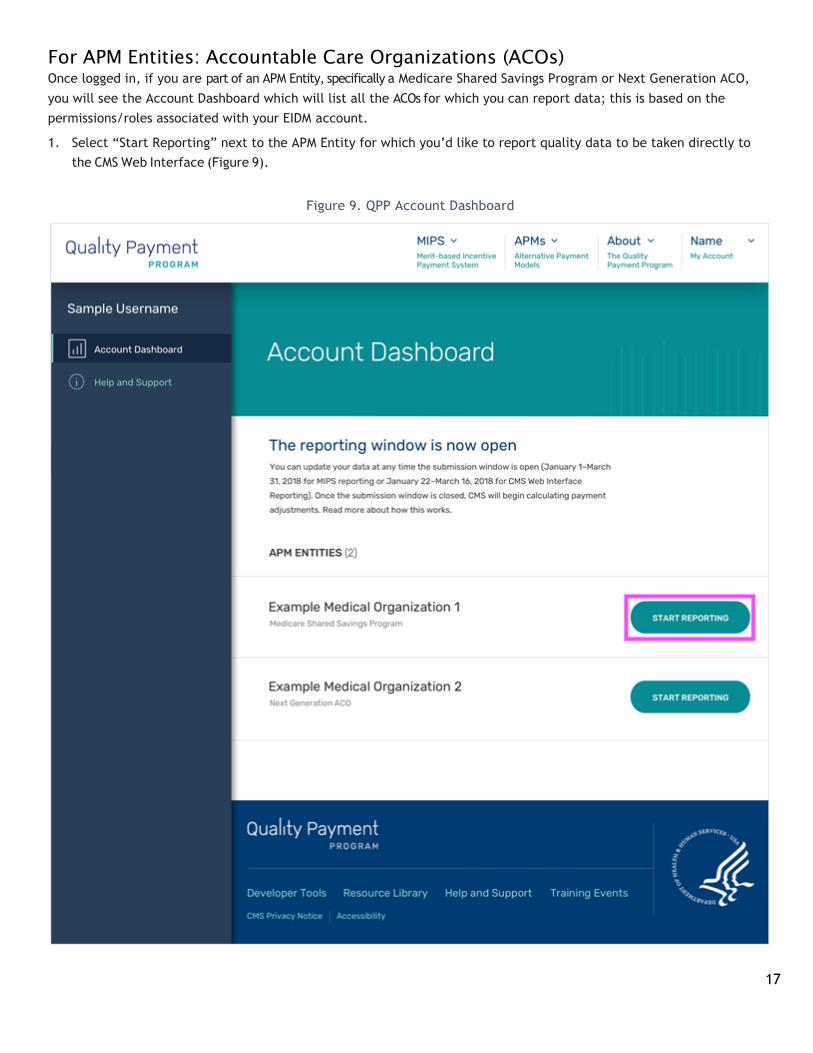
For APM Entities: Accountable Care Organizations (ACOs)
Once logged in, if you are part of an APM Entity, specifically a Medicare Shared Savings Program or Next Generation ACO,
you will see the Account Dashboard which will list all the ACOs for which you can report data; this is based on the
permissions/roles associated with your EIDM account.
1. Select “Start Reporting” next to the APM Entity for which you’d like to report quality data to be taken directly to
the CMS Web Interface (Figure 9).
Figure 9. QPP Account Dashboard

18
2. You can go back to the Account Dashboard at any time by clicking the “Account Dashboard” item at the top of
the left-hand navigation (Figure 10).
Figure 10. “Go Back” to Account Dashboard
19
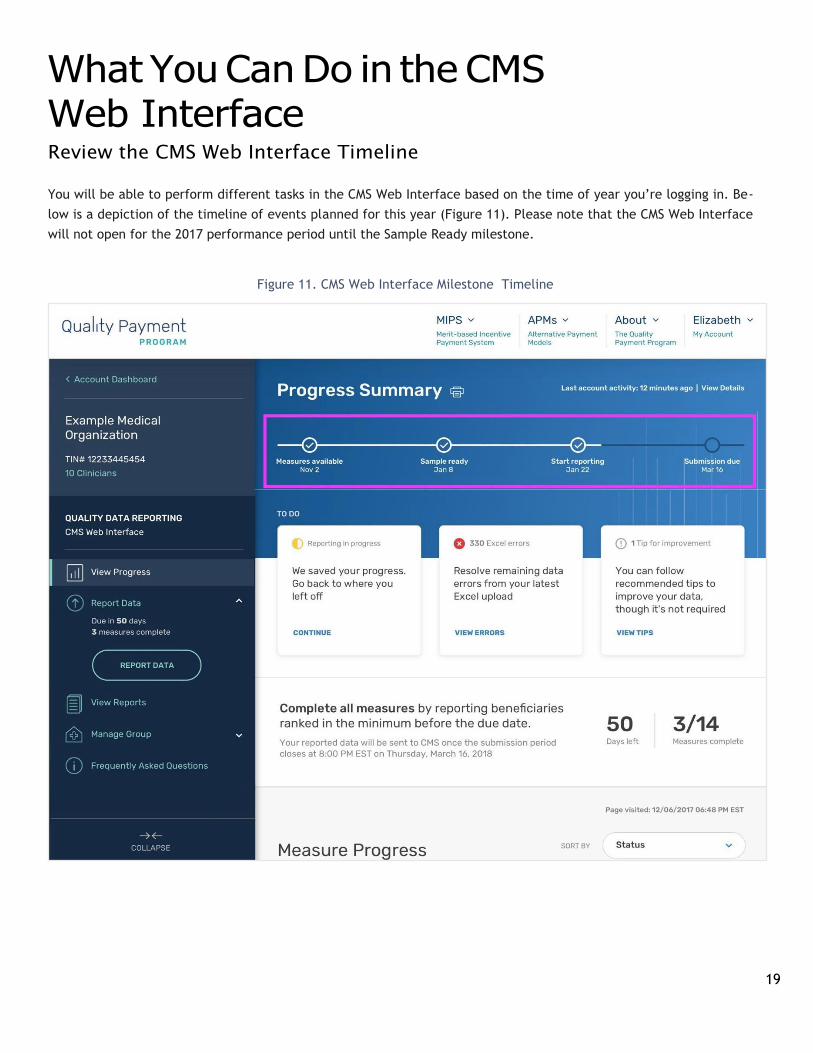
What You Can Do in the CMS Web Interface Review the CMS Web Interface Timeline
You will be able to perform different tasks in the CMS Web Interface based on the time of year you’re logging in. Be-
low is a depiction of the timeline of events planned for this year (Figure 11). Please note that the CMS Web Interface
will not open for the 2017 performance period until the Sample Ready milestone.
Figure 11. CMS Web Interface Milestone Timeline

20
Measure Specifications: “Measures Available” Milestone
Measure specifications for the CMS Web Interface were made available following publication of the Quality Payment
Program 2017 Final Rule in October 2016, so this is the first milestone you will see on the timeline. The CMS Web
Interface will not open for the 2017 performance period until the Sample Ready milestone.
Download Beneficiary Sample: “Sample Ready” Milestone
For the 2017 performance period, your Medicare beneficiary sample will be available for download on January 8,
2018. As soon as your sample is ready, the CMS Web Interface will go into “Test Mode” where you’ll be able to:
• Log into the CMS Web Interface - see the “Accessing the CMS Web Interface” section of the guide.
• Review your sample. See the “View sample” section of the guide.
• Download your sample. See the Excel Template User Guide.
• Work on filling in your data in the Excel template offline. See the Excel Template User Guide.
• Upload your data to test out the CMS Web Interface. See the Excel Template User Guide.
• Manually enter test data by beneficiary or by measure into the CMS Web Interface. See the “Enter data
manually” section of the guide.
• Run the Measure Rates and Activity Log reports. See the “View Reports” section of the guide.
NOTE: On January 19, 2018 at 8:00pm Eastern Standard Time (the end of the test period), ALL DATA YOU UPLOADED TO THE CMS Web Interface WILL BE ERASED FROM OUR SYSTEMS AND WILL NO LONGER SHOW in the CMS Web Interface.
You may keep your data in the provided Excel template offline, but you will need to re-upload this data once the test
period is over. To save any progress you’ve made during the test period, follow these steps:
1. Navigate to the Test Data page.
2. Click the Download button.
3. Select “Sample with data”.
4. Click OK.
5. Save your Excel template with the data you’ve entered offline until the Start Reporting milestone opens.
Submission Period Opens: “Start Reporting” Milestone
On January 22, 2018 at 12:01am Eastern Standard Time, the CMS Web Interface will open for reporting. Any previous
test data you may have uploaded or entered during the test period will have been erased. Once the submission period
opens and you begin to upload or manually enter your data, your progress wi be saved with each step, so you do not
need to worry about “submitting” or “saving” any data throughout the submission period. All features of the CMS Web
Interface are available to you during the submission period and more information about each feature is detailed below
in this guide.
Submission Period Closes: “Submission Due” Milestone
When the submission period closes on March 16, 2018 at 8:00pm Eastern Standard Time, the CMS Web Interface will
not allow you to input or change any more information. Any data in the CMS Web Interface as of this date and time will be
considered your final submission. At this time, the Data Confirmation report will be available, displaying a receipt of
the data CMS received. Please note that you will still be able to access the CMS Web Interface after the close of the
submission period to run reports; the 2017 performance reports will be available for three years following the
2017 submission period.

21
View Progress
When you access the CMS Web Interface, you will land on the View Progress page where you can see your organization’s
progress and team activity in the CMS Web Interface (Figure 12).
Depending on the time of year you access the system, you may see a different version of the functionality available at
the time (see the “Review program milestones” section above for more information).
Figure 12. CMS Web Interface View Progress Page at Each Milestone

22
Progress indicators
Throughout the CMS Web Interface and in the left-side navigation, you will see an indicator that shows how many
days are left until the submission is due—and for how many measures you have met the minimum reporting
requirement. These will help you stay on track with reporting (Figure 13).
NOTE: The CMS Web Interface shows that there are 14 measures total as opposed to 15. This is because the DM
measure is a composite measure that comprises 2 measures. In the CMS Web Interface, the DM measure counts as
one measure, though you will need to report the minimum reporting requirement for both DM-2 and DM-7 to receive
a score.
Figure 13. CMS Web Interface Progress Indicators

23
To Do Cards
At the top of the View Progress page during the submission period, you will see three To Do items that will update
throughout the submission period.
The first card is titled “Reporting in progress.” It contains a link that takes you back to where you left off in a previous
session. If the CMS Web Interface times out for security purposes, the “Continue” link in this card will take you back
to the last action you performed in the interface—whether you were entering data manually or uploading an Excel file
(Figure 14).
Figure 14 - Reporting in Progress: To Do Card When Minimum Not Met
24
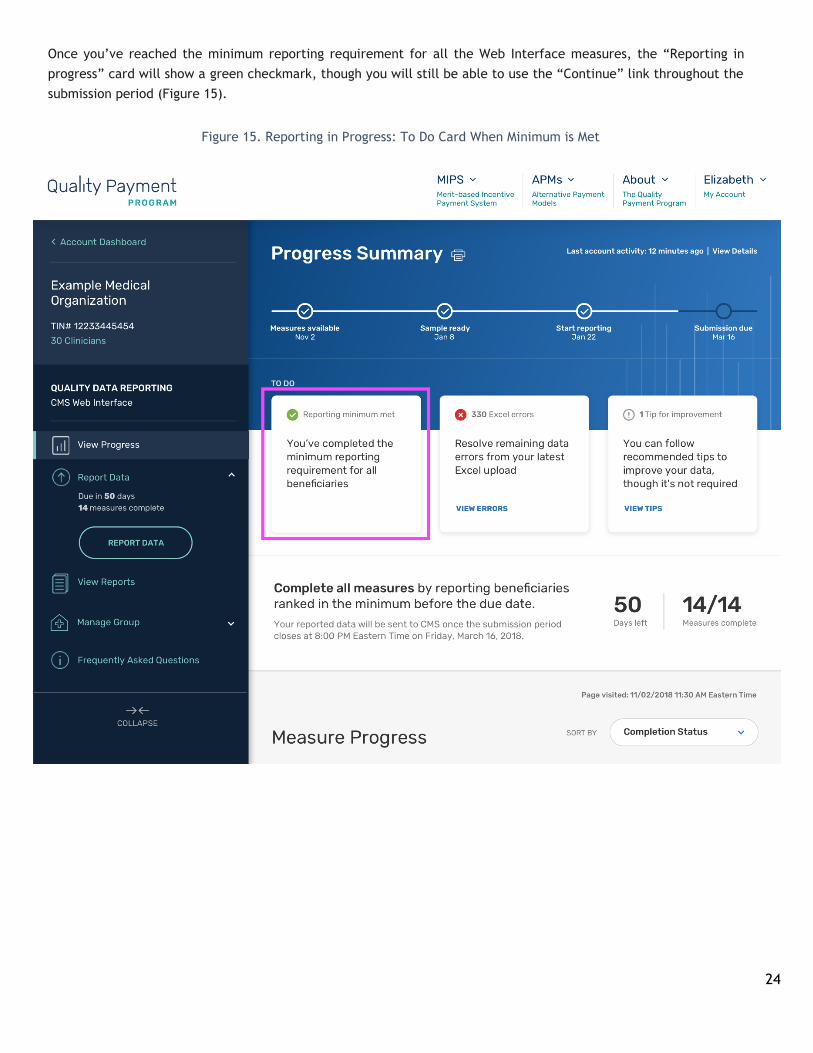
Once you’ve reached the minimum reporting requirement for all the Web Interface measures, the “Reporting in
progress” card will show a green checkmark, though you will still be able to use the “Continue” link throughout the
submission period (Figure 15).
Figure 15. Reporting in Progress: To Do Card When Minimum is Met
25
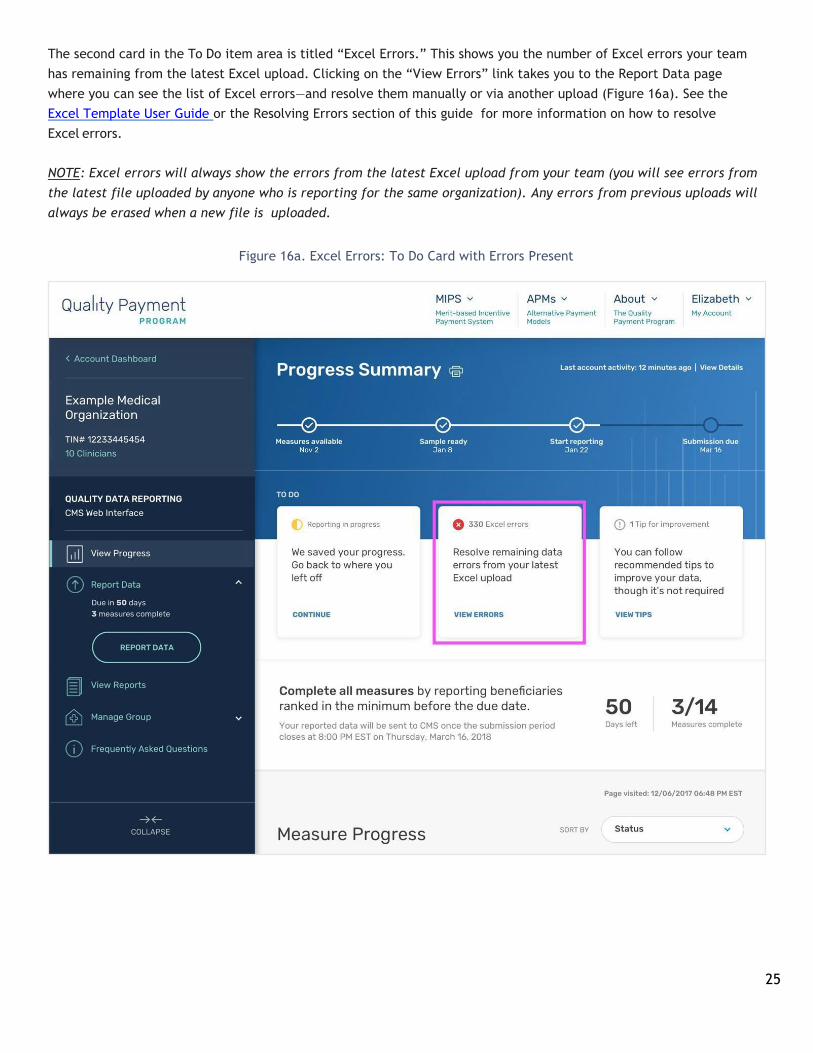
The second card in the To Do item area is titled “Excel Errors.” This shows you the number of Excel errors your team
has remaining from the latest Excel upload. Clicking on the “View Errors” link takes you to the Report Data page
where you can see the list of Excel errors—and resolve them manually or via another upload (Figure 16a). See the
Excel Template User Guide or the Resolving Errors section of this guide for more information on how to resolve
Excel errors.
NOTE: Excel errors will always show the errors from the latest Excel upload from your team (you will see errors from
the latest file uploaded by anyone who is reporting for the same organization). Any errors from previous uploads will
always be erased when a new file is uploaded.
Figure 16a. Excel Errors: To Do Card with Errors Present
26
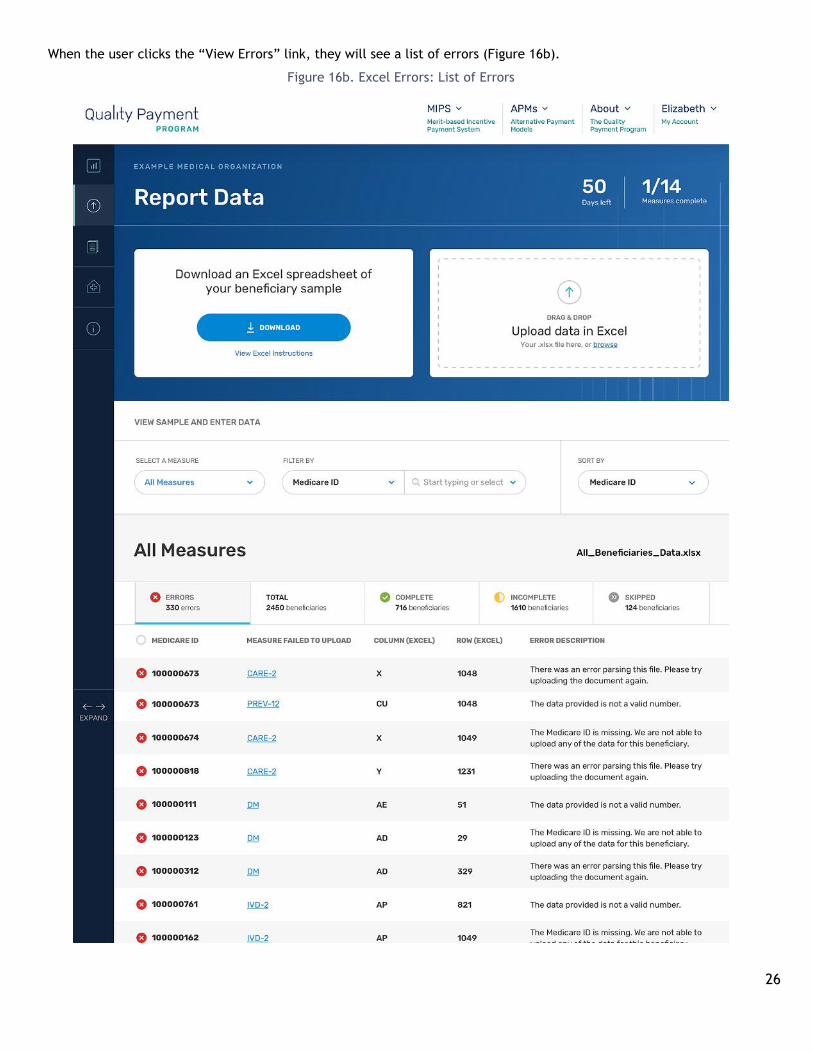
When the user clicks the “View Errors” link, they will see a list of errors (Figure 16b).
Figure 16b. Excel Errors: List of Errors
27
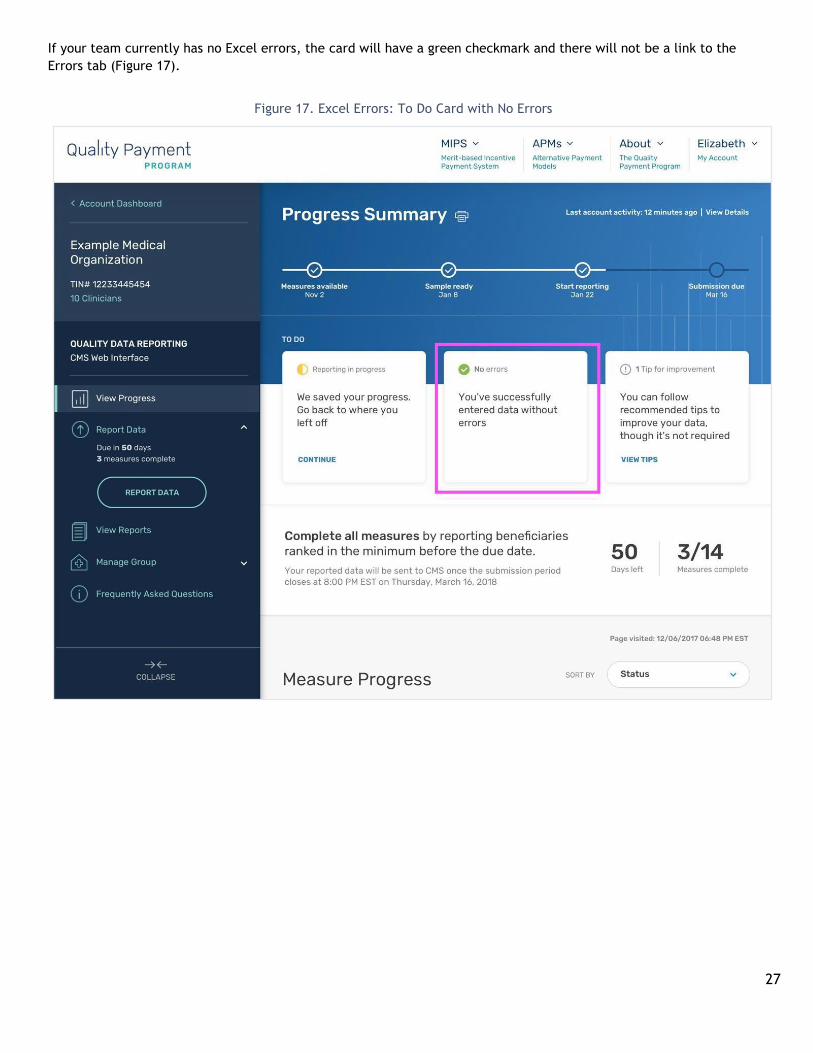
If your team currently has no Excel errors, the card will have a green checkmark and there will not be a link to the
Errors tab (Figure 17).
Figure 17. Excel Errors: To Do Card with No Errors

28
The last car in the ‘To Do’ items area is the “Tips for Improvement” card. If you have skipped an unusually high
number of beneficiaries in your sample, the “Tips for Improvement” card will notify you that you may want to review
your data entry before final submission. Tips for improvement are not required to be resolved before submission. You
can have a successful submission without resolving the tips for improvement. Clicking on the “View Tips” link will
show you the first improvement tip (Figure 18a).
Figure 18a. Tip for Improvement: To Do Card with Tips Present

29
Tips for improvement are identified in the Measure Progress details (Figure 18b).
Figure 18b. Tips for Improvement

30
If your skip rate is within expected ranges, you will not have any tips for improvement and the card will have a green
checkmark without a link (Figure 19).
Figure 19. Tips for Improvement: To Do Card with No Tips Available

31
Measure Progress Cards
Further down on the View Progress page, you will see cards that detail your team’s progress for each of the CMS Web
Interface measures (Figure 20).
Figure 20 - Measure Progress Cards on View Progress PageEach card contains the following information (Figure 21):

32
• Lowest and highest rank in the sample for the measure.• Consecutively complete - The number of beneficiaries for whom your team has answered all relevant questions
for that measure in consecutive order.
• Skipped - Beneficiaries who could not be confirmed for the measure or are excluded from the denominator based on the answers you provided to the required questions.
Figure 21. Measure Progress Card Details

33
• Minimum required rank - The progress bar within each measure card shows the minimum number of beneficiaries for which your team needs to consecutively report to receive a score for the measure. If you skip beneficiaries within the minimum, the minimum required increases automatically on this page to show you the new minimum required (Figure 22).
You can always report on more than the minimum beneficiaries required.
Figure 22. Minimum Required Rank Indicator

34
Once your team begins to report data for a measure, you will also see the following information on the right side of
each measure card (Figure 23):
• Denominator - Beneficiaries that qualify to be evaluated for each measure are part of the denominator.
• Numerator - Once a beneficiary is confirmed for that measure (included in the denominator), there are certain
answers to measure questions that will include that beneficiary in the numerator. The numerator and
denominator will be used to calculate your performance rate for that measure.
• Measure performance rate - Which is the numerator divided by the denominator.
Figure 23. Measure Performance Rate on Measure Progress Card

35
Lastly the card shows your performance on the measure by showing you (Figure 24):
• MIPS measure score - This is a combination of your performance points and your bonus points. (NOTE: MIPS
scores will only appear for group users who are participating in MIPS. ACOs will not see MIPS measure scores this
year).
• Benchmarks - Your score and how your performance compares against the established benchmarks if bench-
marks are available.
• Bonus points - If you have earned any end-to-end, high priority, or outcome bonus points for the measure,
these will appear on the right side of the card. To earn end-to-end bonus points for the measure, use the
provided Excel template to upload your data (see the Excel Template User Guide for more information).
Figure 24. MIPS Measure Score and Benchmarks on Measure Progress Card

36
To enter data manually for the measure, click on the “Enter Data” link in the top right corner of the card (Figure 25).
Figure 25 - Manually Enter Data for a Measure from the View Progress
You can sort the measure progress cards on this page in the order you prefer to see them. By default, the cards are
ranked in Completion Status Order, from complete to incomplete (Figure 26). You can also sort by:
• Completion Status - from complete to incomplete to not started
• Performance Rate-from low to high
• Measure Name - from A to Z

37
Figure 26 - Sort Measure Cards on View Progress Page

38
Activity Cards
The end of the View Progress page contains the latest activities your team performed in the CMS Web Interface. You
can see your team’s last three activities as well as your own last three activities so you can track the progress of your
submission. You can click on the “View Activity Log report” link at the bottom to see a more comprehensive report
on your team’s activity (Figure 27).
Figure 27 - Activity Cards on View Progress Page

39
Test Data
Once your sample is ready, you can test out the CMS Web Interface using your data to learn and get familiarized with
how to use the CMS Web Interface for reporting data.
During the test period (January 8-19, 2018), you can upload data in Excel format or enter data via manual data
entry (Figure 28). Any data submitted during the test period will be deleted on January 19, 2018 at 8:00pm
Eastern Standard Time. You can download any data you tested during the test period and save it offline until the
“Start reporting” milestone opens. To do so:
1. Navigate to the Test Data page.
2. Click the Download button.
3. Select “Sample with data”.
4. Click OK.
5. Save your Excel template with the data you’ve entered offline until the Start Reporting milestone opens.
Figure 28 - Test Period Indicator

40
Report Data
View Sample
Once your sample is ready, you can view your sample in two ways (Figure 29):
• Within the CMS Web Interface: Click on “Report Data” to view your beneficiary sample list within the CMS Web
Interface. Upon landing here, you can review, sort, and filter the list directly in the CMS Web Interface. Please
note that in addition to being able to download your beneficiary samples within the CMS Web Interface beginning
January 8, the Beneficiary Sample Files will also be transferred to ACOs on January 8; this transfer happens
outside of the CMS Web Interface.
• Download in Excel template: Alternatively, you can download your beneficiary sample in the provided Excel
template by clicking the Download button at the top of the Report Data page.
Figure 29 - Report Data Page
41
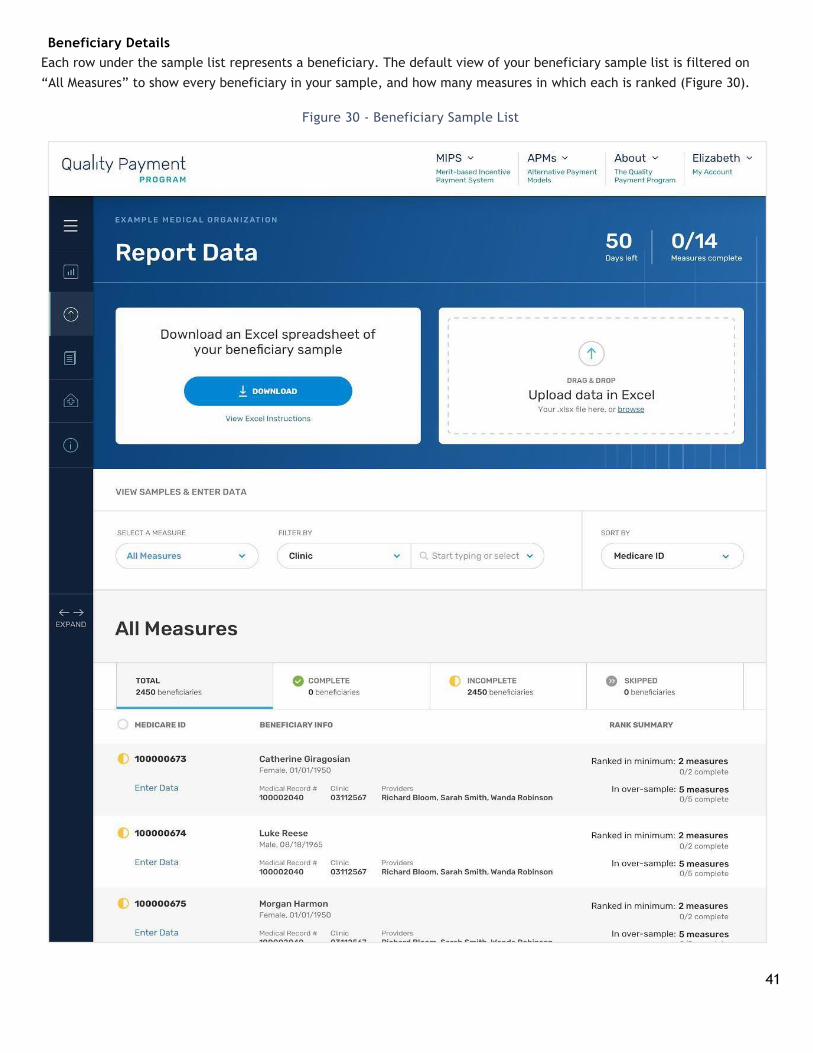
Beneficiary Details
Each row under the sample list represents a beneficiary. The default view of your beneficiary sample list is filtered on
“All Measures” to show every beneficiary in your sample, and how many measures in which each is ranked (Figure 30).
Figure 30 - Beneficiary Sample List

42
For each beneficiary, you can see:
• Beneficiary completion status - Each beneficiary will have one of the following three statuses:
Incomplete - If you have not entered appropriate data for all measures in which the beneficiary is ranked
(both those for which the beneficiary is ranked in the minimum and those that they are ranked in the over-
sample), the beneficiary will show as incomplete. To change the beneficiary’s status to “Complete”, report
data for each measure that the beneficiary is ranked in either via manual data entry through the CMS Web
Interface or an Excel upload. A beneficiary may show as incomplete even if all measures for which that
beneficiary is ranked in the minimum have been filled out entirely. The minimum rank is a floating number
through the submission process, so beneficiaries who do not start in the minimum may become part of the
minimum if those ranked before them are skipped.
NOTE: You do NOT need to complete the oversample measure data to have a successful submission. You
need only to answer questions for measures in which the beneficiary is ranked in the minimum. A
complete submission is one for which the minimum reporting requirement for each measure is met.
Complete - Beneficiaries in the complete tab are beneficiaries that have all their ranked measures com-
pleted, regardless whether the measure is ranked in the minimum or in the oversample.
Skipped - Skipped beneficiaries are those that cannot be confirmed for the sample.
• Medicare ID - The Medicare beneficiary’s Health Insurance Claim Number. This field will be pre-filled by CMS.
• Beneficiary Info - Contains the beneficiary’s demographic information including:
o First and last name
o Gender
o Birthdate
o Medical Record # - This is an optional field you can fill in if you would like to associate the beneficiary with a number that your organization uses internally to track patients. It will not have a pre-filled value. See the “Edit Beneficiary Demographic Data” section of the guide for instructions on how to do this.
o Clinics - The patient can be associated with up to one Clinic ID so you can more easily track down their medical record. See the “Manage Clinics” and “Edit Beneficiary Demographic Data” sections on how to do this.
o Providers - The patient can be associated with up to three providers, so you can more easily locate his or her medical record. See the “Manage Providers” and “Edit Beneficiary Demographic Data” sections on how to do this.
• Rank Summary - Under rank summary, you can see the number of measures in which the beneficiary is ranked
in the minimum as well as the number of measures where the beneficiary is part of the oversample. These
numbers are fluid and will change if lower ranked beneficiaries are skipped. The number of measures in which
the beneficiary is ranked in the minimum or in the oversample will be updated automatically in the CMS Web
Inter- face if a beneficiary moves into the minimum due to a skip.
You can use the tabs at the top of the list to filter the list by beneficiary status (Figure 31).

43
Figure 31 - Tab Options on Beneficiary Sample List
Under the Total tab, you can see your complete beneficiary sample list.
The Complete tab will filter the list of beneficiaries to show only those for whom you have completed all measures in
which they are ranked.
The Incomplete tab filters the list to show only beneficiaries for whom not all measures have been reported. NOTE:
if a beneficiary is ranked in the oversample for some measures, they will still show as “Incomplete” even when you
have reported all measures in which that beneficiary is ranked in the minimum. You do NOT need to report the
oversample measures for the beneficiary to have a successful submission, but these beneficiaries will still show as
Incomplete. You can check whether you have met the minimum for each measure using the View Progress page or
the Measure Rates Report.
In the Skipped tab, you will see only beneficiaries who you have skipped from all measures.
When looking at All Measures, skipped beneficiaries are beneficiaries that could not be confirmed for the sample.
44
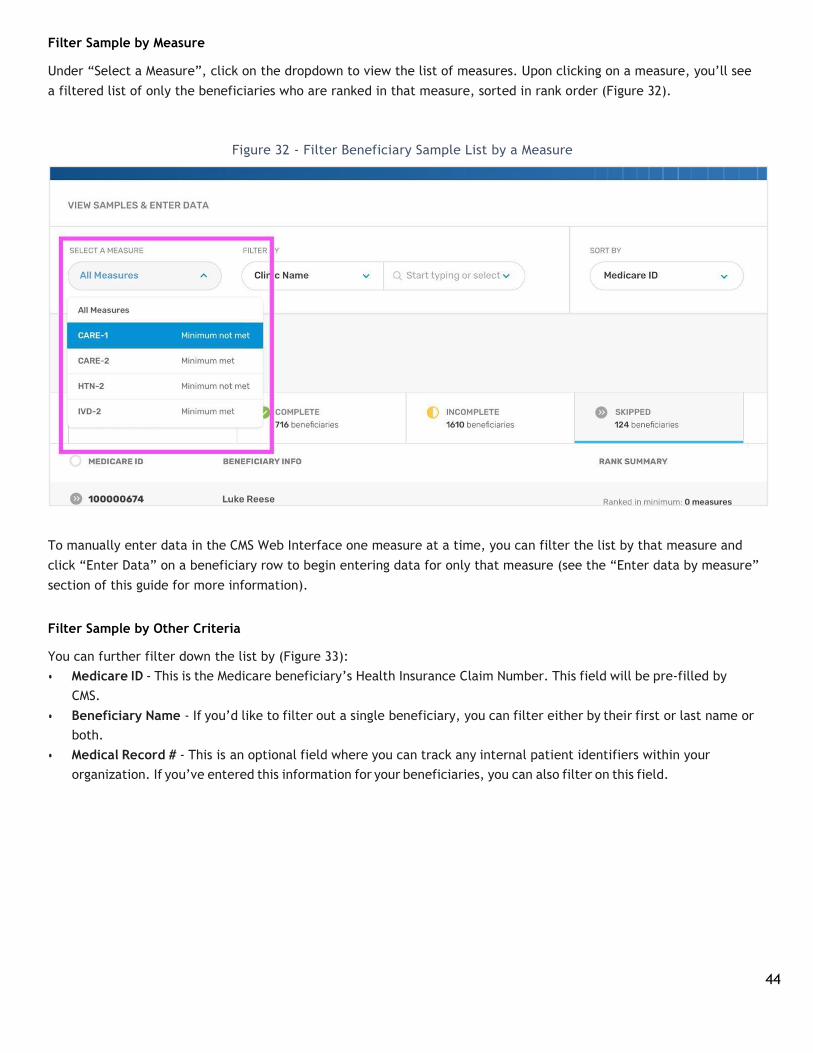
Filter Sample by Measure
Under “Select a Measure”, click on the dropdown to view the list of measures. Upon clicking on a measure, you’ll see
a filtered list of only the beneficiaries who are ranked in that measure, sorted in rank order (Figure 32).
Figure 32 - Filter Beneficiary Sample List by a Measure
To manually enter data in the CMS Web Interface one measure at a time, you can filter the list by that measure and
click “Enter Data” on a beneficiary row to begin entering data for only that measure (see the “Enter data by measure”
section of this guide for more information).
Filter Sample by Other Criteria
You can further filter down the list by (Figure 33):
• Medicare ID - This is the Medicare beneficiary’s Health Insurance Claim Number. This field will be pre-filled by
CMS.
• Beneficiary Name - If you’d like to filter out a single beneficiary, you can filter either by their first or last name or
both.
• Medical Record # - This is an optional field where you can track any internal patient identifiers within your
organization. If you’ve entered this information for your beneficiaries, you can also filter on this field.

45
Figure 33 - Filter Beneficiary Sample List by Another Criterion
Once you have selected a specific filter type, enter the specific query into the adjoining field to further filter the list.
Sort Sample
You can sort your beneficiary sample list by the following criteria to help you prioritize your work (Figure 34):
• Medicare ID - This is the Medicare beneficiary’s Health Insurance Claim Number. This field will be pre-filled by
CMS. You can sort the list in ascending numerical order on this number.
• Beneficiary Last Name - You can sort the list in ascending alphabetical order of the beneficiaries’ last names.
• Medical Record Number - Or “Medical Record #”. If you track patients by an internal numbering system, you can
enter that number in the Medical Record Number field (see “Edit beneficiary demographic information” in this
guide) and sort the list in ascending order by that criteria.
• Number of Measures Ranked in Minimum - Or “# of Measures Ranked in Minimum”. You can sort the beneficiary
sample list from highest to lowest to see the patients who are ranked in the most measures first to help you
prioritize your work.

46
Figure 34 - Sort Beneficiary Sample List
Edit Beneficiary Demographic Information
Some beneficiary demographic information can be updated via an Excel upload, while other pieces of demographic
information can only be edited manually through the CMS Web Interface. We do this to prevent you from accidentally
editing demographic information in bulk that would prevent you from locating the beneficiary later to fix the issue.
You can edit the following fields via an Excel upload safely:
• Medical Record Number - Or “Medical Record #” are internal numbering system that you can assign to
beneficiaries.
• Provider Name 1, 2 & 3 - Providers, or doctors that provide the bulk of care to a beneficiary ranked by volume of
primary care services provided. A beneficiary can have more than one provider.
• Clinic ID - Are also known as clinic’s Tax Identification Number (TIN).
• General Comment - Any additional information you want to note down with a beneficiary can go underneath
general comment.
Some beneficiary demographic information can only be edited manually in the CMS Web Interface. These fields
include:
• First Name
• Last Name
• Date of Birth
• Gender

47
To edit a beneficiary’s demographic information through the CMS Web Interface (Figure 35):
1. Navigate to the Report Data page.
2. Select “Enter Data” next to the beneficiary for whom you’d like to change information.
3. Click on “Edit Info” in the right-hand column of the page.
Figure 35 - Edit Beneficiary Demographic Information
4. A window will appear where you can edit the beneficiary’s demographic information (Figure 36).

48
Figure 36 - Beneficiary Demographic Information Edit Screen
The Provider Name and Clinic Name information fields are input fields that turn into dropdowns when you begin typing.
You can only associate clinics and providers that are already in your system. To add, change or delete the clinics and
providers in these lists, see the “Manage Clinics/Providers” section of this guide.

49
Report Data Via Excel
In 2017, .xml file conversion is no longer necessary or available for reporting and uploading your sample data. You can
download your organization’s beneficiary sample in the .xlsx format with an intuitive Excel template for easy
reporting. Once your Excel reporting is complete, upload the template without any conversion.
Download Sample
To download your sample using the Excel template (Figure 37):
1. Log into the CMS Web Interface
2. Navigate to the Report Data page
Figure 37 - Navigate to Report Data Page

50
3. Click the Download link at the top of the page (Figure 38a):
Figure 38a - Download Beneficiary Sample in Excel Format

51
4. Select your download preference (Figure 38b):
Figure 38b - Select Download Option
• Sample with Data - Your template will be populated with any data you and your team have already entered in
the CMS Web Interface—either manually or via a previous Excel upload.
• Sample without Data - Your template will only contain CMS pre-filled data. It will be your original sample before
your team inputs any data into the CMS Web Interface.
If you’re downloading your sample for the first time before entering any data, select the Sample without Data option.
For instructions on how to fill in the Excel template, see the Excel Template User Guide.
Upload Data
To upload data to the CMS Web Interface, you can either:
• Simply drag and drop your completed Excel template in .xlsx format into the Upload field in the CMS Web
Interface (Figure 39).
OR • Use the “Browse” functionality within the Upload field in the CMS Web Interface to locate the appropriate Excel
file from your computer’s file system (Figure 39).

52
Figure 39 – Upload Beneficiary Sample
Once you’ve input your data into the system, you’ll get a confirmation message, warning you that your data will be
overwritten on approval.
When you’re ready to proceed, click “Ok.”
You can upload Excel files as many times and as frequently as you’d like. You can upload partially complete Excel
files. You can upload data one measure at a time, or one beneficiary at a time.
Only the data you have specifically entered into the Excel template will be overwritten in the system. Any fields left
blank will NOT be overwritten. Any fields for which “N/A” is selected, will be specifically overwritten with an empty
value in the CMS Web Interface.
Resolve Errors
Once your Excel file is uploaded into the system, you may find errors that occur from some of your beneficiary data.
The system will not update the measure data for which errors are found—you’ll need to re-upload or manually enter
the data to fix the error. You can find the list of errors in this way (Figure 40):
1. Navigate to the Report Data page
2. Click on the “Errors” tab at the top of the sample list
To easily locate the problematic data in your Excel file, the list of errors provides information including:
• Medicare ID of the beneficiary whose data has the specific error
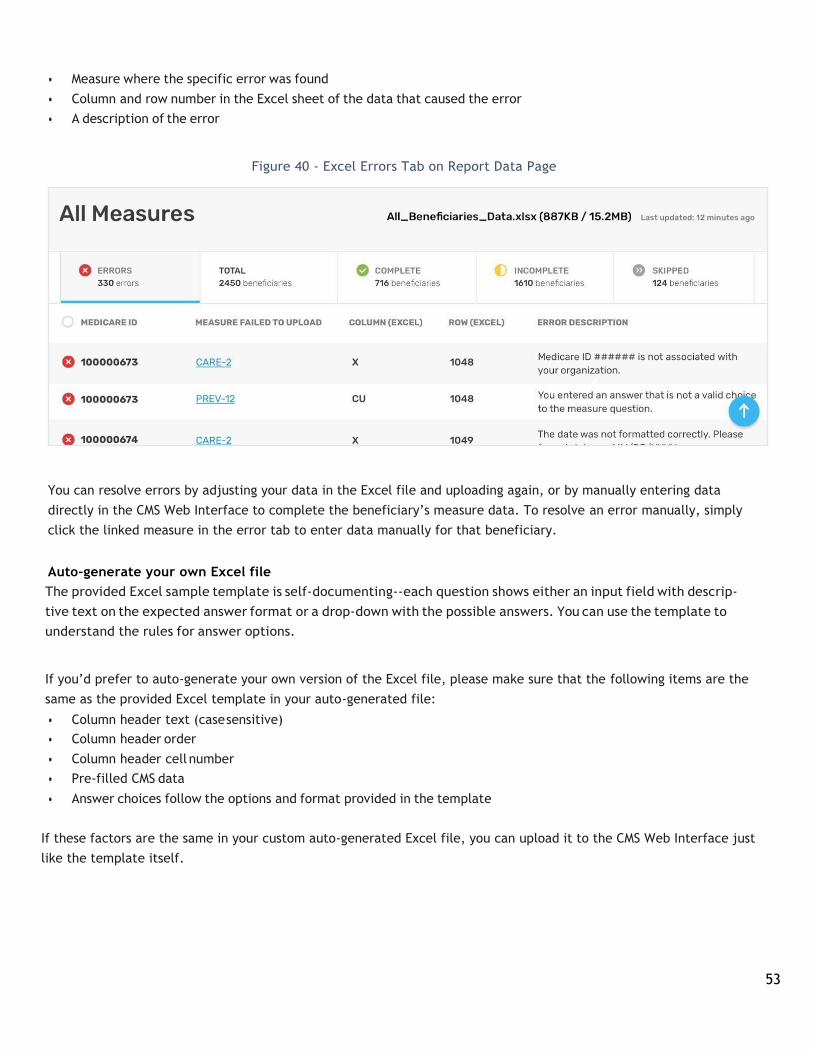
53
• Measure where the specific error was found
• Column and row number in the Excel sheet of the data that caused the error
• A description of the error
Figure 40 - Excel Errors Tab on Report Data Page
You can resolve errors by adjusting your data in the Excel file and uploading again, or by manually entering data
directly in the CMS Web Interface to complete the beneficiary’s measure data. To resolve an error manually, simply
click the linked measure in the error tab to enter data manually for that beneficiary.
Auto-generate your own Excel file
The provided Excel sample template is self-documenting--each question shows either an input field with descrip-
tive text on the expected answer format or a drop-down with the possible answers. You can use the template to
understand the rules for answer options.
If you’d prefer to auto-generate your own version of the Excel file, please make sure that the following items are the
same as the provided Excel template in your auto-generated file:
• Column header text (case sensitive)
• Column header order
• Column header cell number
• Pre-filled CMS data
• Answer choices follow the options and format provided in the template
If these factors are the same in your custom auto-generated Excel file, you can upload it to the CMS Web Interface just
like the template itself.
54
Report Data via Manual Data Entry
If you would like to manually enter data, you can choose between two paths:
1. Enter data one beneficiary at a time. You will be prompted to enter data for all measures in which that
beneficiary is ranked first before moving to the next beneficiary. See “Enter data by beneficiary” below. NOTE:
you do NOT need to complete the oversample to have a successful submission. You only need to report on the
beneficiaries ranked in the minimum for each measure. A complete submission is considered one for which the
minimum requirement for each measure is met.
2. Enter data one measure at a time. You will be prompted to enter data only for that measure for one ranked
beneficiary at a time, from lowest to highest rank until you are satisfied with your measure performance rate results.
See “Enter data by measure” below.
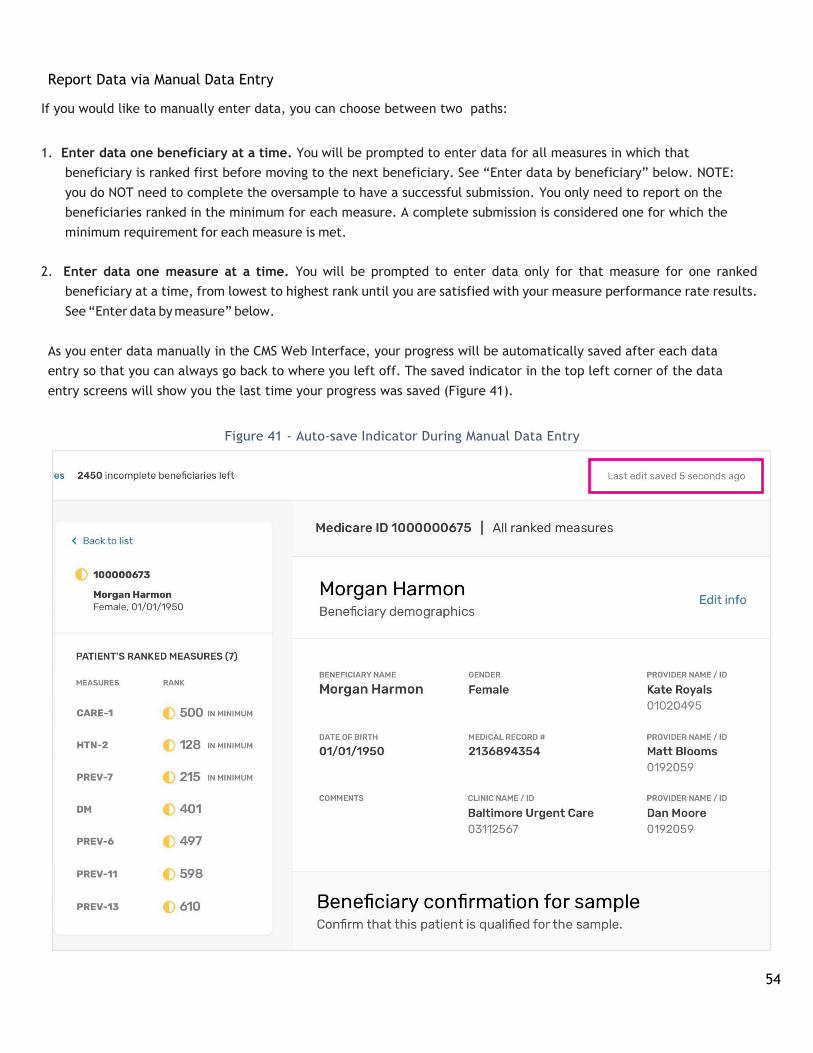
As you enter data manually in the CMS Web Interface, your progress will be automatically saved after each data
entry so that you can always go back to where you left off. The saved indicator in the top left corner of the data
entry screens will show you the last time your progress was saved (Figure 41).
Figure 41 - Auto-save Indicator During Manual Data Entry

55
Click on “Continue” on the top left card in your View Progress page at any time to go back to the last question you
answered to pick up where you left off (Figure 42).
Figure 42 - Continue Where You Left Off
Manually Enter Data by Beneficiary
If you choose to report data one beneficiary at a time, you can do so by following these steps:
1. Navigate to the Report Data page.
2. Scroll down to the beneficiary sample list.
3. Make sure the list is filtered on “All Measures”.
4. Select “Enter Data” link next to the name of the beneficiary you would like to enter data for.
Once you’re in the manual data entry, you’ll first notice a small panel on the left that summarizes the beneficiary’s
basic demographic information—as well as the measures in which that beneficiary is ranked. If a beneficiary is ranked
in the minimum for any of their measures, those measures will have an “In Minimum” label next to the beneficiary’s

56
rank (Figure 43).
Figure 43 - View for Which Measures a Beneficiary is Ranked in the Minimum
NOTE: The “In minimum” label is fluid and will change in real-time in the interface if a beneficiary in the minimum is
skipped. If a beneficiary becomes required for the minimum reporting requirement, their rank will be marked with “In
minimum” immediately after the lower-ranked beneficiary is skipped.
Make sure to enter data for each measure in which the beneficiary is marked in the minimum, to complete the mini-
mum reporting requirement for each measure.
NOTE: The beneficiary will only show as “complete” when you have reported on all measures in which that
beneficiary is ranked. However, you do NOT need to answer all measure questions to have a successful submission.
You only need to answer the questions for measures in which the beneficiary is ranked in the minimum to receive a
score. It is ok if the beneficiary is still shown as “incomplete” if you have completed data entry for the measures with
the label “in minimum” for that beneficiary without reporting on measures in which the beneficiary is in the
oversample.
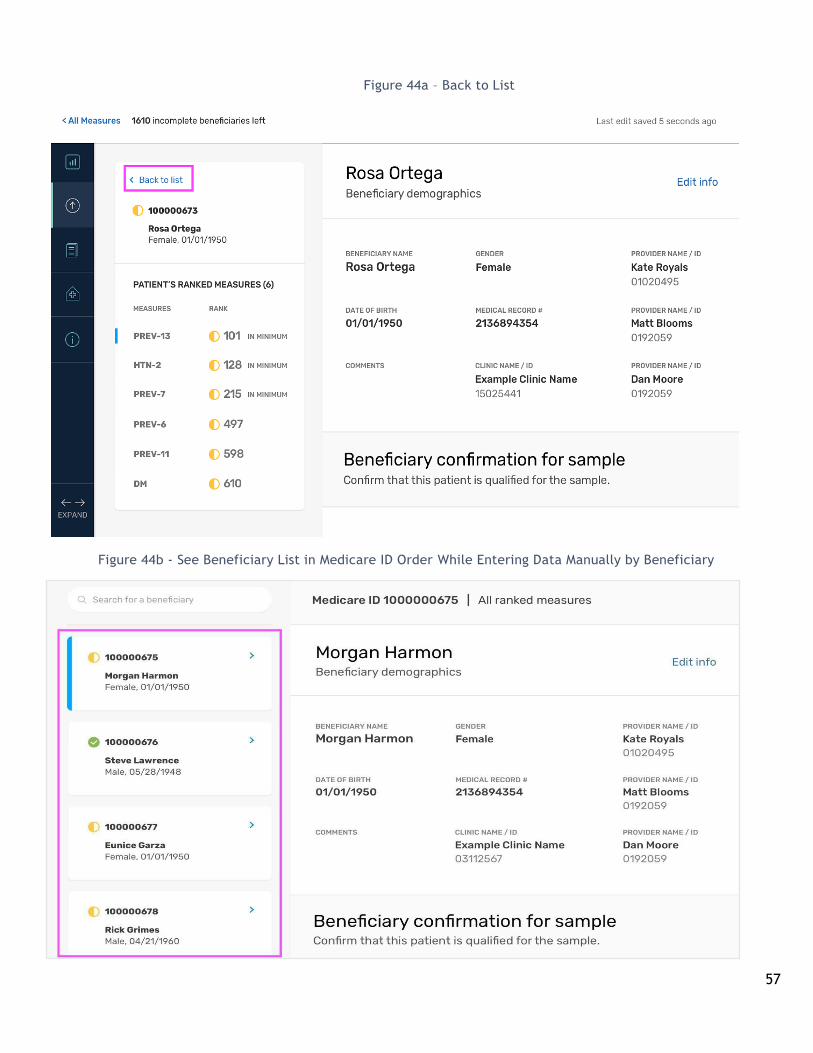
If you click on “Back to List”, the panel will close and reveal the full list of all beneficiaries in your sample (Figure 44a). If you want to jump among different beneficiaries to fill in their data, you can use this feature (Figure 44b).
57
Figure 44a – Back to List
Figure 44b - See Beneficiary List in Medicare ID Order While Entering Data Manually by Beneficiary

58
Alternatively, to jump to a specific beneficiary, you can use the search box in the top left corner to search by a
beneficiary first name, last name, or Medicare ID (Figure 45).
Figure 45 - Search for a Specific Beneficiary while Entering Data Manually by Beneficiary
As you enter data, you’ll notice that some answers affect subsequent questions in reporting.
By default, answerable questions will be active (Figure 46). However, some fields begin inactive. Some questions are
dependent on each other, so if you answer the first question in a certain way, the following question may become
required—and active. In some cases, those questions will not be required and will remain inactive.
Figure 46 - Active and Inactive Question Fields When Entering Data Manually

59
In this example, answering “No-Other CMS Approved Reason” to the question “Does the patient have a diagnosis
of atherosclerotic cardiovascular disease—active or history of—at any time up through December 31,2017?”, the
QPP Service Center Ticket Number field will become active.
Lastly, you will get real-time feedback if you have answered a question incorrectly. You will see the input box out-
lined in red with text explaining how to fix your answer (Figure 47).
Figure 47 - Real-time Feedback on Data Input
Manually Enter Data by Measure
To report data one measure at a time, follow these steps:
1. Navigate to the View Progress page.
2. Scroll down to the measure progress cards.
3. Select “Enter Data” next to the measure you’d like to enter data for.
Alternatively, you can:
1. Navigate to the Report Data page.
2. Scroll down to the beneficiary sample list.
3. Filter the list by the measure you’d like to enter data for.
4. Select “Enter Data” next to the rank for which you’d like to enter data.
When you filter the beneficiary sample by a single measure, a helpful graphic appears at the top of the list that indi-
cates the gaps in reporting you need to fill to meet the consecutive minimum reporting requirement. You can use the

60
hyperlinks in the message above the graphic to jump directly to the gaps to fulfill the minimum reporting
requirement (Figure 48).
Figure 48 - Jump to Incomplete Ranks within a Measure
Once you begin entering data in the CMS Web Interface, you’ll first notice on the left-hand side a small panel that
summarizes the beneficiary’s rank in the selected measure and basic demographic information. If the rank is within
the bounds of the minimum reporting requirement, it will have an “In Minimum” label (Figure 49).
Figure 49 - View Whether the Ranked Beneficiary is in the Minimum Reporting Requirement
NOTE: The “In minimum” label is fluid and will change in real-time in the interface if a beneficiary in the minimum is
skipped. If a beneficiary becomes required for the minimum reporting requirement, their rank will be marked with “In
minimum” immediately after the lower-ranked beneficiary is skipped.

61
If you click on “Back to List”, the panel will close and reveal the ranked list of beneficiaries in the selected measure so
you can move quickly between ranks (Figure 50).
Figure 50 – See Beneficiary List in Rank Order While Entering Data Manually by Measure
62
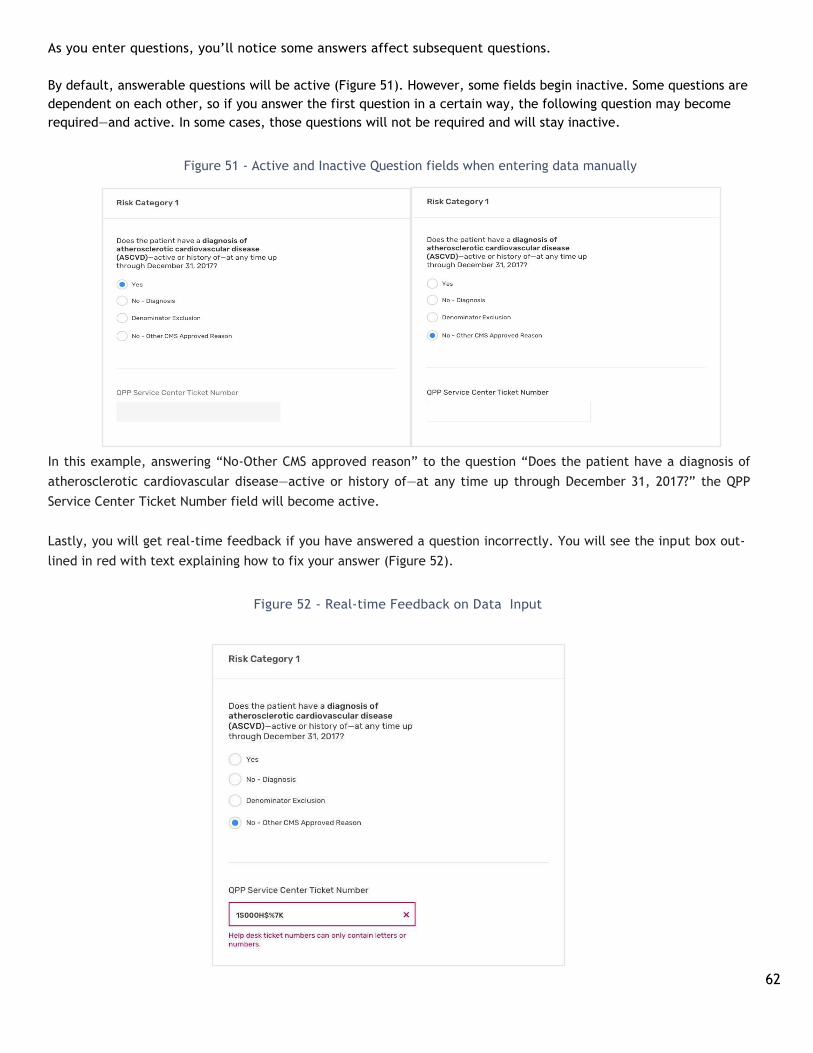
As you enter questions, you’ll notice some answers affect subsequent questions.
By default, answerable questions will be active (Figure 51). However, some fields begin inactive. Some questions are
dependent on each other, so if you answer the first question in a certain way, the following question may become
required—and active. In some cases, those questions will not be required and will stay inactive.
Figure 51 - Active and Inactive Question fields when entering data manually
In this example, answering “No-Other CMS approved reason” to the question “Does the patient have a diagnosis of
atherosclerotic cardiovascular disease—active or history of—at any time up through December 31, 2017?” the QPP
Service Center Ticket Number field will become active.
Lastly, you will get real-time feedback if you have answered a question incorrectly. You will see the input box out-
lined in red with text explaining how to fix your answer (Figure 52).
Figure 52 - Real-time Feedback on Data Input

63
View Reports As before, the CMS Web Interface contains reports for you to track your measure progress, your team’s activity, and
a receipt of your final submission. In the navigation, you’ll see a menu option called “View Reports” (Figure 53).
Figure 53 - Navigate to View Reports
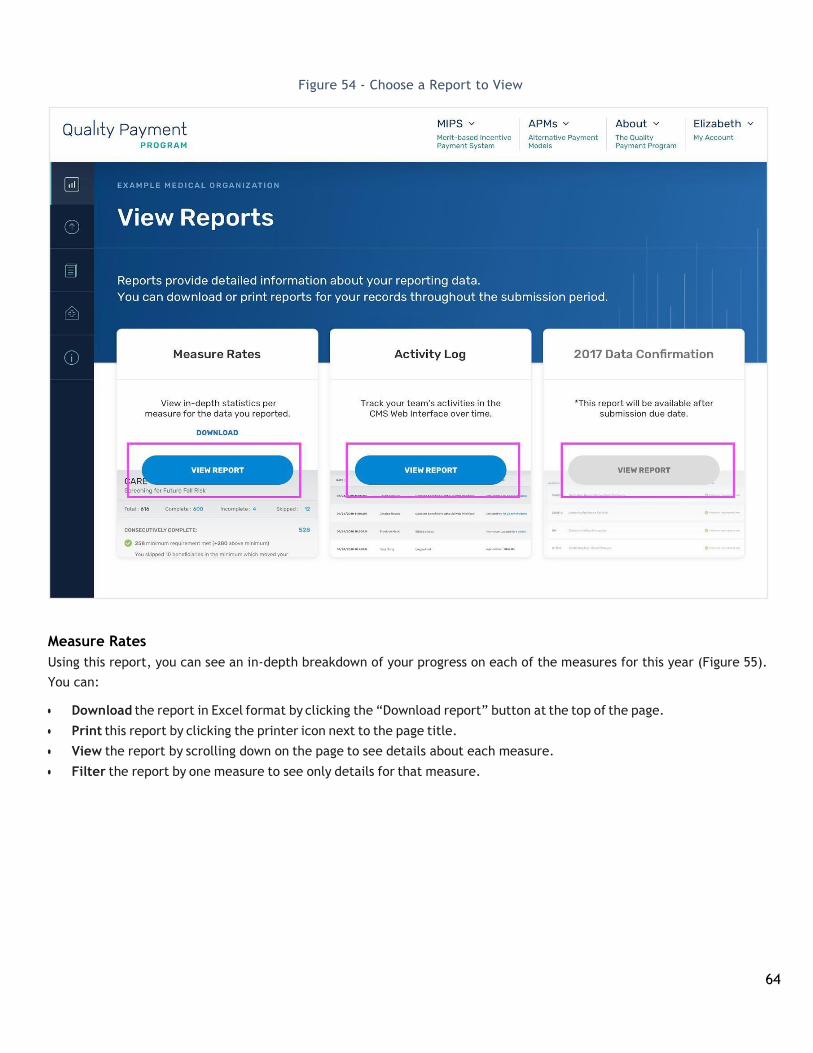
View Reports houses three different reports: “Measure Rates,” “Activity Log,” and “2017 Data Confirmation.” The “2017
Data Confirmation” will only be available after the submission period closes. You can view each report by clicking “View
Report” (Figure 54).
64
Figure 54 - Choose a Report to View
Measure Rates
Using this report, you can see an in-depth breakdown of your progress on each of the measures for this year (Figure 55).
You can:
• Download the report in Excel format by clicking the “Download report” button at the top of the page.
• Print this report by clicking the printer icon next to the page title.
• View the report by scrolling down on the page to see details about each measure.
• Filter the report by one measure to see only details for that measure.

65
Figure 55 - Measure Rates Report
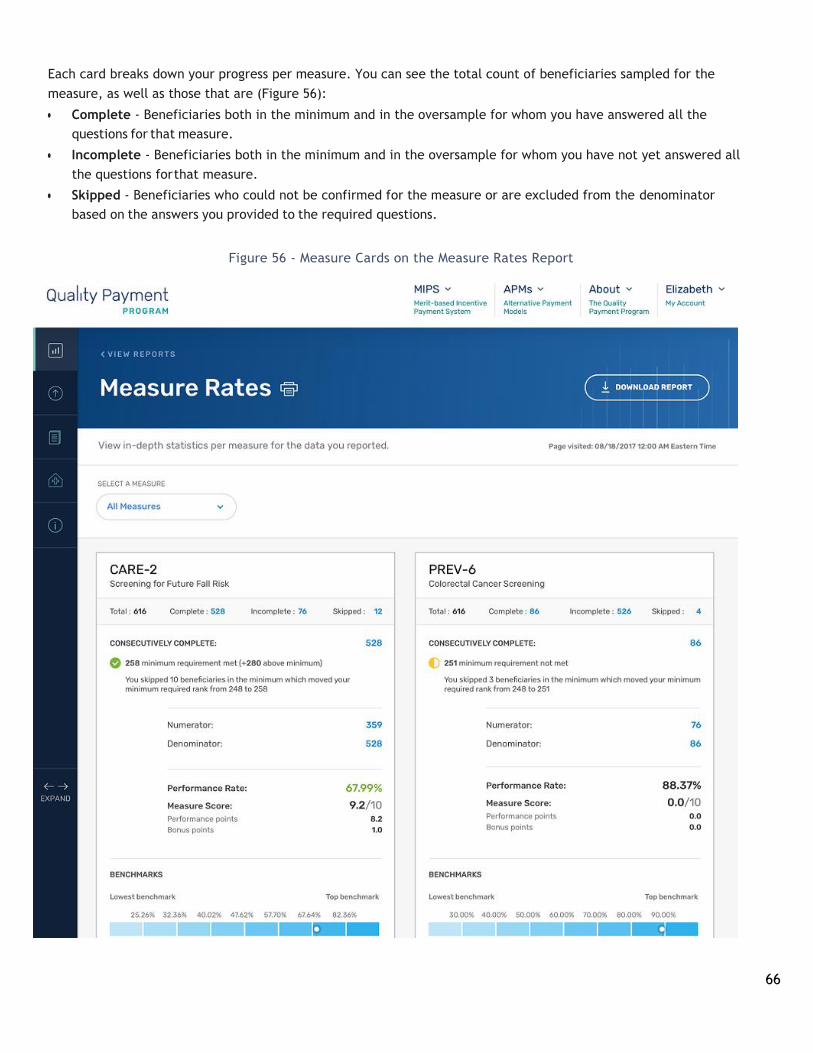
66
Each card breaks down your progress per measure. You can see the total count of beneficiaries sampled for the
measure, as well as those that are (Figure 56):
• Complete - Beneficiaries both in the minimum and in the oversample for whom you have answered all the
questions for that measure.
• Incomplete - Beneficiaries both in the minimum and in the oversample for whom you have not yet answered all
the questions for that measure.
• Skipped - Beneficiaries who could not be confirmed for the measure or are excluded from the denominator
based on the answers you provided to the required questions.
Figure 56 - Measure Cards on the Measure Rates Report

67
The card further breaks down beneficiary numbers down by:
• Consecutively complete - Beneficiaries that have had their data completed in a consecutively ranked order
within the measure. Each measure requires a minimum of 248 consecutively completed beneficiaries or 100% of
the beneficiaries if there are less than 248 beneficiaries in the sample provided.
• Denominator - Beneficiaries that have been confirmed and met denominator criteria for a specific measure will be
included in the denominator. If beneficiaries are excluded during reporting, the denominator will be adjusted to
reflect the exclusions. The denominator will later be used to calculate your performance rate for that measure.
• Numerator - Once a beneficiary is confirmed for that measure (in the denominator), there are certain answers
to measure questions that will make that beneficiary eligible for the numerator. The numerator and denominator
will be used to calculate your performance rate for that measure.
• Denominator exception (if one exists for the measure) - If a patient cannot be confirmed for that measure as a
result of a measure exception, the beneficiary will be removed from the performance calculations for that
measure. However, the minimum reporting requirement will not be adjusted as a result of exceptions.
Lastly the card shows your performance on the measure by showing you:
• Measure performance rate - The numerator divided by the denominator.
• MIPS Measure score - A combination of your decile points, your partial points, and your bonus points. (NOTE: MIPS
scores will only appear for group users who are participating in the MIPS program. ACOs will not see MIPS measure
scores this year).
• Benchmarks for the score and how your performance compares against the benchmarks - NOTE: only measures
for which data was collected last year will include benchmarks. Some measures will not have associated bench-
marks.
• You will notice that some of the numbered data in the cards are links. You can click on those numbers to explore
the details of which beneficiaries fall into these numbers.
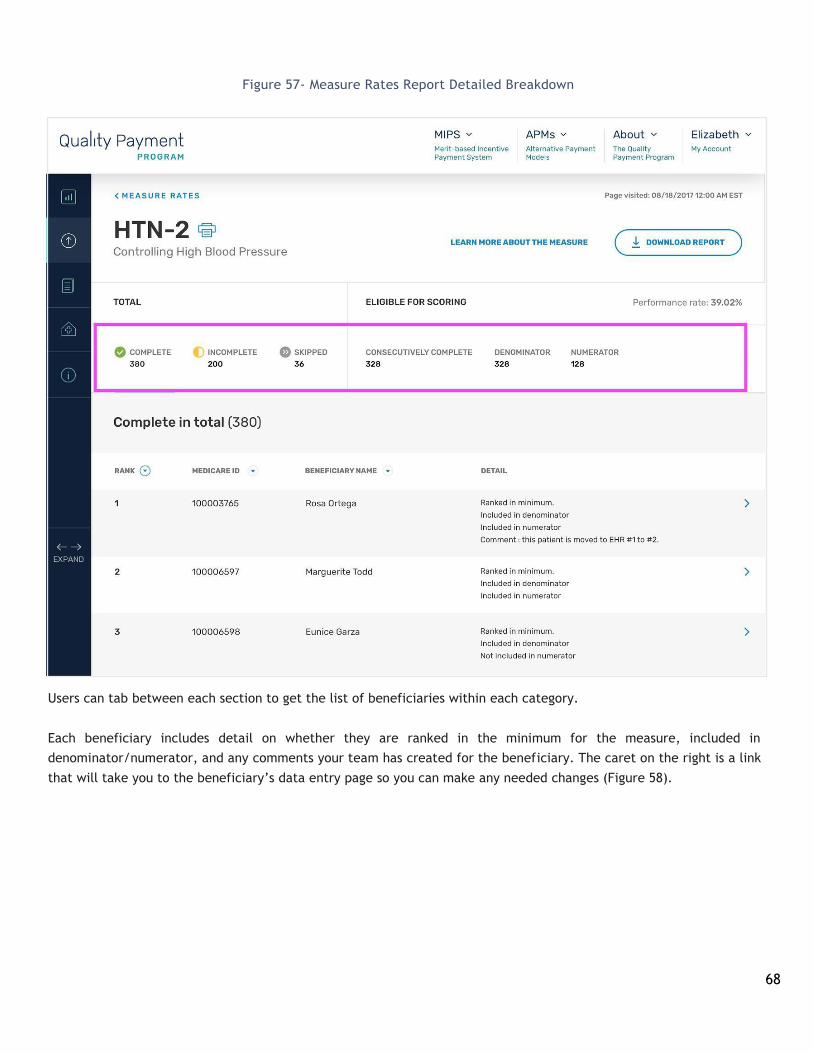
Once you click on these numbers, you will see the Measure Rates Detail Report. Inside there are tabs for each of the
numbers you saw on the Measure Rates cards—with details about each beneficiary underneath (Figure 57).
68
Figure 57- Measure Rates Report Detailed Breakdown
Users can tab between each section to get the list of beneficiaries within each category.
Each beneficiary includes detail on whether they are ranked in the minimum for the measure, included in
denominator/numerator, and any comments your team has created for the beneficiary. The caret on the right is a link
that will take you to the beneficiary’s data entry page so you can make any needed changes (Figure 58).

69
Figure 58 - Measure Rates Report Detailed Breakdown Row Close-Up
Activity Log
The activity log report records the different type of activities your team has performed in the CMS Web Interface. By
default, the activities are sorted by the latest activity.
You can filter the activity list by a specific activity type or user. To do so, select the filter dropdown to choose the
filter type. Then start typing in the adjoining field to specify the filter query (Figure 59).
Figure 59 - Filter Activity Log

70
You can also filter the Activity Log by selecting a specific timeframe (Figure 60).
Figure 60 - Filter Activity Log by Time Frame
Each row represents an activity, and by clicking on the links under the “Description” column, you’ll be able to see the
detailed breakdown of what was changed during the activity (Figure 61).
Figure 61 - Access Detailed View of Each Activity in the Activity Log

71
Clicking on a link in the Description column takes you to a detail view that shows the changes made during the
activity. In instances where you are looking at updated beneficiary data changes, you can see the exact changes
that have been made per beneficiary. “++” represents additions that have been made, and “--” represents what was
removed or changed.
Click on the caret at the right of the row to manually enter data for that beneficiary (Figure 62).
Figure 62 - Jump to Area of Logged activity to Make Changes

72
Data Confirmation
Once the submission period has closed, you can access your “Data Confirmation” report. This serves as the receipt
for your final submission—giving you a high-level overview for each measure where you have met the minimum
(Figure 63).
Figure 63 - Data Confirmation Report

73
Manage Group
Manage Clinics To manage the list of your clinics (Figure 64):
1. Select “Manage Group” in the navigation
2. Select “Manage Clinics” in the sub-navigation
Figure 64 - Navigate to Manage Group

74
Each row represents a clinic. You can edit a clinic by clicking on the “edit” button on the right (Figure 65).
Figure 65 - Edit or Delete a Clinic
To delete a clinic, click the “Delete” link on the right of the row. However, to delete a clinic, you must first disassociate
it from every beneficiary it may be connected to in the CMS Web Interface.
To do so:
1. Select “Report Data” in the navigation.
2. Download your beneficiary sample in Excel format.
3. Use Excel filter controls to filter the sample by the clinic you’d like to delete to find all beneficiaries associated
with it.
4. Enter “N/A” to replace the Clinic ID you’d like to disassociate from the beneficiary. 5. Repeat steps 3-7 for all beneficiaries associated with the clinic.
6. Upload the updated Excel file.
7. Go back and click “Delete” next in the clinic row.

75
To create a new clinic, click the “Add New” button at the top of the page (Figure 66 & 67).
Figure 66 - Add a New Clinic

76
Figure 67 - Add a New Clinic Screen Details
77
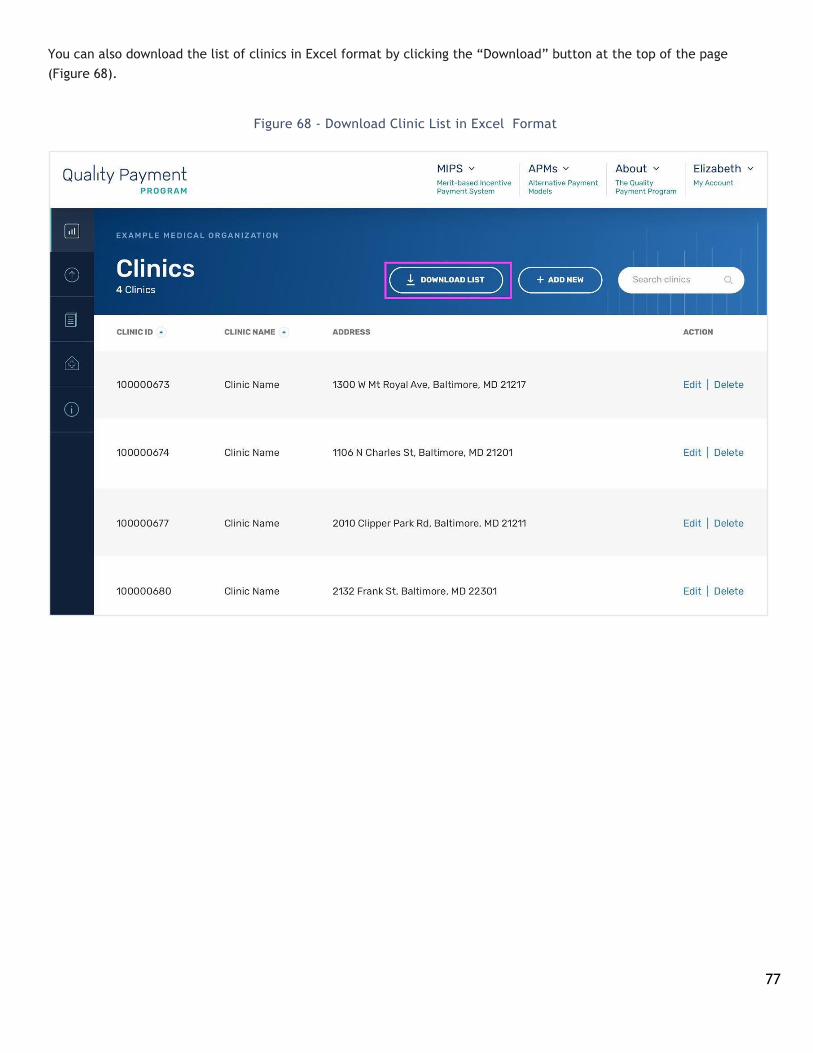
You can also download the list of clinics in Excel format by clicking the “Download” button at the top of the page
(Figure 68).
Figure 68 - Download Clinic List in Excel Format
78
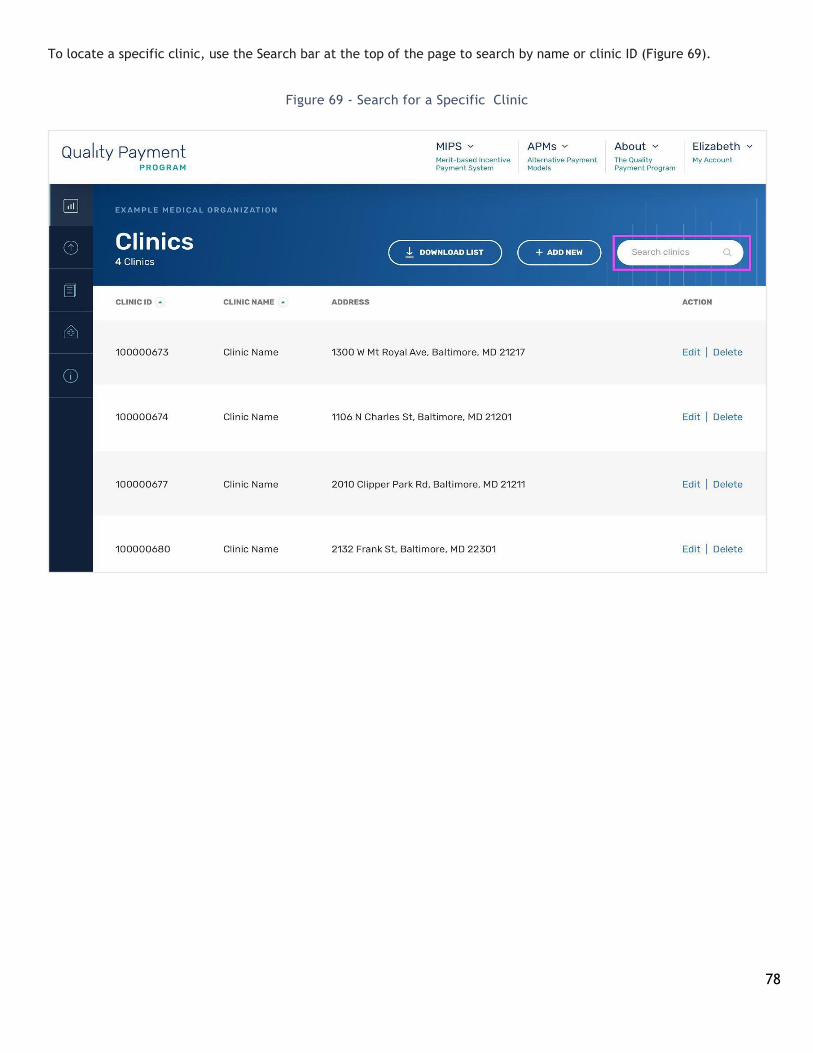
To locate a specific clinic, use the Search bar at the top of the page to search by name or clinic ID (Figure 69).
Figure 69 - Search for a Specific Clinic

79
For your convenience, you can sort the clinic list by either Clinic ID or Clinic Name by clicking the carets at the top of
each column (Figure 70).
Figure 70 - Sort Clinic List

80
Manage Providers
To manage the list of your providers:
1. Select “Manage Group” in the navigation
2. Select “Manage Providers” in the sub-navigation (Figure 71)
Figure 71 - Navigate to Manage Providers
Each row represents a provider. You can edit a provider by clicking on the “edit” button on the right (Figure 72).

81
Figure 72 - Manage Providers Screen
To delete a provider, you can click the “Delete” link on the right of the row. However, to delete a provider, you must
first disassociate it from every beneficiary it may be connected to in the CMS Web Interface. To do so, you can:
1. Select “Report Data” in the navigation.
2. Download your beneficiary sample in Excel format.
3. Use Excel filter controls to filter the sample by the provider you’d like to delete to find all beneficiaries
associated with it. Make sure to check all three provider columns.
4. Enter “N/A” instead of the Provider Name you’d like to disassociate from the beneficiary.
5. Repeat steps 3-7 for all beneficiaries associated with the provider.
6. Upload the updated Excel file.
7. Go back and click “Delete” next in the provider row.

82
To create a new provider, click the “Add New” button at the top of the page (Figure 73).
Figure 73 - Add a New Provider

83
You can also download the list of providers in Excel format by clicking the “Download” button at the top of the
page (Figure 74).
Figure 74 - Download Providers List in Excel Format

84
To locate a specific provider, use the Search bar at the top of the page to search by name (Figure 75).
Figure 75 - Search for a Specific Provider

85
For your convenience, you can sort the provider list by provider number, last name, first name, and EIN by clicking
the caret at the top of the column (Figure 76).
Figure 76 - Sort the Provider List

86
Getting Help and Support
Frequently Asked Questions
For questions while reporting through the CMS Web Interface, visit the Frequently Asked Questions in the left-hand
navigation bar. We’ll update these questions throughout the submission period as we hear from users (Figure 77).
Figure 77 - Navigate to the Frequently Asked Questions
You can also access the FAQs through the QPP website at any time by typing the following URL into your browser
(you’ll be prompted to sign in first if you aren’t currently).
Contact the Quality Payment Program
If you don’t find what you are looking for in the Frequently Asked Questions, please contact the Quality Payment
Program at 1-866-288-8292 (TTY 1-877-715- 6222), available Monday through Friday, 8:00 AM-8:00 PM EST or by e-
mail at [email protected]

87
Useful Resources
Here are a few other helpful resources that may assist you in answering some questions as you go through CMS Web
Interface reporting this year
Excel Template User Guide
These instructions detail how to download, complete, and upload this year’s beneficiary sample Excel template.
Excel Demonstration Video
This video demonstrates how to use the beneficiary sample Excel template, and shows you how to successfully up-
load data to the CMS Web Interface (Figure 78).
Figure 78 - CMS Web Interface Excel demonstration video
CMS Web Interface Demonstration Video Series
We have also created a series of videos that accompany this guide to demonstrate how to use the CMS Web Inter-
face for a successful submission. Check the CMS YouTube account for videos as they are released.

88