cme stock index futures spread trading
TRANSCRIPT
Stock Index Futures Spread Trading S&P 500 vs.
DJIA S&P MidCap 400 vs. S&P SmallCap 600 Second Quarter 2008 2
Stock Index Futures Spread Trading
www.cmegroup.com 2
Contents Introduction S&P 500 vs. DJIA Introduction Index Methodology, Calculations and Weightings Spread Calculations, Sensitivities, Risks and Margins, Spread Distributions Index Correlations Historical Volatilities S&P MidCap 400 vs. S&P SmallCap 600 Introduction and Index Methodology Spread Calculations, Risks and Margins Sector Distribution, Weightings and Performance Index Correlations Historical Volatilities Appendix Contract Specifications Average Daily Volumes Liquidity and Hourly Analysis Index Calculations Stock Index Futures Fair Values Equity Price Limit Guide
Stock Index Futures Spread Trading
www.cmegroup.com 3
Stock Index Futures Spread Trading Introduction About CME Group and Stock Index Futures CME Group, formed by the 2007 merger of the Chicago Mercantile Exchange (CME) and the Chicago Board of Trade (CBOT), is the world's largest and most diverse derivatives exchange. It is also the world’s premier marketplace for trading stock index futures. The first successful stock index futures contract, the S&P 500 contract, began trading at CME in 1982. Since then, our product line has grown to include a comprehensive range of benchmark indexes on U.S. and international stocks. In 2007, CME Group’s equity index product line had an average daily volume (ADV) of over 2.4 million contracts, with an average notional value in excess of $200 billion traded every day. The notional value of open interest in CME Group’s equity index product line was in excess of $400 billion on December 31, 2007. CME Group offers trading on stock index futures virtually 24 hours per day, with the E-mini products available electronically only. The markets are liquid around the clock, even during non-U.S. hours, and especially in the European morning hours leading in to the U.S. daytime open for the stock market. About This Guide This spread trading guide introduces and studies the spread between two sets of indexes: The S&P 500 and the DJIA, and S&P MidCap 400 and S&P SmallCap 600. If you are interested in trading the spread between either or both of these pairs we hope this guide will help you get started.
Spreading the S&P 500 Versus the DJIA The Standard & Poor’s 500 (S&P 500) Index and the Dow Jones Industrial Average (DJIA) are the two most widely known stock indexes. The S&P 500 is the leading large-cap benchmark for the U.S. stock market and is the main barometer for institutional and professional investors. The DJIA is a popular measure of the U.S. stock market, especially among the media and general population. In addition: • The S&P 500 index contains 500 stocks, while the DJIA has 30 stocks. All 30 of the stocks in the
DJIA are also in the S&P 500. • The S&P 500 is a capitalization-weighted, float-adjusted index. The DJIA is a price-weighted index. • ADV for the CME Group E-mini S&P 500 index futures was 1,641,692 contracts in 2007. For Q1 2008,
ADV increased to 2,487,430 contracts. • ADV for the CME Group E-mini Dow index futures was 158,494 contracts in 2007. For Q1 2008, ADV
increased to 209, 689 contracts. The S&P 500 and DJIA is one of the most popular spreads because the two indexes are closely related – but not 100 percent correlated. Given that the DJIA has only 30 stocks, it is also feasible to monitor the main stocks that may have an impact on the spread relationship.
Stock Index Futures Spread Trading
www.cmegroup.com 4
Terminology and Rational for Spreads The S&P 500 and DJIA are not only calculated using different methodologies; they are also at very different price levels. For example, on April 18, 2008, the E-mini S&P 500 futures settled at 1388.00 while the E-mini Dow futures settled at 12810. They also have different futures “multipliers”, resulting in different dollar notional values. While there is no single “official” or “correct” way to price a spread, we will use a convention based on the ratio of dollar notional value for both pricing a spread and also helping to determine the optimal ratio of contracts to buy and sell (depending on a trader’s risk profile). Using the closing values of April 18, 2008, the E-mini S&P 500 futures had a notional value of $69,400 (1388.00 x $50) and the E-mini Dow futures had a notional value of $64,050 (12810 x $5). Pricing the Spread as a Ratio1 With many traditional spreads, the “spread price” or “spread value” would simply be equal to A minus B. For example, consider a spread involving two stocks, such as ExxonMobil (XOM) vs. Chevron (CVX). On April 18, 2008, XOM closed at 94.00 and CVX closed at 93.18 – so the “spread price” was simply $0.82. Another example would be the spread between Chicago Wheat futures vs. Kansas City Wheat futures. On April 18, 2008, their closing prices were $8.85 and $9.33 respectively, so KC was trading at a premium of $0.48 to Chicago. Trying to use this convention for the E-mini S&P 500 futures vs. E-mini Dow futures spread would be impractical and risky. A trader could also try taking the difference between the notional values but this would result in a “spread price” that would vary significantly and could be awkward to view. For example, using the notional values for April 18, 2008, the spread price would be $5,350. During the period from April 2002 through April 2008, the range of the spread price was $1,002 to $9,848. However, using a ratio (E-mini S&P 500 notional value / E-mini Dow notional value) of the respective notional dollar values of the futures contracts results in a more stable looking “spread price” for traders to analyze and view. For example, using the notional values for April 18, 2008, the spread price would be 1.0835. During the period from April 2002 through April 2008, the range of the spread price was 1.0245 to 1.1826. Trading the Spread as a Ratio Additionally, traders must also decide on the “quantity ratio” when actually trading the spread. How many contracts of the respective index futures do you buy and sell? For traders who prefer to trade the smallest quantities, trading the spread on a 1:1 basis is the obvious choice. However, for traders who are trading larger quantities, and for those who are “position traders” (holding spreads for at least one day or potentially much longer), trading a ratio of quantities is the preferred method. CME Clearing offers reduced margins via Spread Credits for traders who use a ratio of 5:6 (five contracts of E-mini S&P 500 futures vs. six contracts of E-mini Dow futures). Trading a ratio of quantities is important for traders who are holding positions long enough to witness significant market moves. For example, if both the S&P 500 and DJIA increased by 10 percent, a trader using a 1:1 quantity ratio would see the notional value of the spread move by about $500, even though the underlying markets moved by the exact same percentage amount. We will discuss these topics further throughout this guide.
1 Obviously there are as many ways to look at spreads as there are traders. Some traders may prefer a convention using the ratio, while others prefer the simple difference in notional values. 1
Stock Index Futures Spread Trading
www.cmegroup.com 5
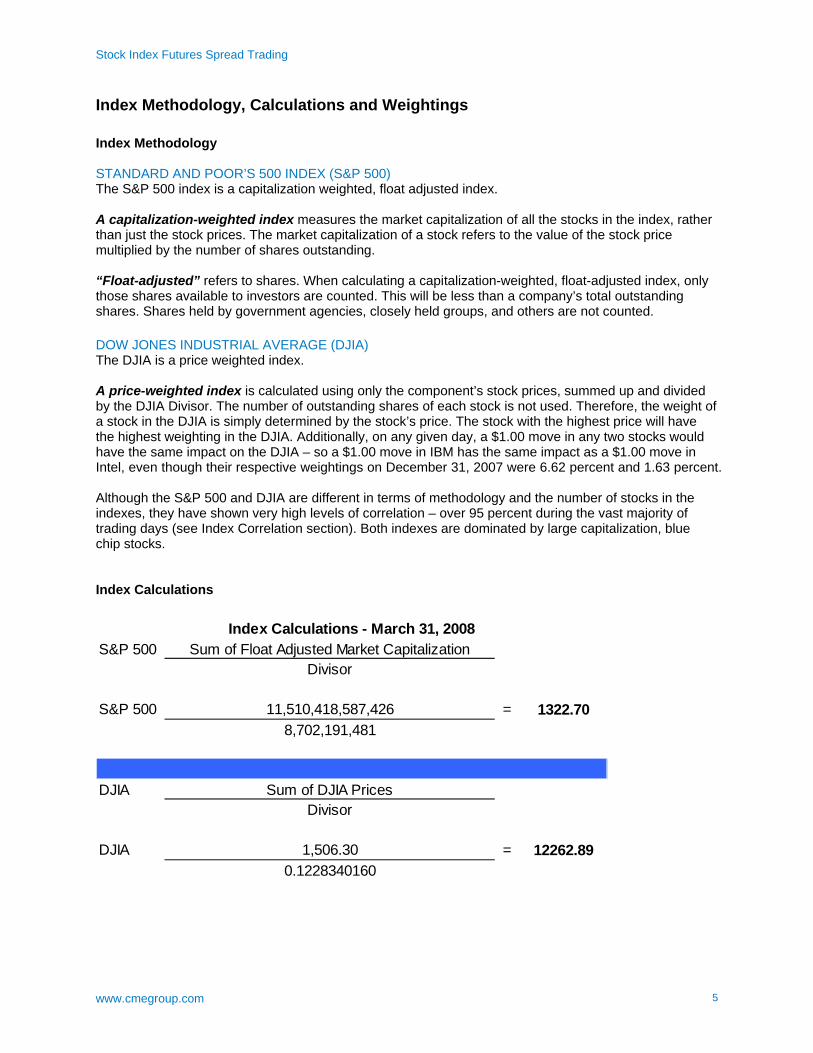
Index Methodology, Calculations and Weightings Index Methodology STANDARD AND POOR’S 500 INDEX (S&P 500) The S&P 500 index is a capitalization weighted, float adjusted index. A capitalization-weighted index measures the market capitalization of all the stocks in the index, rather than just the stock prices. The market capitalization of a stock refers to the value of the stock price multiplied by the number of shares outstanding. “Float-adjusted” refers to shares. When calculating a capitalization-weighted, float-adjusted index, only those shares available to investors are counted. This will be less than a company’s total outstanding shares. Shares held by government agencies, closely held groups, and others are not counted. DOW JONES INDUSTRIAL AVERAGE (DJIA) The DJIA is a price weighted index. A price-weighted index is calculated using only the component’s stock prices, summed up and divided by the DJIA Divisor. The number of outstanding shares of each stock is not used. Therefore, the weight of a stock in the DJIA is simply determined by the stock’s price. The stock with the highest price will have the highest weighting in the DJIA. Additionally, on any given day, a $1.00 move in any two stocks would have the same impact on the DJIA – so a $1.00 move in IBM has the same impact as a $1.00 move in Intel, even though their respective weightings on December 31, 2007 were 6.62 percent and 1.63 percent. Although the S&P 500 and DJIA are different in terms of methodology and the number of stocks in the indexes, they have shown very high levels of correlation – over 95 percent during the vast majority of trading days (see Index Correlation section). Both indexes are dominated by large capitalization, blue chip stocks. Index Calculations
S&P 500 Sum of Float Adjusted Market CapitalizationDivisor
S&P 500 11,510,418,587,426 = 1322.708,702,191,481
DJIA Sum of DJIA PricesDivisor
DJIA 1,506.30 = 12262.890.1228340160
Index Calculations - March 31, 2008
Stock Index Futures Spread Trading
www.cmegroup.com 6
Changes in Index Composition – Dow Jones Industrial Average Given that the DJIA is a price weighted index and has only 30 stocks, any changes in its composition could have a potentially significant impact on a spread relationship – ie. it will likely impact the S&P 500 vs. DJIA spread. Note: The addition/deletion of stocks is accompanied by a change in the DJIA Divisor, so any such changes will not impact that days DJIA price level. However, these changes will impact how the DJIA behaves going forward, which includes intraday spread relationships. Changes do not occur frequently – from January 2000 through March 2008, a total of 5 stocks have been added to the DJIA, and 5 others have been deleted. Changes to the DJIA on April 8, 2004 Added: American International Group Inc. (AIG), Pfizer Incorporated (PFE) and Verizon Communications Inc (VZ) Deleted: AT+T Corporation (T), Eastman Kodak Co. (EK) and International Paper Co (IP) Name Change on November 21, 2005: SBC and AT+T merge, changing SBC’s name to AT+T Inc (T) which again appears in the DJIA. Changes to the DJIA on February 19, 2008 Added: Bank of America Corp (BAC) and Chevron Corp (CVX) Deleted: Altria Group Inc (MO) and Honeywell International Inc (HON) This most recent change did have a significant impact on the energy sector weighting in the DJIA, nearly doubling its weighting to above 11 percent, as CVX was added and joined ExxonMobil (XOM). Adding BAC to the DJIA did not have a huge impact on the financial sector, as there were already 4 other financial stocks in the DJIA, and BAC itself had a weighting of less than 3.00 percent of the DJIA. Spread Calculations, Sensitivities, Risks and Margins Calculating the Spread Ratio Note: Examples in this guide use only the E-mini S&P 500 and DJIA contracts. Buying the spread means buying the E-mini S&P 500 index and selling the E-mini Dow index, and selling the spread means selling the E-mini S&P 500 index and buying the E-mini Dow index. For example, if a trader expects the S&P 500 to outperform the DJIA (either up or down regardless of time frame), the trader would want to “buy the spread” – buy the E-mini S&P 500 index and sell the E-mini Dow index. If the spread ratio was at 1.1020, the trader who bought the spread would be looking to sell it for a ratio above 1.1020. When trading the spread between the E-mini S&P 500 index and the E-mini Dow index futures, the different index levels and their respective multipliers need to be taken into account. Ideally, a spread ratio which closely balances the notional values of the contracts should be used, so that the net effect of market movements is captured more precisely. This can be called a “dollar neutral” spread when it is initiated.
Stock Index Futures Spread Trading
www.cmegroup.com 7
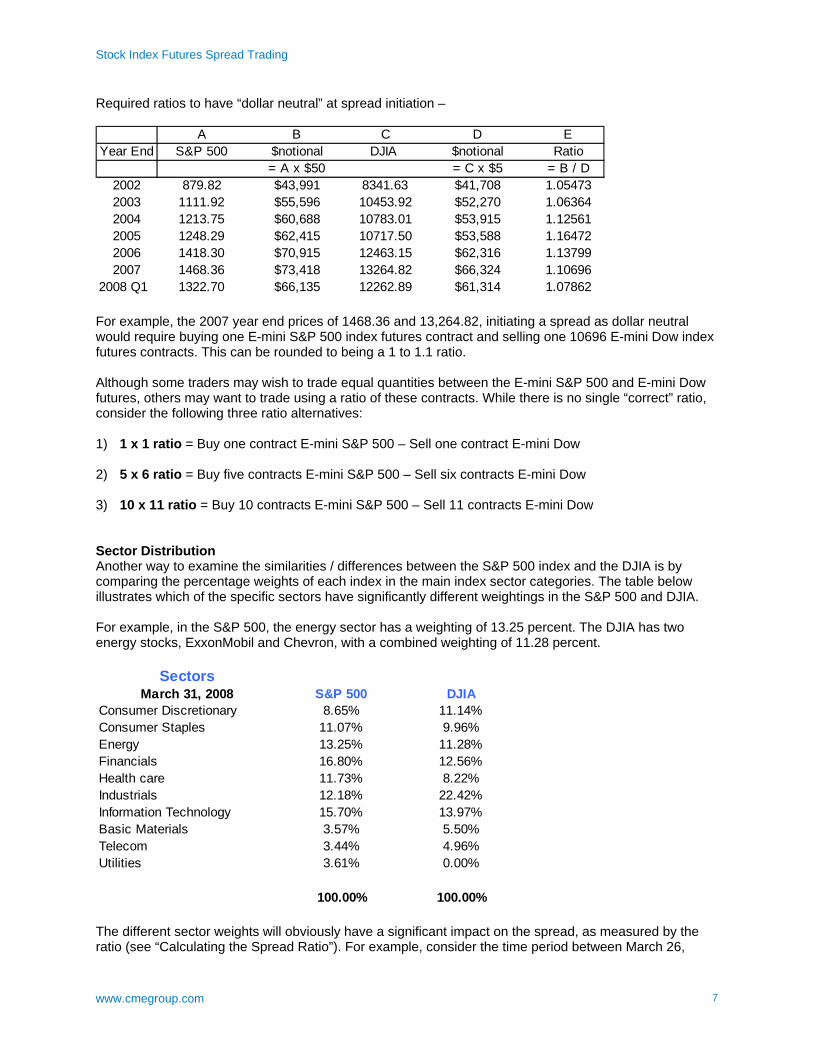
Required ratios to have “dollar neutral” at spread initiation –
A B C D EYear End S&P 500 $notional DJIA $notional Ratio
= A x $50 = C x $5 = B / D2002 879.82 $43,991 8341.63 $41,708 1.054732003 1111.92 $55,596 10453.92 $52,270 1.063642004 1213.75 $60,688 10783.01 $53,915 1.125612005 1248.29 $62,415 10717.50 $53,588 1.164722006 1418.30 $70,915 12463.15 $62,316 1.137992007 1468.36 $73,418 13264.82 $66,324 1.10696
2008 Q1 1322.70 $66,135 12262.89 $61,314 1.07862
For example, the 2007 year end prices of 1468.36 and 13,264.82, initiating a spread as dollar neutral would require buying one E-mini S&P 500 index futures contract and selling one 10696 E-mini Dow index futures contracts. This can be rounded to being a 1 to 1.1 ratio. Although some traders may wish to trade equal quantities between the E-mini S&P 500 and E-mini Dow futures, others may want to trade using a ratio of these contracts. While there is no single “correct” ratio, consider the following three ratio alternatives: 1) 1 x 1 ratio = Buy one contract E-mini S&P 500 – Sell one contract E-mini Dow 2) 5 x 6 ratio = Buy five contracts E-mini S&P 500 – Sell six contracts E-mini Dow 3) 10 x 11 ratio = Buy 10 contracts E-mini S&P 500 – Sell 11 contracts E-mini Dow Sector Distribution Another way to examine the similarities / differences between the S&P 500 index and the DJIA is by comparing the percentage weights of each index in the main index sector categories. The table below illustrates which of the specific sectors have significantly different weightings in the S&P 500 and DJIA. For example, in the S&P 500, the energy sector has a weighting of 13.25 percent. The DJIA has two energy stocks, ExxonMobil and Chevron, with a combined weighting of 11.28 percent.
SectorsMarch 31, 2008 S&P 500 DJIA
Consumer Discretionary 8.65% 11.14%Consumer Staples 11.07% 9.96%Energy 13.25% 11.28%Financials 16.80% 12.56%Health care 11.73% 8.22%Industrials 12.18% 22.42%Information Technology 15.70% 13.97%Basic Materials 3.57% 5.50%Telecom 3.44% 4.96%Utilities 3.61% 0.00%
100.00% 100.00%
The different sector weights will obviously have a significant impact on the spread, as measured by the ratio (see “Calculating the Spread Ratio”). For example, consider the time period between March 26,
Stock Index Futures Spread Trading
www.cmegroup.com 8
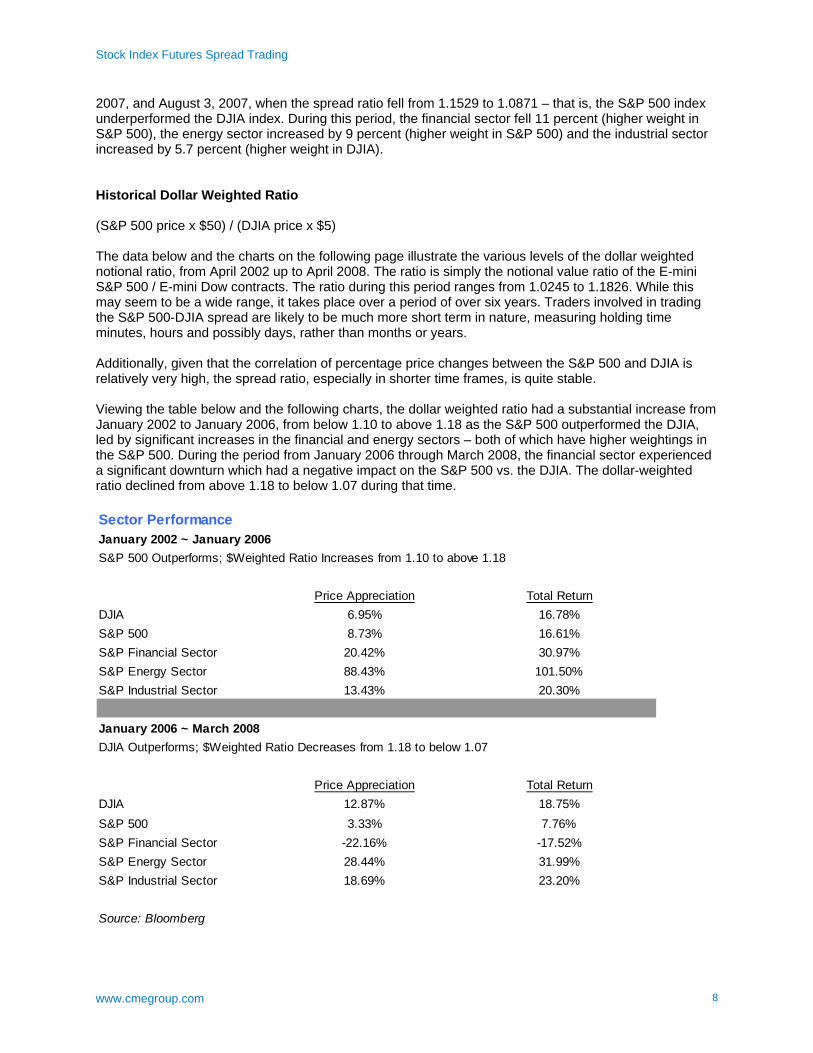
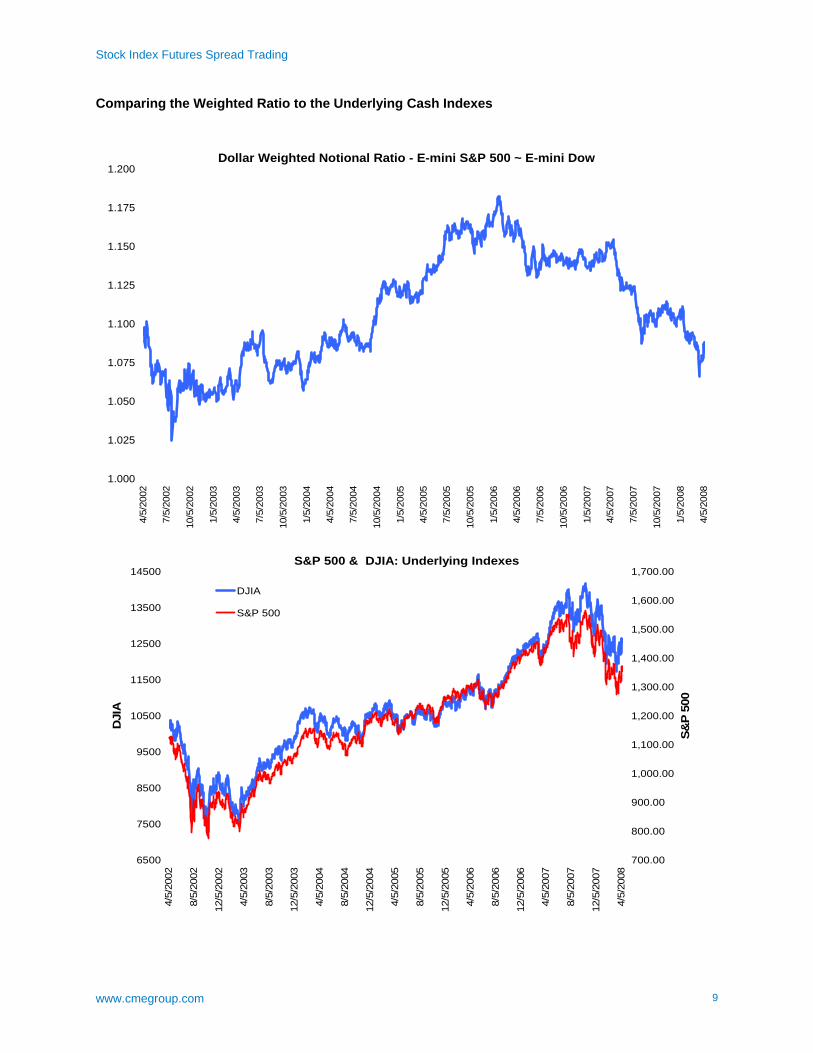
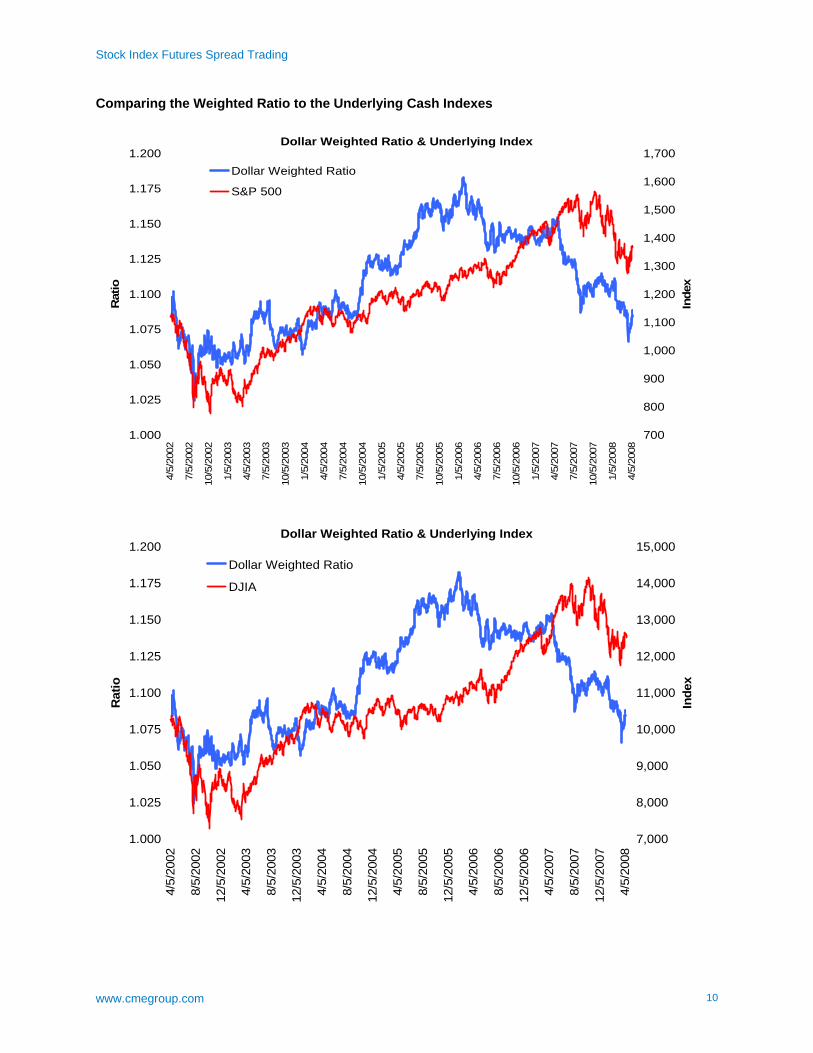
2007, and August 3, 2007, when the spread ratio fell from 1.1529 to 1.0871 – that is, the S&P 500 index underperformed the DJIA index. During this period, the financial sector fell 11 percent (higher weight in S&P 500), the energy sector increased by 9 percent (higher weight in S&P 500) and the industrial sector increased by 5.7 percent (higher weight in DJIA). Historical Dollar Weighted Ratio (S&P 500 price x $50) / (DJIA price x $5) The data below and the charts on the following page illustrate the various levels of the dollar weighted notional ratio, from April 2002 up to April 2008. The ratio is simply the notional value ratio of the E-mini S&P 500 / E-mini Dow contracts. The ratio during this period ranges from 1.0245 to 1.1826. While this may seem to be a wide range, it takes place over a period of over six years. Traders involved in trading the S&P 500-DJIA spread are likely to be much more short term in nature, measuring holding time minutes, hours and possibly days, rather than months or years. Additionally, given that the correlation of percentage price changes between the S&P 500 and DJIA is relatively very high, the spread ratio, especially in shorter time frames, is quite stable. Viewing the table below and the following charts, the dollar weighted ratio had a substantial increase from January 2002 to January 2006, from below 1.10 to above 1.18 as the S&P 500 outperformed the DJIA, led by significant increases in the financial and energy sectors – both of which have higher weightings in the S&P 500. During the period from January 2006 through March 2008, the financial sector experienced a significant downturn which had a negative impact on the S&P 500 vs. the DJIA. The dollar-weighted ratio declined from above 1.18 to below 1.07 during that time. Sector PerformanceJanuary 2002 ~ January 2006S&P 500 Outperforms; $Weighted Ratio Increases from 1.10 to above 1.18
Price Appreciation Total ReturnDJIA 6.95% 16.78%S&P 500 8.73% 16.61%S&P Financial Sector 20.42% 30.97%S&P Energy Sector 88.43% 101.50%S&P Industrial Sector 13.43% 20.30%
January 2006 ~ March 2008DJIA Outperforms; $Weighted Ratio Decreases from 1.18 to below 1.07
Price Appreciation Total ReturnDJIA 12.87% 18.75%S&P 500 3.33% 7.76%S&P Financial Sector -22.16% -17.52%S&P Energy Sector 28.44% 31.99%S&P Industrial Sector 18.69% 23.20%
Source: Bloomberg
Stock Index Futures Spread Trading
www.cmegroup.com 9
Comparing the Weighted Ratio to the Underlying Cash Indexes
Dollar Weighted Notional Ratio - E-mini S&P 500 ~ E-mini Dow
1.000
1.025
1.050
1.075
1.100
1.125
1.150
1.175
1.200
4/5/
2002
7/5/
2002
10/5
/200
2
1/5/
2003
4/5/
2003
7/5/
2003
10/5
/200
3
1/5/
2004
4/5/
2004
7/5/
2004
10/5
/200
4
1/5/
2005
4/5/
2005
7/5/
2005
10/5
/200
5
1/5/
2006
4/5/
2006
7/5/
2006
10/5
/200
6
1/5/
2007
4/5/
2007
7/5/
2007
10/5
/200
7
1/5/
2008
4/5/
2008
S&P 500 & DJIA: Underlying Indexes
6500
7500
8500
9500
10500
11500
12500
13500
14500
4/5/
2002
8/5/
2002
12/5
/200
2
4/5/
2003
8/5/
2003
12/5
/200
3
4/5/
2004
8/5/
2004
12/5
/200
4
4/5/
2005
8/5/
2005
12/5
/200
5
4/5/
2006
8/5/
2006
12/5
/200
6
4/5/
2007
8/5/
2007
12/5
/200
7
4/5/
2008
DJI
A
700.00
800.00
900.00
1,000.00
1,100.00
1,200.00
1,300.00
1,400.00
1,500.00
1,600.00
1,700.00
S&P
500
DJIA
S&P 500
Stock Index Futures Spread Trading
www.cmegroup.com 10
Comparing the Weighted Ratio to the Underlying Cash Indexes
Dollar Weighted Ratio & Underlying Index
1.000
1.025
1.050
1.075
1.100
1.125
1.150
1.175
1.2004/
5/20
02
7/5/
2002
10/5
/200
2
1/5/
2003
4/5/
2003
7/5/
2003
10/5
/200
3
1/5/
2004
4/5/
2004
7/5/
2004
10/5
/200
4
1/5/
2005
4/5/
2005
7/5/
2005
10/5
/200
5
1/5/
2006
4/5/
2006
7/5/
2006
10/5
/200
6
1/5/
2007
4/5/
2007
7/5/
2007
10/5
/200
7
1/5/
2008
4/5/
2008
Rat
io
700
800
900
1,000
1,100
1,200
1,300
1,400
1,500
1,600
1,700
Inde
x
Dollar Weighted Ratio
S&P 500
Dollar Weighted Ratio & Underlying Index
1.000
1.025
1.050
1.075
1.100
1.125
1.150
1.175
1.200
4/5/
2002
8/5/
2002
12/5
/200
2
4/5/
2003
8/5/
2003
12/5
/200
3
4/5/
2004
8/5/
2004
12/5
/200
4
4/5/
2005
8/5/
2005
12/5
/200
5
4/5/
2006
8/5/
2006
12/5
/200
6
4/5/
2007
8/5/
2007
12/5
/200
7
4/5/
2008
Rat
io
7,000
8,000
9,000
10,000
11,000
12,000
13,000
14,000
15,000
Inde
x
Dollar Weighted Ratio
DJIA
Stock Index Futures Spread Trading
www.cmegroup.com 11
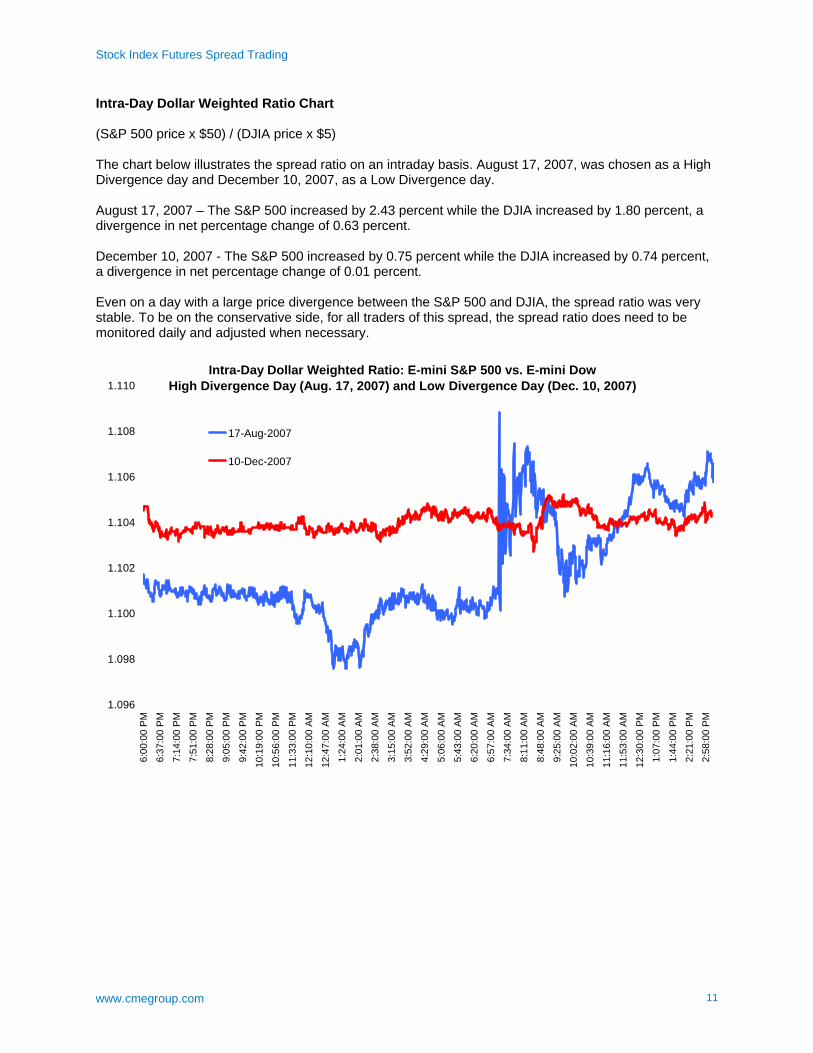
Intra-Day Dollar Weighted Ratio Chart (S&P 500 price x $50) / (DJIA price x $5) The chart below illustrates the spread ratio on an intraday basis. August 17, 2007, was chosen as a High Divergence day and December 10, 2007, as a Low Divergence day. August 17, 2007 – The S&P 500 increased by 2.43 percent while the DJIA increased by 1.80 percent, a divergence in net percentage change of 0.63 percent. December 10, 2007 - The S&P 500 increased by 0.75 percent while the DJIA increased by 0.74 percent, a divergence in net percentage change of 0.01 percent. Even on a day with a large price divergence between the S&P 500 and DJIA, the spread ratio was very stable. To be on the conservative side, for all traders of this spread, the spread ratio does need to be monitored daily and adjusted when necessary.
Intra-Day Dollar Weighted Ratio: E-mini S&P 500 vs. E-mini DowHigh Divergence Day (Aug. 17, 2007) and Low Divergence Day (Dec. 10, 2007)
1.096
1.098
1.100
1.102
1.104
1.106
1.108
1.110
6:00
:00
PM
6:37
:00
PM
7:14
:00
PM
7:51
:00
PM
8:28
:00
PM
9:05
:00
PM
9:42
:00
PM
10:1
9:00
PM
10:5
6:00
PM
11:3
3:00
PM
12:1
0:00
AM
12:4
7:00
AM
1:24
:00
AM
2:01
:00
AM
2:38
:00
AM
3:15
:00
AM
3:52
:00
AM
4:29
:00
AM
5:06
:00
AM
5:43
:00
AM
6:20
:00
AM
6:57
:00
AM
7:34
:00
AM
8:11
:00
AM
8:48
:00
AM
9:25
:00
AM
10:0
2:00
AM
10:3
9:00
AM
11:1
6:00
AM
11:5
3:00
AM
12:3
0:00
PM
1:07
:00
PM
1:44
:00
PM
2:21
:00
PM
2:58
:00
PM
17-Aug-2007
10-Dec-2007
Stock Index Futures Spread Trading
www.cmegroup.com 12
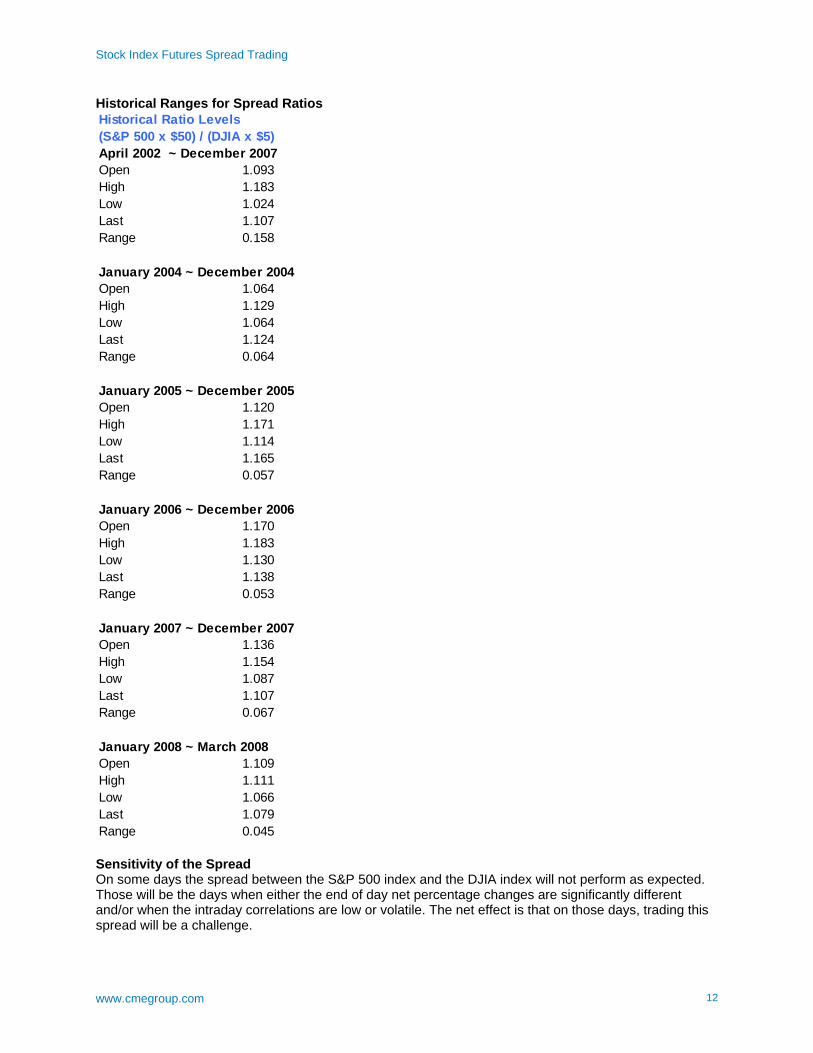
Historical Ranges for Spread Ratios Historical Ratio Levels(S&P 500 x $50) / (DJIA x $5) April 2002 ~ December 2007Open 1.093High 1.183Low 1.024Last 1.107Range 0.158
January 2004 ~ December 2004Open 1.064High 1.129Low 1.064Last 1.124Range 0.064
January 2005 ~ December 2005Open 1.120High 1.171Low 1.114Last 1.165Range 0.057
January 2006 ~ December 2006Open 1.170High 1.183Low 1.130Last 1.138Range 0.053
January 2007 ~ December 2007Open 1.136High 1.154Low 1.087Last 1.107Range 0.067
January 2008 ~ March 2008Open 1.109High 1.111Low 1.066Last 1.079Range 0.045 Sensitivity of the Spread On some days the spread between the S&P 500 index and the DJIA index will not perform as expected. Those will be the days when either the end of day net percentage changes are significantly different and/or when the intraday correlations are low or volatile. The net effect is that on those days, trading this spread will be a challenge.
Stock Index Futures Spread Trading
www.cmegroup.com 13
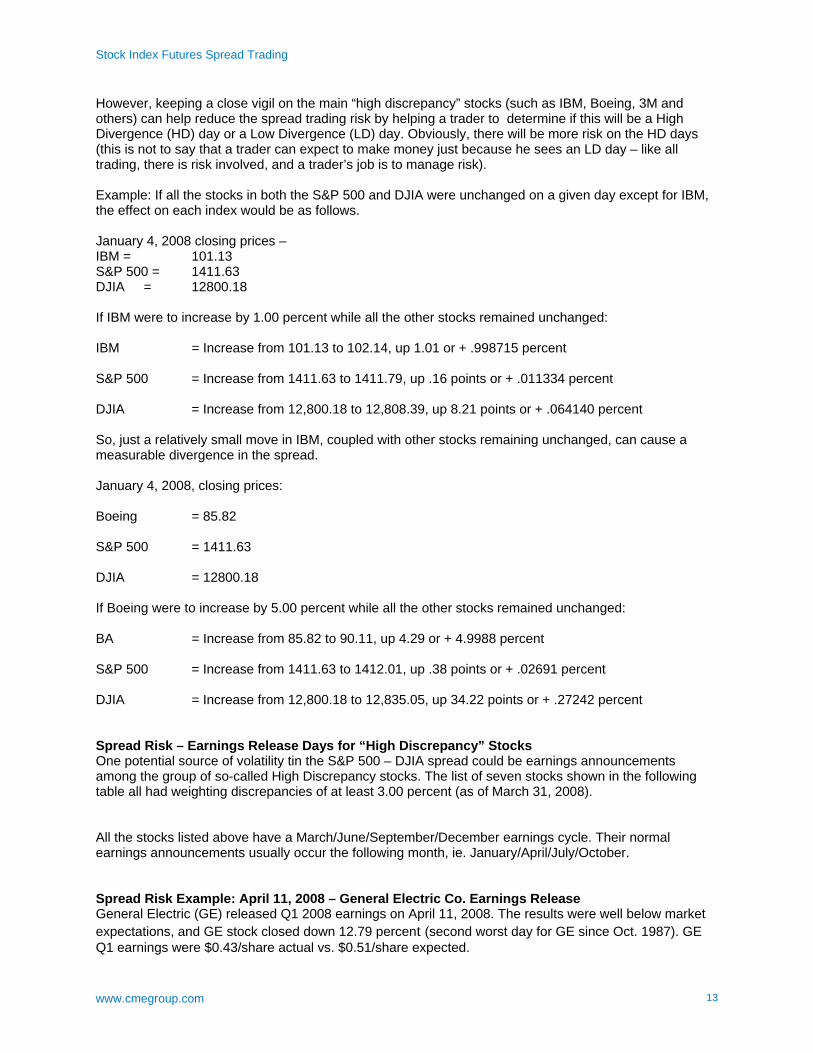
However, keeping a close vigil on the main “high discrepancy” stocks (such as IBM, Boeing, 3M and others) can help reduce the spread trading risk by helping a trader to determine if this will be a High Divergence (HD) day or a Low Divergence (LD) day. Obviously, there will be more risk on the HD days (this is not to say that a trader can expect to make money just because he sees an LD day – like all trading, there is risk involved, and a trader’s job is to manage risk). Example: If all the stocks in both the S&P 500 and DJIA were unchanged on a given day except for IBM, the effect on each index would be as follows. January 4, 2008 closing prices – IBM = 101.13 S&P 500 = 1411.63 DJIA = 12800.18 If IBM were to increase by 1.00 percent while all the other stocks remained unchanged: IBM = Increase from 101.13 to 102.14, up 1.01 or + .998715 percent S&P 500 = Increase from 1411.63 to 1411.79, up .16 points or + .011334 percent DJIA = Increase from 12,800.18 to 12,808.39, up 8.21 points or + .064140 percent So, just a relatively small move in IBM, coupled with other stocks remaining unchanged, can cause a measurable divergence in the spread. January 4, 2008, closing prices: Boeing = 85.82 S&P 500 = 1411.63 DJIA = 12800.18 If Boeing were to increase by 5.00 percent while all the other stocks remained unchanged: BA = Increase from 85.82 to 90.11, up 4.29 or + 4.9988 percent S&P 500 = Increase from 1411.63 to 1412.01, up .38 points or + .02691 percent DJIA = Increase from 12,800.18 to 12,835.05, up 34.22 points or + .27242 percent Spread Risk – Earnings Release Days for “High Discrepancy” Stocks One potential source of volatility tin the S&P 500 – DJIA spread could be earnings announcements among the group of so-called High Discrepancy stocks. The list of seven stocks shown in the following table all had weighting discrepancies of at least 3.00 percent (as of March 31, 2008). All the stocks listed above have a March/June/September/December earnings cycle. Their normal earnings announcements usually occur the following month, ie. January/April/July/October. Spread Risk Example: April 11, 2008 – General Electric Co. Earnings Release General Electric (GE) released Q1 2008 earnings on April 11, 2008. The results were well below market expectations, and GE stock closed down 12.79 percent (second worst day for GE since Oct. 1987). GE Q1 earnings were $0.43/share actual vs. $0.51/share expected.
Stock Index Futures Spread Trading
www.cmegroup.com 14
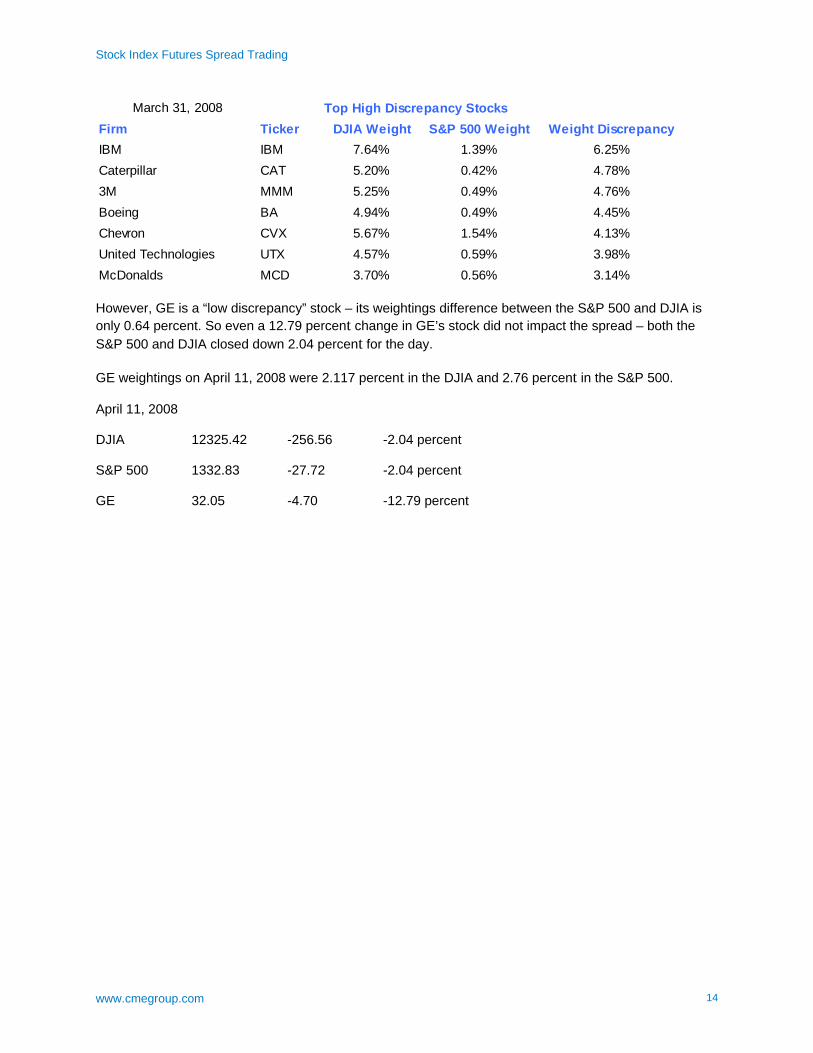
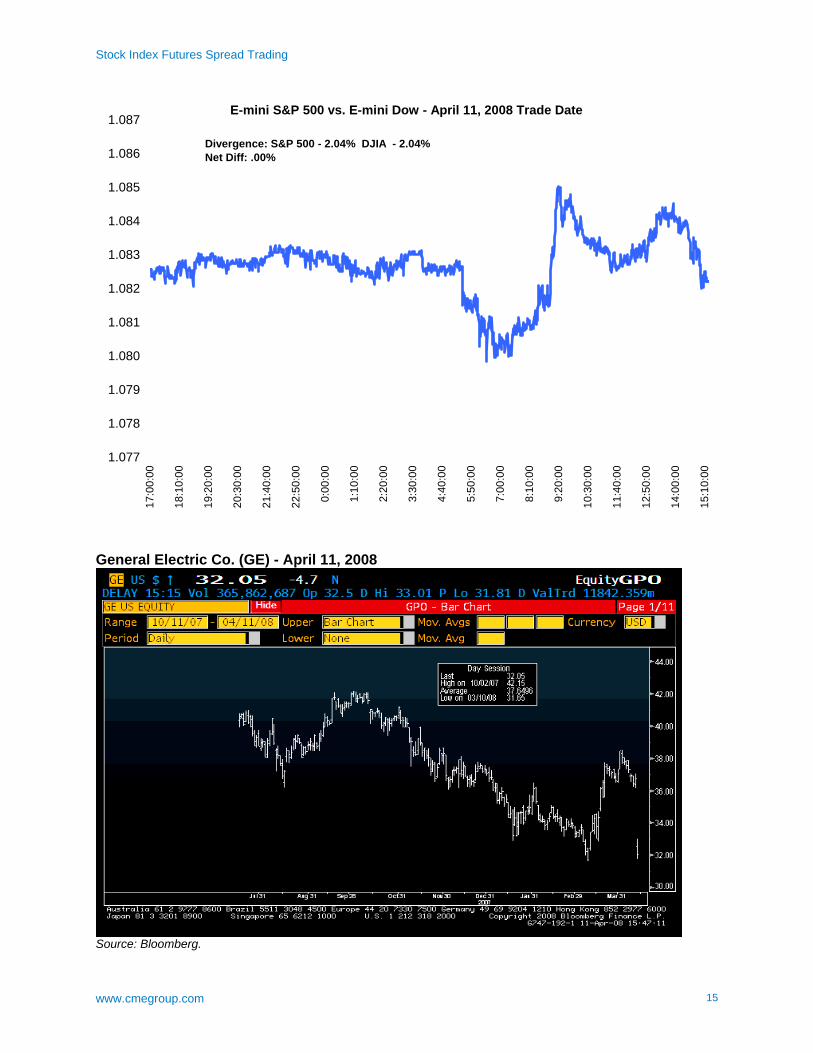
March 31, 2008 Top High Discrepancy StocksFirm Ticker DJIA Weight S&P 500 Weight Weight DiscrepancyIBM IBM 7.64% 1.39% 6.25%Caterpillar CAT 5.20% 0.42% 4.78%3M MMM 5.25% 0.49% 4.76%Boeing BA 4.94% 0.49% 4.45%Chevron CVX 5.67% 1.54% 4.13%United Technologies UTX 4.57% 0.59% 3.98%McDonalds MCD 3.70% 0.56% 3.14% However, GE is a “low discrepancy” stock – its weightings difference between the S&P 500 and DJIA is only 0.64 percent. So even a 12.79 percent change in GE’s stock did not impact the spread – both the S&P 500 and DJIA closed down 2.04 percent for the day. GE weightings on April 11, 2008 were 2.117 percent in the DJIA and 2.76 percent in the S&P 500. April 11, 2008 DJIA 12325.42 -256.56 -2.04 percent S&P 500 1332.83 -27.72 -2.04 percent GE 32.05 -4.70 -12.79 percent
Stock Index Futures Spread Trading
www.cmegroup.com 15
E-mini S&P 500 vs. E-mini Dow - April 11, 2008 Trade Date
1.077
1.078
1.079
1.080
1.081
1.082
1.083
1.084
1.085
1.086
1.087
17:0
0:00
18:1
0:00
19:2
0:00
20:3
0:00
21:4
0:00
22:5
0:00
0:00
:00
1:10
:00
2:20
:00
3:30
:00
4:40
:00
5:50
:00
7:00
:00
8:10
:00
9:20
:00
10:3
0:00
11:4
0:00
12:5
0:00
14:0
0:00
15:1
0:00
Divergence: S&P 500 - 2.04% DJIA - 2.04% Net Diff: .00%
General Electric Co. (GE) - April 11, 2008
Source: Bloomberg.
Stock Index Futures Spread Trading
www.cmegroup.com 16
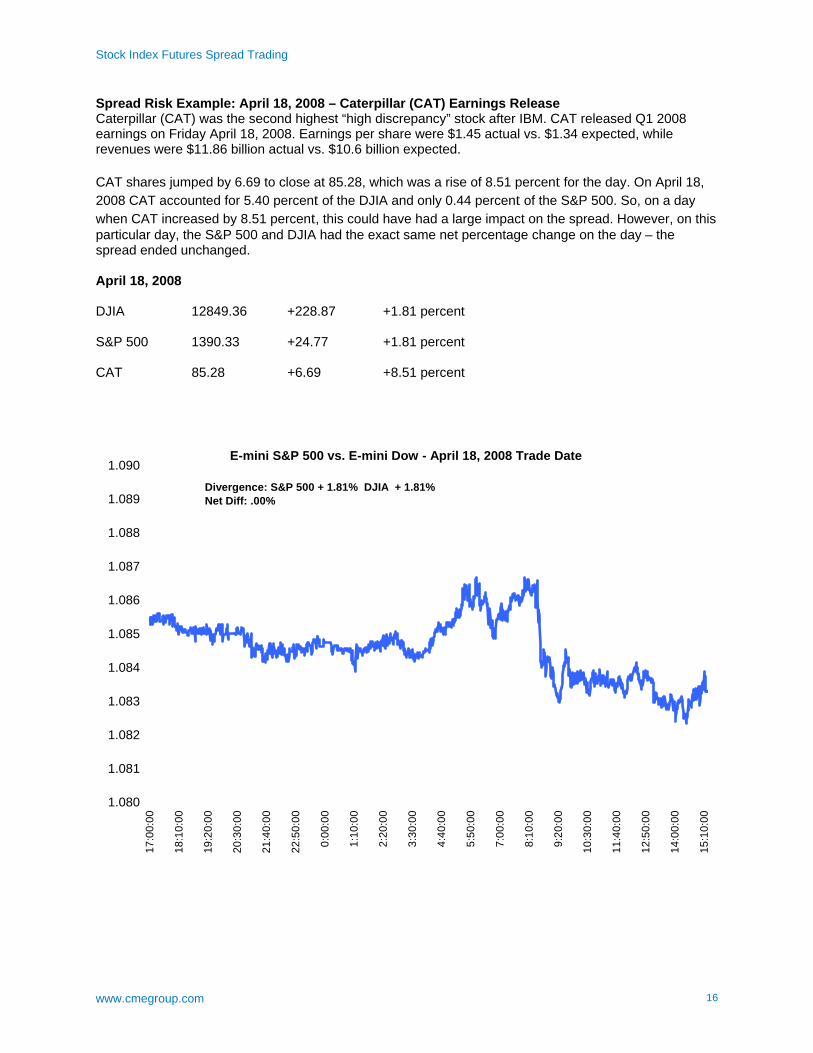
Spread Risk Example: April 18, 2008 – Caterpillar (CAT) Earnings Release Caterpillar (CAT) was the second highest “high discrepancy” stock after IBM. CAT released Q1 2008 earnings on Friday April 18, 2008. Earnings per share were $1.45 actual vs. $1.34 expected, while revenues were $11.86 billion actual vs. $10.6 billion expected. CAT shares jumped by 6.69 to close at 85.28, which was a rise of 8.51 percent for the day. On April 18, 2008 CAT accounted for 5.40 percent of the DJIA and only 0.44 percent of the S&P 500. So, on a day when CAT increased by 8.51 percent, this could have had a large impact on the spread. However, on this particular day, the S&P 500 and DJIA had the exact same net percentage change on the day – the spread ended unchanged. April 18, 2008 DJIA 12849.36 +228.87 +1.81 percent S&P 500 1390.33 +24.77 +1.81 percent CAT 85.28 +6.69 +8.51 percent
E-mini S&P 500 vs. E-mini Dow - April 18, 2008 Trade Date
1.080
1.081
1.082
1.083
1.084
1.085
1.086
1.087
1.088
1.089
1.090
17:0
0:00
18:1
0:00
19:2
0:00
20:3
0:00
21:4
0:00
22:5
0:00
0:00
:00
1:10
:00
2:20
:00
3:30
:00
4:40
:00
5:50
:00
7:00
:00
8:10
:00
9:20
:00
10:3
0:00
11:4
0:00
12:5
0:00
14:0
0:00
15:1
0:00
Divergence: S&P 500 + 1.81% DJIA + 1.81% Net Diff: .00%
Stock Index Futures Spread Trading
www.cmegroup.com 17
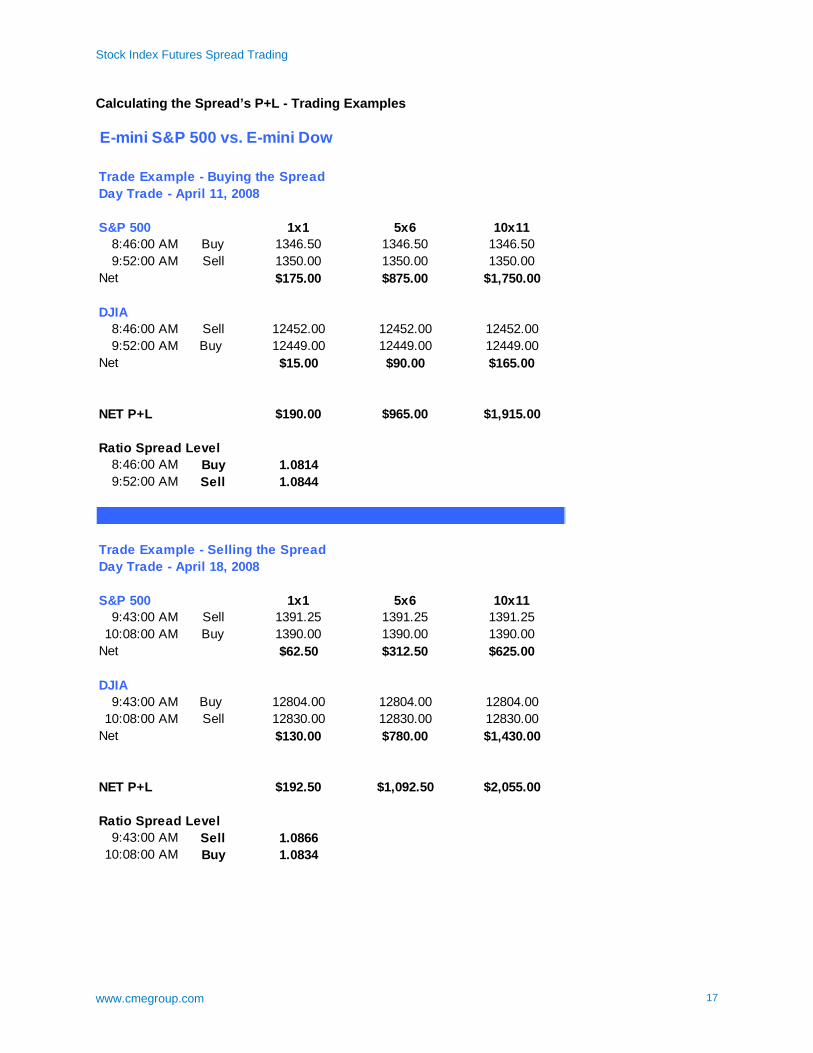
Calculating the Spread’s P+L - Trading Examples E-mini S&P 500 vs. E-mini Dow
Trade Example - Buying the SpreadDay Trade - April 11, 2008
S&P 500 1x1 5x6 10x118:46:00 AM Buy 1346.50 1346.50 1346.509:52:00 AM Sell 1350.00 1350.00 1350.00
Net $175.00 $875.00 $1,750.00
DJIA8:46:00 AM Sell 12452.00 12452.00 12452.009:52:00 AM Buy 12449.00 12449.00 12449.00
Net $15.00 $90.00 $165.00
NET P+L $190.00 $965.00 $1,915.00
Ratio Spread Level8:46:00 AM Buy 1.08149:52:00 AM Sell 1.0844
Trade Example - Selling the SpreadDay Trade - April 18, 2008
S&P 500 1x1 5x6 10x119:43:00 AM Sell 1391.25 1391.25 1391.25
10:08:00 AM Buy 1390.00 1390.00 1390.00Net $62.50 $312.50 $625.00
DJIA9:43:00 AM Buy 12804.00 12804.00 12804.00
10:08:00 AM Sell 12830.00 12830.00 12830.00Net $130.00 $780.00 $1,430.00
NET P+L $192.50 $1,092.50 $2,055.00
Ratio Spread Level9:43:00 AM Sell 1.0866
10:08:00 AM Buy 1.0834
Stock Index Futures Spread Trading
www.cmegroup.com 18
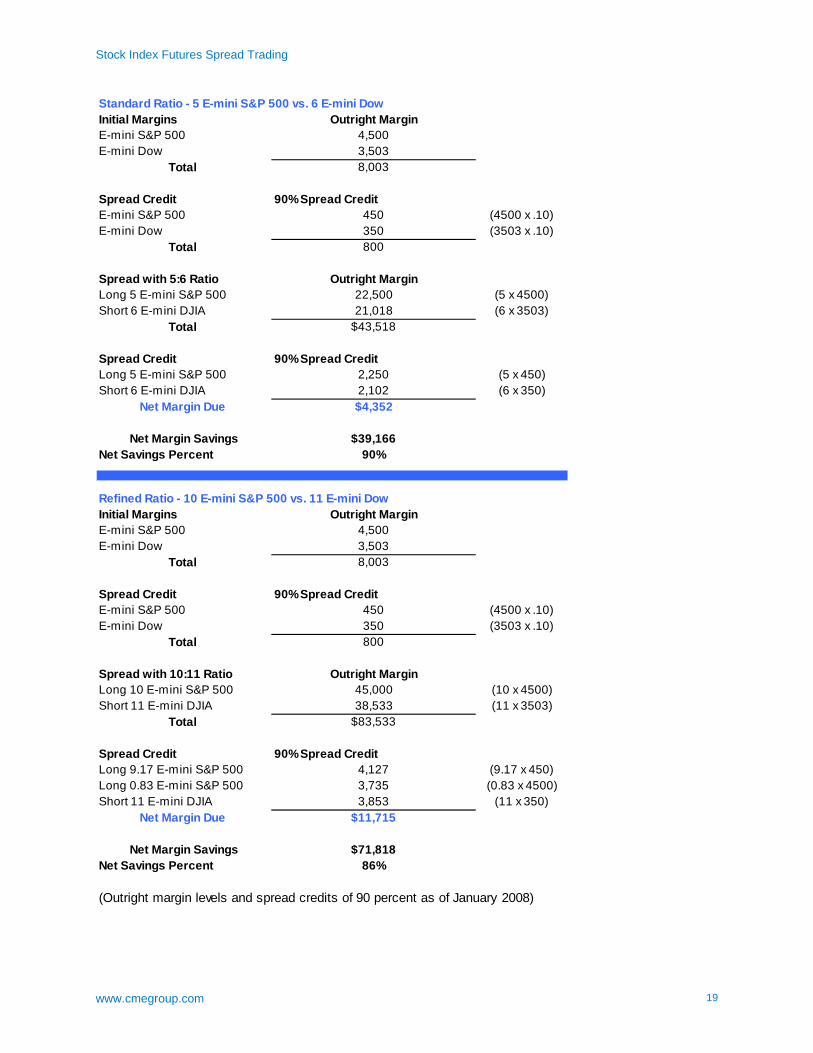
Spread Margin Requirements Initial margin requirements for U.S. stock index futures have often been in the range of 5 - 7 percent of the underlying notional value of the contract (note: Margin requirements can and will be increased if market conditions warrant such a decision). The CME Group Clearing Division offers “spread credits” for spread trades between similar products. These spread credits can have a dramatic impact on the initial margin requirements for highly correlated spread such as the S&P 500 vs. the DJIA. Currently, the CME Group offers a spread credit rate of 90 percent for the S&P 500 vs. the DJIA spread. That means that the margins for a spread would only be 10% of the normal outright initial margins. The spread credit for the E-mini S&P 500 index vs. the E-mini Dow index applies a standard spread ratio of 5:6 (five contracts of E-mini S&P 500 vs. six contracts of E-mini Dow). Fractional Spreads
The CME Group Clearing Division will calculate spread credits based on whole and fractional spreads. For example, the standard ratio for margin purposes is 5:6 (five contracts of E-mini S&P 500 vs. six contracts of E-mini Dow). So, spread quantities based exactly on the 5:6 ratio (i.e., 10 x 12, 50 x 60, and so on) will enjoy the full 90 percent spread credit. Spread ratios that are not exactly on a 5:6 ratio will receive spread credits at an effective rate of less than 90 percent, as all of the spread that qualifies for the 5:6 rate will be margined at the 90 percent credit, while the remaining fractional quantities will be margined at a combination of the 90 percent credit rate and the normal outright margin rate. The following example will help illustrate this point. Position: Long 10 E-mini S&P 500 futures and Short 11 E-mini Dow futures
1) Margin the 11 E-mini Dow futures at the 90% spread credit rate 2) Multiply 11 x .8333 (the standard ratio of 5 divided by 6) to arrive at 9.166, rounding this up to
9.17. The number of E-mini S&P 500 futures that can be margined at the 90 percent spread credit rate is 9.17.
3) The remaining .83 contracts of E-mini S&P 500 futures will be margined at the normal outright margin rate of $4,500 per contract.
Please see the following table to view examples using both the 5:6 Standard Ratio and also the 10:11 Ratio.
Stock Index Futures Spread Trading
www.cmegroup.com 19
Standard Ratio - 5 E-mini S&P 500 vs. 6 E-mini DowInitial Margins Outright MarginE-mini S&P 500 4,500E-mini Dow 3,503
Total 8,003
Spread Credit 90% Spread CreditE-mini S&P 500 450 (4500 x .10)E-mini Dow 350 (3503 x .10)
Total 800
Spread with 5:6 Ratio Outright MarginLong 5 E-mini S&P 500 22,500 (5 x 4500)Short 6 E-mini DJIA 21,018 (6 x 3503)
Total $43,518
Spread Credit 90% Spread CreditLong 5 E-mini S&P 500 2,250 (5 x 450)Short 6 E-mini DJIA 2,102 (6 x 350)
Net Margin Due $4,352
Net Margin Savings $39,166Net Savings Percent 90%
Refined Ratio - 10 E-mini S&P 500 vs. 11 E-mini DowInitial Margins Outright MarginE-mini S&P 500 4,500E-mini Dow 3,503
Total 8,003
Spread Credit 90% Spread CreditE-mini S&P 500 450 (4500 x .10)E-mini Dow 350 (3503 x .10)
Total 800
Spread with 10:11 Ratio Outright MarginLong 10 E-mini S&P 500 45,000 (10 x 4500)Short 11 E-mini DJIA 38,533 (11 x 3503)
Total $83,533
Spread Credit 90% Spread CreditLong 9.17 E-mini S&P 500 4,127 (9.17 x 450)Long 0.83 E-mini S&P 500 3,735 (0.83 x 4500)Short 11 E-mini DJIA 3,853 (11 x 350)
Net Margin Due $11,715
Net Margin Savings $71,818Net Savings Percent 86%
(Outright margin levels and spread credits of 90 percent as of January 2008)
Stock Index Futures Spread Trading
www.cmegroup.com 20
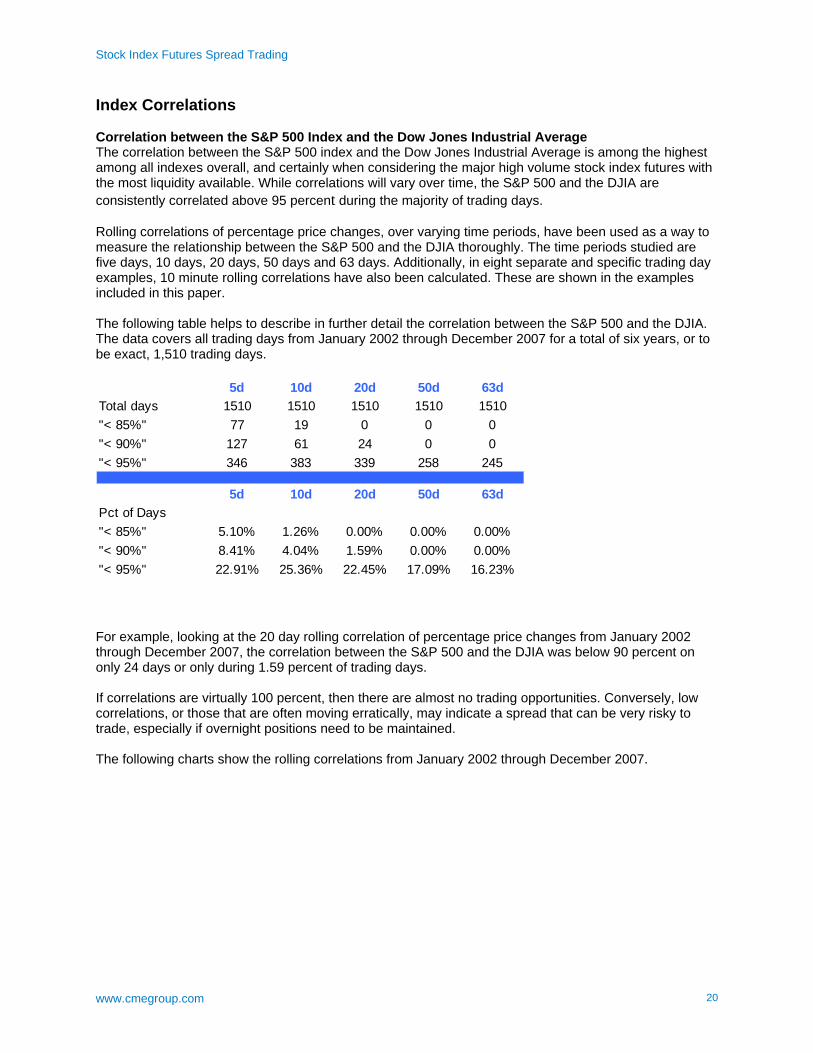
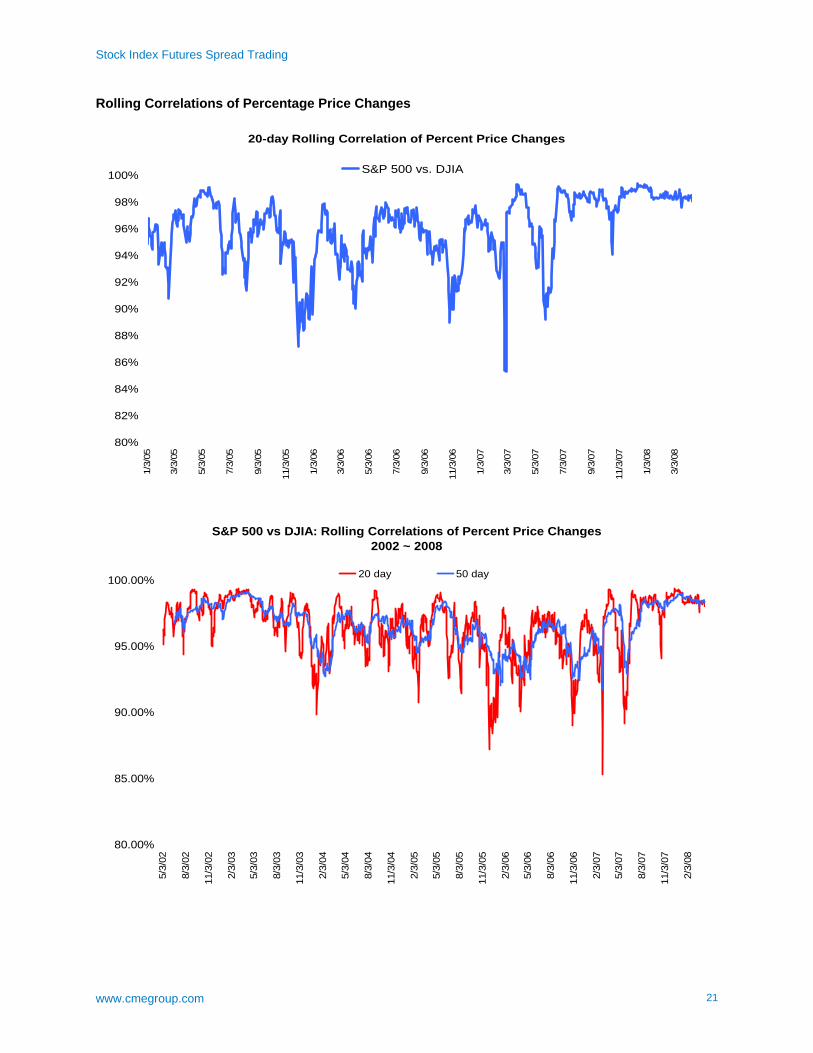
Index Correlations Correlation between the S&P 500 Index and the Dow Jones Industrial Average The correlation between the S&P 500 index and the Dow Jones Industrial Average is among the highest among all indexes overall, and certainly when considering the major high volume stock index futures with the most liquidity available. While correlations will vary over time, the S&P 500 and the DJIA are consistently correlated above 95 percent during the majority of trading days. Rolling correlations of percentage price changes, over varying time periods, have been used as a way to measure the relationship between the S&P 500 and the DJIA thoroughly. The time periods studied are five days, 10 days, 20 days, 50 days and 63 days. Additionally, in eight separate and specific trading day examples, 10 minute rolling correlations have also been calculated. These are shown in the examples included in this paper. The following table helps to describe in further detail the correlation between the S&P 500 and the DJIA. The data covers all trading days from January 2002 through December 2007 for a total of six years, or to be exact, 1,510 trading days.
5d 10d 20d 50d 63dTotal days 1510 1510 1510 1510 1510"< 85%" 77 19 0 0 0"< 90%" 127 61 24 0 0"< 95%" 346 383 339 258 245
5d 10d 20d 50d 63dPct of Days"< 85%" 5.10% 1.26% 0.00% 0.00% 0.00%"< 90%" 8.41% 4.04% 1.59% 0.00% 0.00%"< 95%" 22.91% 25.36% 22.45% 17.09% 16.23%
For example, looking at the 20 day rolling correlation of percentage price changes from January 2002 through December 2007, the correlation between the S&P 500 and the DJIA was below 90 percent on only 24 days or only during 1.59 percent of trading days. If correlations are virtually 100 percent, then there are almost no trading opportunities. Conversely, low correlations, or those that are often moving erratically, may indicate a spread that can be very risky to trade, especially if overnight positions need to be maintained. The following charts show the rolling correlations from January 2002 through December 2007.
Stock Index Futures Spread Trading
www.cmegroup.com 21
Rolling Correlations of Percentage Price Changes
20-day Rolling Correlation of Percent Price Changes
80%
82%
84%
86%
88%
90%
92%
94%
96%
98%
100%
1/3/
05
3/3/
05
5/3/
05
7/3/
05
9/3/
05
11/3
/05
1/3/
06
3/3/
06
5/3/
06
7/3/
06
9/3/
06
11/3
/06
1/3/
07
3/3/
07
5/3/
07
7/3/
07
9/3/
07
11/3
/07
1/3/
08
3/3/
08
S&P 500 vs. DJIA
S&P 500 vs DJIA: Rolling Correlations of Percent Price Changes2002 ~ 2008
80.00%
85.00%
90.00%
95.00%
100.00%
5/3/
02
8/3/
02
11/3
/02
2/3/
03
5/3/
03
8/3/
03
11/3
/03
2/3/
04
5/3/
04
8/3/
04
11/3
/04
2/3/
05
5/3/
05
8/3/
05
11/3
/05
2/3/
06
5/3/
06
8/3/
06
11/3
/06
2/3/
07
5/3/
07
8/3/
07
11/3
/07
2/3/
08
20 day 50 day
Stock Index Futures Spread Trading
www.cmegroup.com 22
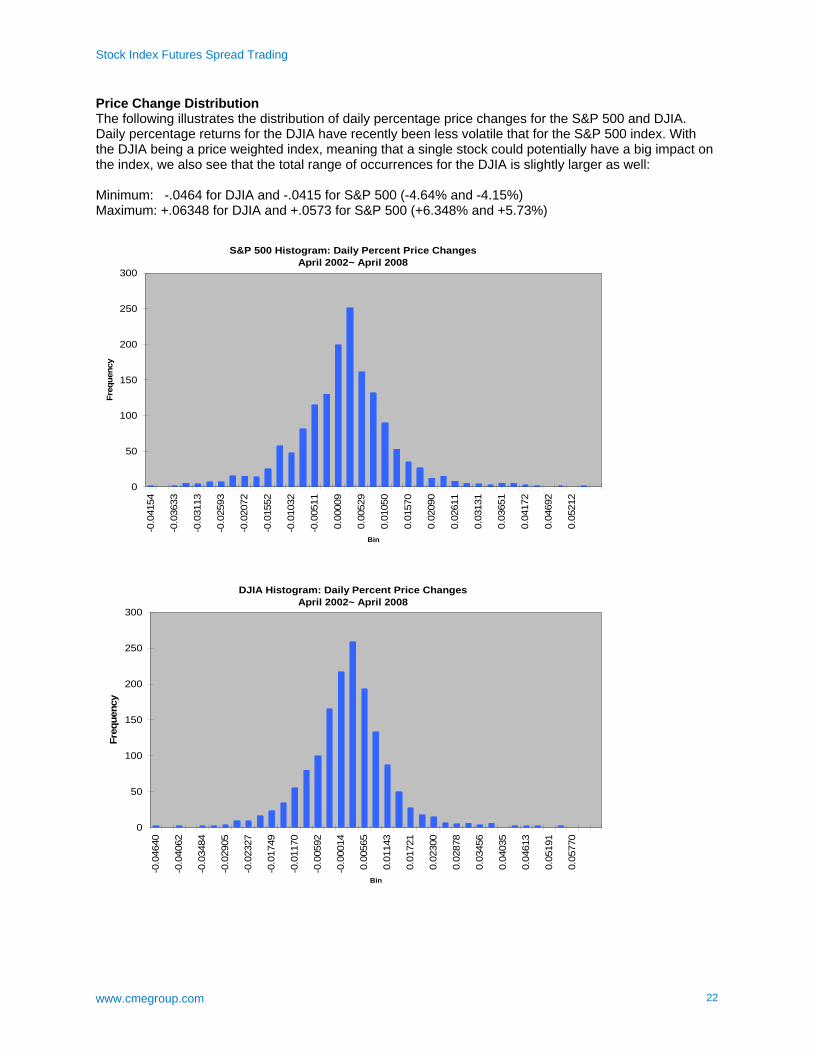
Price Change Distribution The following illustrates the distribution of daily percentage price changes for the S&P 500 and DJIA. Daily percentage returns for the DJIA have recently been less volatile that for the S&P 500 index. With the DJIA being a price weighted index, meaning that a single stock could potentially have a big impact on the index, we also see that the total range of occurrences for the DJIA is slightly larger as well: Minimum: -.0464 for DJIA and -.0415 for S&P 500 (-4.64% and -4.15%) Maximum: +.06348 for DJIA and +.0573 for S&P 500 (+6.348% and +5.73%)
S&P 500 Histogram: Daily Percent Price ChangesApril 2002~ April 2008
0
50
100
150
200
250
300
-0.0
4154
-0.0
3633
-0.0
3113
-0.0
2593
-0.0
2072
-0.0
1552
-0.0
1032
-0.0
0511
0.00
009
0.00
529
0.01
050
0.01
570
0.02
090
0.02
611
0.03
131
0.03
651
0.04
172
0.04
692
0.05
212
Bin
Freq
uenc
y
DJIA Histogram: Daily Percent Price Changes April 2002~ April 2008
0
50
100
150
200
250
300
-0.0
4640
-0.0
4062
-0.0
3484
-0.0
2905
-0.0
2327
-0.0
1749
-0.0
1170
-0.0
0592
-0.0
0014
0.00
565
0.01
143
0.01
721
0.02
300
0.02
878
0.03
456
0.04
035
0.04
613
0.05
191
0.05
770
Bin
Freq
uenc
y
Stock Index Futures Spread Trading
www.cmegroup.com 23
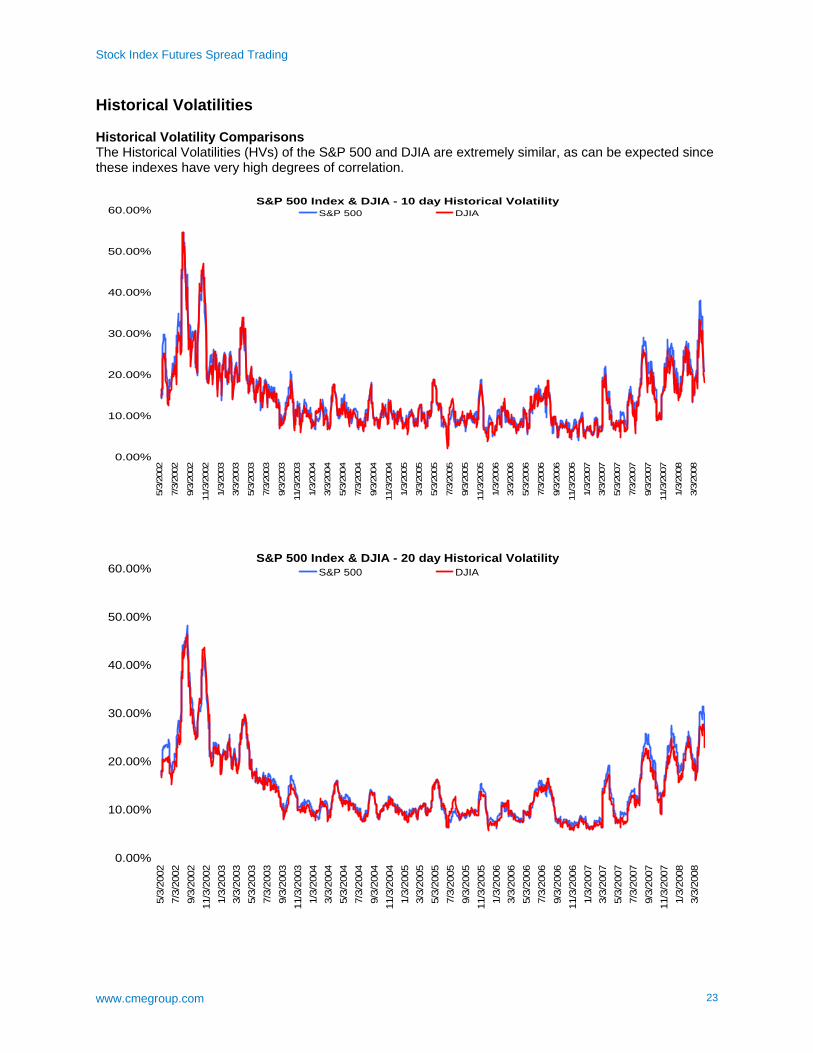
Historical Volatilities Historical Volatility Comparisons The Historical Volatilities (HVs) of the S&P 500 and DJIA are extremely similar, as can be expected since these indexes have very high degrees of correlation.
S&P 500 Index & DJIA - 10 day Historical Volatility
0.00%
10.00%
20.00%
30.00%
40.00%
50.00%
60.00%
5/3/
2002
7/3/
2002
9/3/
2002
11/3
/200
2
1/3/
2003
3/3/
2003
5/3/
2003
7/3/
2003
9/3/
2003
11/3
/200
3
1/3/
2004
3/3/
2004
5/3/
2004
7/3/
2004
9/3/
2004
11/3
/200
4
1/3/
2005
3/3/
2005
5/3/
2005
7/3/
2005
9/3/
2005
11/3
/200
5
1/3/
2006
3/3/
2006
5/3/
2006
7/3/
2006
9/3/
2006
11/3
/200
6
1/3/
2007
3/3/
2007
5/3/
2007
7/3/
2007
9/3/
2007
11/3
/200
7
1/3/
2008
3/3/
2008
S&P 500 DJIA
S&P 500 Index & DJIA - 20 day Historical Volatility
0.00%
10.00%
20.00%
30.00%
40.00%
50.00%
60.00%
5/3/
2002
7/3/
2002
9/3/
2002
11/3
/200
21/
3/20
033/
3/20
035/
3/20
037/
3/20
039/
3/20
0311
/3/2
003
1/3/
2004
3/3/
2004
5/3/
2004
7/3/
2004
9/3/
2004
11/3
/200
41/
3/20
053/
3/20
055/
3/20
057/
3/20
059/
3/20
0511
/3/2
005
1/3/
2006
3/3/
2006
5/3/
2006
7/3/
2006
9/3/
2006
11/3
/200
61/
3/20
073/
3/20
075/
3/20
077/
3/20
079/
3/20
0711
/3/2
007
1/3/
2008
3/3/
2008
S&P 500 DJIA
Stock Index Futures Spread Trading
www.cmegroup.com 24
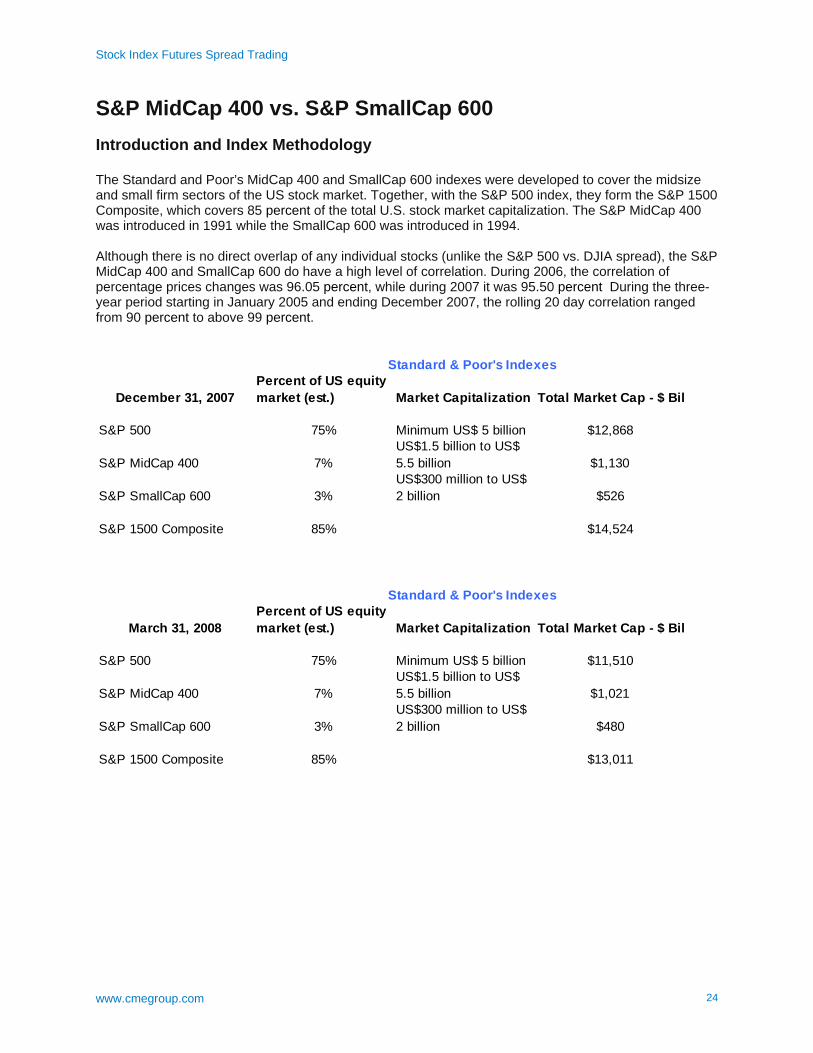
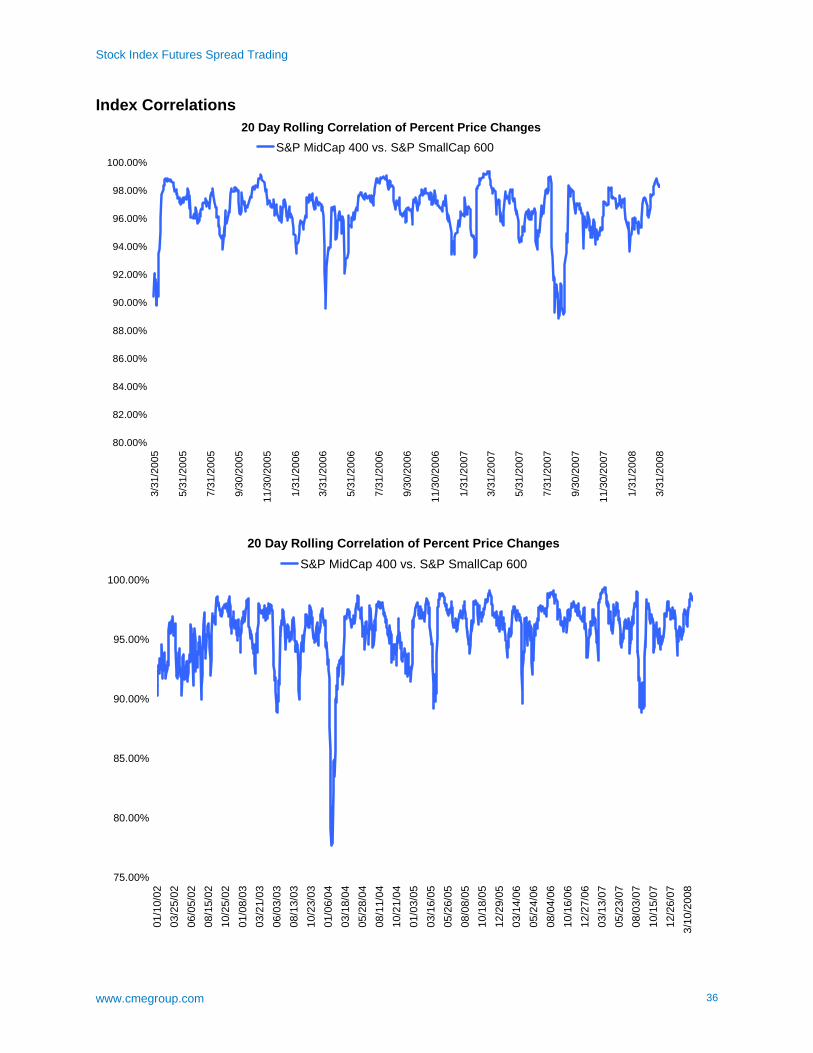
S&P MidCap 400 vs. S&P SmallCap 600 Introduction and Index Methodology The Standard and Poor’s MidCap 400 and SmallCap 600 indexes were developed to cover the midsize and small firm sectors of the US stock market. Together, with the S&P 500 index, they form the S&P 1500 Composite, which covers 85 percent of the total U.S. stock market capitalization. The S&P MidCap 400 was introduced in 1991 while the SmallCap 600 was introduced in 1994. Although there is no direct overlap of any individual stocks (unlike the S&P 500 vs. DJIA spread), the S&P MidCap 400 and SmallCap 600 do have a high level of correlation. During 2006, the correlation of percentage prices changes was 96.05 percent, while during 2007 it was 95.50 percent During the three-year period starting in January 2005 and ending December 2007, the rolling 20 day correlation ranged from 90 percent to above 99 percent.
December 31, 2007Percent of US equity market (est.) Market Capitalization Total Market Cap - $ Bil
S&P 500 75% Minimum US$ 5 billion $12,868
S&P MidCap 400 7%US$1.5 billion to US$ 5.5 billion $1,130
S&P SmallCap 600 3%US$300 million to US$ 2 billion $526
S&P 1500 Composite 85% $14,524
March 31, 2008Percent of US equity market (est.) Market Capitalization Total Market Cap - $ Bil
S&P 500 75% Minimum US$ 5 billion $11,510
S&P MidCap 400 7%US$1.5 billion to US$ 5.5 billion $1,021
S&P SmallCap 600 3%US$300 million to US$ 2 billion $480
S&P 1500 Composite 85% $13,011
Standard & Poor's Indexes
Standard & Poor's Indexes
Stock Index Futures Spread Trading
www.cmegroup.com 25
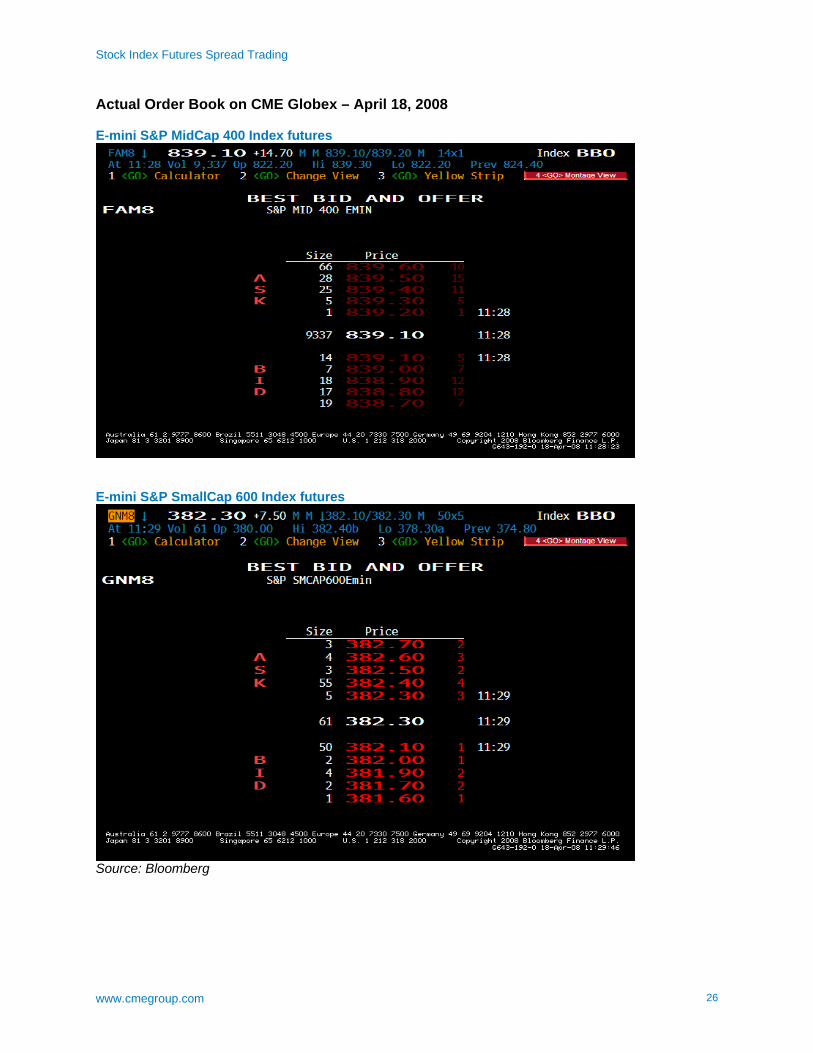
CME Group E-mini S&P MidCap 400 & E-mini S&P SmallCap 600 Index Futures Through December 31, 2008: Fee Waivers for S&P MidCap 400 and S&P SmallCap 600 Products Take advantage of waived CME Globex and CME Clearing fees for all S&P MidCap 400 and S&P SmallCap 600 products. This includes both standard-sized and E-mini contracts. Volume and Liquidity E-mini S&P MidCap 400 Index Futures - Average Daily Volume 2006 22,025 2007 29,296 2008 Q1 34,807 E-mini S&P 600 SmallCap index futures - Average Daily Volume (launched in August 2008). 2007 Q4 255 2008 Q1 348 The snapshots on the following page show the actual order books for the E-mini S&P MidCap 400 and E-mini S&P SmallCap 600 index futures contracts. The actual order books provide a better representation of market liquidity than the average daily volumes stated above. These contracts have dedicated liquidity providers actively making two-sided markets throughout the U.S. trading day
Stock Index Futures Spread Trading
www.cmegroup.com 26
Actual Order Book on CME Globex – April 18, 2008 E-mini S&P MidCap 400 Index futures
E-mini S&P SmallCap 600 Index futures
Source: Bloomberg
Stock Index Futures Spread Trading
www.cmegroup.com 27
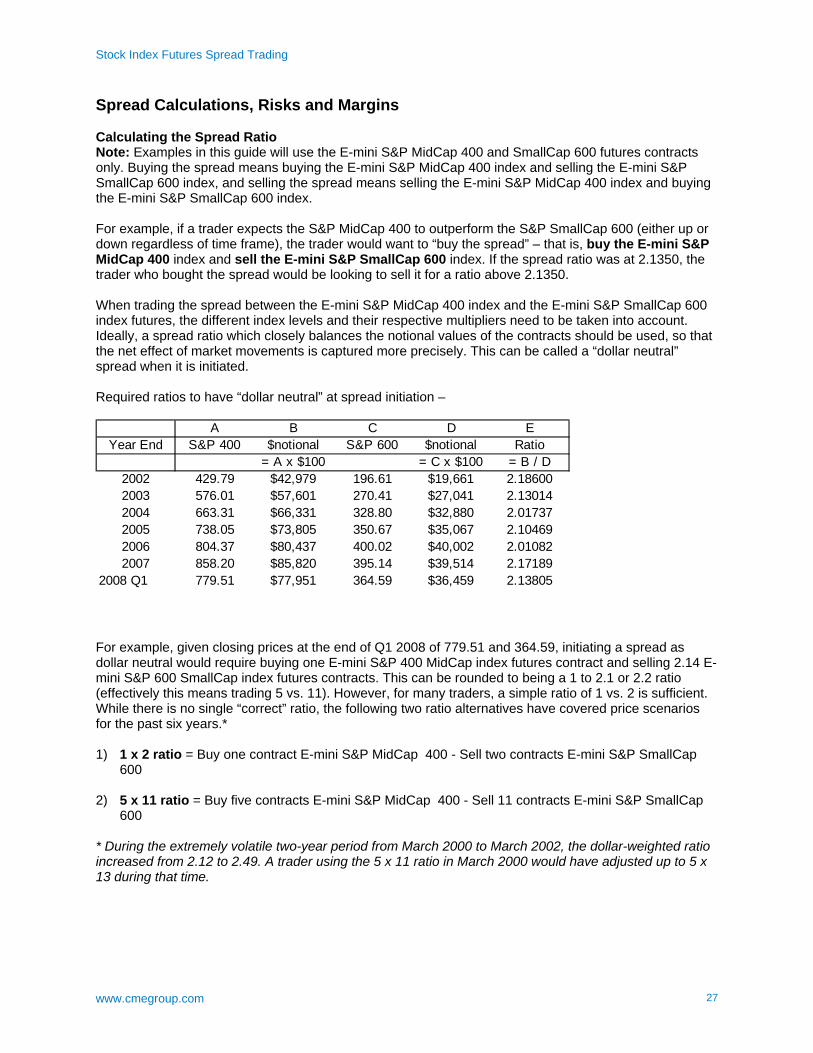
Spread Calculations, Risks and Margins Calculating the Spread Ratio Note: Examples in this guide will use the E-mini S&P MidCap 400 and SmallCap 600 futures contracts only. Buying the spread means buying the E-mini S&P MidCap 400 index and selling the E-mini S&P SmallCap 600 index, and selling the spread means selling the E-mini S&P MidCap 400 index and buying the E-mini S&P SmallCap 600 index. For example, if a trader expects the S&P MidCap 400 to outperform the S&P SmallCap 600 (either up or down regardless of time frame), the trader would want to “buy the spread” – that is, buy the E-mini S&P MidCap 400 index and sell the E-mini S&P SmallCap 600 index. If the spread ratio was at 2.1350, the trader who bought the spread would be looking to sell it for a ratio above 2.1350. When trading the spread between the E-mini S&P MidCap 400 index and the E-mini S&P SmallCap 600 index futures, the different index levels and their respective multipliers need to be taken into account. Ideally, a spread ratio which closely balances the notional values of the contracts should be used, so that the net effect of market movements is captured more precisely. This can be called a “dollar neutral” spread when it is initiated. Required ratios to have “dollar neutral” at spread initiation –
A B C D EYear End S&P 400 $notional S&P 600 $notional Ratio
= A x $100 = C x $100 = B / D2002 429.79 $42,979 196.61 $19,661 2.186002003 576.01 $57,601 270.41 $27,041 2.130142004 663.31 $66,331 328.80 $32,880 2.017372005 738.05 $73,805 350.67 $35,067 2.104692006 804.37 $80,437 400.02 $40,002 2.010822007 858.20 $85,820 395.14 $39,514 2.17189
2008 Q1 779.51 $77,951 364.59 $36,459 2.13805
For example, given closing prices at the end of Q1 2008 of 779.51 and 364.59, initiating a spread as dollar neutral would require buying one E-mini S&P 400 MidCap index futures contract and selling 2.14 E-mini S&P 600 SmallCap index futures contracts. This can be rounded to being a 1 to 2.1 or 2.2 ratio (effectively this means trading 5 vs. 11). However, for many traders, a simple ratio of 1 vs. 2 is sufficient. While there is no single “correct” ratio, the following two ratio alternatives have covered price scenarios for the past six years.* 1) 1 x 2 ratio = Buy one contract E-mini S&P MidCap 400 - Sell two contracts E-mini S&P SmallCap
600 2) 5 x 11 ratio = Buy five contracts E-mini S&P MidCap 400 - Sell 11 contracts E-mini S&P SmallCap
600 * During the extremely volatile two-year period from March 2000 to March 2002, the dollar-weighted ratio increased from 2.12 to 2.49. A trader using the 5 x 11 ratio in March 2000 would have adjusted up to 5 x 13 during that time.
Stock Index Futures Spread Trading
www.cmegroup.com 28
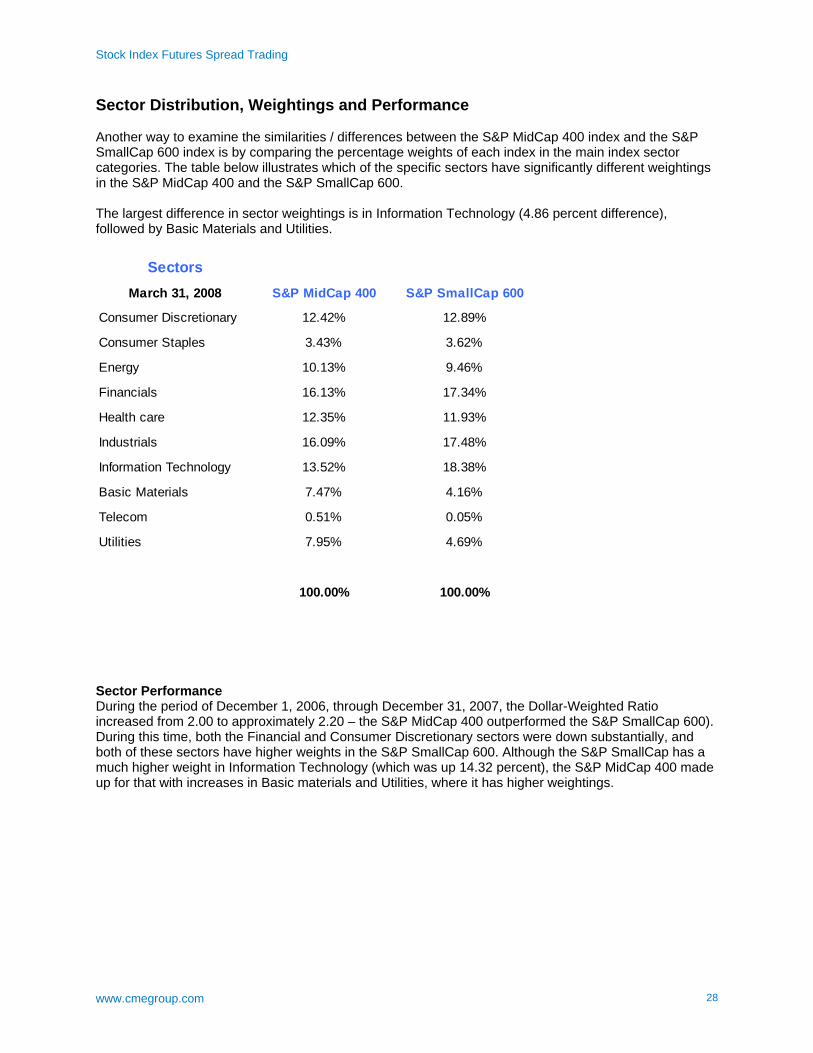
Sector Distribution, Weightings and Performance Another way to examine the similarities / differences between the S&P MidCap 400 index and the S&P SmallCap 600 index is by comparing the percentage weights of each index in the main index sector categories. The table below illustrates which of the specific sectors have significantly different weightings in the S&P MidCap 400 and the S&P SmallCap 600. The largest difference in sector weightings is in Information Technology (4.86 percent difference), followed by Basic Materials and Utilities.
SectorsMarch 31, 2008 S&P MidCap 400 S&P SmallCap 600
Consumer Discretionary 12.42% 12.89%
Consumer Staples 3.43% 3.62%
Energy 10.13% 9.46%
Financials 16.13% 17.34%
Health care 12.35% 11.93%
Industrials 16.09% 17.48%
Information Technology 13.52% 18.38%
Basic Materials 7.47% 4.16%
Telecom 0.51% 0.05%
Utilities 7.95% 4.69%
100.00% 100.00%
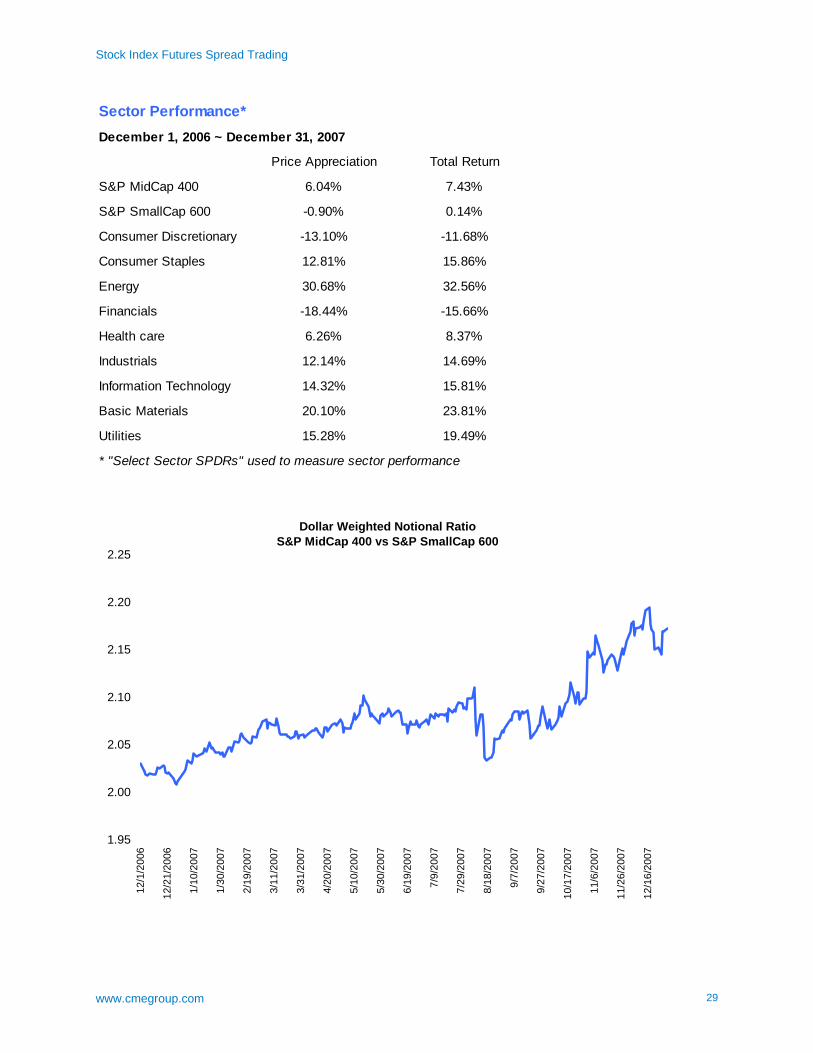
Sector Performance During the period of December 1, 2006, through December 31, 2007, the Dollar-Weighted Ratio increased from 2.00 to approximately 2.20 – the S&P MidCap 400 outperformed the S&P SmallCap 600). During this time, both the Financial and Consumer Discretionary sectors were down substantially, and both of these sectors have higher weights in the S&P SmallCap 600. Although the S&P SmallCap has a much higher weight in Information Technology (which was up 14.32 percent), the S&P MidCap 400 made up for that with increases in Basic materials and Utilities, where it has higher weightings.
Stock Index Futures Spread Trading
www.cmegroup.com 29
Sector Performance*December 1, 2006 ~ December 31, 2007
Price Appreciation Total Return
S&P MidCap 400 6.04% 7.43%
S&P SmallCap 600 -0.90% 0.14%
Consumer Discretionary -13.10% -11.68%
Consumer Staples 12.81% 15.86%
Energy 30.68% 32.56%
Financials -18.44% -15.66%
Health care 6.26% 8.37%
Industrials 12.14% 14.69%
Information Technology 14.32% 15.81%
Basic Materials 20.10% 23.81%
Utilities 15.28% 19.49%
* "Select Sector SPDRs" used to measure sector performance
Dollar Weighted Notional Ratio S&P MidCap 400 vs S&P SmallCap 600
1.95
2.00
2.05
2.10
2.15
2.20
2.25
12/1
/200
6
12/2
1/20
06
1/10
/200
7
1/30
/200
7
2/19
/200
7
3/11
/200
7
3/31
/200
7
4/20
/200
7
5/10
/200
7
5/30
/200
7
6/19
/200
7
7/9/
2007
7/29
/200
7
8/18
/200
7
9/7/
2007
9/27
/200
7
10/1
7/20
07
11/6
/200
7
11/2
6/20
07
12/1
6/20
07
Stock Index Futures Spread Trading
www.cmegroup.com 30
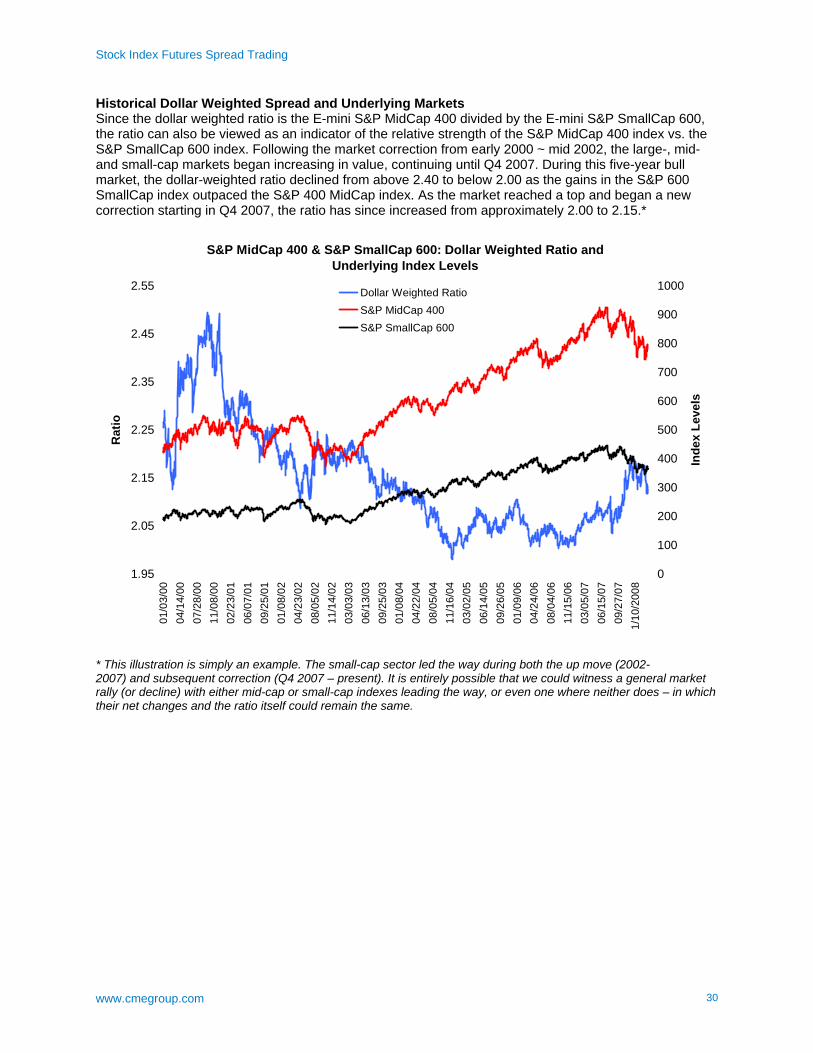
Historical Dollar Weighted Spread and Underlying Markets Since the dollar weighted ratio is the E-mini S&P MidCap 400 divided by the E-mini S&P SmallCap 600, the ratio can also be viewed as an indicator of the relative strength of the S&P MidCap 400 index vs. the S&P SmallCap 600 index. Following the market correction from early 2000 ~ mid 2002, the large-, mid- and small-cap markets began increasing in value, continuing until Q4 2007. During this five-year bull market, the dollar-weighted ratio declined from above 2.40 to below 2.00 as the gains in the S&P 600 SmallCap index outpaced the S&P 400 MidCap index. As the market reached a top and began a new correction starting in Q4 2007, the ratio has since increased from approximately 2.00 to 2.15.*
S&P MidCap 400 & S&P SmallCap 600: Dollar Weighted Ratio and Underlying Index Levels
1.95
2.05
2.15
2.25
2.35
2.45
2.55
01/0
3/00
04/1
4/00
07/2
8/00
11/0
8/00
02/2
3/01
06/0
7/01
09/2
5/01
01/0
8/02
04/2
3/02
08/0
5/02
11/1
4/02
03/0
3/03
06/1
3/03
09/2
5/03
01/0
8/04
04/2
2/04
08/0
5/04
11/1
6/04
03/0
2/05
06/1
4/05
09/2
6/05
01/0
9/06
04/2
4/06
08/0
4/06
11/1
5/06
03/0
5/07
06/1
5/07
09/2
7/07
1/10
/200
8
Rat
io
0
100
200
300
400
500
600
700
800
900
1000
Inde
x Le
vels
Dollar Weighted RatioS&P MidCap 400S&P SmallCap 600
* This illustration is simply an example. The small-cap sector led the way during both the up move (2002- 2007) and subsequent correction (Q4 2007 – present). It is entirely possible that we could witness a general market rally (or decline) with either mid-cap or small-cap indexes leading the way, or even one where neither does – in which their net changes and the ratio itself could remain the same.
Stock Index Futures Spread Trading
www.cmegroup.com 31
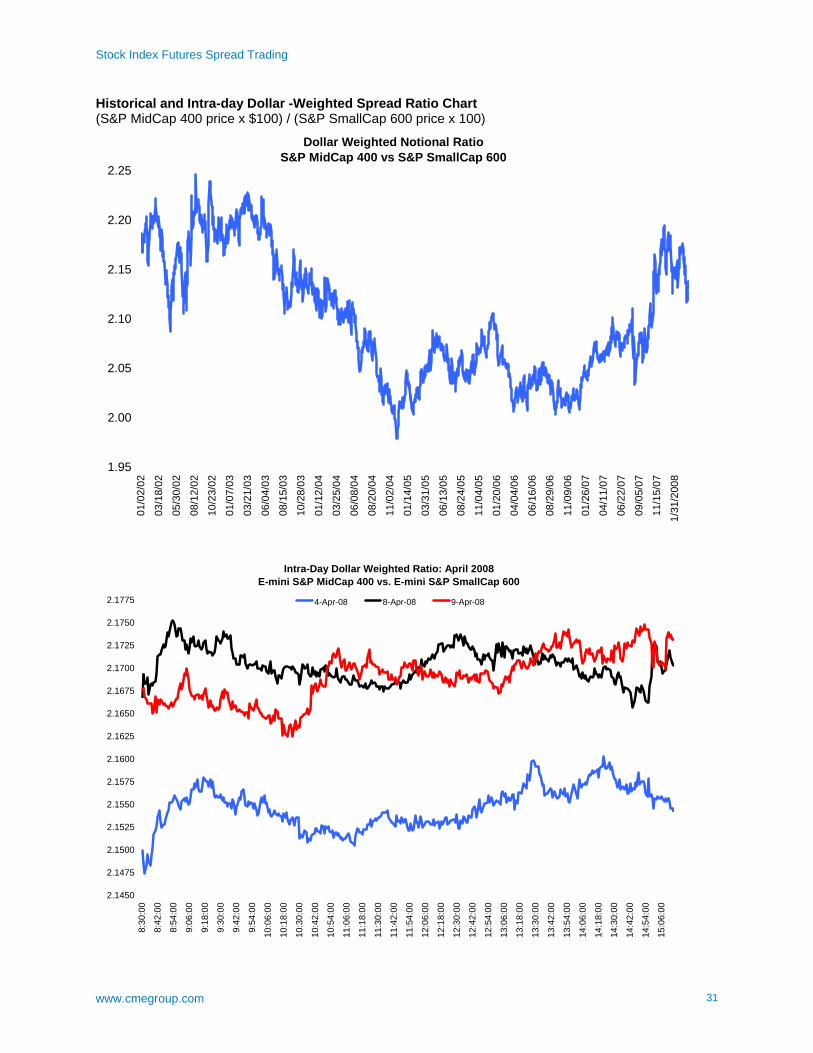
Historical and Intra-day Dollar -Weighted Spread Ratio Chart (S&P MidCap 400 price x $100) / (S&P SmallCap 600 price x 100)
Dollar Weighted Notional Ratio S&P MidCap 400 vs S&P SmallCap 600
1.95
2.00
2.05
2.10
2.15
2.20
2.25
01/0
2/02
03/1
8/02
05/3
0/02
08/1
2/02
10/2
3/02
01/0
7/03
03/2
1/03
06/0
4/03
08/1
5/03
10/2
8/03
01/1
2/04
03/2
5/04
06/0
8/04
08/2
0/04
11/0
2/04
01/1
4/05
03/3
1/05
06/1
3/05
08/2
4/05
11/0
4/05
01/2
0/06
04/0
4/06
06/1
6/06
08/2
9/06
11/0
9/06
01/2
6/07
04/1
1/07
06/2
2/07
09/0
5/07
11/1
5/07
1/31
/200
8
Intra-Day Dollar Weighted Ratio: April 2008 E-mini S&P MidCap 400 vs. E-mini S&P SmallCap 600
2.1450
2.1475
2.1500
2.1525
2.1550
2.1575
2.1600
2.1625
2.1650
2.1675
2.1700
2.1725
2.1750
2.1775
8:30
:00
8:42
:00
8:54
:00
9:06
:00
9:18
:00
9:30
:00
9:42
:00
9:54
:00
10:0
6:00
10:1
8:00
10:3
0:00
10:4
2:00
10:5
4:00
11:0
6:00
11:1
8:00
11:3
0:00
11:4
2:00
11:5
4:00
12:0
6:00
12:1
8:00
12:3
0:00
12:4
2:00
12:5
4:00
13:0
6:00
13:1
8:00
13:3
0:00
13:4
2:00
13:5
4:00
14:0
6:00
14:1
8:00
14:3
0:00
14:4
2:00
14:5
4:00
15:0
6:00
4-Apr-08 8-Apr-08 9-Apr-08
Stock Index Futures Spread Trading
www.cmegroup.com 32
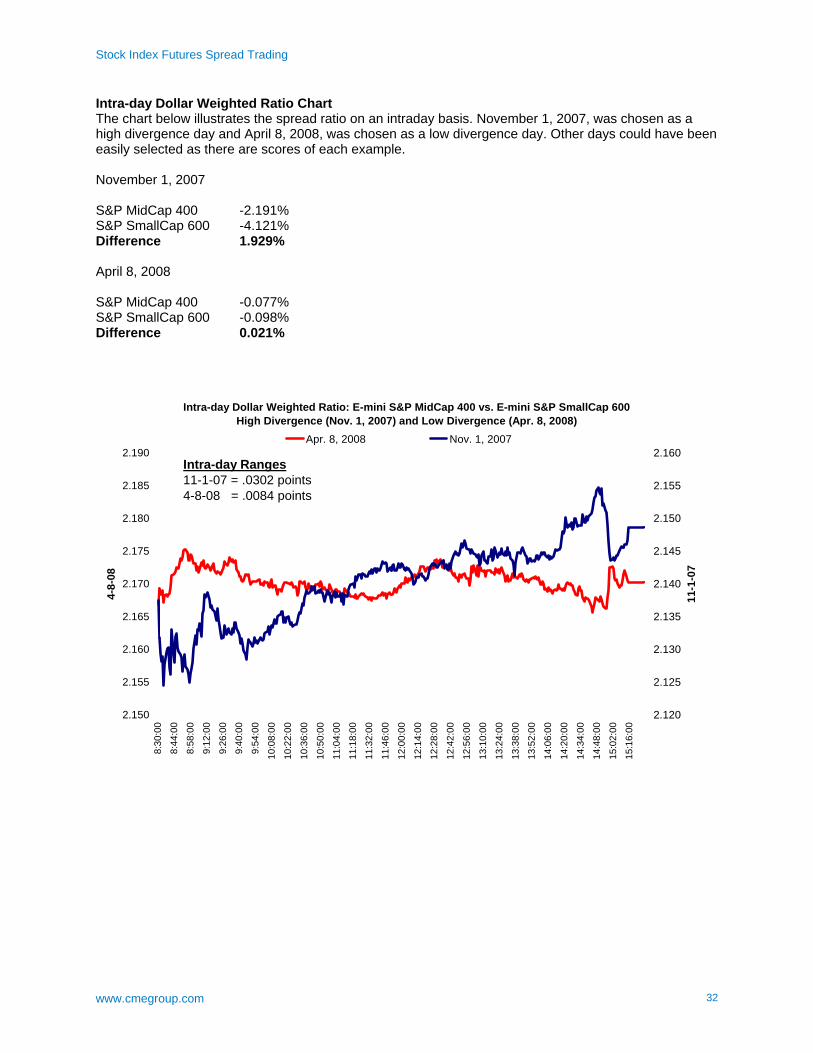
Intra-day Dollar Weighted Ratio Chart The chart below illustrates the spread ratio on an intraday basis. November 1, 2007, was chosen as a high divergence day and April 8, 2008, was chosen as a low divergence day. Other days could have been easily selected as there are scores of each example. November 1, 2007 S&P MidCap 400 -2.191% S&P SmallCap 600 -4.121% Difference 1.929% April 8, 2008 S&P MidCap 400 -0.077% S&P SmallCap 600 -0.098% Difference 0.021%
Intra-day Dollar Weighted Ratio: E-mini S&P MidCap 400 vs. E-mini S&P SmallCap 600High Divergence (Nov. 1, 2007) and Low Divergence (Apr. 8, 2008)
2.150
2.155
2.160
2.165
2.170
2.175
2.180
2.185
2.190
8:30
:00
8:44
:00
8:58
:00
9:12
:00
9:26
:00
9:40
:00
9:54
:00
10:0
8:00
10:2
2:00
10:3
6:00
10:5
0:00
11:0
4:00
11:1
8:00
11:3
2:00
11:4
6:00
12:0
0:00
12:1
4:00
12:2
8:00
12:4
2:00
12:5
6:00
13:1
0:00
13:2
4:00
13:3
8:00
13:5
2:00
14:0
6:00
14:2
0:00
14:3
4:00
14:4
8:00
15:0
2:00
15:1
6:00
4-8-
08
2.120
2.125
2.130
2.135
2.140
2.145
2.150
2.155
2.160
11-1
-07
Apr. 8, 2008 Nov. 1, 2007
Intra-day Ranges11-1-07 = .0302 points4-8-08 = .0084 points
Stock Index Futures Spread Trading
www.cmegroup.com 33
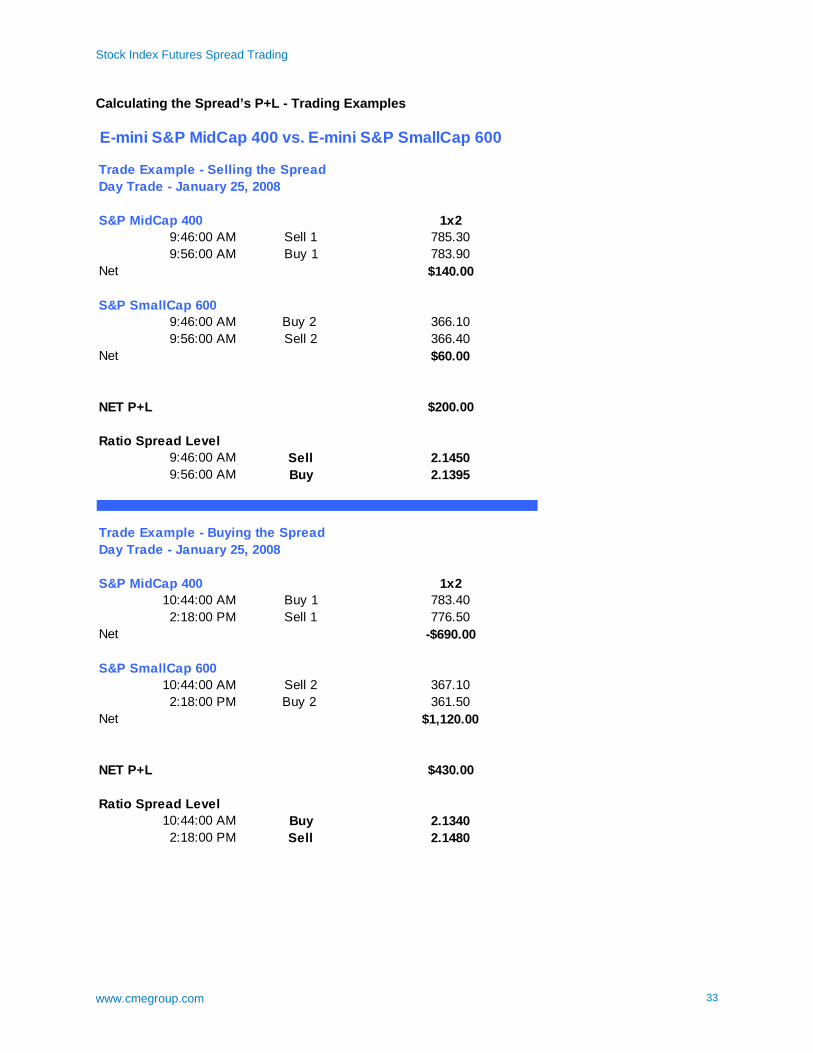
Calculating the Spread’s P+L - Trading Examples E-mini S&P MidCap 400 vs. E-mini S&P SmallCap 600
Trade Example - Selling the SpreadDay Trade - January 25, 2008
S&P MidCap 400 1x29:46:00 AM Sell 1 785.309:56:00 AM Buy 1 783.90
Net $140.00
S&P SmallCap 6009:46:00 AM Buy 2 366.109:56:00 AM Sell 2 366.40
Net $60.00
NET P+L $200.00
Ratio Spread Level9:46:00 AM Sell 2.14509:56:00 AM Buy 2.1395
Trade Example - Buying the SpreadDay Trade - January 25, 2008
S&P MidCap 400 1x210:44:00 AM Buy 1 783.402:18:00 PM Sell 1 776.50
Net -$690.00
S&P SmallCap 60010:44:00 AM Sell 2 367.102:18:00 PM Buy 2 361.50
Net $1,120.00
NET P+L $430.00
Ratio Spread Level10:44:00 AM Buy 2.13402:18:00 PM Sell 2.1480
Stock Index Futures Spread Trading
www.cmegroup.com 34
Spread Margin Requirements Initial margin requirements for U.S. stock index futures have often been in the range of 5 - 7 percent of the underlying notional value of the contract. Margin requirements can and will be increased if market conditions warrant such a decision. CME Clearing offers “spread credits” for spread trades between similar products. These spread credits can have a dramatic impact on the initial margin requirements for highly correlated spread such as the S&P MidCap 400 vs. the S&P SmallCap 600. Currently, CME Group offers a spread credit rate of 80 percent for the S&P MidCap 400 vs. the S&P SmallCap 600 spread. That means that the margins for a spread would only be 20 percent of the normal outright initial margins. The spread credit for the E-mini S&P MidCap 400 vs. the E-mini S&P SmallCap 600 applies a standard spread ratio of 1:2 (one contract of E-mini S&P MIdCap 400 vs. two contracts of E-mini S&P Small Cap 600). Fractional Spreads CME Clearing will calculate spread credits based on whole and fractional spreads. For example, the standard ratio for margin purposes is 1:2 (one contract of E-mini S&P MidCap 400 vs. two contracts of E-mini S&P SmallCap 600). So, spread quantities based exactly on the 1:2 ratio (i.e., 2 x 4, 10 x 20 and so on) will enjoy the full 80 percent spread credit. Spread ratios that are not exactly on a 1:2 ratio will receive spread credits at an effective rate of less than 80 percent, as all of the spread that qualifies for the 1:2 rate will be margined at the 80 percent credit, while the remaining fractional quantities will be margined at a combination of the 80 percent credit rate and the normal outright margin rate.
Stock Index Futures Spread Trading
www.cmegroup.com 35
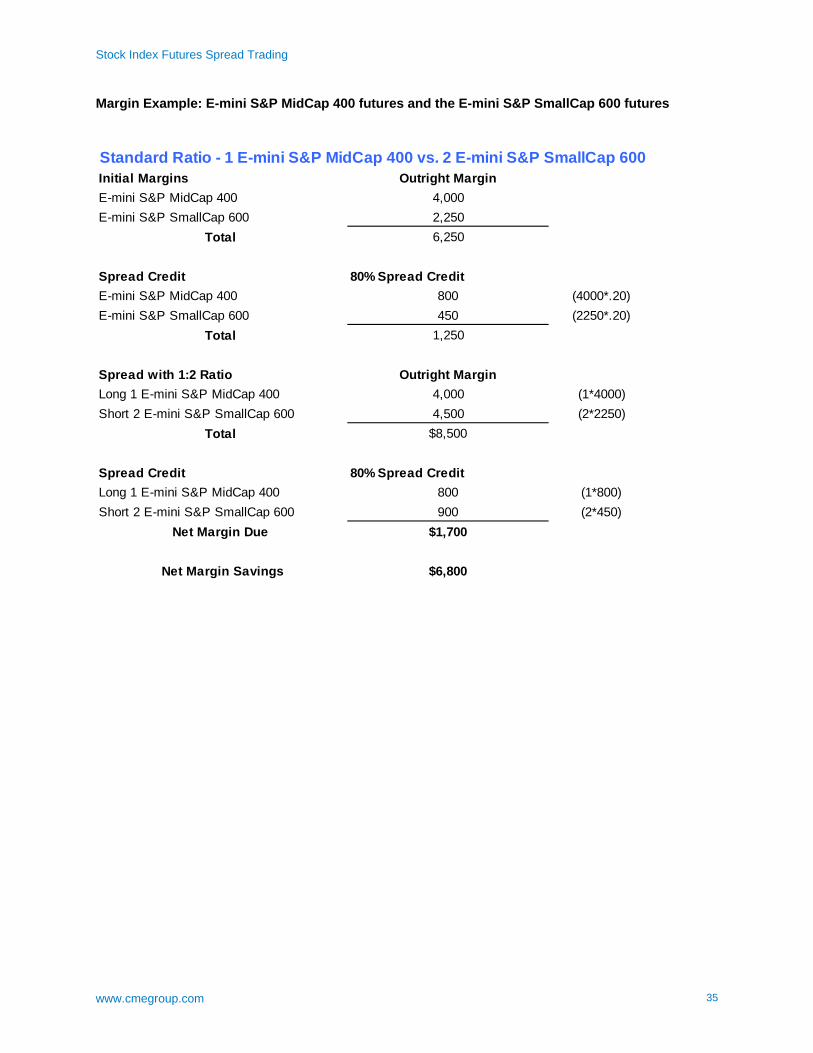
Margin Example: E-mini S&P MidCap 400 futures and the E-mini S&P SmallCap 600 futures
Standard Ratio - 1 E-mini S&P MidCap 400 vs. 2 E-mini S&P SmallCap 600Initial Margins Outright MarginE-mini S&P MidCap 400 4,000E-mini S&P SmallCap 600 2,250
Total 6,250
Spread Credit 80% Spread CreditE-mini S&P MidCap 400 800 (4000*.20)E-mini S&P SmallCap 600 450 (2250*.20)
Total 1,250
Spread with 1:2 Ratio Outright MarginLong 1 E-mini S&P MidCap 400 4,000 (1*4000)Short 2 E-mini S&P SmallCap 600 4,500 (2*2250)
Total $8,500
Spread Credit 80% Spread CreditLong 1 E-mini S&P MidCap 400 800 (1*800)Short 2 E-mini S&P SmallCap 600 900 (2*450)
Net Margin Due $1,700
Net Margin Savings $6,800
Stock Index Futures Spread Trading
www.cmegroup.com 36
Index Correlations 20 Day Rolling Correlation of Percent Price Changes
80.00%
82.00%
84.00%
86.00%
88.00%
90.00%
92.00%
94.00%
96.00%
98.00%
100.00%3/
31/2
005
5/31
/200
5
7/31
/200
5
9/30
/200
5
11/3
0/20
05
1/31
/200
6
3/31
/200
6
5/31
/200
6
7/31
/200
6
9/30
/200
6
11/3
0/20
06
1/31
/200
7
3/31
/200
7
5/31
/200
7
7/31
/200
7
9/30
/200
7
11/3
0/20
07
1/31
/200
8
3/31
/200
8
S&P MidCap 400 vs. S&P SmallCap 600
20 Day Rolling Correlation of Percent Price Changes
75.00%
80.00%
85.00%
90.00%
95.00%
100.00%
01/1
0/02
03/2
5/02
06/0
5/02
08/1
5/02
10/2
5/02
01/0
8/03
03/2
1/03
06/0
3/03
08/1
3/03
10/2
3/03
01/0
6/04
03/1
8/04
05/2
8/04
08/1
1/04
10/2
1/04
01/0
3/05
03/1
6/05
05/2
6/05
08/0
8/05
10/1
8/05
12/2
9/05
03/1
4/06
05/2
4/06
08/0
4/06
10/1
6/06
12/2
7/06
03/1
3/07
05/2
3/07
08/0
3/07
10/1
5/07
12/2
6/07
3/10
/200
8
S&P MidCap 400 vs. S&P SmallCap 600
Stock Index Futures Spread Trading
www.cmegroup.com 37
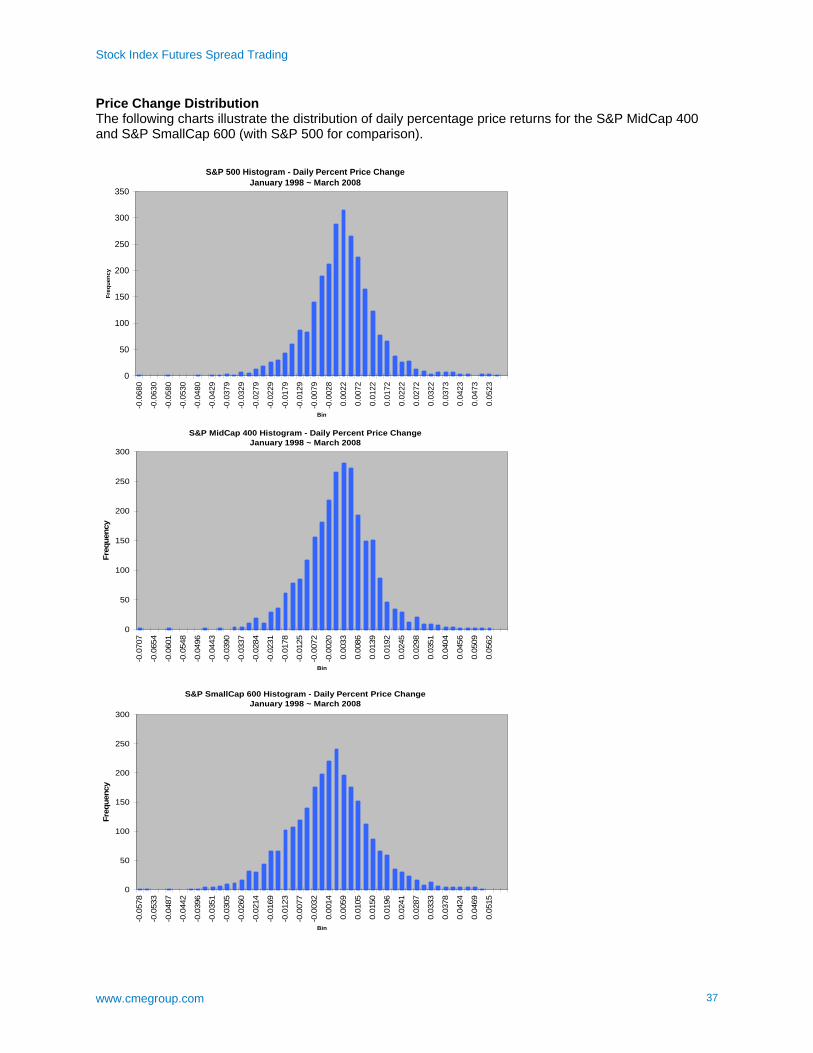
Price Change Distribution The following charts illustrate the distribution of daily percentage price returns for the S&P MidCap 400 and S&P SmallCap 600 (with S&P 500 for comparison).
S&P 500 Histogram - Daily Percent Price ChangeJanuary 1998 ~ March 2008
0
50
100
150
200
250
300
350
-0.0
680
-0.0
630
-0.0
580
-0.0
530
-0.0
480
-0.0
429
-0.0
379
-0.0
329
-0.0
279
-0.0
229
-0.0
179
-0.0
129
-0.0
079
-0.0
028
0.00
22
0.00
72
0.01
22
0.01
72
0.02
22
0.02
72
0.03
22
0.03
73
0.04
23
0.04
73
0.05
23
Bin
Freq
uenc
y
S&P MidCap 400 Histogram - Daily Percent Price Change
January 1998 ~ March 2008
0
50
100
150
200
250
300
-0.0
707
-0.0
654
-0.0
601
-0.0
548
-0.0
496
-0.0
443
-0.0
390
-0.0
337
-0.0
284
-0.0
231
-0.0
178
-0.0
125
-0.0
072
-0.0
020
0.00
33
0.00
86
0.01
39
0.01
92
0.02
45
0.02
98
0.03
51
0.04
04
0.04
56
0.05
09
0.05
62
Bin
Freq
uenc
y
S&P SmallCap 600 Histogram - Daily Percent Price Change
January 1998 ~ March 2008
0
50
100
150
200
250
300
-0.0
578
-0.0
533
-0.0
487
-0.0
442
-0.0
396
-0.0
351
-0.0
305
-0.0
260
-0.0
214
-0.0
169
-0.0
123
-0.0
077
-0.0
032
0.00
14
0.00
59
0.01
05
0.01
50
0.01
96
0.02
41
0.02
87
0.03
33
0.03
78
0.04
24
0.04
69
0.05
15
Bin
Freq
uenc
y
Stock Index Futures Spread Trading
www.cmegroup.com 38
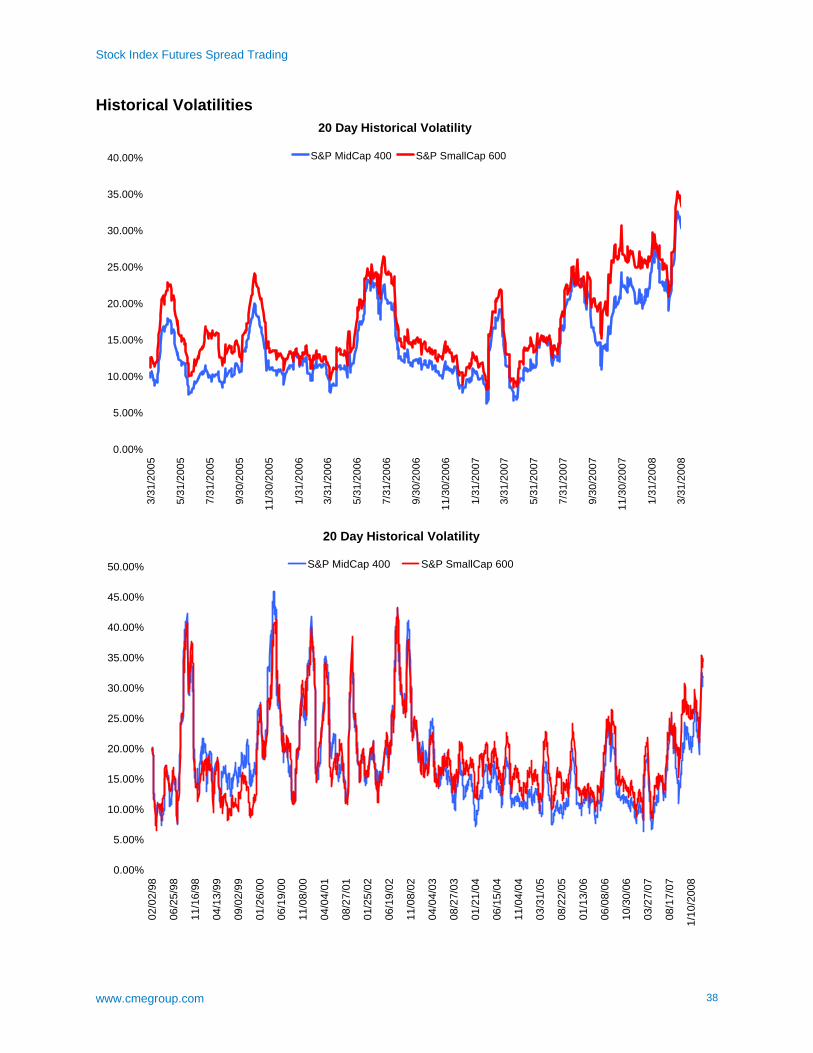
Historical Volatilities 20 Day Historical Volatility
0.00%
5.00%
10.00%
15.00%
20.00%
25.00%
30.00%
35.00%
40.00%3/
31/2
005
5/31
/200
5
7/31
/200
5
9/30
/200
5
11/3
0/20
05
1/31
/200
6
3/31
/200
6
5/31
/200
6
7/31
/200
6
9/30
/200
6
11/3
0/20
06
1/31
/200
7
3/31
/200
7
5/31
/200
7
7/31
/200
7
9/30
/200
7
11/3
0/20
07
1/31
/200
8
3/31
/200
8
S&P MidCap 400 S&P SmallCap 600
20 Day Historical Volatility
0.00%
5.00%
10.00%
15.00%
20.00%
25.00%
30.00%
35.00%
40.00%
45.00%
50.00%
02/0
2/98
06/2
5/98
11/1
6/98
04/1
3/99
09/0
2/99
01/2
6/00
06/1
9/00
11/0
8/00
04/0
4/01
08/2
7/01
01/2
5/02
06/1
9/02
11/0
8/02
04/0
4/03
08/2
7/03
01/2
1/04
06/1
5/04
11/0
4/04
03/3
1/05
08/2
2/05
01/1
3/06
06/0
8/06
10/3
0/06
03/2
7/07
08/1
7/07
1/10
/200
8
S&P MidCap 400 S&P SmallCap 600
Stock Index Futures Spread Trading
www.cmegroup.com 39
Appendix Contract Specifications Average Daily Volumes Liquidity and Hourly Analysis Index Calculations Stock Index Futures Fair Values Equity Price Limit Guide
Stock Index Futures Spread Trading
www.cmegroup.com 40
Contract Specifications
Trade Unit Trade Unit
Contract Listing Contract Listing
Product Code Product Code
Hours Hours
Limits Limits
Regular 0.25=$12.50 Regular 1=$5.00
Calendar Spread
0.05=$2.50 Calendar Spread
1=$5.00
Trade Unit Trade Unit
Contract Listing Contract Listing
Product Code Product Code
Hours Hours
Limits Limits
Regular 0.10=$10.00 Regular 0.10=$10.00 Calendar Spread
0.05=$5.00 Calendar Spread
0.10=$10.00
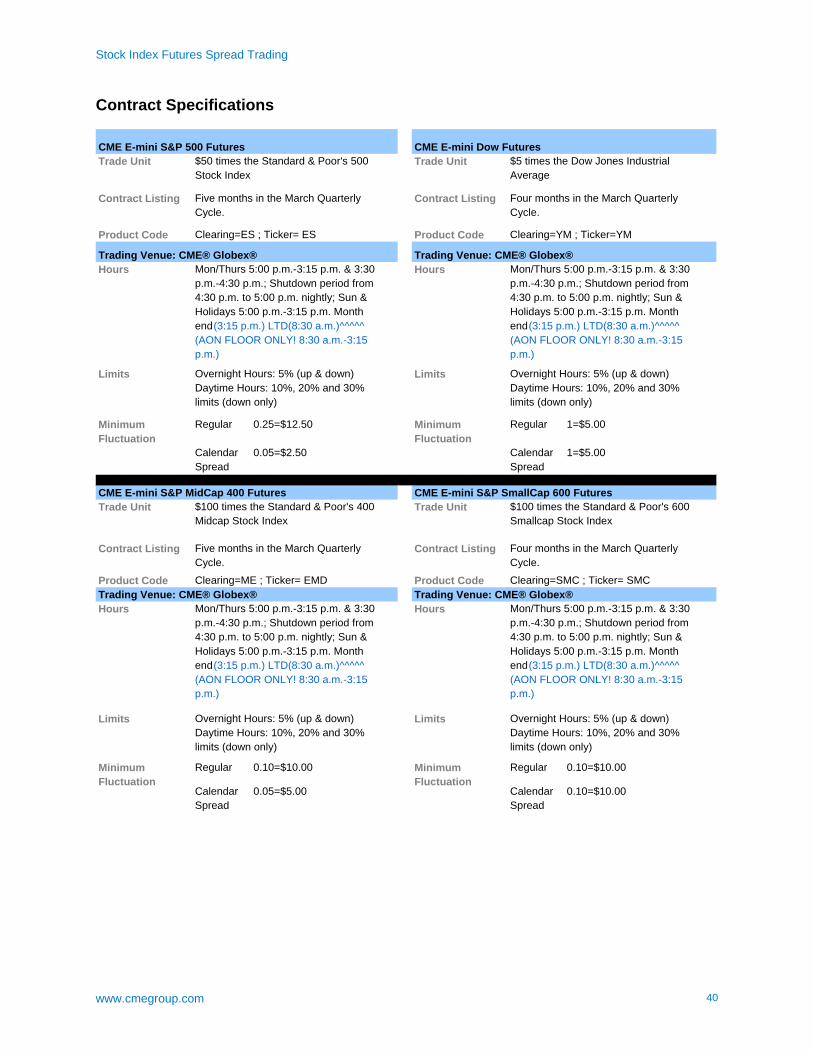
CME E-mini S&P 500 Futures CME E-mini Dow Futures$50 times the Standard & Poor's 500 Stock Index
$5 times the Dow Jones Industrial Average
Five months in the March Quarterly Cycle.
Four months in the March Quarterly Cycle.
Clearing=ES ; Ticker= ES Clearing=YM ; Ticker=YM Trading Venue: CME® Globex® Trading Venue: CME® Globex®
Mon/Thurs 5:00 p.m.-3:15 p.m. & 3:30p.m.-4:30 p.m.; Shutdown period from4:30 p.m. to 5:00 p.m. nightly; Sun &Holidays 5:00 p.m.-3:15 p.m. Monthend(3:15 p.m.) LTD(8:30 a.m.)^^^^^ (AON FLOOR ONLY! 8:30 a.m.-3:15 p.m.)
Mon/Thurs 5:00 p.m.-3:15 p.m. & 3:30 p.m.-4:30 p.m.; Shutdown period from 4:30 p.m. to 5:00 p.m. nightly; Sun & Holidays 5:00 p.m.-3:15 p.m. Month end(3:15 p.m.) LTD(8:30 a.m.)^^^^^ (AON FLOOR ONLY! 8:30 a.m.-3:15 p.m.)
Overnight Hours: 5% (up & down) Daytime Hours: 10%, 20% and 30% limits (down only)
Overnight Hours: 5% (up & down) Daytime Hours: 10%, 20% and 30% limits (down only)
Minimum Fluctuation
Minimum Fluctuation
CME E-mini S&P MidCap 400 Futures CME E-mini S&P SmallCap 600 Futures $100 times the Standard & Poor's 400Midcap Stock Index
$100 times the Standard & Poor's 600 Smallcap Stock Index
Five months in the March Quarterly Cycle.
Four months in the March Quarterly Cycle.
Clearing=ME ; Ticker= EMD Clearing=SMC ; Ticker= SMC Trading Venue: CME® Globex® Trading Venue: CME® Globex®
Mon/Thurs 5:00 p.m.-3:15 p.m. & 3:30p.m.-4:30 p.m.; Shutdown period from4:30 p.m. to 5:00 p.m. nightly; Sun &Holidays 5:00 p.m.-3:15 p.m. Monthend(3:15 p.m.) LTD(8:30 a.m.)^^^^^ (AON FLOOR ONLY! 8:30 a.m.-3:15 p.m.)
Mon/Thurs 5:00 p.m.-3:15 p.m. & 3:30 p.m.-4:30 p.m.; Shutdown period from 4:30 p.m. to 5:00 p.m. nightly; Sun & Holidays 5:00 p.m.-3:15 p.m. Month end(3:15 p.m.) LTD(8:30 a.m.)^^^^^ (AON FLOOR ONLY! 8:30 a.m.-3:15 p.m.)
Overnight Hours: 5% (up & down) Daytime Hours: 10%, 20% and 30% limits (down only)
Overnight Hours: 5% (up & down) Daytime Hours: 10%, 20% and 30% limits (down only)
Minimum Fluctuation
Minimum Fluctuation
Stock Index Futures Spread Trading
www.cmegroup.com 41
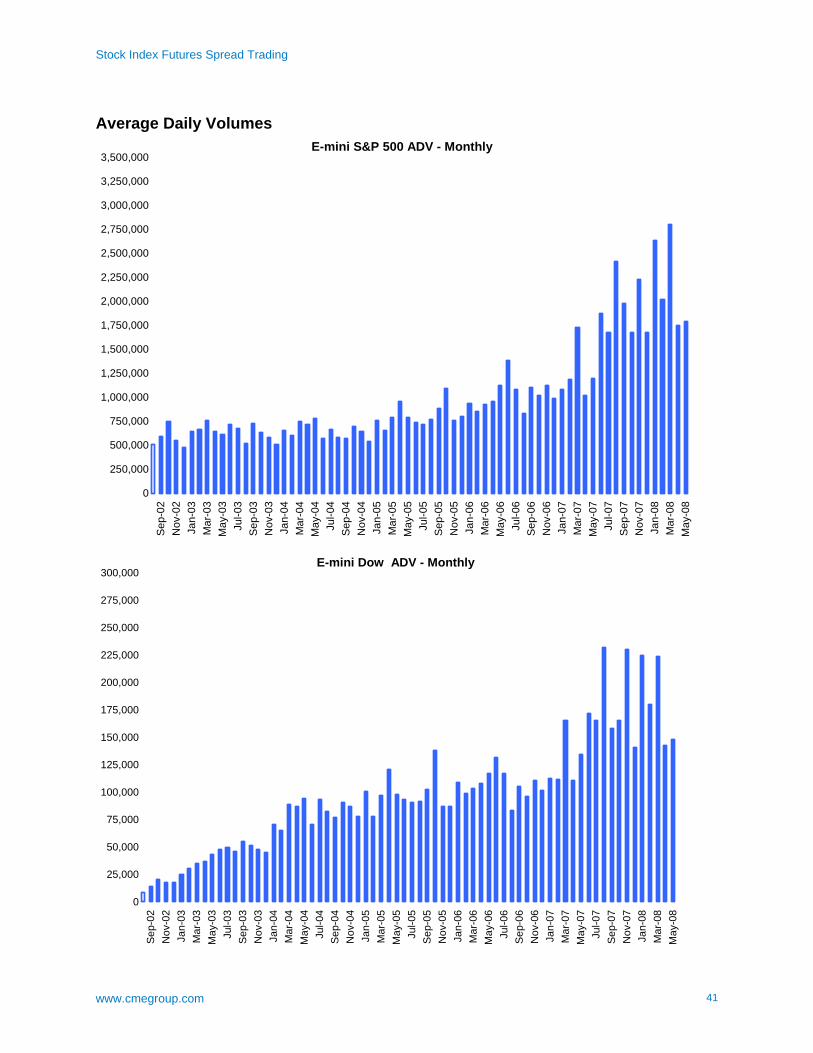
Average Daily Volumes
E-mini S&P 500 ADV - Monthly
0
250,000
500,000
750,000
1,000,000
1,250,000
1,500,000
1,750,000
2,000,000
2,250,000
2,500,000
2,750,000
3,000,000
3,250,000
3,500,000S
ep-0
2N
ov-0
2Ja
n-03
Mar
-03
May
-03
Jul-0
3S
ep-0
3N
ov-0
3Ja
n-04
Mar
-04
May
-04
Jul-0
4S
ep-0
4N
ov-0
4Ja
n-05
Mar
-05
May
-05
Jul-0
5S
ep-0
5N
ov-0
5Ja
n-06
Mar
-06
May
-06
Jul-0
6S
ep-0
6N
ov-0
6Ja
n-07
Mar
-07
May
-07
Jul-0
7S
ep-0
7N
ov-0
7Ja
n-08
Mar
-08
May
-08
E-mini Dow ADV - Monthly
0
25,000
50,000
75,000
100,000
125,000
150,000
175,000
200,000
225,000
250,000
275,000
300,000
Sep
-02
Nov
-02
Jan-
03M
ar-0
3M
ay-0
3Ju
l-03
Sep
-03
Nov
-03
Jan-
04M
ar-0
4M
ay-0
4Ju
l-04
Sep
-04
Nov
-04
Jan-
05M
ar-0
5M
ay-0
5Ju
l-05
Sep
-05
Nov
-05
Jan-
06M
ar-0
6M
ay-0
6Ju
l-06
Sep
-06
Nov
-06
Jan-
07M
ar-0
7M
ay-0
7Ju
l-07
Sep
-07
Nov
-07
Jan-
08M
ar-0
8M
ay-0
8
Stock Index Futures Spread Trading
www.cmegroup.com 42
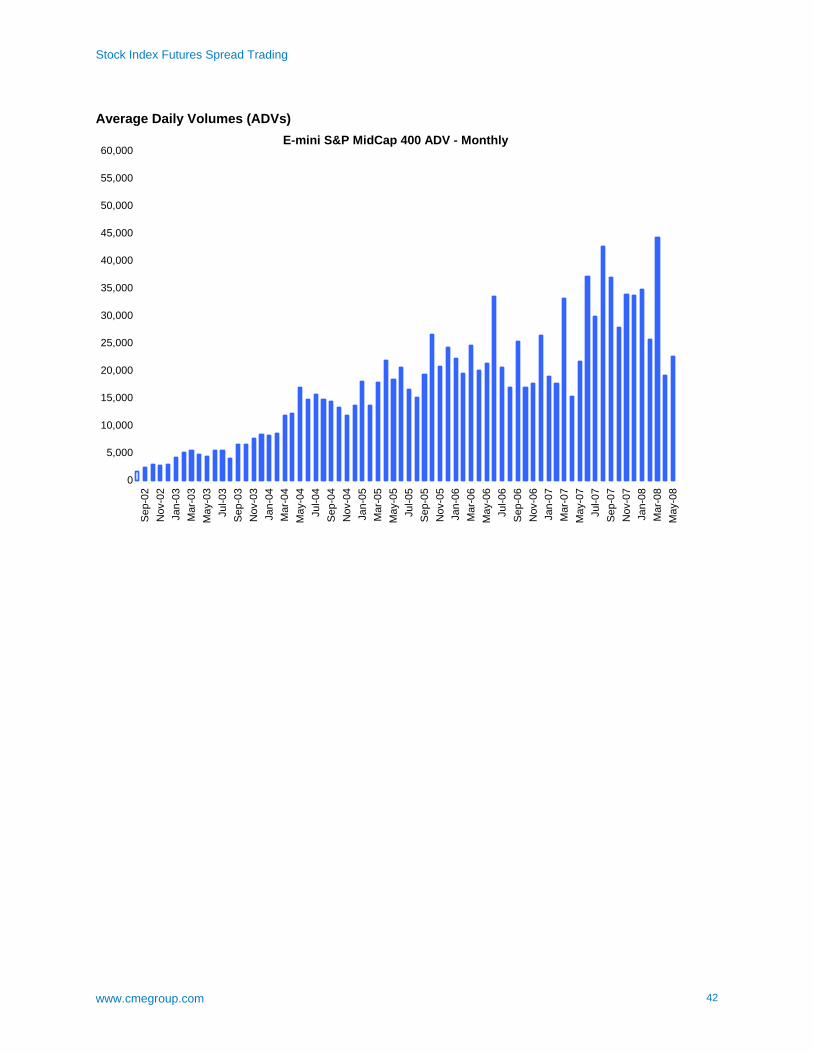
Average Daily Volumes (ADVs)
E-mini S&P MidCap 400 ADV - Monthly
0
5,000
10,000
15,000
20,000
25,000
30,000
35,000
40,000
45,000
50,000
55,000
60,000S
ep-0
2N
ov-0
2Ja
n-03
Mar
-03
May
-03
Jul-0
3S
ep-0
3N
ov-0
3Ja
n-04
Mar
-04
May
-04
Jul-0
4S
ep-0
4N
ov-0
4Ja
n-05
Mar
-05
May
-05
Jul-0
5S
ep-0
5N
ov-0
5Ja
n-06
Mar
-06
May
-06
Jul-0
6S
ep-0
6N
ov-0
6Ja
n-07
Mar
-07
May
-07
Jul-0
7S
ep-0
7N
ov-0
7Ja
n-08
Mar
-08
May
-08
Stock Index Futures Spread Trading
www.cmegroup.com 43
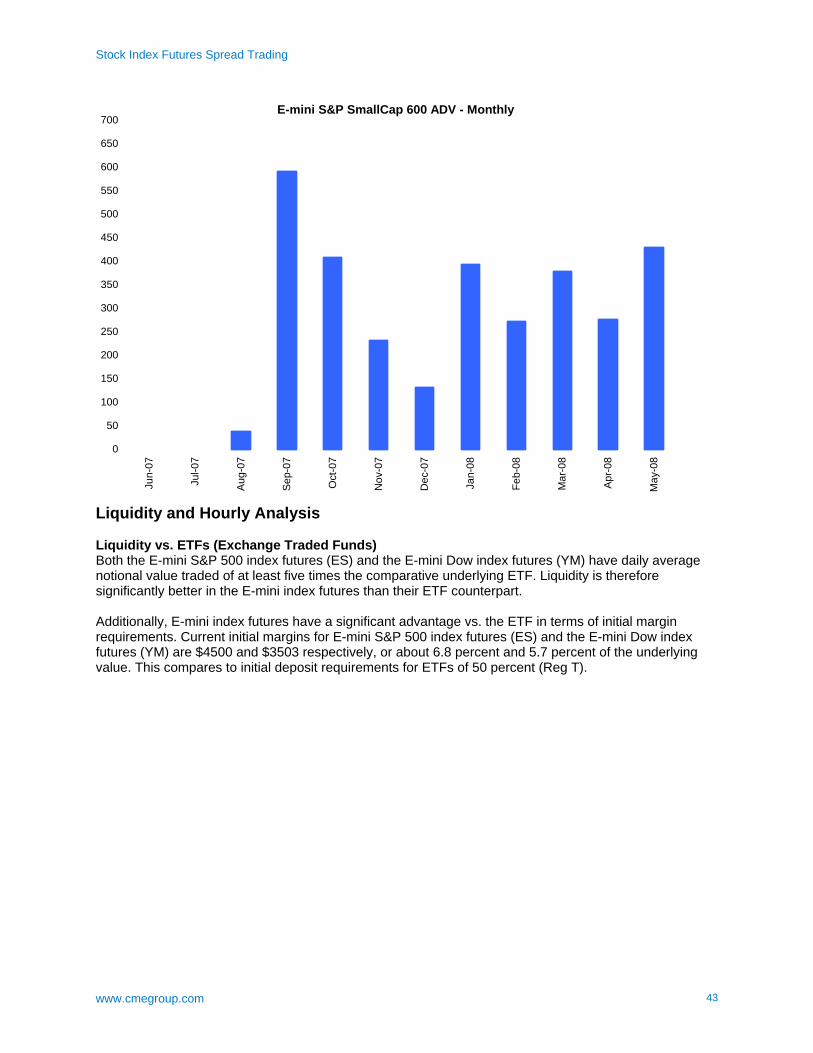
E-mini S&P SmallCap 600 ADV - Monthly
0
50
100
150
200
250
300
350
400
450
500
550
600
650
700
Jun-
07
Jul-0
7
Aug
-07
Sep
-07
Oct
-07
Nov
-07
Dec
-07
Jan-
08
Feb-
08
Mar
-08
Apr
-08
May
-08
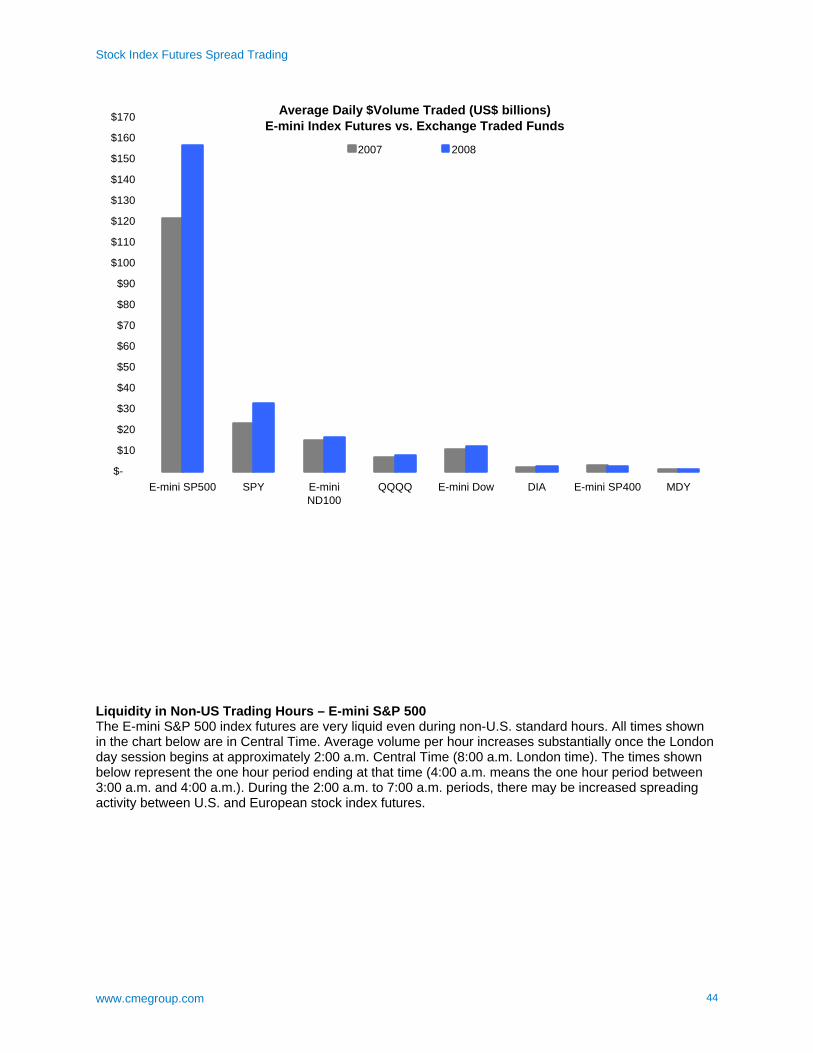
Liquidity and Hourly Analysis Liquidity vs. ETFs (Exchange Traded Funds) Both the E-mini S&P 500 index futures (ES) and the E-mini Dow index futures (YM) have daily average notional value traded of at least five times the comparative underlying ETF. Liquidity is therefore significantly better in the E-mini index futures than their ETF counterpart. Additionally, E-mini index futures have a significant advantage vs. the ETF in terms of initial margin requirements. Current initial margins for E-mini S&P 500 index futures (ES) and the E-mini Dow index futures (YM) are $4500 and $3503 respectively, or about 6.8 percent and 5.7 percent of the underlying value. This compares to initial deposit requirements for ETFs of 50 percent (Reg T).
Stock Index Futures Spread Trading
www.cmegroup.com 44
Average Daily $Volume Traded (US$ billions)E-mini Index Futures vs. Exchange Traded Funds
$-
$10
$20
$30
$40
$50
$60
$70
$80
$90
$100
$110
$120
$130
$140
$150
$160
$170
E-mini SP500 SPY E-miniND100
QQQQ E-mini Dow DIA E-mini SP400 MDY
2007 2008
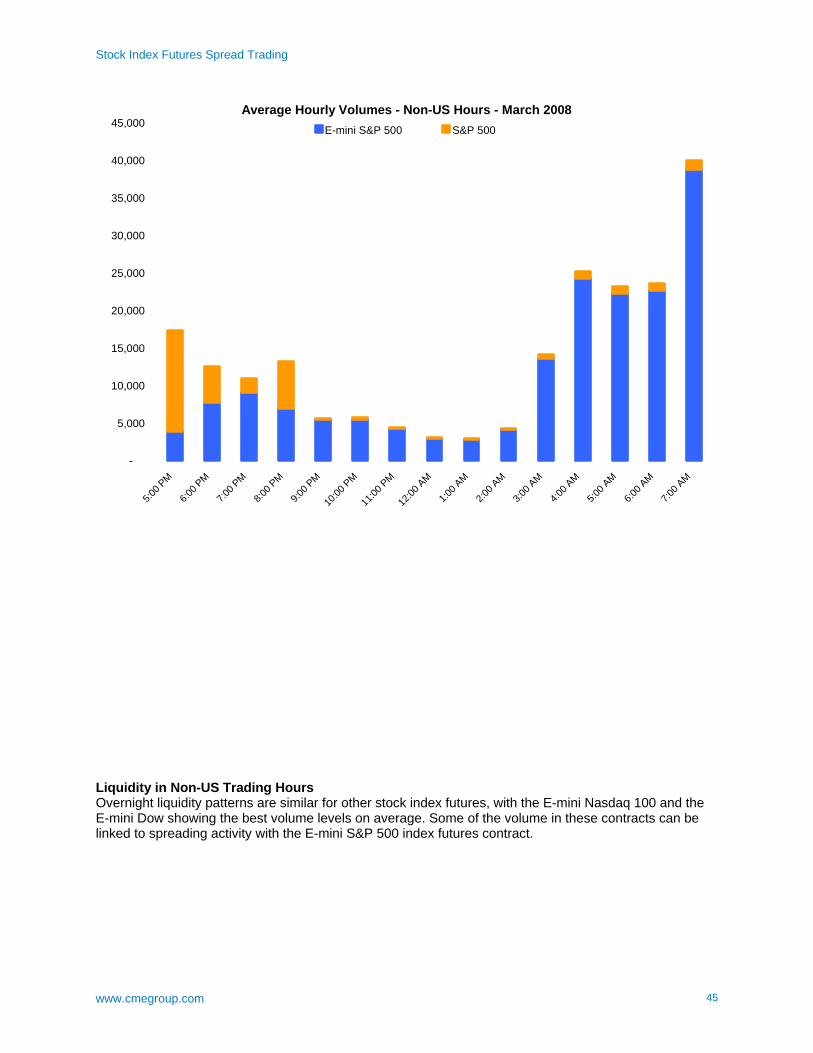
Liquidity in Non-US Trading Hours – E-mini S&P 500 The E-mini S&P 500 index futures are very liquid even during non-U.S. standard hours. All times shown in the chart below are in Central Time. Average volume per hour increases substantially once the London day session begins at approximately 2:00 a.m. Central Time (8:00 a.m. London time). The times shown below represent the one hour period ending at that time (4:00 a.m. means the one hour period between 3:00 a.m. and 4:00 a.m.). During the 2:00 a.m. to 7:00 a.m. periods, there may be increased spreading activity between U.S. and European stock index futures.
Stock Index Futures Spread Trading
www.cmegroup.com 45
Average Hourly Volumes - Non-US Hours - March 2008
-
5,000
10,000
15,000
20,000
25,000
30,000
35,000
40,000
45,000
5:00 P
M
6:00 P
M
7:00 P
M
8:00 P
M
9:00 P
M
10:00
PM
11:00
PM
12:00
AM
1:00 A
M
2:00 A
M
3:00 A
M
4:00 A
M
5:00 A
M
6:00 A
M
7:00 A
M
E-mini S&P 500 S&P 500
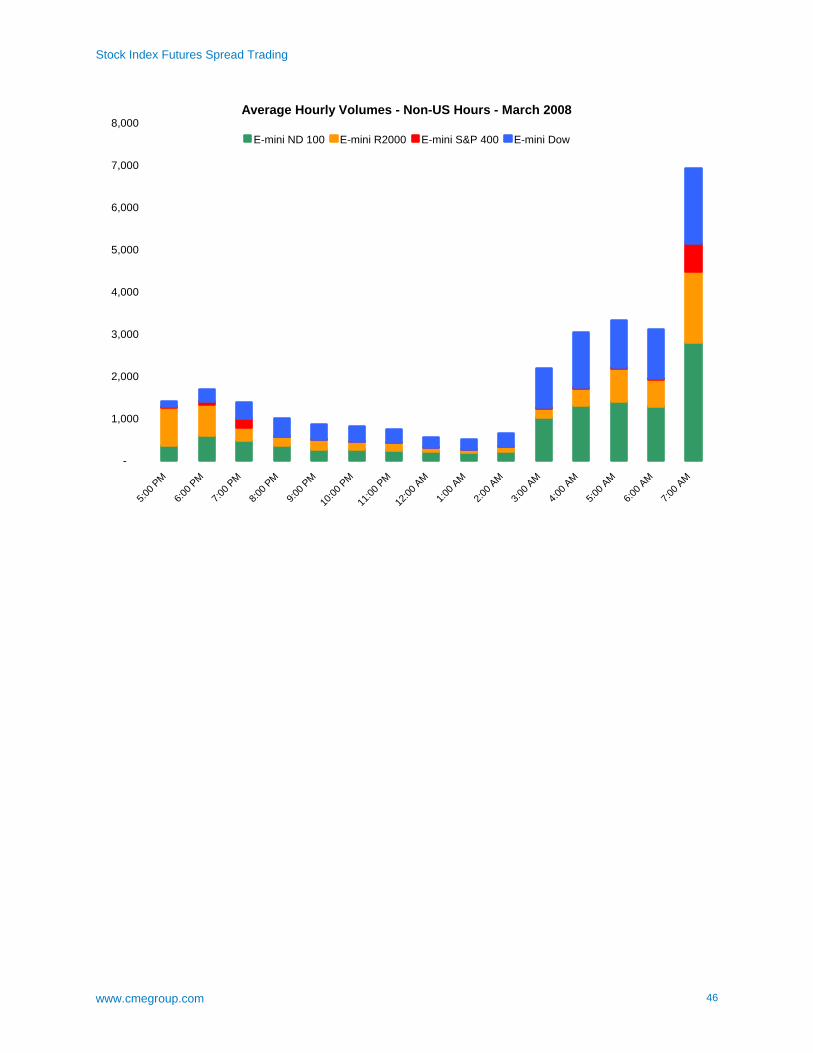
Liquidity in Non-US Trading Hours Overnight liquidity patterns are similar for other stock index futures, with the E-mini Nasdaq 100 and the E-mini Dow showing the best volume levels on average. Some of the volume in these contracts can be linked to spreading activity with the E-mini S&P 500 index futures contract.
Stock Index Futures Spread Trading
www.cmegroup.com 46
Average Hourly Volumes - Non-US Hours - March 2008
-
1,000
2,000
3,000
4,000
5,000
6,000
7,000
8,000
5:00 P
M
6:00 P
M
7:00 P
M
8:00 P
M
9:00 P
M
10:00
PM
11:00
PM
12:00
AM
1:00 A
M
2:00 A
M
3:00 A
M
4:00 A
M
5:00 A
M
6:00 A
M
7:00 A
M
E-mini ND 100 E-mini R2000 E-mini S&P 400 E-mini Dow
Stock Index Futures Spread Trading
www.cmegroup.com 47
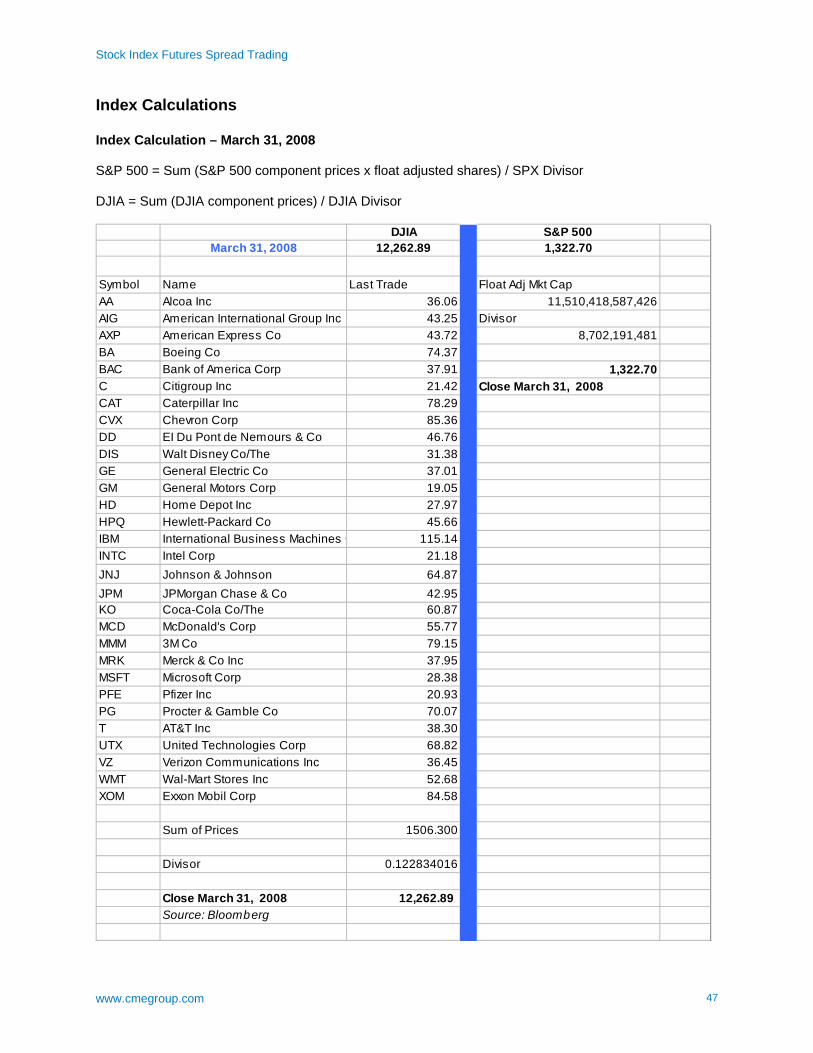
Index Calculations Index Calculation – March 31, 2008 S&P 500 = Sum (S&P 500 component prices x float adjusted shares) / SPX Divisor DJIA = Sum (DJIA component prices) / DJIA Divisor
DJIA S&P 500March 31, 2008 12,262.89 1,322.70
Symbol Name Last Trade Float Adj Mkt CapAA Alcoa Inc 36.06 11,510,418,587,426AIG American International Group Inc 43.25 DivisorAXP American Express Co 43.72 8,702,191,481BA Boeing Co 74.37BAC Bank of America Corp 37.91 1,322.70C Citigroup Inc 21.42 Close March 31, 2008CAT Caterpillar Inc 78.29CVX Chevron Corp 85.36DD EI Du Pont de Nemours & Co 46.76DIS Walt Disney Co/The 31.38GE General Electric Co 37.01GM General Motors Corp 19.05HD Home Depot Inc 27.97HPQ Hewlett-Packard Co 45.66IBM International Business Machines C 115.14INTC Intel Corp 21.18JNJ Johnson & Johnson 64.87JPM JPMorgan Chase & Co 42.95KO Coca-Cola Co/The 60.87MCD McDonald's Corp 55.77MMM 3M Co 79.15MRK Merck & Co Inc 37.95MSFT Microsoft Corp 28.38PFE Pfizer Inc 20.93PG Procter & Gamble Co 70.07T AT&T Inc 38.30UTX United Technologies Corp 68.82VZ Verizon Communications Inc 36.45WMT Wal-Mart Stores Inc 52.68XOM Exxon Mobil Corp 84.58
Sum of Prices 1506.300
Divisor 0.122834016
Close March 31, 2008 12,262.89 Source: Bloomberg
Stock Index Futures Spread Trading
www.cmegroup.com 48
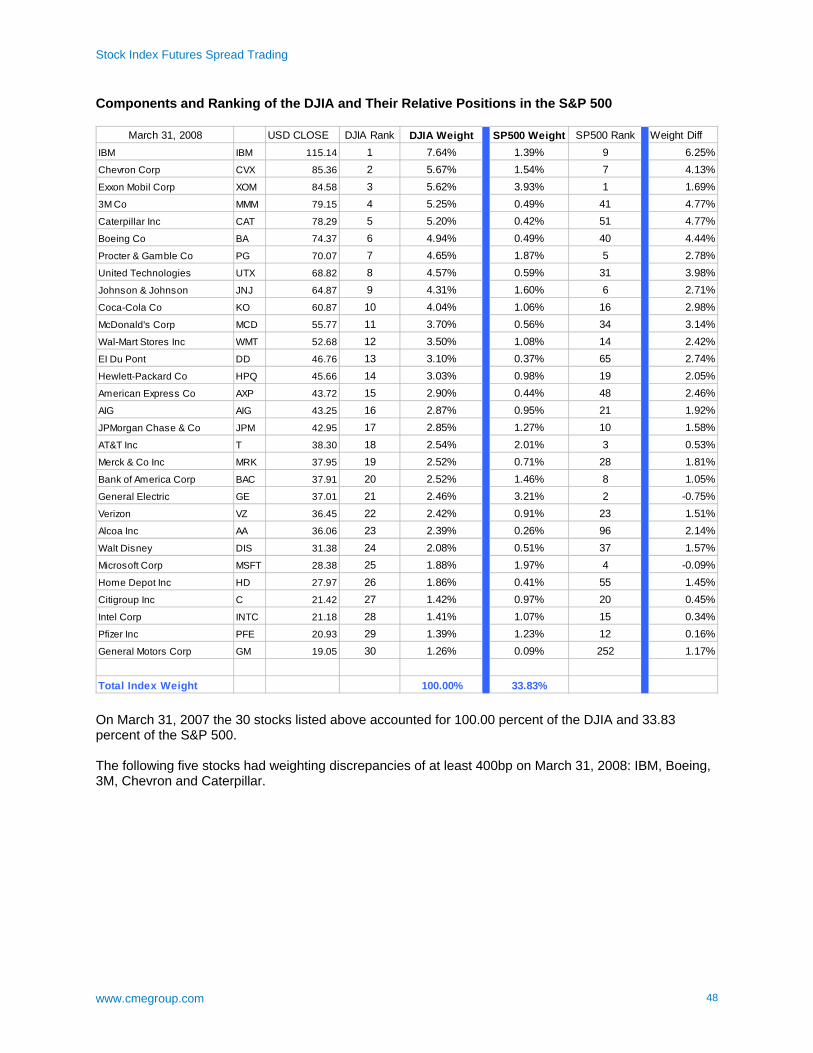
Components and Ranking of the DJIA and Their Relative Positions in the S&P 500
March 31, 2008 USD CLOSE DJIA Rank DJIA Weight SP500 Weight SP500 Rank Weight DiffIBM IBM 115.14 1 7.64% 1.39% 9 6.25%Chevron Corp CVX 85.36 2 5.67% 1.54% 7 4.13%Exxon Mobil Corp XOM 84.58 3 5.62% 3.93% 1 1.69%3M Co MMM 79.15 4 5.25% 0.49% 41 4.77%Caterpillar Inc CAT 78.29 5 5.20% 0.42% 51 4.77%Boeing Co BA 74.37 6 4.94% 0.49% 40 4.44%Procter & Gamble Co PG 70.07 7 4.65% 1.87% 5 2.78%United Technologies UTX 68.82 8 4.57% 0.59% 31 3.98%Johnson & Johnson JNJ 64.87 9 4.31% 1.60% 6 2.71%Coca-Cola Co KO 60.87 10 4.04% 1.06% 16 2.98%McDonald's Corp MCD 55.77 11 3.70% 0.56% 34 3.14%Wal-Mart Stores Inc WMT 52.68 12 3.50% 1.08% 14 2.42%EI Du Pont DD 46.76 13 3.10% 0.37% 65 2.74%Hewlett-Packard Co HPQ 45.66 14 3.03% 0.98% 19 2.05%American Express Co AXP 43.72 15 2.90% 0.44% 48 2.46%AIG AIG 43.25 16 2.87% 0.95% 21 1.92%JPMorgan Chase & Co JPM 42.95 17 2.85% 1.27% 10 1.58%AT&T Inc T 38.30 18 2.54% 2.01% 3 0.53%Merck & Co Inc MRK 37.95 19 2.52% 0.71% 28 1.81%Bank of America Corp BAC 37.91 20 2.52% 1.46% 8 1.05%General Electric GE 37.01 21 2.46% 3.21% 2 -0.75%Verizon VZ 36.45 22 2.42% 0.91% 23 1.51%Alcoa Inc AA 36.06 23 2.39% 0.26% 96 2.14%Walt Disney DIS 31.38 24 2.08% 0.51% 37 1.57%Microsoft Corp MSFT 28.38 25 1.88% 1.97% 4 -0.09%Home Depot Inc HD 27.97 26 1.86% 0.41% 55 1.45%Citigroup Inc C 21.42 27 1.42% 0.97% 20 0.45%Intel Corp INTC 21.18 28 1.41% 1.07% 15 0.34%Pfizer Inc PFE 20.93 29 1.39% 1.23% 12 0.16%General Motors Corp GM 19.05 30 1.26% 0.09% 252 1.17%
Total Index Weight 100.00% 33.83% On March 31, 2007 the 30 stocks listed above accounted for 100.00 percent of the DJIA and 33.83 percent of the S&P 500. The following five stocks had weighting discrepancies of at least 400bp on March 31, 2008: IBM, Boeing, 3M, Chevron and Caterpillar.
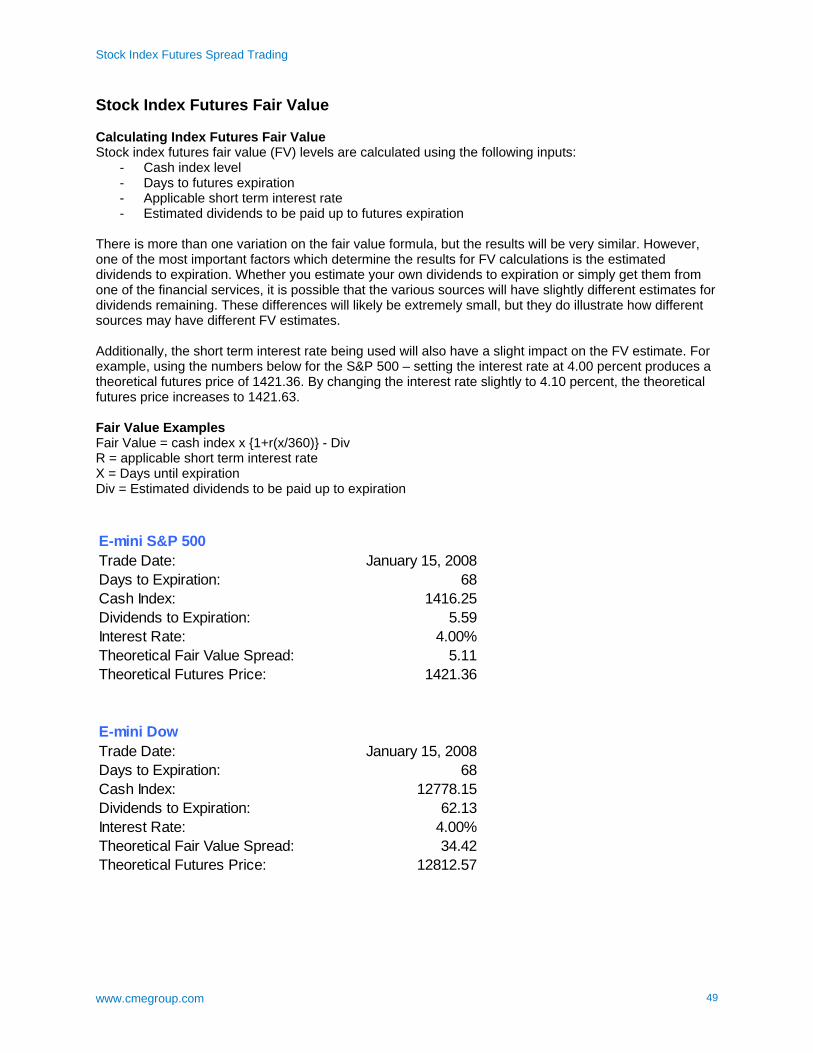
Stock Index Futures Spread Trading
www.cmegroup.com 49
Stock Index Futures Fair Value Calculating Index Futures Fair Value Stock index futures fair value (FV) levels are calculated using the following inputs:
- Cash index level - Days to futures expiration - Applicable short term interest rate - Estimated dividends to be paid up to futures expiration
There is more than one variation on the fair value formula, but the results will be very similar. However, one of the most important factors which determine the results for FV calculations is the estimated dividends to expiration. Whether you estimate your own dividends to expiration or simply get them from one of the financial services, it is possible that the various sources will have slightly different estimates for dividends remaining. These differences will likely be extremely small, but they do illustrate how different sources may have different FV estimates. Additionally, the short term interest rate being used will also have a slight impact on the FV estimate. For example, using the numbers below for the S&P 500 – setting the interest rate at 4.00 percent produces a theoretical futures price of 1421.36. By changing the interest rate slightly to 4.10 percent, the theoretical futures price increases to 1421.63. Fair Value Examples Fair Value = cash index x {1+r(x/360)} - Div R = applicable short term interest rate X = Days until expiration Div = Estimated dividends to be paid up to expiration
E-mini S&P 500Trade Date: January 15, 2008Days to Expiration: 68Cash Index: 1416.25Dividends to Expiration: 5.59Interest Rate: 4.00%Theoretical Fair Value Spread: 5.11Theoretical Futures Price: 1421.36
E-mini DowTrade Date: January 15, 2008Days to Expiration: 68Cash Index: 12778.15Dividends to Expiration: 62.13Interest Rate: 4.00%Theoretical Fair Value Spread: 34.42Theoretical Futures Price: 12812.57
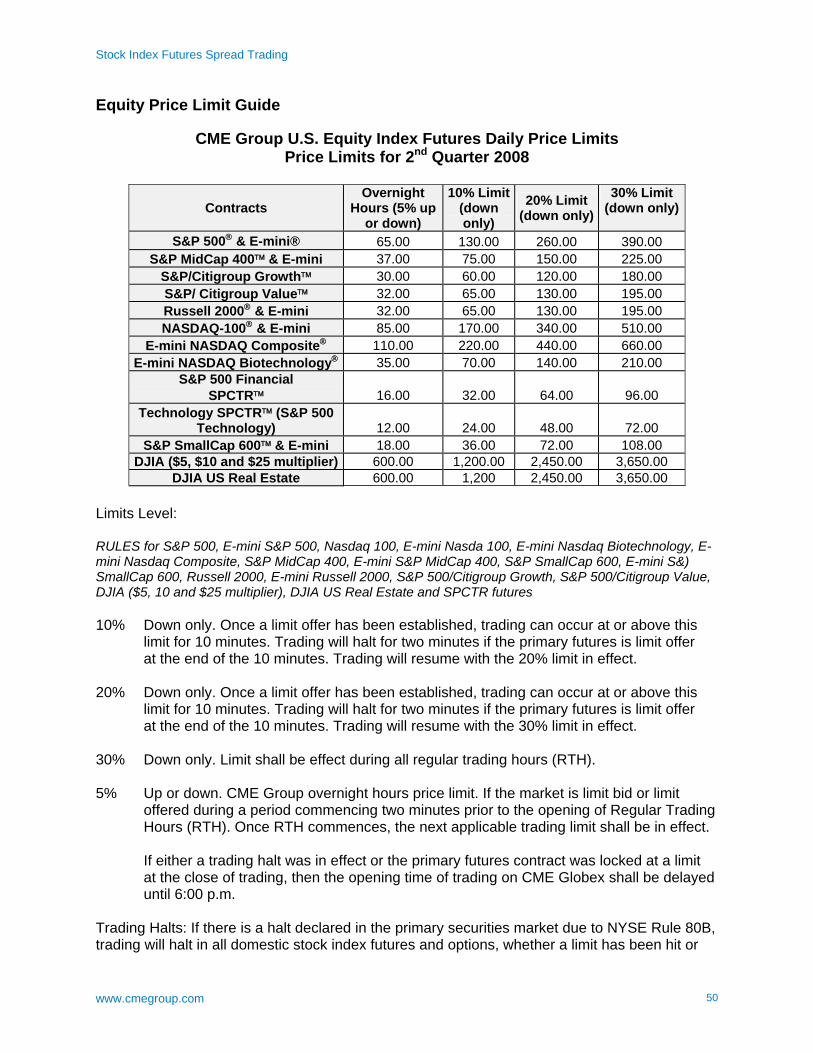
Stock Index Futures Spread Trading
www.cmegroup.com 50
Equity Price Limit Guide
CME Group U.S. Equity Index Futures Daily Price Limits Price Limits for 2nd Quarter 2008
Contracts Overnight
Hours (5% up or down)
10% Limit (down only)
20% Limit (down only)
30% Limit (down only)
S&P 500® & E-mini® 65.00 130.00 260.00 390.00 S&P MidCap 400™ & E-mini 37.00 75.00 150.00 225.00
S&P/Citigroup Growth™ 30.00 60.00 120.00 180.00 S&P/ Citigroup Value™ 32.00 65.00 130.00 195.00 Russell 2000® & E-mini 32.00 65.00 130.00 195.00 NASDAQ-100® & E-mini 85.00 170.00 340.00 510.00
E-mini NASDAQ Composite® 110.00 220.00 440.00 660.00 E-mini NASDAQ Biotechnology® 35.00 70.00 140.00 210.00
S&P 500 Financial SPCTR™ 16.00 32.00 64.00 96.00
Technology SPCTR™ (S&P 500 Technology) 12.00 24.00 48.00 72.00
S&P SmallCap 600™ & E-mini 18.00 36.00 72.00 108.00 DJIA ($5, $10 and $25 multiplier) 600.00 1,200.00 2,450.00 3,650.00
DJIA US Real Estate 600.00 1,200 2,450.00 3,650.00 Limits Level: RULES for S&P 500, E-mini S&P 500, Nasdaq 100, E-mini Nasda 100, E-mini Nasdaq Biotechnology, E-mini Nasdaq Composite, S&P MidCap 400, E-mini S&P MidCap 400, S&P SmallCap 600, E-mini S&) SmallCap 600, Russell 2000, E-mini Russell 2000, S&P 500/Citigroup Growth, S&P 500/Citigroup Value, DJIA ($5, 10 and $25 multiplier), DJIA US Real Estate and SPCTR futures 10% Down only. Once a limit offer has been established, trading can occur at or above this limit for 10 minutes. Trading will halt for two minutes if the primary futures is limit offer at the end of the 10 minutes. Trading will resume with the 20% limit in effect. 20% Down only. Once a limit offer has been established, trading can occur at or above this limit for 10 minutes. Trading will halt for two minutes if the primary futures is limit offer at the end of the 10 minutes. Trading will resume with the 30% limit in effect. 30% Down only. Limit shall be effect during all regular trading hours (RTH). 5% Up or down. CME Group overnight hours price limit. If the market is limit bid or limit offered during a period commencing two minutes prior to the opening of Regular Trading Hours (RTH). Once RTH commences, the next applicable trading limit shall be in effect. If either a trading halt was in effect or the primary futures contract was locked at a limit at the close of trading, then the opening time of trading on CME Globex shall be delayed until 6:00 p.m. Trading Halts: If there is a halt declared in the primary securities market due to NYSE Rule 80B, trading will halt in all domestic stock index futures and options, whether a limit has been hit or
Stock Index Futures Spread Trading
www.cmegroup.com 51
not. Trading will resume in CME Group domestic stock index contracts when the primary securities market reopens for trading. Once CME Group markets have reopened, the next applicable limit will be in effect. Daily Price Limits for all U.S. Equity Index Futures are tied to movements in E-mini contracts as opposed to standard contracts. DJIA % Declines: 10% If the DJIA declines 10% prior to 1:00 p.m. CT, the NYSE will declare a one-hour trading
halt. If the DJIA decline 10% between 1:00 p.m. and 1:30 p.m. CT, the NYSE will declare a half-hour trading halt. After 1:30 p.m. CT, the 10% limit is not in effect.
20% If the DJIA declines 20% prior to 12:00 p.m. CT, the NYSE will declare a two-hour trading halt. If the DJIA declines 20% after 1:00 p.m. CT, the NYSE will declare a trading halt and will no reopen. 30% If the DJIA declines 30%, the NYSE will declare a trading halt and will not reopen.
Stock Index Futures Spread Trading
www.cmegroup.com 52
Disclaimer The Globe logo, CME®, Chicago Mercantile Exchange® and CME Group™ and Globex® are trademarks of Chicago Mercantile Exchange Inc. CBOT® and Chicago Board of Trade® are trademarks of the Board of Trade of the City of Chicago. All other trademarks are the property of their respective owners, used with license. S&P 500®, S&P MidCap 400™, S&P SmallCap 600™, S&P/Citigroup Growth Index™ and S&P/Citigroup Value Index™ are trademarks of Standard & Poor’s, a division of the McGraw-Hill Companies. NASDAQ-100 Index® and NASDAQ Composite Index® are trademarks of the The Nasdaq Stock Market, Inc. Russell 2000® is a trademark of the Frank Russell Company, licensed for use by the Chicago Mercantile Exchange Inc. DJIASM and DJRESM are service marks of Dow Jones & Company, Inc. Copyright © 2008 CME Group. All rights reserved.