clustering
DESCRIPTION
Clustering. Usman Roshan CS 698. Clustering. Suppose we want to cluster n vectors in R d into two groups. Define C 1 and C 2 as the two groups. Our objective is to find C 1 and C 2 that minimize where m i is the mean of class C i. Clustering. NP hard even for 2-means - PowerPoint PPT PresentationTRANSCRIPT

Clustering
Usman Roshan
CS 675

Clustering
• Suppose we want to cluster n vectors in Rd into two groups. Define C1 and C2 as the two groups.
• Our objective is to find C1 and C2 that minimize
where mi is the mean of class Ci

Clustering• NP hard even for 2-means
• NP hard even on plane
• K-means heuristic– Popular and hard to beat– Introduced in 1950s and 1960s

K-means algorithm for two clusters
Input: Algorithm:
1. Initialize: assign xi to C1 or C2 with equal probability and compute means:
2. Recompute clusters: assign xi to C1 if ||xi-m1||<||xi-m2||, otherwise assign to C2
3. Recompute means m1 and m2
4. Compute objective
5. Compute objective of new clustering. If difference is smaller than then stop, otherwise go to step 2.
, 1dix R i n
K-means
• Is it guaranteed to find the clustering which optimizes the objective?
• It is guaranteed to find a local optimal
• We can prove that the objective decreases with subsequence iterations

Proof sketch of convergence of k-means
Justification of first inequality: by assigning xj to the closest mean the objective decreases or stays the same
Justification of second inequality: for a given cluster its mean minimizes squared error loss

K-means clustering
• K-means is the Expected-Maximization solution if we assume data is generated by Gaussian distribution– EM: Find clustering of data that maximizes likelihood– Unsupervised means no parameters given. Thus we
iterate between estimating expected and actual values of parameters
• PCA gives relaxed solution to k-means clustering. Sketch of proof:– Cast k-means clustering as maximization problem– Relax cluster indicator variables to be continuous and
solution is given by PCA

K-means clustering
• K-medians variant:– Select cluster center that is the median
– Has the effect of minimizing L1 error
• K-medoid– Cluster center is an actual datapoint (not
same as k-medians)
• Algorithms similar to k-means• Similar local minima problems to k-means

Other clustering algorithms
• Spherical k-means– Normalize each datapoint (set length to 1)– Clustering by finding center with minimum
cosine angle to cluster points– Similar iterative algorithm to Euclidean k-
means– Converges with similar proofs.

Other clustering algorithms
• Hierarchical clustering– Initialize n clusters where each datapoint is
in its own cluster– Merge two nearest clusters into one– Update distances of new cluster to existing
ones– Repeat step 2 until k clusters are formed.

Other clustering algorithms
• Graph clustering (Spectral clustering)– Find cut of minimum cost in a bipartition of
the data – NP-hard if look for minimum cut such that
size of two clusters are similar– Relaxation leads to spectral clustering– Based on calculating Laplacian of a graph
and eigenvalues and eigenvectors of similarity matrix

Application on population structure data
• Data are vectors xi where each feature takes on values 0, 1, and 2 to denote number of alleles of a particular single nucleotide polymorphism (SNP)
• Output yi is an integer indicating the population group a vector belongs to
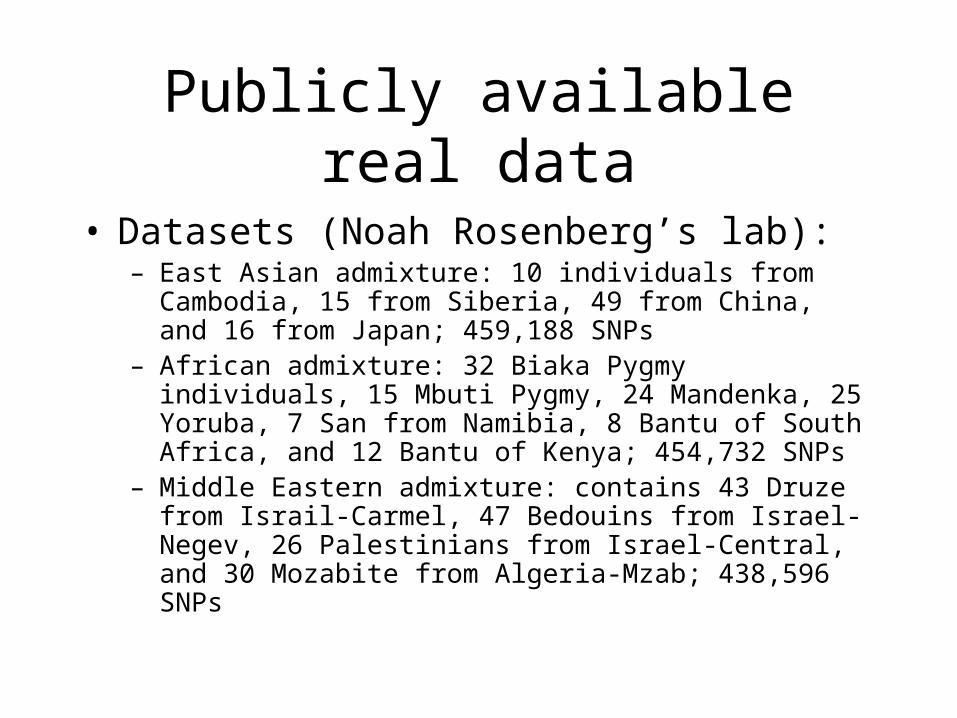
Publicly available real data
• Datasets (Noah Rosenberg’s lab):– East Asian admixture: 10 individuals from Cambodia, 15
from Siberia, 49 from China, and 16 from Japan; 459,188 SNPs
– African admixture: 32 Biaka Pygmy individuals, 15 Mbuti Pygmy, 24 Mandenka, 25 Yoruba, 7 San from Namibia, 8 Bantu of South Africa, and 12 Bantu of Kenya; 454,732 SNPs
– Middle Eastern admixture: contains 43 Druze from Israil-Carmel, 47 Bedouins from Israel-Negev, 26 Palestinians from Israel-Central, and 30 Mozabite from Algeria-Mzab; 438,596 SNPs

East Asian populations

African populations

Middle Eastern populations

K-means applied to PCA data
• PCA and kernel PCA (poly degree 2)
• K-means and spherical k-means
• Number of clusters set to true value