cluster analysis - emory universitylxiong/cs570_s11/share/slides/14_clustering.… · cluster...
TRANSCRIPT
Cluster Analysis
� Overview
� Partitioning methods: k-means, k-medoids
� Hierarchical methods: agglomerative, BIRCH
� Graph based methods: CHAMELEON
� Self-organizing maps (SOM)
March 3, 2011 Data Mining: Concepts and Techniques 82
� Self-organizing maps (SOM)
� Density-based methods
� EM Method
� Cluster evaluation
� Outlier analysis
Spatial Data
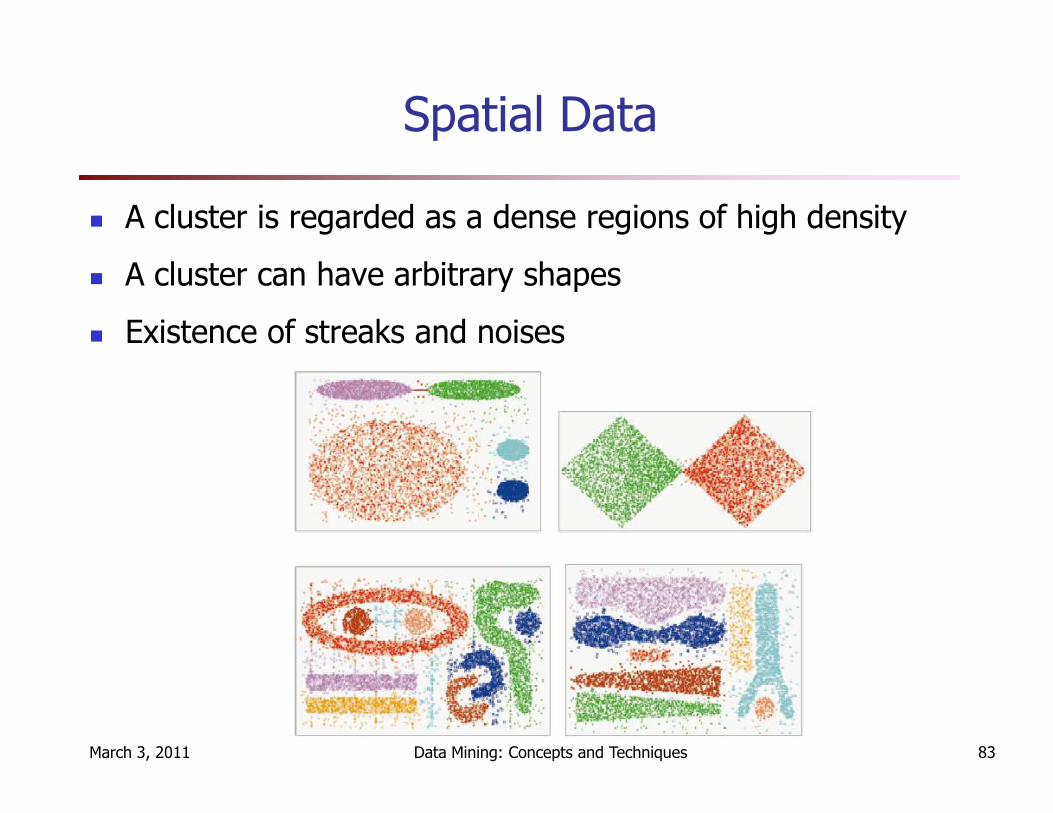
� A cluster is regarded as a dense regions of high density
� A cluster can have arbitrary shapes
� Existence of streaks and noises
March 3, 2011 Data Mining: Concepts and Techniques 83
Clustering Applications
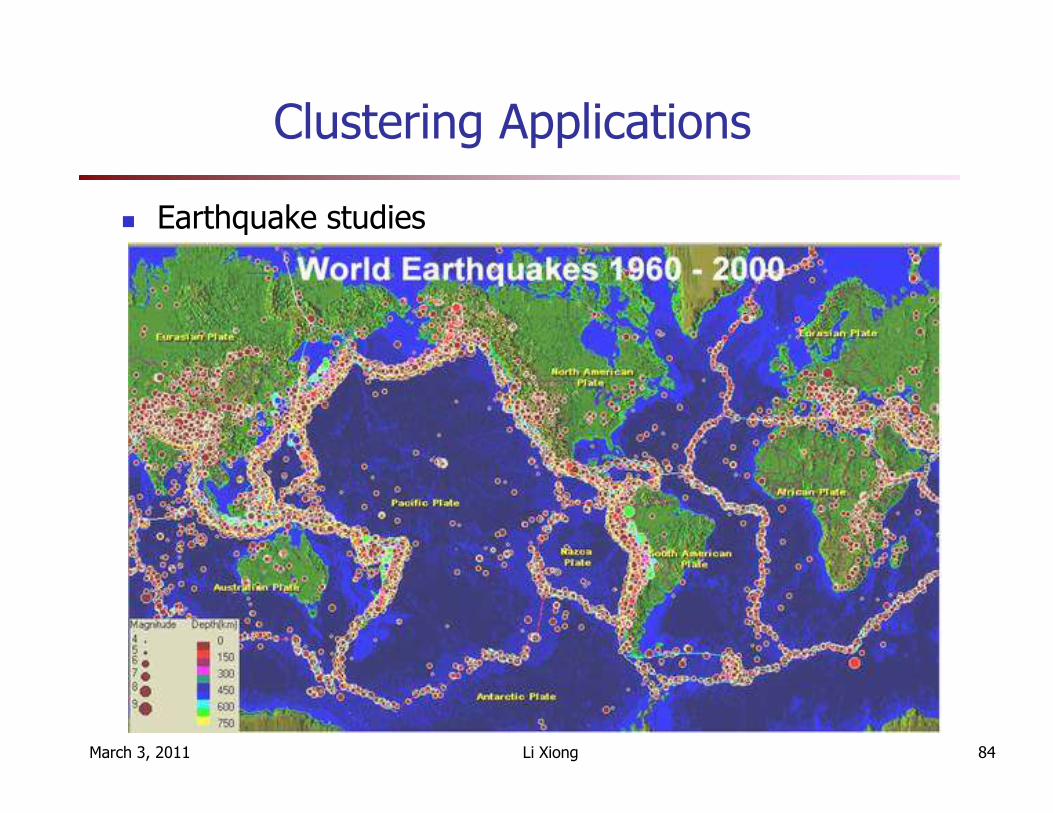
� Earthquake studies
March 3, 2011 Li Xiong 84
Density-Based Clustering Methods
� Major features:
� Detect clusters of arbitrary shape� Handle noise� Need density parameters as termination condition
� Several interesting studies:
March 3, 2011 Data Mining: Concepts and Techniques 85
� Several interesting studies:
� DBSCAN: Ester, et al. (KDD’96)
� OPTICS: Ankerst, et al (SIGMOD’99).
� DENCLUE: Hinneburg & D. Keim (KDD’98)
� CLIQUE: Agrawal, et al. (SIGMOD’98) (more grid-based)
DBSCAN: Basic Concepts
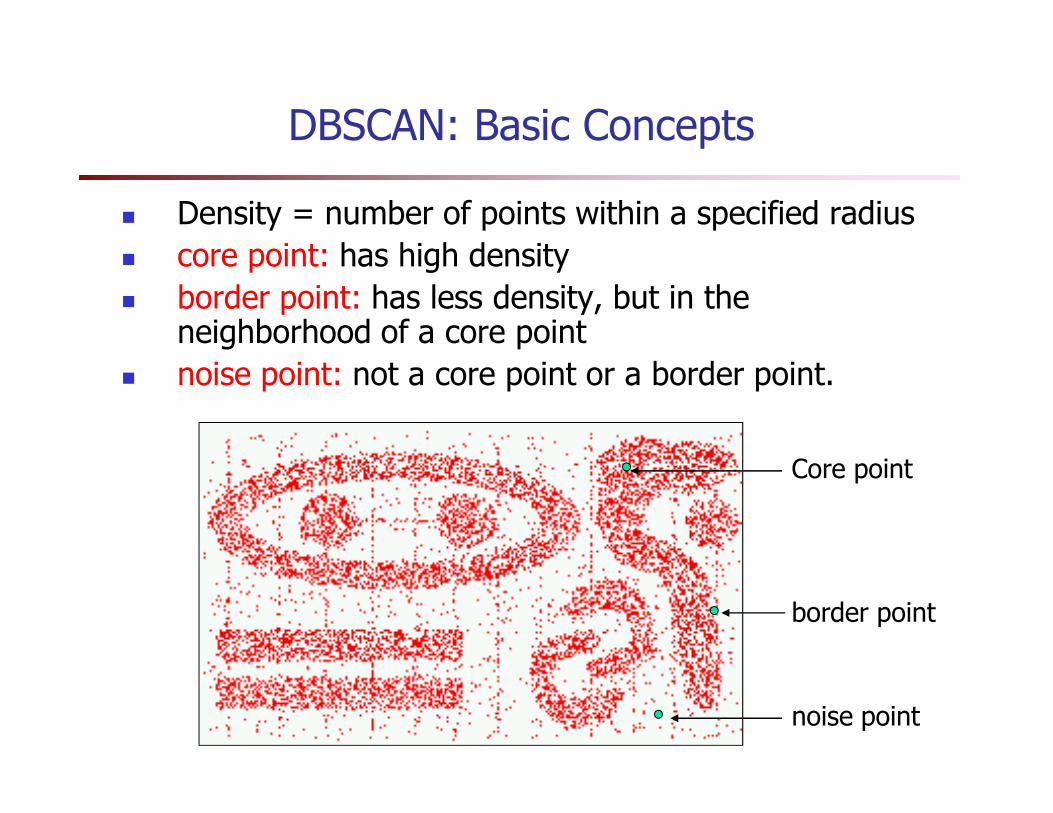
� Density = number of points within a specified radius
� core point: has high density
� border point: has less density, but in the neighborhood of a core point
� noise point: not a core point or a border point.
border point
Core point
noise point
DBScan: Definitions
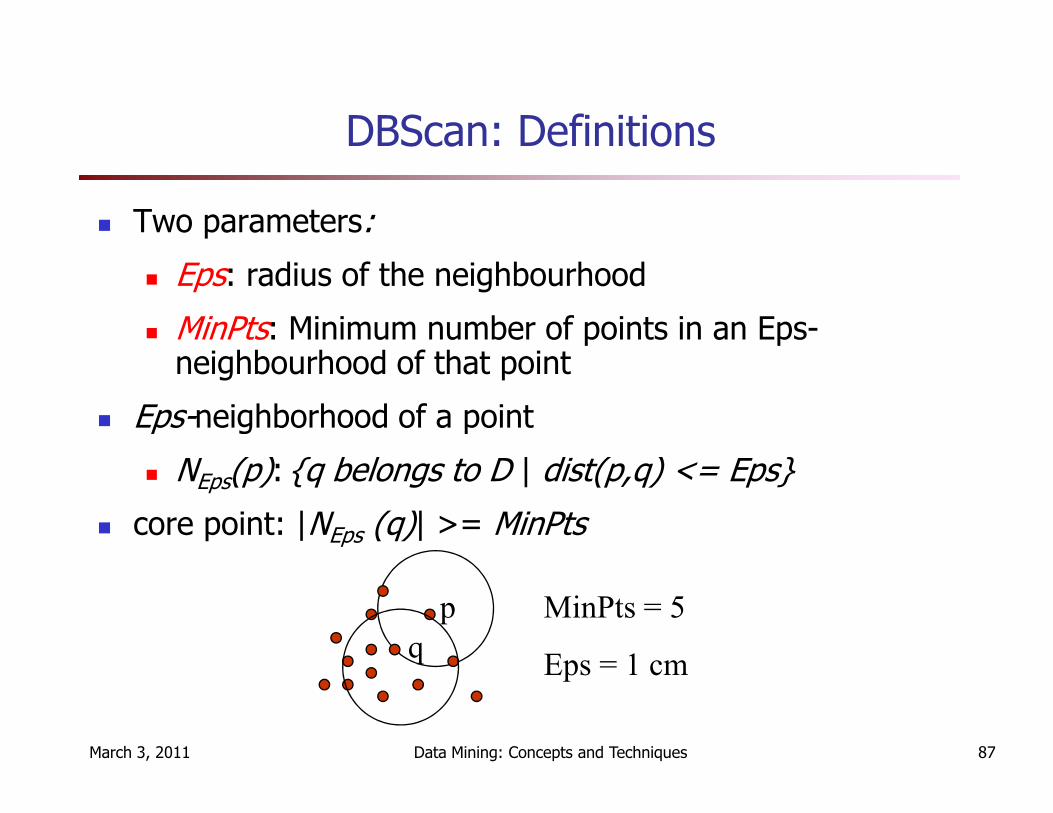
� Two parameters:
� Eps: radius of the neighbourhood
� MinPts: Minimum number of points in an Eps-neighbourhood of that point
Eps-neighborhood of a point
March 3, 2011 Data Mining: Concepts and Techniques 87
� Eps-neighborhood of a point
� NEps(p): {q belongs to D | dist(p,q) <= Eps}
� core point: |NEps (q)| >= MinPts
p
q
MinPts = 5
Eps = 1 cm

DBScan: Definitions
� Directly density-reachable: p belongs to NEps(q), q is a core point (asymmetric)
� Density-reachable: if there is a chain of points p1, …, pn, p1 = q, pn = p
p
p
q
MinPts = 5
Eps = 1 cm
Data Mining: Concepts and Techniques 88
of points p1, …, pn, p1 = q, pn = psuch that pi+1 is directly density-reachable from pi
� Density-connected: if there is a point o such that both, p and q are density-reachable from o w.r.t. Eps and MinPts
p q
o
qp1
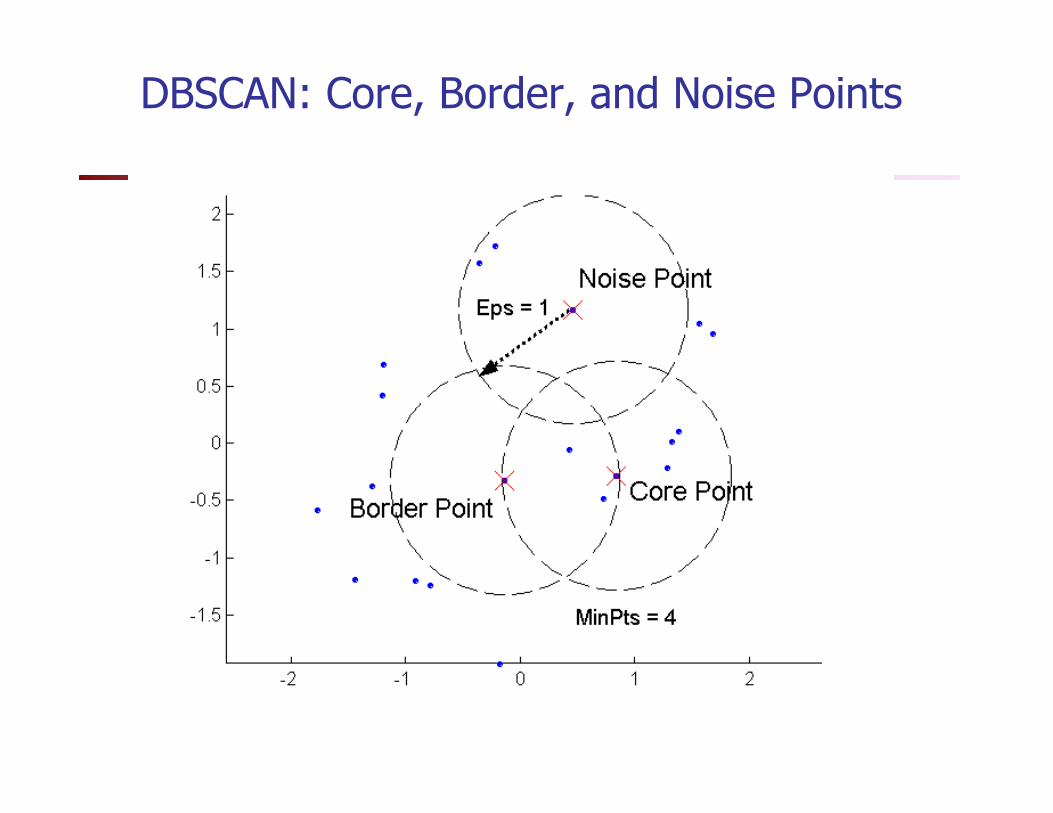
DBSCAN: Core, Border, and Noise Points
DBSCAN: Cluster Definition
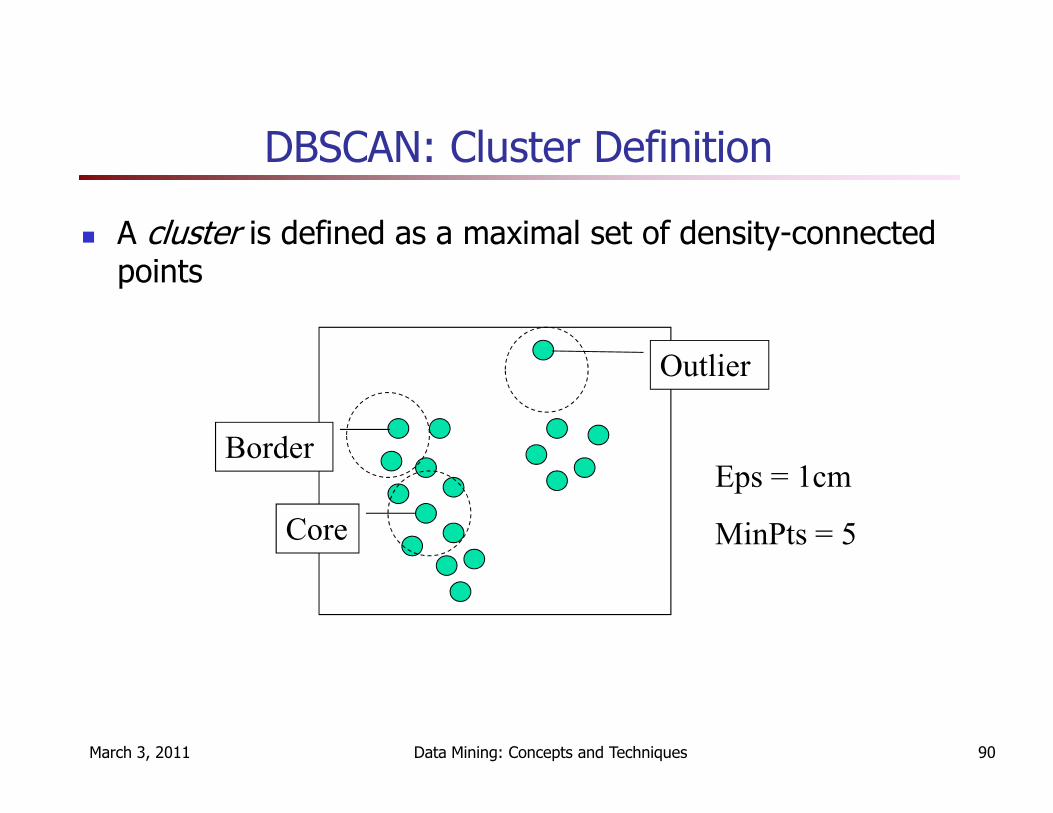
� A cluster is defined as a maximal set of density-connected points
Outlier
March 3, 2011 Data Mining: Concepts and Techniques 90
Core
BorderEps = 1cm
MinPts = 5

DBSCAN: The Algorithm
� Arbitrary select a point p
� If p is a core point
� Retrieve all points density-reachable from p w.r.t. Eps
and MinPts and a cluster is formed.
March 3, 2011 Data Mining: Concepts and Techniques 91
and MinPts and a cluster is formed.
� Otherwise
� Mark the point as noise
� visit the next unvisited point of the database.
� Continue the process until all of the points have been
processed.
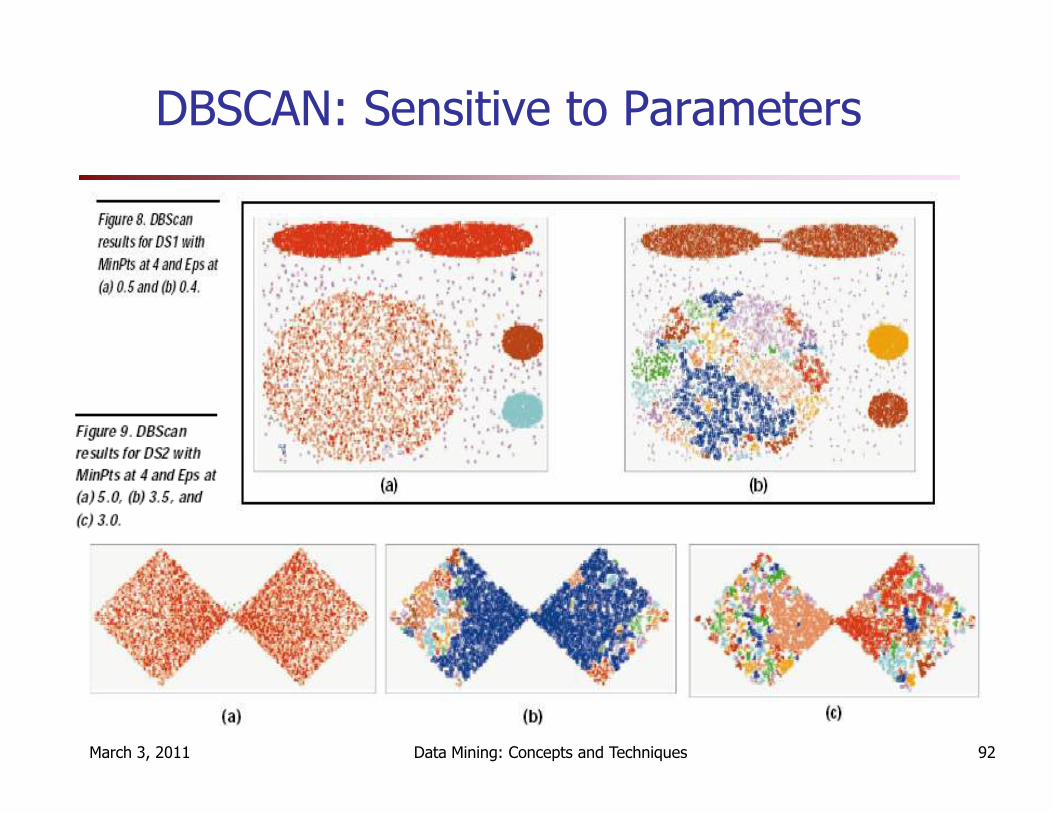
DBSCAN: Sensitive to Parameters
March 3, 2011 Data Mining: Concepts and Techniques 92
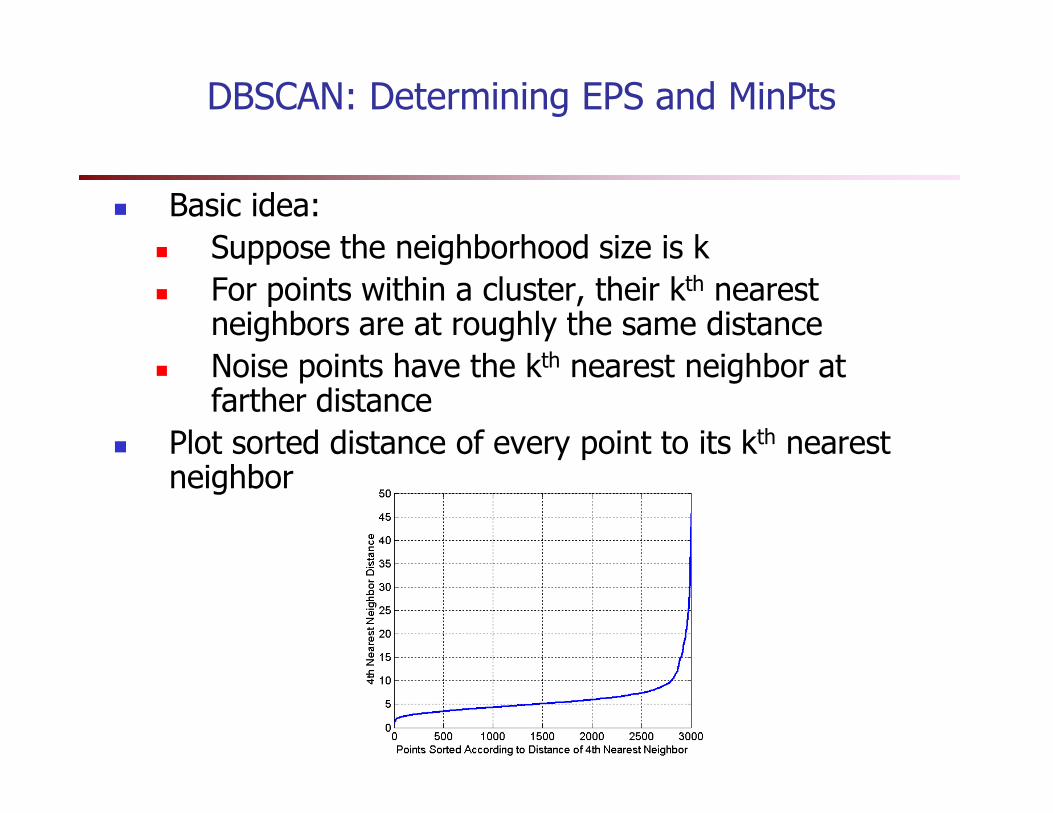
DBSCAN: Determining EPS and MinPts
� Basic idea:
� Suppose the neighborhood size is k
� For points within a cluster, their kth nearest neighbors are at roughly the same distance
� Noise points have the kth nearest neighbor at farther distancefarther distance
� Plot sorted distance of every point to its kth nearest neighbor
Features
� Complexity:
� O(n2), can reduce to O(nlogn) if using index structures
� Advantages
� does not require the number of clusters (vs. k-means)
� can find arbitrarily shaped clusters. � can find arbitrarily shaped clusters.
� can identify noise
� mostly insensitive to the ordering of the points
� Disadvantages
� Sensitive to parameters
� does not respond well to data sets with varying densities
March 3, 2011 Data Mining: Concepts and Techniques 94
OPTICS: A Cluster-Ordering Method (1999)
� OPTICS: Ordering Points To Identify the Clustering Structure
� Based on DBSCAN
� Produces hierarchical clustering results that correspond to broad range of parameter settings
March 3, 2011 Data Mining: Concepts and Techniques 95
to broad range of parameter settings
� Can be represented graphically or using visualization techniques
� Good for both automatic and interactive cluster analysis, including finding intrinsic clustering structure
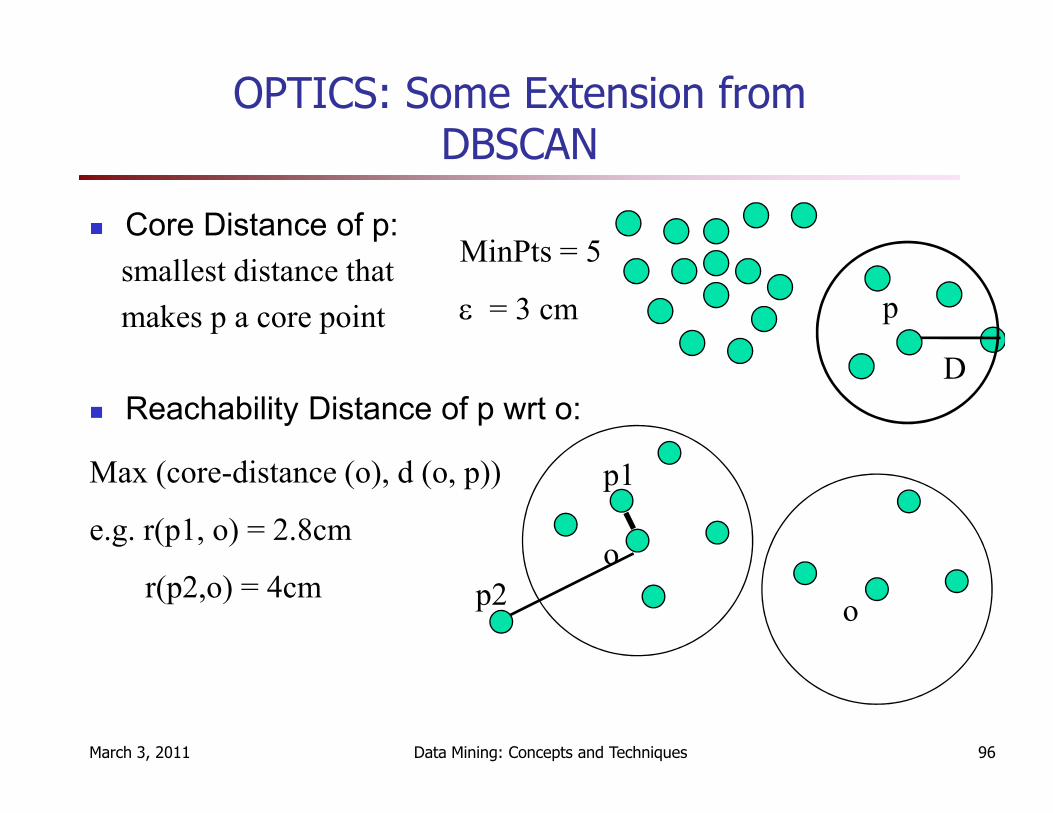
OPTICS: Some Extension from DBSCAN
� Core Distance of p:
smallest distance that
makes p a core point
� Reachability Distance of p wrt o:
D
MinPts = 5
ε = 3 cm p
March 3, 2011 Data Mining: Concepts and Techniques 96
� Reachability Distance of p wrt o:
p2
Max (core-distance (o), d (o, p))
e.g. r(p1, o) = 2.8cm
r(p2,o) = 4cmo
o
p1
OPTICS
� Arbitrary select a point p
� If p is a core point
� Retrieve all points density-reachable from p w.r.t. Eps
and MinPts
March 3, 2011 Data Mining: Concepts and Techniques 97
� Update the reachability distance of points to nearest
neighbor and output the points in ascending order
� Otherwise
� visit the next unvisited point of the database.
� Continue the process until all of the points have been
processed.
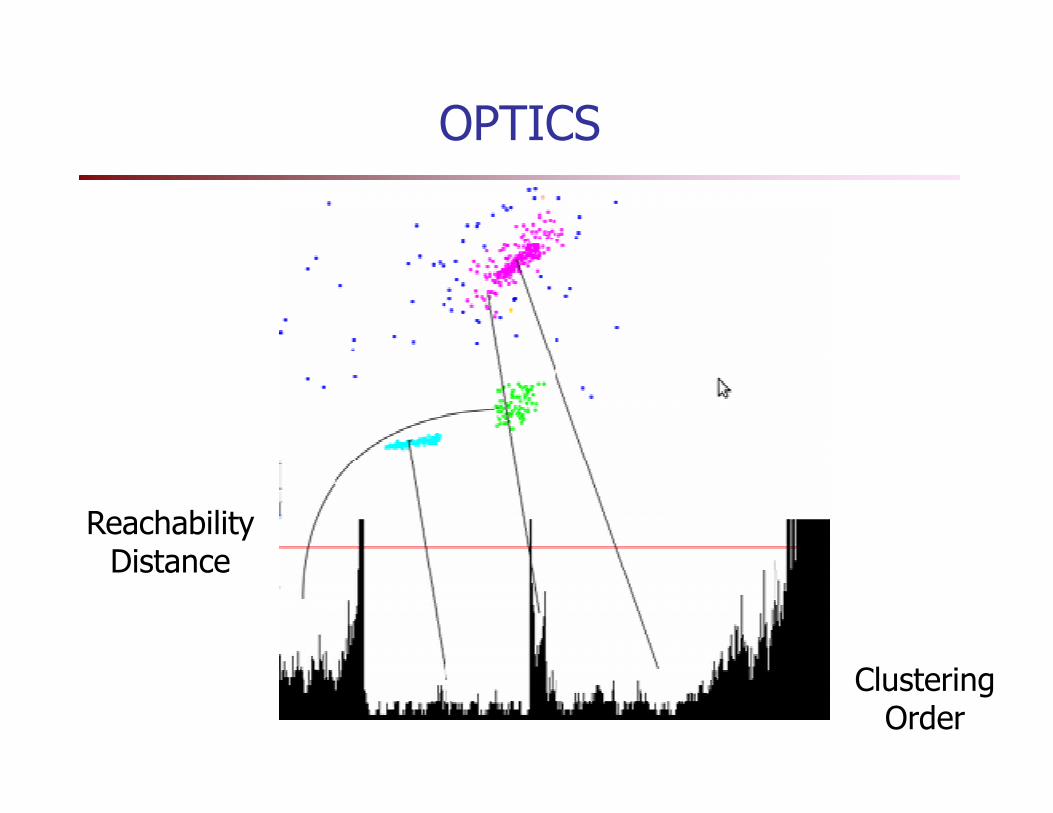
OPTICS
ReachabilityDistance
ClusteringOrder
Region growing algorithm
� Image segmentation method
� Algorithm
� Select a set of seed points
� Grow regions from these seed points to adjacent points depending on a region adjacent points depending on a region membership criterion.
� May cluster noise points as well
March 3, 2011 Data Mining: Concepts and Techniques 99

Cluster Analysis
� Overview
� Partitioning methods: k-means, k-medoids
� Hierarchical methods: agglomerative, BIRCH
� Graph based methods: CHAMELEON
� Self-organizing maps (SOM)
March 3, 2011 Data Mining: Concepts and Techniques 100
� Self-organizing maps (SOM)
� Density-based methods
� EM Method
� Cluster evaluation
� Outlier analysis
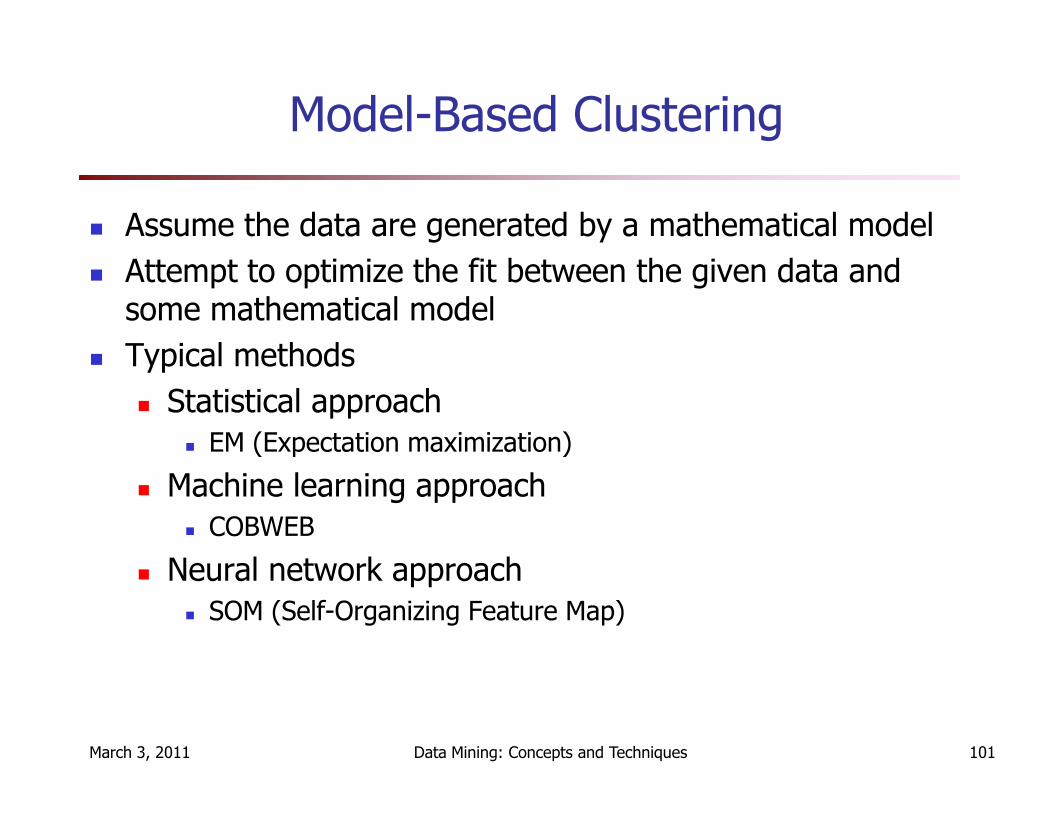
Model-Based Clustering
� Assume the data are generated by a mathematical model
� Attempt to optimize the fit between the given data and some mathematical model
� Typical methods
� Statistical approach
March 3, 2011 Data Mining: Concepts and Techniques 101
� Statistical approach
� EM (Expectation maximization)
� Machine learning approach
� COBWEB
� Neural network approach
� SOM (Self-Organizing Feature Map)

Clustering by Mixture Model
� Assume data are generated by a mixture of probabilistic model
� Generalization of k-means
� Each cluster can be represented by a probabilistic model, like a Gaussian (continuous) distribution.
March 3, 2011 Data Mining: Concepts and Techniques 102
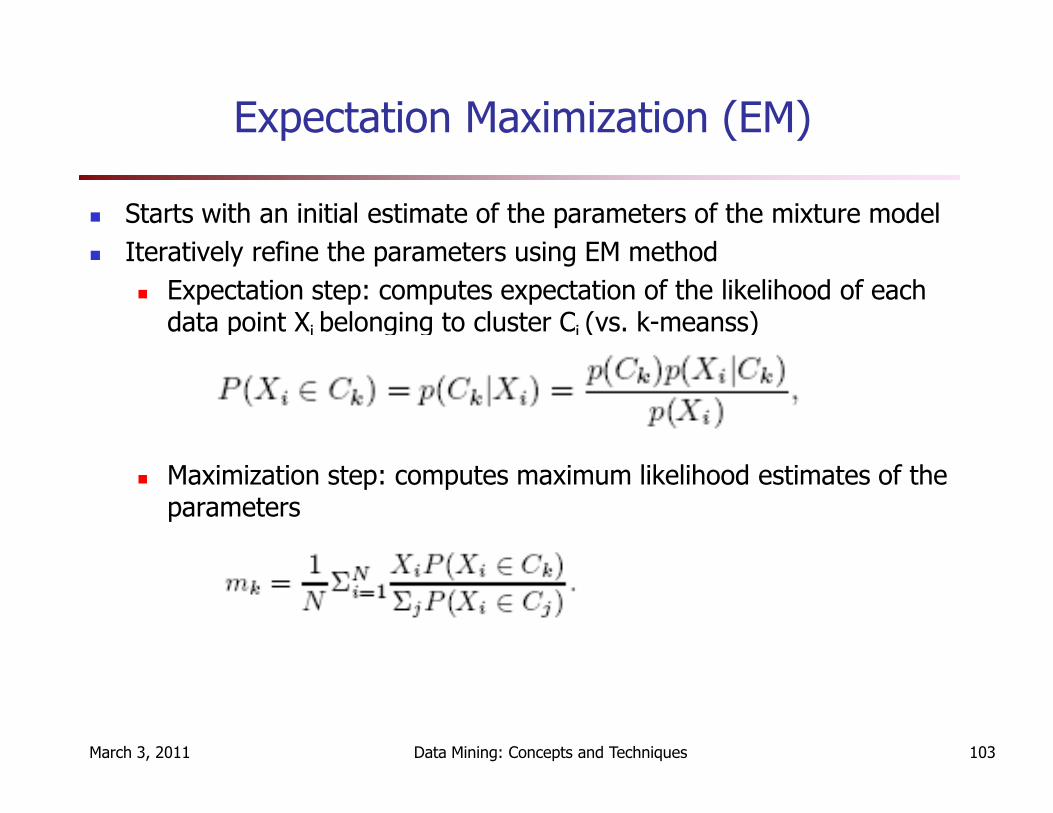
Expectation Maximization (EM)
� Starts with an initial estimate of the parameters of the mixture model
� Iteratively refine the parameters using EM method
� Expectation step: computes expectation of the likelihood of each data point Xi belonging to cluster Ci (vs. k-meanss)
March 3, 2011 Data Mining: Concepts and Techniques 103
� Maximization step: computes maximum likelihood estimates of the parameters
Conceptual Clustering
� Conceptual clustering
� Generates a concept description for each concept (class)
� Produces a hierarchical category or classification scheme
� Related to decision tree learning and mixture model learning
March 3, 2011 Data Mining: Concepts and Techniques 104
learning
� COBWEB (Fisher’87)
� A popular and simple method of incremental conceptual learning
� Creates a hierarchical clustering in the form of a classification tree
� Each node refers to a concept and contains a probabilistic description of that concept
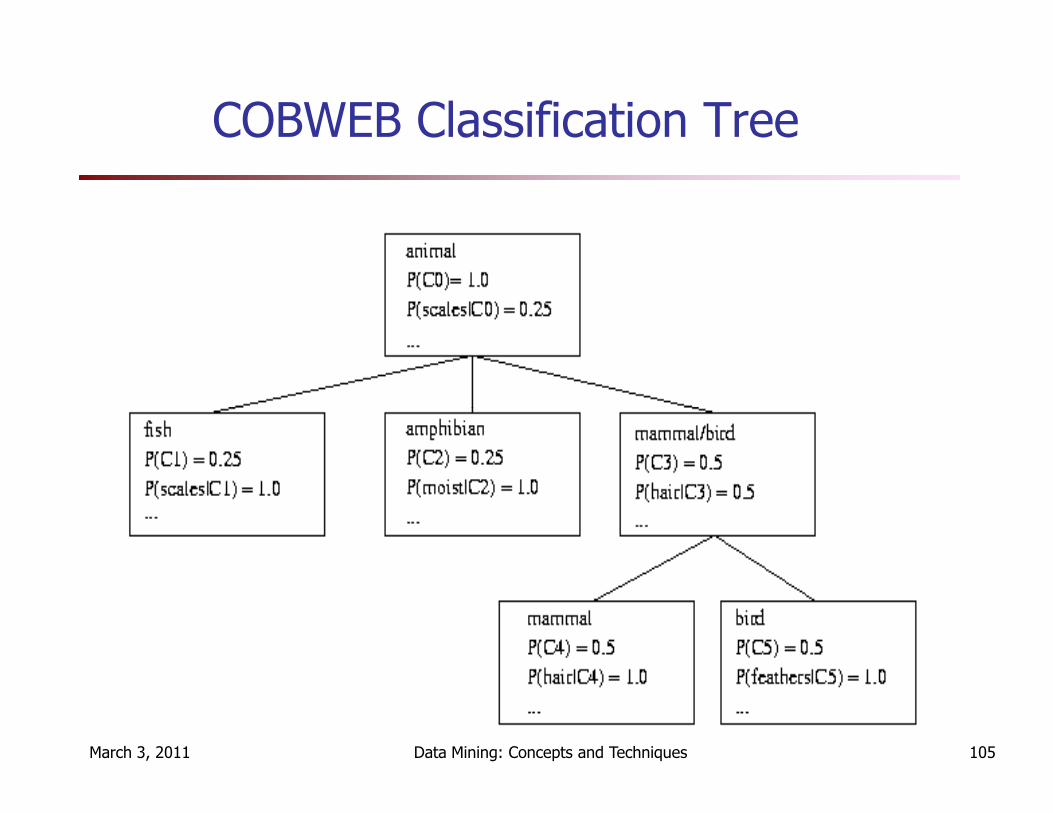
COBWEB Classification Tree
March 3, 2011 Data Mining: Concepts and Techniques 105

COBWEB: Learning the Classification Tree
� Incrementally builds the classification tree
� Given a new object
� Search for the best node at which to incorporate the object or add a new node for the objectthe object
� Update the probabilistic description at each node
� Merging and splitting
� Use a heuristic measure - Category Utility – to guide construction of the tree
March 3, 2011 Data Mining: Concepts and Techniques 106
COBWEB: Comments
� Limitations
� The assumption that the attributes are independent of
each other is often too strong because correlation may
exist
Not suitable for clustering large database – skewed tree
March 3, 2011 Data Mining: Concepts and Techniques 107
� Not suitable for clustering large database – skewed tree
and expensive probability distributions
Cluster Analysis
� Overview
� Partitioning methods
� Hierarchical methods
� Density-based methods
� Other methods
March 3, 2011 Data Mining: Concepts and Techniques 108
� Other methods
� Cluster evaluation
� Outlier analysis
Cluster Evaluation
� Determine clustering tendency of data, i.e. distinguish whether non-random structure exists
� Determine correct number of clusters� Evaluate how well the cluster results fit the data without external informationwithout external information
� Evaluate how well the cluster results are compared to externally known results
� Compare different clustering algorithms/results
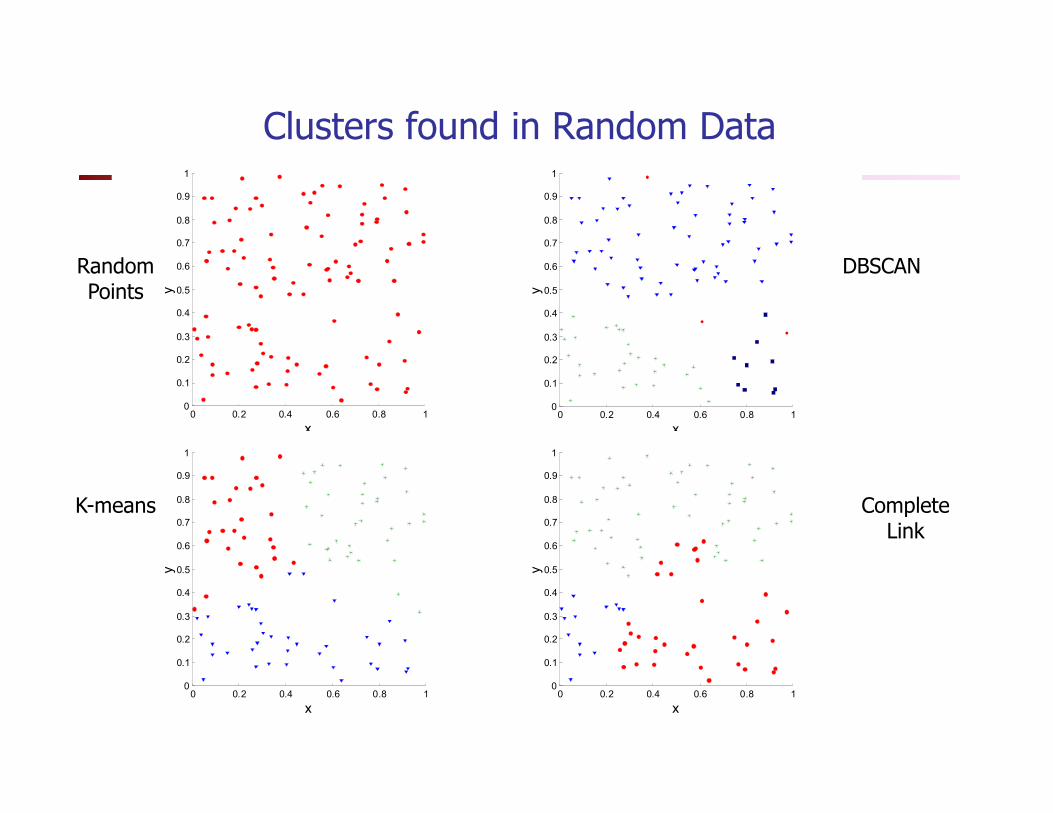
Clusters found in Random Data
0
0.1
0.2
0.3
0.4
0.5
0.6
0.7
0.8
0.9
1y
Random Points
0
0.1
0.2
0.3
0.4
0.5
0.6
0.7
0.8
0.9
1
y
DBSCAN
0 0.2 0.4 0.6 0.8 10
x
0 0.2 0.4 0.6 0.8 10
0.1
0.2
0.3
0.4
0.5
0.6
0.7
0.8
0.9
1
x
y
K-means
0 0.2 0.4 0.6 0.8 10
x
0 0.2 0.4 0.6 0.8 10
0.1
0.2
0.3
0.4
0.5
0.6
0.7
0.8
0.9
1
x
y
Complete Link
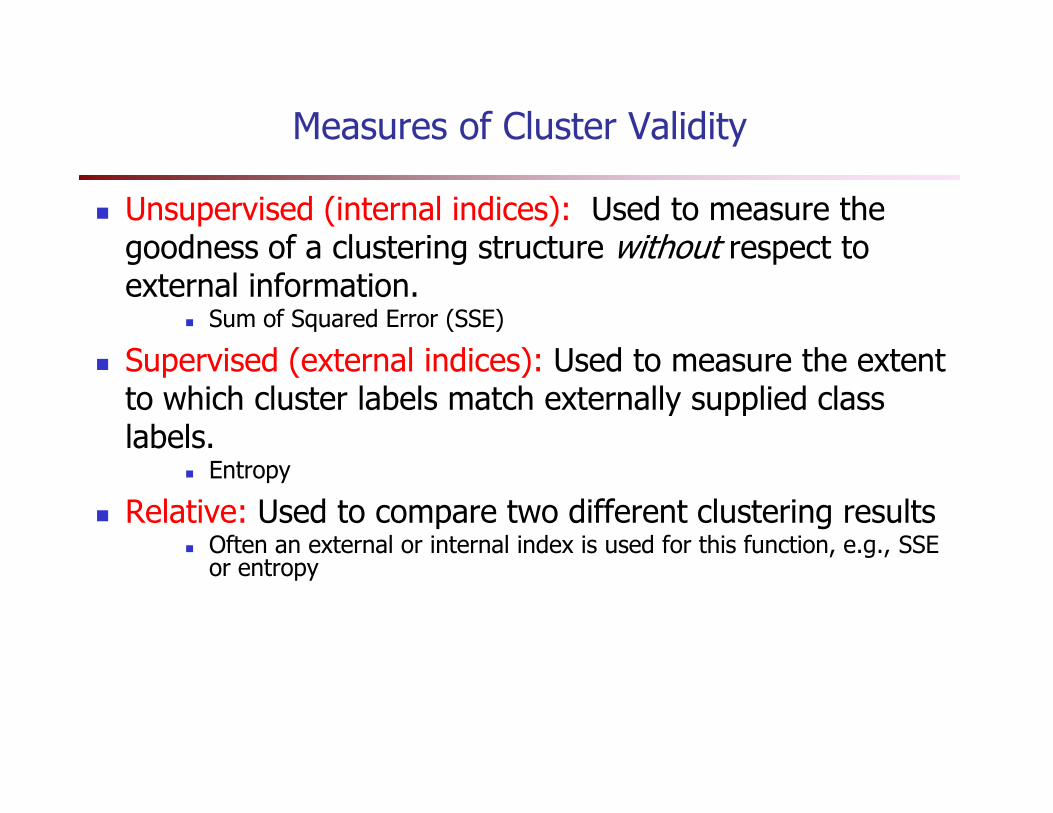
� Unsupervised (internal indices): Used to measure the goodness of a clustering structure without respect to external information.
� Sum of Squared Error (SSE)
� Supervised (external indices): Used to measure the extent to which cluster labels match externally supplied class
Measures of Cluster Validity
to which cluster labels match externally supplied class labels.
� Entropy
� Relative: Used to compare two different clustering results� Often an external or internal index is used for this function, e.g., SSE or entropy
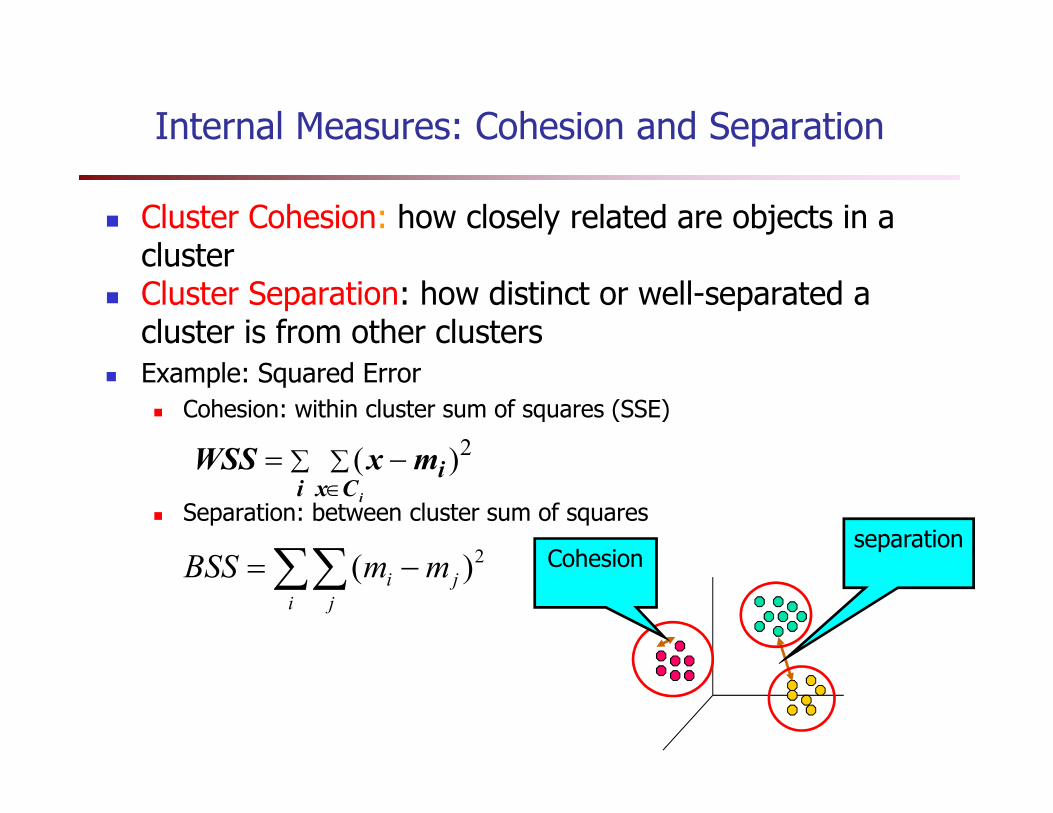
� Cluster Cohesion: how closely related are objects in a cluster
� Cluster Separation: how distinct or well-separated a cluster is from other clusters
� Example: Squared Error
� Cohesion: within cluster sum of squares (SSE)
Internal Measures: Cohesion and Separation
� Cohesion: within cluster sum of squares (SSE)
� Separation: between cluster sum of squares
∑ ∑∈
−=i Cx
ii
mxWSS2)(
∑∑ −=i j
ji mmBSS 2)(separation
Cohesion
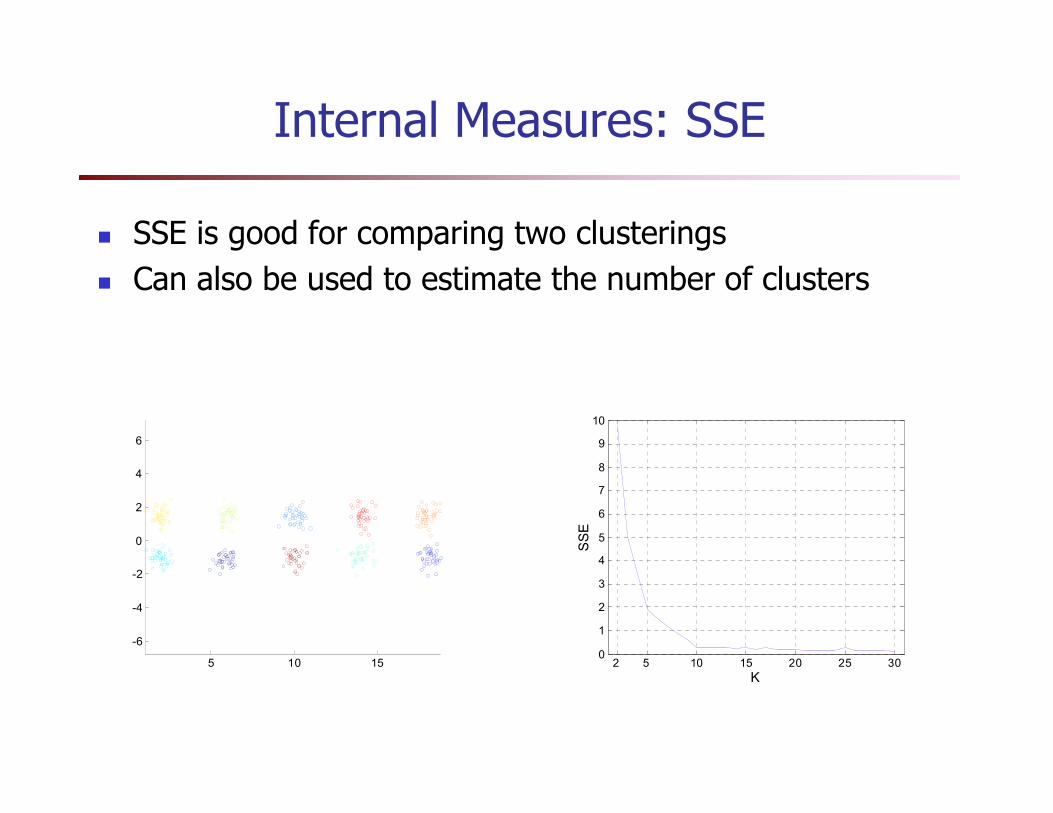
� SSE is good for comparing two clusterings
� Can also be used to estimate the number of clusters
Internal Measures: SSE
2 5 10 15 20 25 300
1
2
3
4
5
6
7
8
9
10
K
SSE
5 10 15
-6
-4
-2
0
2
4
6
Internal Measures: SSE
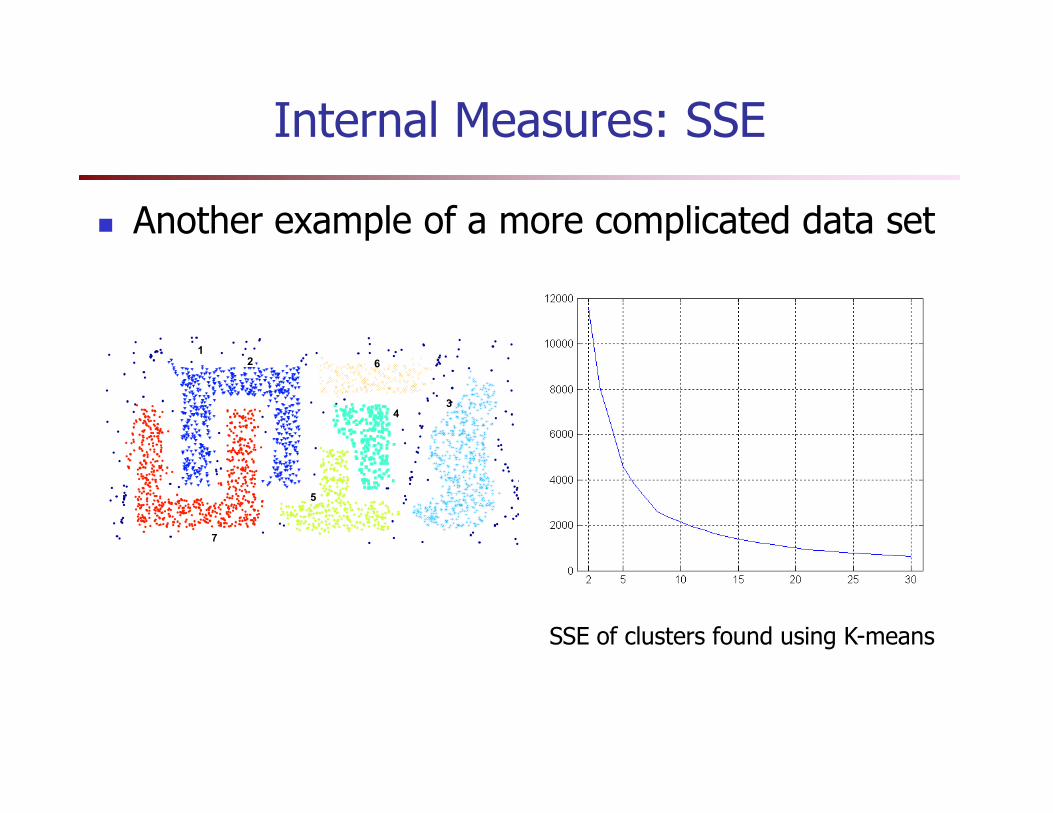
� Another example of a more complicated data set
1
2
3
6
3
5
4
7
SSE of clusters found using K-means
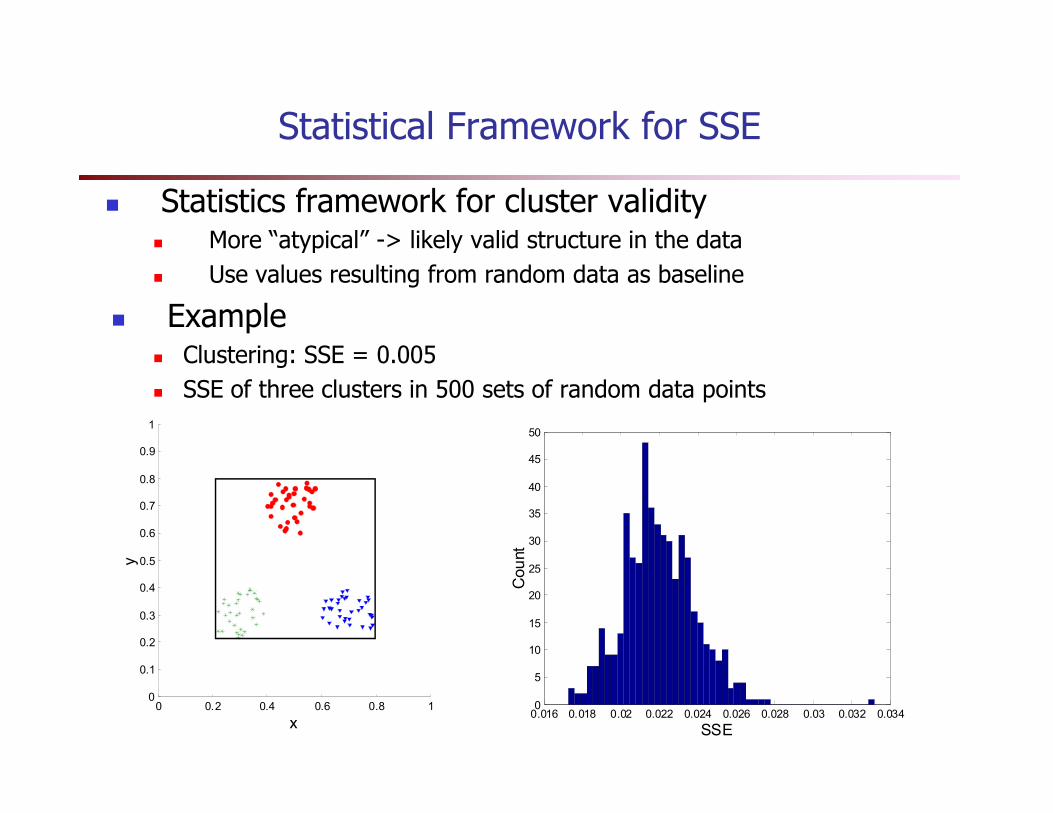
� Statistics framework for cluster validity� More “atypical” -> likely valid structure in the data
� Use values resulting from random data as baseline
� Example� Clustering: SSE = 0.005
� SSE of three clusters in 500 sets of random data points
Statistical Framework for SSE
0.016 0.018 0.02 0.022 0.024 0.026 0.028 0.03 0.032 0.0340
5
10
15
20
25
30
35
40
45
50
SSE
Count
0 0.2 0.4 0.6 0.8 10
0.1
0.2
0.3
0.4
0.5
0.6
0.7
0.8
0.9
1
x
y
External Measures
� Compare cluster results with “ground truth” or manually
clustering
� Classification-oriented measures: entropy, purity,
precision, recall, F-measures
� Similarity-oriented measures: Jaccard scores � Similarity-oriented measures: Jaccard scores
External Measures: Classification-Oriented Measures
� Entropy: the degree to which each cluster consists of
objects of a single class
� Precision: the fraction of a cluster that consists of objects
of a specified class
� Recall: the extent to which a cluster contains all objects � Recall: the extent to which a cluster contains all objects
of a specified class
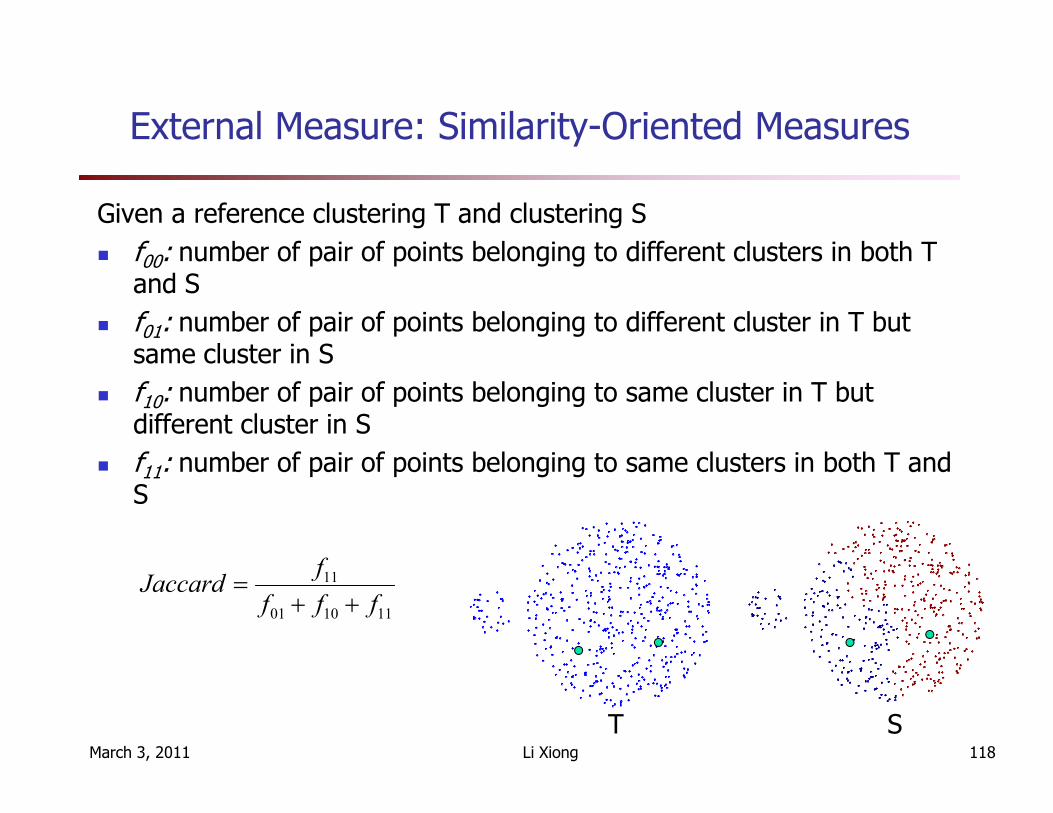
External Measure: Similarity-Oriented Measures
Given a reference clustering T and clustering S
� f00: number of pair of points belonging to different clusters in both T and S
� f01: number of pair of points belonging to different cluster in T but same cluster in S
� f10: number of pair of points belonging to same cluster in T but different cluster in S10
different cluster in S
� f11: number of pair of points belonging to same clusters in both T and S
March 3, 2011 Li Xiong 118
111001
11
fff
fJaccard
++=
T S
Cluster Analysis
� Overview
� Partitioning methods
� Hierarchical methods
� Density-based methods
� Other methods
March 3, 2011 Data Mining: Concepts and Techniques 119
� Other methods
� Cluster evaluation
� Outlier analysis