cloud condensation nuclei in polluted air and biomass
TRANSCRIPT
Atmos. Chem. Phys., 11, 2817–2836, 2011www.atmos-chem-phys.net/11/2817/2011/doi:10.5194/acp-11-2817-2011© Author(s) 2011. CC Attribution 3.0 License.
AtmosphericChemistry
and Physics
Cloud condensation nuclei in polluted air and biomass burningsmoke near the mega-city Guangzhou, China – Part 2: Size-resolvedaerosol chemical composition, diurnal cycles, and externally mixedweakly CCN-active soot particles
D. Rose1, S. S. Gunthe1, H. Su1, R. M. Garland1, H. Yang1, M. Berghof2, Y. F. Cheng2, B. Wehner2, P. Achtert2,A. Nowak2, A. Wiedensohler2, N. Takegawa3, Y. Kondo3, M. Hu4, Y. Zhang4, M. O. Andreae1, and U. Poschl1
1Biogeochemistry Department, Max Planck Institute for Chemistry, Mainz, Germany2Leibniz Institute for Tropospheric Research, Leipzig, Germany3RCAST, University of Tokyo, Tokyo, Japan4State Key Joint Laboratory of Environmental Simulation and Pollution Control, College of Environmental Sciences andEngineering, Peking University, Beijing, China
Received: 29 October 2010 – Published in Atmos. Chem. Phys. Discuss.: 9 November 2010Revised: 4 March 2011 – Accepted: 8 March 2011 – Published: 25 March 2011
Abstract. Size-resolved chemical composition, mixing state,and cloud condensation nucleus (CCN) activity of aerosolparticles in polluted mega-city air and biomass burningsmoke were measured during the PRIDE-PRD2006 cam-paign near Guangzhou, China, using an aerosol mass spec-trometer (AMS), a volatility tandem differential mobilityanalyzer (VTDMA), and a continuous-flow CCN counter(DMT-CCNC).
The size-dependence and temporal variations of the effec-tive average hygroscopicity parameter for CCN-active par-ticles (κa) could be parameterized as a function of organicand inorganic mass fractions (forg, finorg) determined by theAMS: κa,p=κorg · forg+ κinorg · finorg. The characteristicκvalues of organic and inorganic components were similarto those observed in other continental regions of the world:κorg≈0.1 andκinorg≈0.6. The campaign averageκa valuesincreased with particle size from∼0.25 at∼50 nm to∼0.4at ∼200 nm, whileforg decreased with particle size. At∼50 nm,forg was on average 60% and increased to almost100% during a biomass burning event.
The VTDMA results and complementary aerosol opticaldata suggest that the large fractions of CCN-inactive particlesobserved at low supersaturations (up to 60% atS≤0.27%)were externally mixed weakly CCN-active soot particleswith low volatility (diameter reduction<5% at 300◦C) and
Correspondence to:D. Rose([email protected])
effective hygroscopicity parameters aroundκLV≈0.01. Aproxy for the effective average hygroscopicity of the totalensemble of CCN-active particles including weakly CCN-active particles (κt) could be parameterized as a function ofκa,p and the number fraction of low volatility particles deter-mined by VTDMA (φLV ): κt,p=κa,p−φLV ·(κa,p−κLV ).
Based onκ values derived from AMS and VTDMA data,the observed CCN number concentrations (NCCN,S≈102–104 cm−3 atS = 0.068–0.47%) could be efficiently predictedfrom the measured particle number size distribution. Themean relative deviations between observed and predictedCCN concentrations were∼10% when usingκt,p, and theyincreased to∼20% when using onlyκa,p. The mean rela-tive deviations were not higher (∼20%) when using an ap-proximate continental average value ofκ≈0.3, although theconstantκ value cannot account for the observed temporalvariations in particle composition and mixing state (diurnalcycles and biomass burning events).
Overall, the results confirm that on a global and climatemodeling scale an average value ofκ≈0.3 can be used forapproximate predictions of CCN number concentrations incontinental boundary layer air when aerosol size distribu-tion data are available without information about chemicalcomposition. Bulk or size-resolved data on aerosol chemi-cal composition enable improved CCN predictions resolvingregional and temporal variations, but the composition dataneed to be highly accurate and complemented by informationabout particle mixing state to achieve high precision (relativedeviations<20%).
Published by Copernicus Publications on behalf of the European Geosciences Union.

2818 D. Rose et al.: CCN in polluted air and biomass smoke – Part 2
1 Introduction
Atmospheric aerosol particles serving as cloud condensa-tion nuclei (CCN) play an important role in the formation ofclouds and precipitation, and influence atmospheric chem-istry and physics, the hydrological cycle and climate (Prup-pacher and Klett, 1997; Seinfeld and Pandis, 2006; Lohmannand Feichter, 2005; IPCC, 2007; Heintzenberg and Charlson,2009).
Substantial progress has been made in recent years in un-derstanding the source processes that produce cloud-activeaerosols, the properties that enable aerosols to act as CCN,the effects of aerosols on cloud physics and precipitation,and the consequences for the climate system (Andreae andRosenfeld, 2008; Stevens and Feingold, 2009; Poschl et al.,2009, and references therein). To incorporate the effects ofCCN in meteorological models at all scales, from large eddysimulation (LES) to global climate models (GCM), knowl-edge of the spatial and temporal distribution of CCN in the at-mosphere is essential (Huang et al., 2007). Several studies re-ported CCN measurements from various regions around theworld (e.g.,Andreae, 2009; Andreae and Rosenfeld, 2008;Bougiatioti et al., 2009; Broekhuizen et al., 2006; Changet al., 2010; Dusek et al., 2006, 2010; Ervens et al., 2010;Gunthe et al., 2009; Hudson and Yum, 2002; Lance et al.,2009; Roberts et al., 2001, 2002, 2006; Shantz et al., 2010;Wang et al., 2008, 2010; Yum and Hudson, 2004; Yum et al.,2005). However, the actual influence and relative importanceof aerosol size distribution, chemical composition, and mix-ing state on the variability and predictability of CCN con-centrations remained a subject of continued discussion (e.g.,Broekhuizen et al., 2006; Dusek et al., 2006; Hudson, 2007;Cubison et al., 2008; Kuwata et al., 2008; Wang et al., 2008;Bougiatioti et al., 2009; Gunthe et al., 2009; Ervens et al.,2010; Juranyi et al., 2010; Rose et al., 2010a; Wex et al.,2010). Size-resolved measurements, long-term data sets,and uncertainty analyses of CCN modeling techniques areneeded to resolve these issues.
Part 1 of this study (Rose et al., 2010a) presented the CCNproperties of aerosol particles in polluted air and biomasssmoke near the mega-city Guangzhou, China, as measuredwithin the “Program of Regional Integrated Experiments ofAir Quality over the Pearl River Delta” intensive campaign inJuly 2006 (PRIDE-PRD2006). Different model approachesfor the prediction of the CCN number concentrations weretested. With aκ-Kohler model (Petters and Kreidenweis,2007) using the measured particle hygroscopicity and num-ber size distribution, the error in the prediction was on aver-age less than∼10%. Using a constant average hygroscopic-ity parameter (κ = 0.3) and variable size distributions as mea-sured, the deviations between observed and predicted CCNconcentrations were on average still less than 20%. Theseand other sensitivity tests in related studies (e.g.,Dusek et al.,2006; Gunthe et al., 2009; Juranyi et al., 2010) suggest thatthe variability in particle number and size are more impor-
tant than that in chemical composition and hygroscopicityfor predicting the variability of CCN concentrations in con-tinental boundary layer air. The mixing state of the particleswith regard to their hygroscopicity, however, seems to be im-portant for accurate CCN predictions (Medina et al., 2007;Cubison et al., 2008; Anttila, 2010; Ervens et al., 2010; Suet al., 2010; Wang et al., 2010). Especially since close to an-thropogenic sources aerosols typically comprise externallymixed carbonaceous particles (soot) with distinctive hygro-scopic properties (Cubison et al., 2008; Kuwata et al., 2007;Kuwata and Kondo, 2008; Wang et al., 2010).
In this manuscript, we use the same CCN data set fromthe Chinese mega-city Guangzhou as presented inRose et al.(2010a) to investigate whether including detailed informa-tion about aerosol chemical composition and mixing statefrom complementary measurements improve the predictabil-ity of CCN concentrations. For this purpose we apply datafrom aerosol mass spectrometry (AMS) and volatility tan-dem differential mobility analyzer (VTDMA) measurementsthat were performed in parallel to the CCN measurementsduring PRIDE-PRD2006.
In Sect.3.1, we show how AMS data can be used for ef-ficient prediction of the average effective hygroscopicity ofCCN-active particles, assuming internal mixing of inorganicand organic components (e.g.,Ervens et al., 2010; Cubisonet al., 2008; Gunthe et al., 2009). In Sect.3.2, we derive anapproximate averageκ value for externally mixed, weaklyCCN-active soot particles, and we address their influenceon the prediction of CCN concentrations. In Sect.3.3, wepresent diurnal cycles of CCN, AMS, VTDMA, and comple-mentary aerosol optical parameters, and we discuss how theyare linked to local and regional aerosol sources.
2 Methods
2.1 Measurement location
The measurements were performed duringthe period of 1–30 July 2006 in Backgarden(23.55◦ N, 113.07◦ E), a small village ∼60 km north-west of Guangzhou on the outskirts of the densely populatedcenter of the Pearl River Delta (PRD). Due to the prevailingmonsoon circulation at this time of year, the air massescame mainly from the south/southeast, making this sitea rural receptor site for the regional pollution resultingfrom the outflow of the city cluster around Guangzhou.For more information about the measurement location andmeteorological conditions seeGarland et al.(2008) andRose et al.(2010a).
Atmos. Chem. Phys., 11, 2817–2836, 2011 www.atmos-chem-phys.net/11/2817/2011/
D. Rose et al.: CCN in polluted air and biomass smoke – Part 2 2819
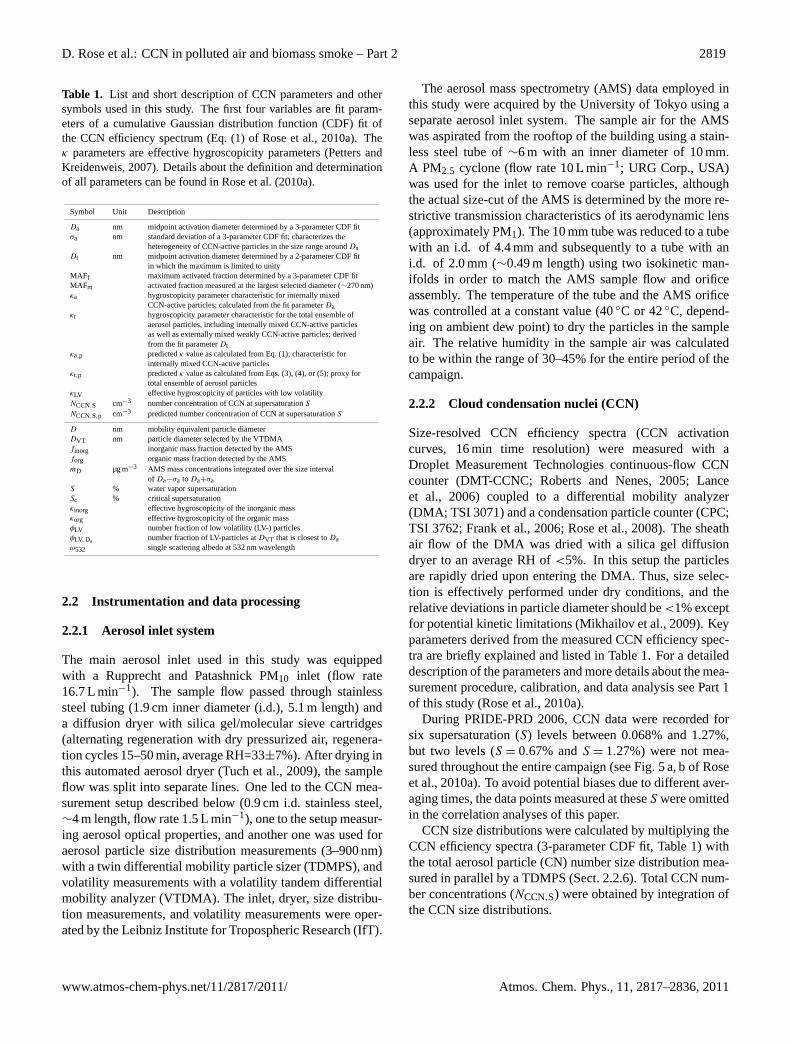
Table 1. List and short description of CCN parameters and othersymbols used in this study. The first four variables are fit param-eters of a cumulative Gaussian distribution function (CDF) fit ofthe CCN efficiency spectrum (Eq. (1) ofRose et al., 2010a). Theκ parameters are effective hygroscopicity parameters (Petters andKreidenweis, 2007). Details about the definition and determinationof all parameters can be found inRose et al.(2010a).
Symbol Unit Description
Da nm midpoint activation diameter determined by a 3-parameter CDF fitσa nm standard deviation of a 3-parameter CDF fit; characterizes the
heterogeneity of CCN-active particles in the size range aroundDaDt nm midpoint activation diameter determined by a 2-parameter CDF fit
in which the maximum is limited to unityMAFf maximum activated fraction determined by a 3-parameter CDF fitMAFm activated fraction measured at the largest selected diameter (∼270 nm)κa hygroscopicity parameter characteristic for internally mixed
CCN-active particles; calculated from the fit parameterDaκt hygroscopicity parameter characteristic for the total ensemble of
aerosol particles, including internally mixed CCN-active particlesas well as externally mixed weakly CCN-active particles; derivedfrom the fit parameterDt
κa,p predictedκ value as calculated from Eq. (1); characteristic forinternally mixed CCN-active particles
κt,p predictedκ value as calculated from Eqs. (3), (4), or (5); proxy fortotal ensemble of aerosol particles
κLV effective hygroscopicity of particles with low volatilityNCCN,S cm−3 number concentration of CCN at supersaturationS
NCCN,S,p cm−3 predicted number concentration of CCN at supersaturationS
D nm mobility equivalent particle diameterDVT nm particle diameter selected by the VTDMAfinorg inorganic mass fraction detected by the AMSforg organic mass fraction detected by the AMSmD µg m−3 AMS mass concentrations integrated over the size interval
of Da−σa to Da+σaS % water vapor supersaturationSc % critical supersaturationκinorg effective hygroscopicity of the inorganic massκorg effective hygroscopicity of the organic massφLV number fraction of low volatility (LV-) particlesφLV ,Da number fraction of LV-particles atDVT that is closest toDaω532 single scattering albedo at 532 nm wavelength
2.2 Instrumentation and data processing
2.2.1 Aerosol inlet system
The main aerosol inlet used in this study was equippedwith a Rupprecht and Patashnick PM10 inlet (flow rate16.7 L min−1). The sample flow passed through stainlesssteel tubing (1.9 cm inner diameter (i.d.), 5.1 m length) anda diffusion dryer with silica gel/molecular sieve cartridges(alternating regeneration with dry pressurized air, regenera-tion cycles 15–50 min, average RH=33±7%). After drying inthis automated aerosol dryer (Tuch et al., 2009), the sampleflow was split into separate lines. One led to the CCN mea-surement setup described below (0.9 cm i.d. stainless steel,∼4 m length, flow rate 1.5 L min−1), one to the setup measur-ing aerosol optical properties, and another one was used foraerosol particle size distribution measurements (3–900 nm)with a twin differential mobility particle sizer (TDMPS), andvolatility measurements with a volatility tandem differentialmobility analyzer (VTDMA). The inlet, dryer, size distribu-tion measurements, and volatility measurements were oper-ated by the Leibniz Institute for Tropospheric Research (IfT).
The aerosol mass spectrometry (AMS) data employed inthis study were acquired by the University of Tokyo using aseparate aerosol inlet system. The sample air for the AMSwas aspirated from the rooftop of the building using a stain-less steel tube of∼6 m with an inner diameter of 10 mm.A PM2.5 cyclone (flow rate 10 L min−1; URG Corp., USA)was used for the inlet to remove coarse particles, althoughthe actual size-cut of the AMS is determined by the more re-strictive transmission characteristics of its aerodynamic lens(approximately PM1). The 10 mm tube was reduced to a tubewith an i.d. of 4.4 mm and subsequently to a tube with ani.d. of 2.0 mm (∼0.49 m length) using two isokinetic man-ifolds in order to match the AMS sample flow and orificeassembly. The temperature of the tube and the AMS orificewas controlled at a constant value (40◦C or 42◦C, depend-ing on ambient dew point) to dry the particles in the sampleair. The relative humidity in the sample air was calculatedto be within the range of 30–45% for the entire period of thecampaign.
2.2.2 Cloud condensation nuclei (CCN)
Size-resolved CCN efficiency spectra (CCN activationcurves, 16 min time resolution) were measured with aDroplet Measurement Technologies continuous-flow CCNcounter (DMT-CCNC;Roberts and Nenes, 2005; Lanceet al., 2006) coupled to a differential mobility analyzer(DMA; TSI 3071) and a condensation particle counter (CPC;TSI 3762;Frank et al., 2006; Rose et al., 2008). The sheathair flow of the DMA was dried with a silica gel diffusiondryer to an average RH of<5%. In this setup the particlesare rapidly dried upon entering the DMA. Thus, size selec-tion is effectively performed under dry conditions, and therelative deviations in particle diameter should be<1% exceptfor potential kinetic limitations (Mikhailov et al., 2009). Keyparameters derived from the measured CCN efficiency spec-tra are briefly explained and listed in Table1. For a detaileddescription of the parameters and more details about the mea-surement procedure, calibration, and data analysis see Part 1of this study (Rose et al., 2010a).
During PRIDE-PRD 2006, CCN data were recorded forsix supersaturation (S) levels between 0.068% and 1.27%,but two levels (S = 0.67% andS = 1.27%) were not mea-sured throughout the entire campaign (see Fig. 5 a, b ofRoseet al., 2010a). To avoid potential biases due to different aver-aging times, the data points measured at theseS were omittedin the correlation analyses of this paper.
CCN size distributions were calculated by multiplying theCCN efficiency spectra (3-parameter CDF fit, Table1) withthe total aerosol particle (CN) number size distribution mea-sured in parallel by a TDMPS (Sect. 2.2.6). Total CCN num-ber concentrations (NCCN,S) were obtained by integration ofthe CCN size distributions.
www.atmos-chem-phys.net/11/2817/2011/ Atmos. Chem. Phys., 11, 2817–2836, 2011

2820 D. Rose et al.: CCN in polluted air and biomass smoke – Part 2
2.2.3 Aerosol mass spectrometry (AMS)
An Aerodyne quadrupole aerosol mass spectrometer (Q-AMS, referred to as “AMS” for brevity) was used to measurethe size-resolved chemical composition of non-refractory(∼600◦C) submicron aerosol particles (Jayne et al., 2000).The performance of the AMS during the PRIDE-PRD2006campaign is described in detail byTakegawa et al.(2009).The AMS data used in this study comprise a time series ofmass size distributions (dM/dlogDva, ∼10 min time resolu-tion) whereDva is the vacuum aerodynamic diameter (De-Carlo et al., 2004). The mass size distributions were calcu-lated for inorganic ions (SO2−
4 , NH+
4 , NO−
3 , Cl−) and organicmatter (Org) in the size range between 45 nm and 1.4 µm.
The mass concentration data of each size bin were aver-aged with the two adjacent size bins to minimize the influ-ence of noise. To make the size-resolved AMS results di-rectly comparable with the CCN and VTDMA measurementresults, all calculations and plots in this study using AMSdata were based on approximate mobility equivalent diame-ters that have been calculated by division of the AMS vac-uum aerodynamic diameter by a scaling factor of 1.7, whichis based on the assumption of an effective particle densityof 1.7 g cm−3 as reported for similar locations (Cheng et al.,2006; Zhang et al., 2009). Accordingly, the scaled AMSmass size distributions span a mobility diameter range of27 nm to 850 nm and in the remainder of this study we re-fer only to mobility equivalent diameters.
For further analysis, only the mass concentrations mea-sured at particle sizes> 50 nm were used. Below this size,the reliability of the AMS data was low due to the low de-tection efficiency of the instrument. Size-resolved mass frac-tions were calculated diameter-wise from the size distribu-tions of mass concentration. The mass fraction of one chem-ical component is its mass concentration divided by the sumof the masses of all AMS measured components at this di-ameter.
To describe the chemical composition of the particles ac-tivated at the midpoint of the CCN efficiency spectrum, theAMS mass concentrations were integrated over the size in-terval ofDa−σa to Da+σa (activation diameter± CDF stan-dard deviation). The mass concentrations within these in-tervals (mD) were used to calculate mass fractions of inor-ganic and organic components (finorg, forg) for further anal-ysis (e.g., correlation analysis). CCN efficiency spectra withDa−σa<50 nm were excluded from further analysis. Thus,all CCN efficiency spectra measured atS = 0.87% and a partof those atS = 0.47% were excluded in the correlation anal-ysis between CCN and AMS data.
Note that for a density correction factor lower than 1.7, themobility equivalent diameter range for the AMS data wouldbe linearly shifted to larger values. The effects on the predic-tion of hygroscopicity parameters (κa,p, Table1, Sect.3.1.2),however, would be small because the size dependence of thecomposition was generally small. For example, a density fac-
tor of 1.5 instead of 1.7 would change the average value ofκa,p by ∼1% at∼50 nm and by∼3% at∼200 nm.
2.2.4 Volatility measurements (VTDMA)
A volatility tandem differential mobility analyzer (VTDMA;Philippin et al., 2004) was used to measure the number sizedistributions of the non-volatile residuals of monodisperseparticles that were heated at 300◦C (7 selected diametersin the range of 30–220 nm; time resolution of 1 hour for acomplete cycle of 7 diameters). In polluted mega-city air,the material of submicrometer particles that is non-volatileat this temperature is considered to be mostly soot (Smithand O’Dowd, 1996; Burtscher et al., 2001; Kondo et al.,2006; Rose et al., 2006; Frey et al., 2008; Cheng et al., 2009;Wehner et al., 2009), which consists mainly of black or ele-mental carbon but may also contain some refractory organicmatter (Andreae and Gelencser, 2006; Poschl, 2005; Sadezkyet al., 2005).
In the VTDMA, the measured size distribution of non-volatile residuals usually separates into two or more modes.The mode which appears in the size range of the initiallyselected diameter represents particles of low volatility (di-ameter reduction<5% at 300◦C), denoted as “LV-particles”for brevity (Cheng et al., 2009; Wehner et al., 2009). Thenumber fraction of LV-particles (φLV ), i.e., their number con-centration divided by the total particle number concentration,can be interpreted as the fraction of externally mixed freshsoot particles. Particles with smaller residuals and largerfractions of volatile material (diameter reduction>5%) canbe regarded as aged and internally mixed soot particles(Cheng et al., 2009; Wehner et al., 2009).
For each VTDMA measurement cycle, a number size dis-tribution of LV-particles was calculated by multiplyingφLVwith the particle number (CN) size distribution (measuredby the TDMPS) at the diameters selected by the VTDMA(DVT). The resulting data points were fitted with a lognor-mal distribution for inter- and extrapolation.
2.2.5 Optical measurements (Nephelometer and PAS)
Total aerosol particle scattering coefficients at three differentwavelengths (λ = 450 nm, 550 nm, and 700 nm) were mea-sured with an integrating nephelometer (Model 3563, TSI)and the aerosol particle absorption coefficient at 532 nm wasdetermined with a photoacoustic spectrometer (PAS; DesertResearch Institute). The time resolution was 2 min for thenephelometer and 10 s for the PAS. The PAS data was aver-aged for two minutes to match the time scale of the neph-elometer. The single scattering albedo atλ=532 nm (ω532)was calculated from these parameters as described byGar-land et al.(2008) and was used to correlate with the CCNproperties. For more information on the aerosol optical prop-erties during this campaign seeGarland et al.(2008).
Atmos. Chem. Phys., 11, 2817–2836, 2011 www.atmos-chem-phys.net/11/2817/2011/

D. Rose et al.: CCN in polluted air and biomass smoke – Part 2 2821
2.2.6 Particle size distribution measurements (TDMPS)
The TDMPS (Twin differential mobility particle sizer) usedin the PRIDE-PRD2006 campaign was a custom-made in-strument from the IfT. In this instrument a combination oftwo DMAs and two CPCs is used to measure the particlesize distribution for a wider size range (here 3–900 nm) thantypical DMPS instruments do. For more information on op-eration, calibration, and uncertainties seeBirmili et al. (1999)andWiedensohler et al.(2010).
2.2.7 Time resolution and selected periods
For correlation analyses, the time resolution of the AMS, VT-DMA, and optical data sets was adjusted to the time resolu-tion of the CCN data. The AMS or VTDMA data point corre-sponding to a CCN data point was chosen to be the one thatis closest in time within a time interval of±10 min (AMS)or ±60 min (VTDMA). The optical data were averaged overthe time interval of one CCN measurement (16 min). If for aCCN data point no corresponding AMS, VTDMA, or opticaldata point was available, the CCN data point was discarded.
Due to the resulting different averaging intervals, the cam-paign averages calculated in this study may differ from thoseof Rose et al.(2010a). The CCN data set that was used inRose et al.(2010a) comprised measurements from 30 June to30 July 2006. The data set that was taken for the correlationanalyses in this study, however, comprised CCN measure-ments from 12/14 July to 30 July 2006 because of the limitedavailability of the AMS/VTDMA measurements. Since thesecond half of July was characterized by two polluted peri-ods (cf. Fig. 5 ofRose et al., 2010a), in this study, the aver-age particle hygroscopicity is lower and the average particlenumber size distribution is shifted to larger sizes comparedto the findings ofRose et al.(2010a).
The highly polluted period of 23 July 00:00 to 26 July12:59 is referred to as the “biomass burning event (BBE)”.As discussed in Part 1 of this study, this period was charac-terized by intense local biomass burning of plant waste bylocal farmers, which was visible in the vicinity of the mea-surement site. As inRose et al.(2010a), characteristic differ-ences between the BBE and the rest of the campaign are alsoaddressed in this manuscript.
3 Results and discussion
3.1 Aerosol chemical composition and effectivehygroscopicity of CCN-active particles
3.1.1 Observations and derivation ofκorg and κ inorg
Figure1 shows average aerosol mass size distributions of or-ganic matter and inorganic ions as determined by AMS mea-surements performed in parallel to the CCN measurements.Averaged over the campaign excluding the biomass burning
50 100 8000
5
10
15
20(a)
Org SO4 NH4 NO3 Cl
dM/d
logD
[µg
m-3]
D [nm]
50 100 8000
10
20
30
40
50
60(b)
dM/d
logD
[µg
m-3]
D [nm]
Fig. 1. Mass size distributions of organic and inorganic compoundsdetermined by aerosol mass spectrometry (AMS) averaged(a) overthe campaign excluding the biomass burning event (BBE), and(b) over the BBE plotted against the mobility equivalent particlediameter.
event (Fig.1a), the organic and the sulfate mass size dis-tribution peaked at mobility equivalent diameters of around220 nm and 250 nm, respectively. The mass size distributionsof the other inorganic ions also peaked around 250 to 300 nmbut at much lower concentration levels. The total mass con-centration in the investigated particle size range (50–850 nm)was∼(32± 29) µg m−3, and the contributions of individualcomponents are listed in Table2.
During the biomass burning event (BBE, Fig.1b), themass concentrations of all components were by a factor of∼2 higher than during the rest of the campaign. The masssize distributions of the inorganic ions were narrower withthe peak shifted to 300 to 350 nm. The mass size distri-bution of organic matter, however, exhibited two separatepeaks around 170 nm and 300 nm, respectively. In the smallparticle size range (<∼200 nm) only the organic mass con-centration increased during the BBE, whereas the inorganicion concentrations remained almost the same as during therest of the campaign.
www.atmos-chem-phys.net/11/2817/2011/ Atmos. Chem. Phys., 11, 2817–2836, 2011

2822 D. Rose et al.: CCN in polluted air and biomass smoke – Part 2
0.1
0.2
0.3
0.4
0.5
0.6
30 100 4000.0
0.2
0.4
0.6
0.8
1.0 Org Cl NO3 NH4 SO4
(a)
m
ass
frac
tion
D [nm]
observed κa
0.1
0.2
0.3
0.4
0.5
0.6
30 100 4000.0
0.2
0.4
0.6
0.8
1.0
mas
s fr
actio
n
D [nm]
(b)
observed κa
Fig. 2. Size distributions of mass fractions of organic and inor-ganic compounds (colored areas) determined by the AMS, and ob-served effective hygroscopicity parameter of CCN-active particles(κa, data points) averaged(a) over the campaign excluding the BBE,and(b) over the BBE. Data points are median values and error barsindicate inter-quartile ranges.
Figure 2 depicts the size distributions of the mass frac-tions of the individual chemical components averaged overthe campaign excluding the BBE and averaged over the BBE.For both the averaging periods, the ratio of inorganic to or-ganic mass increased with particle size. The larger particles(>∼200 nm) exhibited an inorganic mass fraction of 50–60%throughout the whole campaign, whereas for the smaller par-ticles (50–200 nm) the mass fractions during the BBE dif-fered a lot from those during the rest of the campaign (in-creasing organic mass fraction with decreasing size, up toalmost 100% during the BBE and up to only∼60% duringthe rest of the campaign).
In the same figure, the measured effective hygroscopicityparameterκa (characteristic for the CCN-active particles) isplotted versus the activation diameterDa (Table1). The scaleof theκ-axis is chosen so that it matches the scale of the massfraction according to the expected relationship between hy-groscopicity and chemical composition, that isκ = 0.1 for
Table 2. Average mass concentrations of organic matter and in-organic ions (arithmetic mean values± standard deviation) as ob-tained from AMS measurements integrated over a mobility equiv-alent particle size range of 50–850 nm for the entire campaign, forthe biomass burning event (BBE), and for the campaign excludingthe BBE.
Component Mass concentration [µg m−3]Entire BBE Campaign
campaign excl. BBE
Org 16.1±13.3 32.5±19.8 12.8±8.3SO4 12.8±9.2 20.7±7.6 11.3±8.7NH4 6.1±7.2 9.9±4.5 5.4±7.3NO3 1.8±1.9 3.0±2.4 1.5±1.6Cl 0.9±3.5 1.8±4.3 0.7±3.3
Total 37.8±35.0 67.9±38.7 31.7±29.3
aerosol that consists only of organic material andκ = 0.6 foraerosol consisting of only inorganic material. The approxi-mate average organicκ value of 0.1 is consistent with earlierstudies (e.g.,Gunthe et al., 2009; Dusek et al., 2010; Kinget al., 2010; Poschl, 2011, and references therein) and withinthe characteristic range for individual organic compoundsgoing from zero for insoluble species to∼0.3 for small solu-ble molecules such as oxalic acid (Petters and Kreidenweis,2007; Mikhailov et al., 2009).
Figure2b shows that during the BBE, theκ data points fol-low the border between inorganic and organic mass fraction.This can be expected when assuming a simple approximativemixing rule forκ (Gunthe et al., 2009; Dusek et al., 2010).The predictedκa value for particles of a certain size is:
κa,p ≈ κorg·forg+κinorg·finorg≈ 0.1·forg+0.6·finorg (1)
with κorg and κinorg being the effective hygroscopicity pa-rameters for organic and inorganic components, andforg andfinorg being the organic and inorganic mass fractions at par-ticle diameterD, respectively. By definition, the mixing rulefor theκ values of different particle components refers to vol-ume fractions, but mass fractions can be used for first-orderapproximations (Kreidenweis et al., 2008, 2009) assumingthat the densities of individual components are similar to theoverall particle density, which is reasonable for particles con-sisting mostly of organics and sulfate (Gunthe et al., 2009).
In contrast, theκ values in the plot of the campaign av-erage excluding the BBE (Fig.2a) did not follow the linebetween inorganic and organic mass fraction as well. Thehygroscopicity increased with particle size as did the inor-ganic mass fraction, but forD > 60 nm the observedκa washigher than the expected hygroscopicity. This inconsistencycan be partly attributed to the large number of data pointswith low mass concentrations that go into the campaign av-erage and make the AMS data less reliable. For the BBE, thisis not the case since the mass concentrations were generallymuch higher.
Atmos. Chem. Phys., 11, 2817–2836, 2011 www.atmos-chem-phys.net/11/2817/2011/

D. Rose et al.: CCN in polluted air and biomass smoke – Part 2 2823
0.0 0.2 0.4 0.6 0.8 1.00.0
0.1
0.2
0.3
0.4
0.5
0.6
0.7
ob
serv
ed κ
a
forg
Fig. 3. Correlation between the observed effective hygroscopic-ity parameter of CCN-active particles (κa) and the organic massfraction (forg) determined by size-resolved AMS measurements forthe entire campaign. Data points at whichmD < 1 µg m−3 areexcluded. Red dots indicate the data points measured during theBBE. The blue line is a linear least squares fit with the follow-ing equation, correlation coefficient, and number of data points:y = 0.64−0.54·x, R2
= 0.57,n = 379.
To investigate the relationship between chemical com-position and hygroscopicity of the aerosol particles morespecifically, we correlated the observedκa values obtainedfor every measured CCN efficiency spectrum with the mea-sured organic mass fraction (forg). When we performed thisfor all data points only a poor correlation could be found(R2
= 0.44). This was most likely due to the large amount ofdata points for which the mass within the integration interval(mD, see Sect.2.2.3) was very low (40% of the data pointsexhibitedmD < 1 µg m−3), which negatively impacted the re-liability of forg. The correlation shown in Fig.3 consiststherefore only of data points withmD≥1 µg m−3, which im-proved the fit (R2
= 0.57, n = 379). Extrapolation of the fitline toforg= 0 yieldedκinorg= 0.64±0.01 for the inorganicfraction, which is characteristic for ammonium sulfate andrelated compounds (Petters and Kreidenweis, 2007; Roseet al., 2008). Extrapolation of the fit line toforg = 1 yieldedκorg = 0.10± 0.02 for the organic fraction. This is similarto the average hygroscopicity parameters found in field mea-surements and chamber studies of secondary organic aerosol(SOA) (King et al., 2009; Gunthe et al., 2009; Dusek et al.,2010). Apparently, the differences between more and lesswater-soluble and hygroscopic organic compounds presentin SOA and primary organic aerosols (POA, e.g., carboxylicacids, levoglucosan, polyfunctional aliphatic and aromatichydrocarbons, proteins) tend to cancel out in the course ofatmospheric mixing and chemical aging.
0.0 0.1 0.2 0.3 0.4 0.5 0.6 0.70.0
0.1
0.2
0.3
0.4
0.5
0.6
0.7
κ a,p
observed κa
Fig. 4. Effective hygroscopicity parameters predicted from the or-ganic and inorganic mass fractions determined by AMS measure-ments (κa,p, Eq. (1)) plotted against the values obtained from theCCN measurements (κa) observed for the entire campaign. Notethat the data points at whichmD < 1 µg m−3 are included. Red dotsindicate the data points measured during the BBE. The diagonalgrey line indicates the 1:1 ratio.
3.1.2 Prediction ofκa and NCCN,S
In Fig. 4 theκ values predicted from the AMS measurementdata (κa,p, calculated from Eq.1) are plotted against theκvalues derived from the 3-parameter CDF fits to the mea-sured CCN efficiency spectra (observedκa). Note that in thisplot all data points are shown including the ones for whichmD < 1 µg m−3. The equation of a linear fit through the datapoints would bey = 0.53x +0.15 and as expected from theabove findings,κa,p and the observedκa exhibit a weak cor-relation (R2
= 0.44) due to numerous outliers. They mostlycorrespond to values for whichmD < 1 µg m−3, which sug-gests that the outliers can be mainly attributed to unreliableAMS data due to low mass concentrations. They may alsoresult from different and temporally varying molecular com-position and hygroscopic properties of the organic fractionof the investigated aerosols. In the most frequent range ofκ values (0.25 to 0.55;∼80% of all data points), the pre-dicted values deviate from the observed ones on average byless than 20%. For smaller values,κa,p is generally largerthan the observedκa (by up to 100% and more), whereas forlarger values it is mainly smaller (by up to a few tens of per-cent).
For each data point of Fig.4, the total CCN number con-centration (NCCN,S) was calculated by integrating the mea-sured CN size distribution above the critical dry particle di-ameter for CCN activation that corresponds to the given val-ues ofκa,p andS. In spite of the low correlation betweenthe predicted and observedκa, the mean relative deviations
www.atmos-chem-phys.net/11/2817/2011/ Atmos. Chem. Phys., 11, 2817–2836, 2011

2824 D. Rose et al.: CCN in polluted air and biomass smoke – Part 2
Table 3. Arithmetic means of the observedκa and NCCN,S values, and characteristic deviations between predicted values (κa,p andNCCN,S,p) and those observed (relative bias and total relative deviation, including systematic and statistical errors) for the entire campaign.nκ andnN are the number of data points that are contained in the averages ofκa,p andNCCN,S,p, respectively.
S κa κa,p, Eq. (1) nκ NCCN,S NCCN,S,p with κa,p NCCN,S,p with κ = 0.3 nNrel. bias rel. dev. rel. bias rel. dev. rel. bias rel. dev.
[%] [%] [%] [cm−3] [%] [%] [%] [%]
0.068 0.42 −7.6 14.3 229 1130 +34.0 34.5 +7.9 19.1 1760.27 0.36 −2.3 20.5 229 6529 +14.0 16.0 +11.6 19.6 1790.47 0.28 +15.6 29.1 173 8748 +13.1 14.5 +15.3 16.9 151all 0.36 +0.7 20.6 631 +20.7 22.0 +11.4 18.6 506
between theNCCN,S predicted on the basis ofκa,p (NCCN,S,p,Eq. 1, Table 3) and the observed values ofNCCN,S weremostly less than 20% with a positive bias on average. Thisconfirms the relatively low sensitivity ofNCCN,S,p againstκas discussed already inRose et al.(2010a).
In Table3 is shown that the over-prediction ofNCCN,S,pcompared to the observedNCCN,S becomes larger with de-creasing supersaturation, which has been also found, e.g.,in Rose et al.(2010a), Wex et al.(2010), andGunthe et al.(2009). This confirms that the prediction ofNCCN,S is gener-ally less robust at lowS, which is due to the enhanced errorsensitivity caused by the steep slope of the aerosol size dis-tribution typically observed at the large activation diameterscorresponding to low supersaturations (Ervens et al., 2007)and also to the stronger influence of externally mixed weaklyCCN-active particles at largeD and lowS (Figs. 2–3 ofRoseet al., 2010a). Alternatively or in addition the changing de-gree of over-prediction with changing supersaturation maybe caused by different solubility of the particles and surfacetension effects.
Table3 also shows theNCCN,S,p calculated for the samedata set using a constantκ of 0.3 (which is the campaign av-erage value forκt (Table1)) similar to the analysis performedby Rose et al.(2010a). It is remarkable that the average devi-ations between predicted and observed values ofNCCN,S arelower for the constantκ (19%) than when using the com-position dependentκa,p (22%), especially for the smallestsupersaturation (19% versus 35% relative deviation). Thesame result was found byGunthe et al.(2009) for a data setfrom pristine tropical rainforest air of Amazonia. It confirmsthatκa,p is not sufficient to predictNCCN,S well, if a signif-icant fraction of externally mixed weakly CCN-active parti-cles is present as observed for this data set. The parameterκatends to overestimate the effective overall hygroscopicity ofthe ensemble of aerosol particles, because it describes onlythe hygroscopicity of the internally mixed CCN-active parti-cles but does not account for the low hygroscopicity of theexternally mixed weakly CCN-active particles in the ensem-ble (Rose et al., 2010a). This is also in accordance withWexet al. (2010) who concluded that the hygroscopicity derivedfrom AMS data alone is not sufficient for accurate prediction
of NCCN,S, and that it is important to determine the separatefraction of aerosol particles with low hygroscopicity.
3.2 CCN activity of low volatility particles (externallymixed soot)
3.2.1 Observations and derivation ofκLV
As stated inRose et al.(2010a), the CCN efficiency spectraobserved at low supersaturations (S≤0.27%) did not reachfull activation. This indicates the presence of externallymixed weakly CCN-active particles which were of muchlower hygroscopicity and therefore activated only at highersupersaturation (Su et al., 2010).
Figure5 shows the non-activated fraction (1–MAFf ; Ta-ble 1) plotted againstDa+3σa, which is the smallest parti-cle size at which the CCN spectrum reaches MAFf . In thesame figure, the number fraction of low volatility particles(φLV ) is plotted against the initial diameter selected by theVTDMA ( DVT). From 30 to 220 nm,φLV increased from0.02 to 0.25. The non-activated fraction, 1–MAFf , followedalmost exactly the same trend and increased from 0.05 to0.27 over the diameter range of 55 to 230 nm. This coin-cidence suggests that the non-activated fraction may consistof fresh soot particles, as discussed and corroborated in thefollowing.
Figure 6 depicts the campaign median number size dis-tributions of total CN, of the low volatility (LV-) particles,and of the non-activated particles atS = 0.068% (CCN sizedistribution atS = 0.068% subtracted from CN size dis-tribution). The CN size distribution is monomodal andpeaks around 90 nm with a maximum value of 20 000 cm−3
per logarithmic decade of particle diameter. The numbersize distribution of LV-particles peaks around 110 nm witha maximum value of 2500 cm−3. The size distribution ofthe non-activated particles atS = 0.068% follows for parti-cles larger thanDa+3σa exactly the distribution of the LV-particles and for particles smaller thanDa−3σa the distri-bution of CN. In the range betweenDa+3σa andDa−3σa(indicated by the dotted blue vertical lines), the particle acti-vation occurs and thus the size distribution of non-activated
Atmos. Chem. Phys., 11, 2817–2836, 2011 www.atmos-chem-phys.net/11/2817/2011/

D. Rose et al.: CCN in polluted air and biomass smoke – Part 2 2825
2 0 1 0 0 3 0 00 . 0
0 . 1
0 . 2
0 . 3
0 . 4
C C N C ( 1 - M A F f v s . D a + 3 σa ) V T D M A ( φL V v s . D V T )
numb
er fra
ction
D [ n m ]Fig. 5. Black symbols: number fraction of particles with lowvolatility (φLV ) plotted versus the particle size selected by the VT-DMA (DVT ). Red symbols: number fraction of particles that arenot CCN-active within the investigated size range (1–MAFf ) plot-ted versus the smallest particle size at which the CCN spectrumreaches MAFf (Da+3σa); each symbol stands for each supersatu-ration. Symbols are median values throughout the campaign, errorbars extend to lower and upper quartiles.
1 1 0 1 0 0 1 0 0 01 0 0
1 0 0 0
1 0 0 0 0
C N L V - p a r t i c l e s n o n - a c t i v a t e d p a r t i c l e s
a t S = 0 . 0 6 8 %
dN / d
logD [
cm-3 ]
D [ n m ]
Fig. 6. Campaign median number size distributions of CN (black),of the externally mixed LV-particles (red), and of the non-activatedparticles atS = 0.068% (green). The blue solid line indicates wherethe median activation diameterDa is located. The blue dashed linesdenote the location ofDa−3σa andDa+3σa.
particles jumps from following the LV-particle size distribu-tion to following the CN size distribution. This figure in-dicates that the particles larger than∼250 nm that do notactivate atS = 0.068% represent the LV-particles measuredby the VTDMA, which can be regarded as fresh externallymixed soot particles. They do not activate at this supersat-uration because they are not sufficiently hygroscopic. Theparticles smaller than∼250 nm are too small to activate evenif they are more hygroscopic.
0 . 0 0 . 1 0 . 2 0 . 3 0 . 4 0 . 50 . 5
0 . 6
0 . 7
0 . 8
0 . 9
1 . 0( a )
MAF m
f L V , 2 2 0
0 . 6 5 0 . 7 0 0 . 7 5 0 . 8 0 0 . 8 5 0 . 9 0 0 . 9 5 1 . 0 00 . 40 . 50 . 60 . 70 . 80 . 91 . 01 . 1( b )
MAF m
w 5 3 2
Fig. 7. Correlation between(a) the number fraction of activated par-ticles at 270 nm (MAFm) for S = 0.068% and the number fractionof LV-particles at 220 nm (φLV ,220) and(b) MAFm for S = 0.068%and the single scattering albedo (ω532). The red lines are linear leastsquares fit lines through the data points with the following equa-tion, correlation coefficient, and number of data points: (a)y =
0.986−0.997x, R2= 0.47, n = 170; and (b)y = −0.55+1.53x,
R2= 0.57,n = 192. The grey line in (a) is to guide the eye.
In Fig. 7a the number fraction of 270 nm particles thatactivate atS = 0.068% (MAFm) is plotted versus the num-ber fraction of LV-particles at 220 nm as determined by theVTDMA ( φLV ,220). In the CCN measurements, the 270 nmsize bin was the largest size selected. For all supersatura-tions, the measured CCN efficiency spectra were not any-more raising at this size but reached a plateau level (MAFm;cf. Fig. 3 of Rose et al., 2010a). In the VTDMA measure-ments, the 220 nm size bin is the largest size selected. It canbe assumed thatφLV measured at this size is comparable toφLV at 270 nm, as seen from comparing the LV-particle sizedistribution with the CN size distribution (Fig.6).
www.atmos-chem-phys.net/11/2817/2011/ Atmos. Chem. Phys., 11, 2817–2836, 2011

2826 D. Rose et al.: CCN in polluted air and biomass smoke – Part 2
The correlation plot in Fig.7a shows that MAFm decreasedwith increasingφLV with a linear least squares fit (red line)that is close to the 1:(-1) line. This is another indicator thatthe particles with a size of 270 nm that did not activate atS =
0.068% corresponded to the LV-particles at that size. Sincethey were not activated at 0.068% supersaturation they musthave had a hygroscopicity of less thanκ = 0.15 (Eq. (2) ofRose et al., 2010a).
Figure7b shows that MAFm also correlated with the sin-gle scattering albedo of the investigated aerosol in the greenwavelength range (ω532; R2
= 0.57).ω532 is inversely relatedto the proportion of light absorbing material in the aerosol,which in the case of an urban-derived aerosol consists mostlyof soot (black carbon). This supports that the non-activatedparticle fraction is related to the soot content of the aerosol.
Assuming that the difference between MAFm and (1-φLV ,220) approximately corresponds to the fraction of LV-particles that can be activated at a given supersaturation, weused the following equation to calculate CCN efficiencies forthe LV-particles (that is, a CCN efficiency spectrum for freshsoot particles):(
NCCN
NCN
)LV
=MAFm−
(1−φLV ,220
)φLV ,220
(2)
A similar approach has been already used byKuwata et al.(2007).
In Fig. 8a, the campaign median values of the CCN ef-ficiency of LV-particles calculated according to Eq. (2) areplotted against the supersaturation. The data point atS =
0.068% is slightly negative. The deviation from zero iswithin the range of measurement uncertainties, and it mightalso be influenced by deviations from the assumption thatthe LV-particles correspond to the non-activated particles.At S = 0.87%, the CCN efficiency of the LV-particles ap-proaches unity. To obtain an effective average value for thecritical supersaturation of CCN activation, the data pointswere fitted with a 3-parameter CDF, which yielded a mid-point value (critical supersaturation) ofSc = 0.26% corre-sponding to aκ value of 0.009 (Eq. (2) ofRose et al., 2010a).An alternative fit through all individual data points of thecampaign (non-averaged) yieldedSc = 0.25% correspondingto κ = 0.010.
Due to the few available levels of supersaturation, the CDFfits are not very well constrained, but the range of possi-ble midpoint values is limited toSc = 0.068%–0.27% cor-responding toκ = 0.15–0.008. Hence, we applied linearinterpolation between these two data points as an alterna-tive approach for calculating approximate midpoint valuesof Sc = 0.22% andκ = 0.013 (at(NCCN/NCN)LV = 0.5).
From both of these fits (CDF and linear fit), an approxi-mate average value for the effective hygroscopicity of freshsoot particles ofκLV≈0.01 can be derived from our CCN andVTDMA measurement data. This value is slightly lowerbut close to the ones thatWex et al. (2010) derived from
0 . 0 0 . 2 0 . 4 0 . 6 0 . 8 1 . 0- 0 . 4- 0 . 20 . 00 . 20 . 40 . 60 . 81 . 01 . 2
(NCC
N / NCN
) LV
S [ % ]
( a )
0 . 0 0 1 0 . 0 1 0 . 1 0 . 30 . 00 . 20 . 40 . 60 . 81 . 01 . 2
H(k,
270 n
m)LV
k
( b )
Fig. 8. (a)CCN efficiencies plotted against supersaturation and(b)cumulative hygroscopicity distribution for LV-particles of 270 nmplotted against the hygroscopicity parameter,κ. Black data pointsare campaign median values of the data points calculated by Eq. (2),error bars extend to their lower and upper quartiles. The red line is a3-parameter CDF fit to the black data points and the red cross is thepoint of (a) the midpoint supersaturation and(b) the median valueof κ obtained from the fit. The dashed blue line represents an alter-native approach (linear interpolation) for calculating approximatemidpoint values (blue cross).
hygroscopicity tandem DMA (HTDMA) data for the lowhygroscopicity particle fraction in urban and rural aerosols(κ = 0.02–0.04).
Figure8b shows the cumulative hygroscopicity distribu-tion for the LV-particles at 270 nm,H(κ,270nm)LV = 1−
(NCCN/NCN)LV . As explained inSu et al.(2010), H(κ,D)
corresponds to the fraction of particles with an effective hy-groscopicity parameter smaller than theκ value plotted onthe x-axis. TheS values of Fig.8a were converted into thecorrespondingκ values of Fig.8b using Eq. (2) ofRose et al.(2010a). The figure illustrates the spread of the LV-particles’effective hygroscopicity with a median value nearκLV≈0.01,which will be used for further analyses.
Atmos. Chem. Phys., 11, 2817–2836, 2011 www.atmos-chem-phys.net/11/2817/2011/

D. Rose et al.: CCN in polluted air and biomass smoke – Part 2 2827
0 . 0 0 . 1 0 . 2 0 . 3 0 . 4 0 . 5 0 . 6 0 . 70 . 00 . 10 . 20 . 30 . 40 . 50 . 60 . 7( a )
k t,p
(CCN
)
k t o b s e r v e d
0 . 0 0 . 1 0 . 2 0 . 3 0 . 4 0 . 5 0 . 6 0 . 70 . 00 . 10 . 20 . 30 . 40 . 50 . 60 . 7( b )
k t,p (V
T)
k t o b s e r v e d
0 . 0 0 . 1 0 . 2 0 . 3 0 . 4 0 . 5 0 . 6 0 . 70 . 00 . 10 . 20 . 30 . 40 . 50 . 60 . 7( c )
k t,p (V
T, AM
S)
k t o b s e r v e d
Fig. 9. Correlation plot of(a) the predictedκt as calculated from theCCN data (MAFm) and Eq. (3) (κt,p(CCN)) versus the observedκt,(b) the predictedκt as calculated from the VTDMA data (φLV ,220)and Eq. (4) (κt,p(VT)) versus the observedκt, and(c) the predictedκt as calculated from the VTDMA data (φLV ,220), AMS data (forg,finorg), and Eq. (5) (κt,p(VT,AMS)) versus the observedκt. Thegrey lines are the 1:1 lines and the red lines are linear least squaresfit lines through the data points with the following equation, corre-lation coefficient, and number of data points:(a) y = 0.02+0.94x,R2
= 0.94,n = 656;(b) y = 0.03+0.91x, R2= 0.89,n = 656; and
(c) y = 0.13+0.55x, R2= 0.52,n = 409.
3.2.2 Prediction ofκ t and NCCN,S
With the derived hygroscopicity for low volatility particles(κLV≈0.01) and the CCN measurement results we infer aproxy for the effective average hygroscopicity of the total en-semble of aerosol particles, including internally mixed CCN-active particles as well as externally mixed weakly CCN-active particles (κt) as follows:
κt,p(CCN) = κa·MAFm+κLV ·(1−MAFm) (3)
in whichκa is the observed effective hygroscopicity of CCN-active particles and MAFm the measured number fraction ofCCN-active particles at 270 nm.
In Fig. 9a, κt,p is plotted versus the observedκt. Thetwo variables exhibited a very good correlation (R2
= 0.94),wherebyκt was slightly over-predicted for small values andslightly under-predicted for large values. This plot showsthat κt,p can be successfully derived from knowledge ofthe effective hygroscopicity of CCN-active (κa) and weaklyCCN-active particles (κLV ) on the assumption that 1–MAFmcomprises the fraction of CCN-inactive particles at a cer-tain supersaturation. It confirms thatκt is indeed a suitableproxy for the effective hygroscopicity of an external mixtureof CCN-active and weakly CCN-active particles (seeRoseet al., 2010b).
Assuming that the fraction of CCN-inactive particles ata certain supersaturation equals the fraction of LV-particles(1–MAFm≈φLV ), we infer theκt,p value using the VTDMAmeasurement results as follows:
κt,p(VT) = κa·(1−φLV ,Da
)+κLV ·φLV ,Da
= κa−φLV ,Da(κa−κLV ) (4)
in which κa is the observed effective hygroscopicity of in-ternally mixed CCN- active particles andφLV ,Da the numberfraction of LV-particles withDVT close to the activation di-ameterDa.
In Fig. 9b, κt,p calculated from Eq. (4) is plotted versusthe observedκt. The two variables exhibited still a very goodcorrelation (R2
= 0.89), withκt being slightly over-predictedfor small values and slightly under-predicted for large values.It shows thatκt,p can be successfully derived from knowledgeof the effective hygroscopicity of the internally mixed CCN-active particles (κa) and of the externally mixed low volatilityparticles (κLV ), as well as the mixing state. Note that therelative deviation between the predicted and the measuredκtbecame a little larger when MAF decreased but not whenφLVincreased.
In the next step, we predictκt only from information aboutthe size-resolved chemical composition of the particles andthe mixing state, i.e., we use the AMS and VTDMA mea-surement results but no CCN data.κt,p is then calculated by:
www.atmos-chem-phys.net/11/2817/2011/ Atmos. Chem. Phys., 11, 2817–2836, 2011

2828 D. Rose et al.: CCN in polluted air and biomass smoke – Part 2
Table 4. Arithmetic means of the observedκt andNCCN,S values, and characteristic deviations between predicted values (κt,p andNCCN,S,p)and those observed (relative bias and total relative deviation, including systematic and statistical errors) for the entire campaign.nκ andnNare the number of data points that are contained in the averages ofκt,p andNCCN,S,p, respectively. Note that comparable values from Table3might differ from the ones in this table due to different averaging periods.
S κt κt,p(VT,AMS), Eq. (5) nκ NCCN,S NCCN,S,p with κt,p(VT,AMS) NCCN,S,p with κ = 0.3 nNrel. bias rel. dev. rel. bias rel. dev. rel. bias rel. dev.
[%] [%] [%] [cm−3] [%] [%] [%] [%]
0.068 0.32 +1.0 14.6 155 1214 +10.5 15.2 +8.0 18.2 1160.27 0.33 −1.4 21.5 150 7069 +7.8 11.3 +10.3 19.3 1140.47 0.27 +10.4 26.3 104 9268 +10.2 12.4 +15.7 16.7 90all 0.31 +2.5 20.1 409 +9.4 13.0 +11.0 18.2 320
κt,p(VT,AMS) = κa,p ·(1−φLV ,Da
)+κLV ·φLV ,Da
= κa,p−φLV ,Da
(κa,p−κLV
)(5)
in whichκa,p is calculated fromforg andfinorg by Eq. (1).Figure9c showsκt,p calculated with Eq. (5) plotted versus
the observedκt. It can be seen that the prediction ofκt onlyfrom data of the chemical composition and mixing state wasless successful since only a moderate correlation (R2
= 0.52)could be found. In the range betweenκ = 0.25 to 0.55, where∼70% of the data points lay, the predicted values deviatedfrom the observed ones on average by less than 20%. Forsmaller values,κt,p was generally larger than the observedκt (by up to 100% and more), whereas for larger values itwas mainly smaller (by up to a few tens of percent). Table4shows that the deviations betweenκt,p and the observedκt in-creased with supersaturation. However, the deviations wereindependent of MAF (not shown here).
Similar to the calculation in Sect.3.1.2, NCCN,S,p was de-termined from the predictedκt values. In spite of the lowcorrelation of predicted versus observedκ values, the rel-ative deviations betweenNCCN,S predicted on the basis ofκt,p(VT,AMS) and the observed values ofNCCN,S were onaverage 13% with a generally positive bias (Table4, Fig.10).In contrast to the prediction usingκa,p (Eq. (1), Table3), thedeviations did not increase for the smaller supersaturations.
When calculatingNCCN,S,p for the same data set using aconstantκ of 0.3, the relative deviations between the pre-dicted and observed values ofNCCN,S were larger (∼18% onaverage) than when calculated withκt,p(VT,AMS). This isin contrast to what was found in Sect.3.1.2(more accurateprediction ofNCCN,S using a constantκt = 0.3 than usingindividual κa,p) and it confirms the findings ofRose et al.(2010a): κt is a better proxy for the prediction ofNCCN,Sthanκa, if the aerosol consists of a fraction of CCN-activeand a fraction of weakly CCN-active particles with muchlower hygroscopicity. Moreover, a constant average valueof κ = 0.3 is a good approximation, if no information on par-ticle composition is available, but cannot account for the ob-
10 000
1000cm
-3 ]
100
N CC
N,S
,p [c
100
1:1
0.068% 0.27%
N
10 100 1000 10 00010
1:1 30% dev. 0.47%
NCCN,S [cm-3 ]
Fig. 10. Predicted CCN number concentrations (NCCN,S,p) basedon the measured CN size distribution andκt,p(VT,AMS) as calcu-lated from Eq. (5) plotted against the observed CCN number con-centrations (NCCN,S). The grey solid line is the 1:1 line, and thedashed lines indicate the band of±30% deviation ofNCCN,S,p fromNCCN,S.
served temporal variations in aerosol composition and CCNproperties.
Figure11 depicts the campaign average size distributionsof κa,p andκt,p and the average measuredκa andκt versusthe activation diameter as observed at the four selected su-persaturations.κa,p was calculated by Eq. (1) using the aver-age size distribution of the organic and inorganic mass frac-tions. κt,p was calculated by Eq. (5) using the size distri-bution ofκa,p andφLV calculated from the average CN andLV-particle size distribution. Below 70 nm,κa andκt werealmost the same for both the measured and the predicted val-ues, but with increasing particle size,κa became significantlylarger thanκt. This can be explained by the increasing frac-tion of LV-particles with particle size as indicated by the greydashed line in Fig.11, becauseκt is the combination of thehygroscopicity of the CCN-active particles (κa) and the muchlower hygroscopicity of the LV-particles (κLV ).
Atmos. Chem. Phys., 11, 2817–2836, 2011 www.atmos-chem-phys.net/11/2817/2011/

D. Rose et al.: CCN in polluted air and biomass smoke – Part 2 2829
2 0 1 0 0 3 0 00 . 0
0 . 1
0 . 2
0 . 3
0 . 4
0 . 5
0 . 6
0 . 7
0
5 0 0 0
1 0 0 0 0
1 5 0 0 0
2 0 0 0 0
κa o b s e r v e d κa , p κt o b s e r v e d κt , p
k, f LV
D [ n m ]
C N C N L V
dN / dlog D [cm-3]
φL V
Fig. 11. Comparison of the predicted (red and blue lines, left axis)and measured (red and blue data points, left axis) hygroscopicityparameters. Supporting lines are the number size distribution ofCN (solid black, right axis), of LV-particles (solid grey, right axis),and of the fraction of LV-particles (dashed grey, left axis) averagedover the campaign. Lines and data points are median values, anderror bars indicate the interquartile ranges of the corresponding datapoints.
For κt, the observed values were only slightly higherthan the predicted ones, but forκa the measured values dif-fered considerably forD > 70 nm. As observed already inFig. 4, κa,p was significantly lower thanκa for largerκ val-ues, which were typically observed for larger particle sizes(∼15% under-prediction for particles≥70 nm). Since the un-certainty of mass concentrations was relatively small at thesesizes, this result suggests that the discrepancy between mea-sured and predictedκa is not likely to be due to unreliableAMS data. It rather suggests that the effective hygroscop-icity of the inorganic and/or organic fraction (κinorg and/orκorg) is size-dependent (increasedκinorg and/orκorg with in-creasing particle size). It may also result from different andtemporally varying molecular composition and hygroscopicproperties of the organic fraction of the investigated aerosols.
3.3 Diurnal cycles
Figure12 displays the statistical distributions of the diurnalcycles of selected parameters obtained from 30 days of CCN,AMS, VTDMA, and optical measurements. The CCN de-rived parameters are plotted for higher and/or lower super-saturation corresponding to a smaller and larger particle size,respectively. The diurnal cycles of theκ values are presentedas normalized parameters. To normalize the data, each ob-served value was divided by its respective 24-hour average(arithmetic mean) on the day of measurement. Thus, a valueof one indicates the daily average. The AMS derived massconcentrations and mass fractions are also shown for smalland large sizes (integrated from 50–70 nm and 150–250 nm,respectively).
In panels a and b the diurnal cycles of the effective hy-groscopicity of the CCN-active particles are shown. For thesmaller particles measured at larger supersaturations (panela), κa exhibited a clear minimum in the evening (20:00 to22:00) and maximum values during day time, whereas for thelarger particles measured at lower supersaturations (panel b)hardly any diurnal variation existed (less than±10% varia-tion of the meanκa).
For small particles, the mass concentrations of the inor-ganic and organic components measured by the AMS alsoexhibited pronounced cycles (panels c and e). The inorganicmass concentration was lowest during the night and in themorning, started increasing at noon and reached its maxi-mum at 16:00 to 18:00 (maximum twice as high as min-imum mean value). Afterwards it went slowly down be-fore it reached its minimum level around midnight. The or-ganic mass concentration had its minimum level also in themorning but increased more slowly than the inorganics andreached the maximum only around midnight, which may bedue to enhanced condensation of semivolatile SOA. Due tothe slightly shifted cycles for organics and inorganics the in-organic mass fraction (panel g) exhibited also a diurnal cycle.It had its minimum level around midnight and a twice as highmaximum around noon. Since the variation of the inorganicmass fraction determines the variation ofκa, the two cycleswere very similar (panel g vs. a).
For the larger particles, the inorganic and organic massconcentrations (panel d, f) also exhibited pronounced diur-nal variations although they were a little smaller than for thesmall particles. The minimum was around noon, but in con-trast to the small particles the concentrations increased al-most in parallel to each other to a maximum level at aroundmidnight. Therefore, the inorganic mass fraction (panel h)varied only a little during the day, which explains the smalldiurnal cycle ofκa for the large particles (panel b).
Figure12k showsσa/Da, which is the normalized widthof the CCN efficiency spectra (3 parameter CDF fit). It indi-cates the degree of particle heterogeneity and would ideallybe zero for a fully homogeneous aerosol (Rose et al., 2010a).For small particles, the minimum values were reached aroundnoon, while the maximum values at midnight were threetimes as high, which means that the particles were more ho-mogeneously mixed during the day. For the larger particles,σa/Da exhibited no diurnal variation (not shown here).
The diurnal cycles of the parameters discussed above indi-cate that the small aerosol particles were mainly formed fromgas phase precursors (secondary aerosol formation). Intensenew particle formation and growth leading to similar diurnalcycles were recently reported for another measurement sitein the vicinity of a Chinese mega-city (Beijing,Wiedensohleret al., 2009).
In Fig. 12i and j, the diurnal cycles of the effective hygro-scopicity of the total particle ensemble of particles,κt, areplotted. They were more pronounced than forκa especiallyfor the large particles because they reflect also the strong
www.atmos-chem-phys.net/11/2817/2011/ Atmos. Chem. Phys., 11, 2817–2836, 2011

2830 D. Rose et al.: CCN in polluted air and biomass smoke – Part 2
(a) (b)
(c) (d)
(e) (f)(e) (f)
(g) (h)
Fig. 12.Statistical distribution of diurnal cycles of several parameters obtained from CCN, AMS, VTDMA, and optical measurement results.The red dot is the mean value, the horizontal line in the box is the median, the limits of the boxes are the 25th and 75th percentile and thevertical lines extend to 5th and 95th percentiles. CCN derived parameters are plotted for higher (left panels) and/or lower (right panels)supersaturation corresponding to a smaller and larger particle size, respectively. Theκ values are normalized by dividing the observed valueby the daily average of that parameter. Mass concentrations and mass fractions are integrated from 50 to 70 nm (left panels) and from 150 to250 nm (right panels).
Atmos. Chem. Phys., 11, 2817–2836, 2011 www.atmos-chem-phys.net/11/2817/2011/

D. Rose et al.: CCN in polluted air and biomass smoke – Part 2 2831
(i) (j)
(k) (m)
(n) (o)
ϕL
V
Fig. 12. Continued.
diurnal variations of the fraction of the weakly CCN-activeLV-particles.
The maximum activated fractions derived from the CCNefficiency spectra measured at the smallest supersaturation(MAFm, panel m) exhibited the highest values (∼0.8) be-tween 12:00 to 18:00 and the lowest values (∼0.65) aroundmidnight. It indicates that there must have been more exter-nally mixed weakly CCN-active particles during night time.
The results of the volatility and optical measurements sup-port these findings. The number fraction of LV-particles(φLV ,220, panel o) was lowest between 12:00 to 18:00. TheLV-particles reached their absolute maximum fraction be-tween 02:00 and 08:00, which was a few hours after theminimum of MAFm and κt. The single scattering albedo(panel n) indicates higher proportions of light absorbing ma-terial (soot) during night (ω532≈0.8) than during day time(ω532≈0.9).
Most likely the diurnal cycles of the parameters shown inFig.12i–o were dominated by convective mixing during day-time leading to dilution and to a decrease of the soot fraction.After sunset, the formation of a stable nocturnal boundarylayer in combination with the continued emission or advec-tion of particles throughout the night led to an increase of theLV-particles (fresh soot). As mentioned also inAndreae et al.(2008) andGarland et al.(2008), truck traffic, dominated byhigh-emission diesel vehicles, increased sharply at night as aresult of local traffic regulations. Since the measurement sitewas located in the upwind area of the mega-city Guangzhou,increased diesel emissions had to be expected and probablycontributed to the evening increase in fresh soot at our site.
www.atmos-chem-phys.net/11/2817/2011/ Atmos. Chem. Phys., 11, 2817–2836, 2011

2832 D. Rose et al.: CCN in polluted air and biomass smoke – Part 2
4 Summary and conclusions
In this study, which is a companion toRose et al.(2010a), weused data from AMS, VTDMA, and optical measurements toinvestigate and characterize the relationship between CCNactivity, hygroscopicity, chemical composition, and mixingstate of aerosol particles in mega-city air and biomass burn-ing smoke.
Two different hygroscopicity parameters were derivedfrom the CCN measurements. The parameterκa character-izes the average hygroscopicity of the internally mixed CCN-active particles whereas the parameterκt is an approximatemeasure (proxy) for the effective average hygroscopicity ofthe total ensemble of aerosol particles including internallymixed CCN-active as well as externally mixed weakly CCN-active particles. Both of these parameters were consistentwith AMS and VTDMA measurement data. Theκa valuesincreased with particle size from∼0.25 at∼50 nm to∼0.4at ∼200 nm. The organic mass fraction (forg) was nega-tively correlated withκa and decreased with particle size. Forthe smallest particles (∼50 nm), forg was on average 60%(campaign median), but increased to almost 100% during abiomass burning event (BBE). For particles≥200 nm, it re-mained nearly constant during the entire campaign at 40–50%. Moreover, the mass concentrations of all chemicalcomponents measured by the AMS were about twice as highduring the BBE than during the rest of the campaign. Thecampaign average mass concentration over the investigatedsize range (50–850 nm) was∼40 µg m−3.
Extrapolation of the linear correlation betweenκa andforgyielded the followingκ values for organic and inorganic par-ticle components:κorg≈0.1, which can be regarded as theeffective hygroscopicity of secondary organic aerosol (SOA)and κinorg≈0.6, which is characteristic for ammonium sul-fate and related salts. They were similar to those observed inother regions of the world (e.g.,Gunthe et al., 2009; Duseket al., 2010). Both the size dependence and the temporal vari-ability of effective particle hygroscopicity could be parame-terized as a function of AMS-based organic and inorganicmass fractions (Gunthe et al., 2009): κa,p=κorg·forg+κinorg·
finorg. The CCN number concentrations (NCCN,S) predictedwith κa,p exhibited a substantial positive bias relative to themeasurement results (up to +34% on average atS = 0.068%).This confirms that AMS data are not sufficient for accuratepredictions ofNCCN,S, if a significant fraction of externallymixed weakly CCN-active particles is present as observedfor this data set.
As already described inRose et al.(2010a), the CCN effi-ciency spectra observed at lowS (≤0.27%) exhibited max-imum activated fractions (MAF) well below one, indicat-ing substantial portions of externally mixed weakly CCN-active particles with very low hygroscopicity. The VTDMAmeasurement results and complementary aerosol optical datasuggest that those particles were externally mixed soot par-ticles with low volatility (LV-particles) freshly emitted from
local and regional combustion sources. By combining CCNand VTDMA data we obtained an estimate ofκLV ≈ 0.01for the effective average hygroscopicity of the LV-particles.Based on AMS and VTDMA data we could also calculatea proxy for the effective average hygroscopicity of the totalparticle ensemble:κt,p = κa,p −φLV · (κa,p −κLV ). The pre-diction of NCCN,S with κt,p (∼10% average deviation) wasmuch better than withκa,p (∼20% average deviation). Thesefindings confirm that information on the mixing state is es-sential for highly accurate CCN predictions in polluted envi-ronments with strong combustion sources.
Throughout the measurement campaign, the LV-particlefractions and the deviations betweenκt,p andκa,p were en-hanced during nighttime. These diurnal cycles are consistentwith aerosol optical data and can be attributed to boundarylayer mixing effects and enhanced nighttime emissions fromcombustion sources (Garland et al., 2008).
The campaign average value ofκt≈0.3 was the same asobserved and estimated for other continental regions (Roseet al., 2010a; Andreae and Rosenfeld, 2008). In accordancewith recent simulations of the global distribution ofκ withan atmospheric chemistry model (Pringle et al., 2010), thisvalue can be regarded as an approximate global average ef-fective hygroscopicity parameter of CCN in continental air.
The prediction ofNCCN,S assuming constantκ = 0.3(∼18% average deviation) was worse than the prediction us-ing variableκt,p values based on AMS and VTDMA data butslightly better than the prediction using variableκa,p valuesbased on AMS data only. These results re-confirm that ona global and climate modeling scaleκ = 0.3 is suitable asa first-order approximation for the effective hygroscopicityand CCN activity of continental aerosols, although it cannotaccount for the regional and temporal variations in aerosolcomposition and mixing state.
Depending on the required and applicable level of detail,the information and parameterizations presented in this studyshould enable efficient description of the CCN activity of at-mospheric aerosols in detailed process models as well as inlarge-scale atmospheric and climate models.
Acknowledgements.The PRIDE-PRD2006 campaign was spon-sored by the China National Basic Research and DevelopmentProgram (2002CB410801 and 2002CB211605). This studywas supported by the Max Planck Society (MPG), the LeibnizInstitute for Tropospheric Research (IfT), the University of Tokyo(UT), and Peking University (PKU). Thanks to all team membersfor support during the campaign and fruitful discussions afterwards.
The service charges for this open access publicationhave been covered by the Max Planck Society.
Edited by: A. Hofzumahaus
Atmos. Chem. Phys., 11, 2817–2836, 2011 www.atmos-chem-phys.net/11/2817/2011/

D. Rose et al.: CCN in polluted air and biomass smoke – Part 2 2833
References
Andreae, M. O.: Correlation between cloud condensation nu-clei concentration and aerosol optical thickness in remoteand polluted regions, Atmos. Chem. Phys., 9, 543–556,doi:10.5194/acp-9-543-2009, 2009.
Andreae, M. O. and Gelencser, A.: Black carbon or brown car-bon? The nature of light-absorbing carbonaceous aerosols, At-mos. Chem. Phys., 6, 3131–3148,doi:10.5194/acp-6-3131-2006,2006.
Andreae, M. O. and Rosenfeld, D.: Aerosol-cloud-precipitationinteractions. Part 1. The nature and sources of cloud-activeaerosols, Earth Sci. Rev., 89, 13–41, 2008.
Andreae, M. O., Schmid, O., Yang, H., Yu, J., Zeng, L., and Zhang,Y.: Optical properties and chemical composition of the atmo-spheric aerosol in urban Guangzhou, China, Atmos. Environ.,42, 6335–6350,doi:10.1016/j.atmosenv.2008.01.030, 2008.
Anttila, T.: Sensitivity of cloud droplet formation to the numeri-cal treatment of the particle mixing state, J. Geophys. Res., 115,D21205,doi:10.1029/2010JD013995, 2010.
Birmili, W., Stratmann, F., and Wiedensohler, A.: Design of aDMA-based size spectrometer for a large particle size range andstable operation, J. Aerosol Sci., 30, 4, 549–553, 1999.
Bougiatioti, A., Fountoukis, C., Kalivitis, N., Pandis, S. N., Nenes,A., and Mihalopoulos, N.: Cloud condensation nuclei measure-ments in the marine boundary layer of the Eastern Mediter-ranean: CCN closure and droplet growth kinetics, Atmos. Chem.Phys., 9, 7053–7066,doi:10.5194/acp-9-7053-2009, 2009.
Broekhuizen, K., Chang, R.-W., Leaitch, W. R., Li, S.-M., and Ab-batt, J. P. D.: Closure between measured and modeled cloudcondensation nuclei (CCN) using size-resolved aerosol composi-tions in downtown Toronto, Atmos. Chem. Phys., 6, 2513–2524,doi:10.5194/acp-6-2513-2006, 2006.
Burtscher, H., Baltensperger, U., Bukowiecki, N., Cohn, P., Huglin,C., Mohr, M., Matter, U., Nyeki, S., Schmatloch, V., and Streit,N.: Separation of volatile and non-volatile aerosol fractions bythermodesorption: instrumental development and applications,J. Aerosol Sci., 32, 427–442, 2001.
Chang, R. Y.-W., Slowik, J. G., Shantz, N. C., Vlasenko, A., Liggio,J., Sjostedt, S. J., Leaitch, W. R., and Abbatt, J. P. D.: The hygro-scopicity parameter (κ) of ambient organic aerosol at a field sitesubject to biogenic and anthropogenic influences: relationshipto degree of aerosol oxidation, Atmos. Chem. Phys., 10, 5047–5064,doi:10.5194/acp-10-5047-2010, 2010.
Cheng, Y. F., Eichler, H., Wiedensohler, A., Heintzenberg, J.,Zhang, Y. H., Hu, M., Herrmann, H., Zeng, L. M., Liu, S.,Gnauk, T., Bruggemann, E., and He, L. Y.: Mixing state ofelemental carbon and non-light-absorbing aerosol componentsderived from in situ particle optical properties at Xinken inPearl River Delta of China, J. Geophys. Res., 111, D20204,doi:10.1029/2005JD006929, 2006.
Cheng, Y. F., Berghof, M., Garland, R. M., Wiedensohler, A.,Wehner, B., Muller, T., Su, H., Zhang, Y. H., Achtert, P., Nowak,A., Poschl, U., Zhu, T., Hu, M., and Zeng, L. M.: Influ-ence of soot mixing state on aerosol light absorption and sin-gle scattering albedo during air mass aging at a polluted regionalsite in northeastern China, J. Geophys. Res., 114, D00G10,doi:10.1029/2008JD010883, 2009.
Cubison, M. J., Ervens, B., Feingold, G., Docherty, K. S., Ulbrich,I. M., Shields, L., Prather, K., Hering, S., and Jimenez, J. L.:
The influence of chemical composition and mixing state of LosAngeles urban aerosol on CCN number and cloud properties, At-mos. Chem. Phys., 8, 5649–5667,doi:10.5194/acp-8-5649-2008,2008.
DeCarlo, P. F., Slowik, J. G., Worsnop, D. R., Davidovits, P., andJimenez, J. L.: Particle Morphology and Density Characteriza-tion by Combined Mobility and Aerodynamic Diameter Mea-surements. Part 1: Theory, Aerosol Sci. Technol., 38, 1185–1205, 2004.
Dusek, U., Frank, G. P., Hildebrandt, L., Curtius, J., Schneider, J.,Walter, S., Chand, D., Drewnick, F., Hings, S., Jung, D., Bor-rmann, S., and Andreae, M. O.: Size matters more than chem-istry for cloud nucleating ability of aerosol particles, Science,312, 1375–1378, 2006.
Dusek, U., Frank, G. P., Curtius, J., Drewnick, F., Schneider,J., Kurten, A., Rose, D., Andreae, M. O., Borrmann, S., andPoschl, U.: Enhanced organic mass fraction and decreased hy-groscopicity of cloud condensation nuclei (CCN) during newparticle formation events, Geophys. Res. Lett., 37, L03804,doi:10.1029/2009GL040930, 2010.
Ervens, B., Cubison, M., Andrews, E., Feingold, G., Ogren, J.,Jimenez, J., DeCarlo, P., and Nenes, A.: Prediction of cloudcondensation nucleus number concentration using measurementsof aerosol size distributions and composition and light scat-tering enhancement due to humidity, J. Geophys. Res., 112,doi:10.1029/2006JD007426, 2007.
Ervens, B., Cubison, M. J., Andrews, E., Feingold, G., Ogren, J. A.,Jimenez, J. L., Quinn, P. K., Bates, T. S., Wang, J., Zhang, Q.,Coe, H., Flynn, M., and Allan, J. D.: CCN predictions usingsimplified assumptions of organic aerosol composition and mix-ing state: a synthesis from six different locations, Atmos. Chem.Phys., 10, 4795–4807,doi:10.5194/acp-10-4795-2010, 2010.
Frank, G. P., Dusek, U., and Andreae, M. O.: Technical note: Amethod for measuring size-resolved CCN in the atmosphere, At-mos. Chem. Phys. Discuss., 6, 4879–4895,doi:10.5194/acp-8-6365-2006, 2006.
Frey, A., Rose, D., Wehner, B., Muller, T., Cheng, Y., Wiedensohler,A., and Virkkula, A.: Application of the Volatility-TDMA Tech-nique to Determine the Number Size Distribution and Mass Con-centration of Less Volatile Particles, Aerosol Sci. Technol., 42,817–828, 2008.
Garland, R. M., Yang, H., Schmid, O., Rose, D., Nowak, A.,Achtert, P., Wiedensohler, A., Takegawa, N., Kita, K., Miyazaki,Y., Kondo, Y., Hu, M., Shao, M., Zeng, L. M., Zhang, Y. H.,Andreae, M. O., and Poschl, U.: Aerosol optical properties ina rural environment near the mega-city Guangzhou, China: im-plications for regional air pollution, radiative forcing and remotesensing, Atmos. Chem. Phys., 8, 5161–5186,doi:10.5194/acp-8-5161-2008, 2008.
Gunthe, S. S., King, S. M., Rose, D., Chen, Q., Roldin, P., Farmer,D. K., Jimenez, J. L., Artaxo, P., Andreae, M. O., Martin, S. T.,and Poschl, U.: Cloud condensation nuclei in pristine tropi-cal rainforest air of Amazonia: size-resolved measurements andmodeling of atmospheric aerosol composition and CCN activity,Atmos. Chem. Phys., 9, 7551–7575,doi:10.5194/acp-9-7551-2009, 2009.
Heintzenberg, J. and Charlson, R. J.: Clouds in the Perturbed Cli-mate System: Their Relationship to Energy Balance, Atmo-spheric Dynamics, and Precipitation, Strungmann Forum Report,
www.atmos-chem-phys.net/11/2817/2011/ Atmos. Chem. Phys., 11, 2817–2836, 2011

2834 D. Rose et al.: CCN in polluted air and biomass smoke – Part 2
vol. 2, MIT Press, Cambridge, MA, USA, 2009.Huang, Y., Chameides, W. L., and Dickinson, R. E.: Direct
and indirect effects of anthropogenic aerosols on regional pre-cipitation over east Asia, J. Geophys. Res., 112, D03212,doi:10.1029/2006JD007114, 2007.
Hudson, J. G.: Variability of the relationship between particle sizeand cloud-nucleating ability, Geophys. Res. Lett., 34, L08801,doi:10.1029/2006GL028850, 2007.
Hudson, J. G. and Yum, S. S.: Cloud condensation nuclei spectraand polluted and clean clouds over the Indian Ocean, J. Geophys.Res., 107(D19), 8022,doi:10.1029/2001JD000829, 2002.
IPCC: Climate Change 2007: The Physical Science Basis. Contri-bution of Working Group I to the Fourth Assessment Report ofthe Intergovernmental Panel on Climate Change, p. 996, Cam-bridge University Press, Cambridge and New York, 2007.
Jayne, J. T., Leard, D. C., Zhang, X. F., Davidovits, P., Smith, K. A.,Kolb, C. E., and Worsnop, D. R.: Development of an aerosolmass spectrometer for size and composition analysis of submi-cron particles, Aerosol Sci. Technol., 33, 49–70, 2000.
Juranyi, Z., Gysel, M., Weingartner, E., DeCarlo, P. F., Kam-mermann, L., and Baltensperger, U.: Measured and modelledcloud condensation nuclei number concentration at the highalpine site Jungfraujoch, Atmos. Chem. Phys., 10, 7891–7906,doi:10.5194/acp-10-7891-2010, 2010.
King, S. M., Rosenøern, T., Shilling, J. E., Chen, Q., and Martin,S. T.: Increased cloud activation potential of secondary organicaerosol for atmospheric mass loadings, Atmos. Chem. Phys., 9,2959–2971,doi:10.5194/acp-9-2959-2009, 2009.
King, S. M., Rosenøern, T., Shilling, J. E., Chen, Q., Wang, Z.,Biskos, G., McKinney, K. A., Poschl, U., and Martin, S. T.:Cloud droplet activation of mixed organic-sulfate particles pro-duced by the photooxidation of isoprene, Atmos. Chem. Phys.,10, 3953–3964,doi:10.5194/acp-10-3953-2010, 2010.
Kondo, Y., Komazaki, Y., Miyazaki, Y., Moteki, N., Takegawa,N., Kodama, D., Deguchi, S., Nogami, M., Fukuda,M., and Miyakawa, T.: Temporal variations of elemen-tal carbon in Tokyo, J. Geophys. Res, 111, D12205,doi:10.1029/2005JD006257, 2006.
Kreidenweis, S. M., Petters, M. D., and DeMott, P. J.: Single-parameter estimates of aerosol water content, Environ. Res. Lett.,3, 035002,doi:10.1088/1748-9326/3/3/035002, 2008.
Kreidenweis, S. M., Petters, M. D., and Chuang, P. Y.: Cloud par-ticle precursors, in: Clouds in the Perturbed Climate System:Their Relationship to Energy Balance, Atmospheric Dynamics,and Precipitation, Strungmann Forum Report, vol. 2, edited by:Heintzenberg, J. and Charlson, R. J., MIT Press, Cambridge,MA, USA, 2009.
Kuwata, M. and Kondo, Y.: Dependence of size-resolvedCCN spectra on the mixing state of nonvolatile coresobserved in Tokyo, J. Geophys. Res., 113, D19202,doi:10.1029/2007JD009761, 2008.
Kuwata, M., Kondo, Y., Mochida, M., Takegawa, N., and Kawa-mura, K.: Dependence of CCN activity of less volatile particleson the amount of coating observed in Tokyo, J. Geophys. Res.,112, D11207,doi:10.1029/2006JD007758, 2007.
Kuwata, M., Kondo, Y., Miyazaki, Y., Komazaki, Y., Kim, J. H.,Yum, S. S., Tanimoto, H., and Matsueda, H.: Cloud conden-sation nuclei activity at Jeju Island, Korea in spring 2005, At-mos. Chem. Phys., 8, 2933–2948,doi:10.5194/acp-8-2933-2008,
2008.Lance, S., Medina, J., Smith, J. N., and Nenes, A.: Mapping the
Operation of the DMT Continuous Flow CCN Counter, AerosolSci. Technol., 40, 242–254, 2006.
Lance, S., Nenes, A., Mazzoleni, C., Dubey, M. K., Gates, H.,Varutbangkul, V., Rissman, T. A., Murphy, S. M., Sorooshian,A., Flagan, R. C., Seinfeld, J. H., Feingold, G., and Jonsson,H. H.: Cloud condensation nuclei activity, closure, and dropletgrowth kinetics of Houston aerosol during the Gulf of Mex-ico Atmospheric Composition and Climate Study (GoMACCS),J. Geophys. Res., 114, D00F15,doi:10.1029/2008JD011699,2009.
Lohmann, U. and Feichter, J.: Global indirect aerosol effects: a re-view, Atmos. Chem. Phys., 5, 715–737,doi:10.5194/acp-5-715-2005, 2005.
Medina, J., Nenes, A., Sotiropoulou, R.-E. P., Cottrell, L. D.,Ziemba, L. D., Beckman, P. J., and Griffin, R. J.: Cloud conden-sation nuclei closure during the International Consortium for At-mospheric Research on Transport and Transformation 2004 cam-paign: Effects of size-resolved composition, J. Geophys. Res.,112, D10S31,doi:10.1029/2006JD007588, 2007.
Mikhailov, E., Vlasenko, S., Martin, S. T., Koop, T., and Poschl,U.: Amorphous and crystalline aerosol particles interacting withwater vapor: conceptual framework and experimental evidencefor restructuring, phase transitions and kinetic limitations, At-mos. Chem. Phys., 9, 9491–9522,doi:10.5194/acp-9-9491-2009,2009.
Petters, M. D. and Kreidenweis, S. M.: A single parameter repre-sentation of hygroscopic growth and cloud condensation nucleusactivity, Atmos. Chem. Phys., 7, 19611971,doi:10.5194/acp-7-1961-2007, 2007.
Philippin, S., Wiedensohler, A., and Stratmann, F.: Measurementsof non-volatile fractions of pollution aerosols with an eight-tubevolatility tandem differential mobility analyzer (VTDMA-8), J.Aerosol Sci., 35, 185–203,doi:10.1016/j.jaerosci.2003.07.004,2004.
Poschl, U.: Atmospheric aerosols: composition, transformation,climate and health effects, Angewandte Chemie InternationalEdition, 44, 7520–7540, 2005.
Poschl, U.: Gasparticle interactions of tropospheric aerosols:Kinetic and thermodynamic perspectives of multiphasechemical reactions, amorphous organic substances, andthe activation of cloud condensation nuclei, Atmos. Res.,doi:10.1016/j.atmosres.2010.12.018, in press, 2011.
Poschl, U., Rose, D., and Andreae, M. O.: Climatologies of cloud-related aerosols - Part 2: Particle hygroscopicity and cloud con-densation nucleus activity, in: Clouds in the Perturbed ClimateSystem: Their Relationship to Energy Balance, Atmospheric Dy-namics, and Precipitation, Strungmann Forum Report, vol. 2,edited by: Heintzenberg, J. and Charlson, R. J., MIT Press, Cam-bridge, MA, USA, 57–72, 2009.
Pringle, K. J., Tost, H., Pozzer, A., Poschl, U., and Lelieveld, J.:Global distribution of the effective aerosol hygroscopicity pa-rameter for CCN activation, Atmos. Chem. Phys., 10, 5241–5255,doi:10.5194/acp-10-5241-2010, 2010.
Pruppacher, H. R. and Klett, J. D.: Microphysics of clouds and pre-cipitation, Kluwer Academic Publishers, Dordrecht, The Nether-lands, 1997.
Roberts, G., Artaxo, P., Zhou, J., Swietlicki, E., and Andreae,
Atmos. Chem. Phys., 11, 2817–2836, 2011 www.atmos-chem-phys.net/11/2817/2011/

D. Rose et al.: CCN in polluted air and biomass smoke – Part 2 2835
M. O.: Sensitivity of CCN spectra on chemical and physicalproperties of aerosol: A case study from the Amazon Basin, J.Geophys. Res., 107, 8070,doi:10.1029/2001JD000583, 2002.
Roberts, G., Mauger, G., Hadley, O., and Ramanathan, V.: NorthAmerican and Asian aerosols over the eastern Pacific Ocean andtheir role in regulating cloud condensation nuclei, J. Geophys.Res., 111, D13205,doi:10.1029/2005JD006661, 2006.
Roberts, G. C. and Nenes, A.: A Continuous-Flow StreamwiseThermal-Gradient CCN Chamber for Atmospheric Measure-ments, Aerosol Sci. Technol., 39, 206–221, 2005.
Roberts, G. C., Andreae, M. O., Zhou, J., and Artaxo, P.: Cloudcondensation nuclei in the Amazon Basin: ”Marine” conditionsover a continent?, Geophys. Res. Lett., 28, 2807–2810, 2001.
Rose, D., Wehner, B., Ketzel, M., Engler, C., Voigtlander, J., Tuch,T., and Wiedensohler, A.: Atmospheric number size distribu-tions of soot particles and estimation of emission factors, At-mos. Chem. Phys., 6, 1021–1031,doi:10.5194/acp-6-1021-2006,2006.
Rose, D., Gunthe, S. S., Mikhailov, E., Frank, G. P., Dusek, U.,Andreae, M. O., and Poschl, U.: Calibration and measurementof a continuous-flow cloud condensation nuclei counter (DMT-CCNC): CCN activation of ammonium sulfate and sodium chlo-ride aerosol particles in theory and experiment, Atmos. Chem.Phys., 8, 1153–1179,doi:10.5194/acp-8-1153-2008, 2008.
Rose, D., Nowak, A., Achtert, P., Wiedensohler, A., Hu, M., Shao,M., Zhang, Y., Andreae, M. O., and Poschl, U.: Cloud conden-sation nuclei in polluted air and biomass burning smoke near themega-city Guangzhou, China - Part 1: Size-resolved measure-ments and implications for the modeling of aerosol particle hy-groscopicity and CCN activity, Atmos. Chem. Phys., 10, 3365–3383,doi:10.5194/acp-10-3365-2010, 2010a.
Rose, D., Nowak, A., Achtert, P., Wiedensohler, A., Hu, M., Shao,M., Zhang, Y., Andreae, M. O., and Poschl, U.: Interactive com-ment on “Cloud condensation nuclei in polluted air and biomassburning smoke near the mega-city Guangzhou, China – Part 1:Size-resolved measurements and implications for the model-ing of aerosol particle hygroscopicity and CCN activity” by D.Rose et al., Atmos. Chem. Phys. Discuss., 8, S12597–S12599,doi:10.5194/acpd-8-S12597-2010, 2010b.
Sadezky, A., Muckenhuber, H., Grothe, H., Niessner, R., andPoschl, U.: Raman microspectroscopy of soot and related car-bonaceous materials: spectral analysis and structural informa-tion, Carbon, 43, 1731–1742, 2005.
Seinfeld, J. H. and Pandis, S. N.: Atmospheric Chemistry andPhysics: From Air Pollution to Climate Change, John Wiley andSons, Inc., New York, USA, 2006.
Shantz, N. C., Chang, R. Y.-W., Slowik, J. G., Vlasenko, A., Abbatt,J. P. D., and Leaitch, W. R.: Slower CCN growth kinetics ofanthropogenic aerosol compared to biogenic aerosol observed ata rural site, Atmos. Chem. Phys., 10, 299–312,doi:10.5194/acp-10-299-2010, 2010.
Smith, M. H. and O’Dowd, C. D.: Observations of accumulationmode aerosol composition and soot carbon concentrations bymeans of a high-temperature volatility technique, J. Geophys.Res, 101, 19583–19591, 1996.
Stevens, B. and Feingold, G.: Untangling aerosol effects on cloudsand precipitation in a buffered system, Nature, 461, 7264,doi:10.1038/nature08281, 2009.
Su, H., Rose, D., Cheng, Y. F., Gunthe, S. S., Massling, A., Stock,
M., Wiedensohler, A., Andreae, M. O., and Poschl, U.: Hy-groscopicity distribution concept for measurement data analysisand modeling of aerosol particle mixing state with regard to hy-groscopic growth and CCN activation, Atmos. Chem. Phys., 10,7489–7503,doi:10.5194/acp-10-7489-2010, 2010.
Takegawa, N., Miyakawa, T., Watanabe, M., Kondo, Y., Miyazaki,Y., Han, S., Zhao, Y., van Pinxteren, D., Bruggemann, E.,Gnauk, T., Herrmann, H., Xiao, R., Deng, Z., Hu, M., Zhu,T., and Zhang, Y.: Performance of an Aerodyne Aerosol MassSpectrometer (AMS) during Intensive Campaigns in China inthe Summer of 2006, Aerosol Sci. Technol., 43, 189–204,doi:10.1080/02786820802582251, 2009.
Tuch, T. M., Haudek, A., Muller, T., Nowak, A., Wex, H.,and Wiedensohler, A.: Design and performance of an auto-matic regenerating adsorption aerosol dryer for continuous op-eration at monitoring sites, Atmos. Meas. Tech., 2, 417–422,doi:10.5194/amt-2-417-2009, 2009.
Wang, J., Lee, Y.-N., Daum, P. H., Jayne, J., and Alexander, M. L.:Effects of aerosol organics on cloud condensation nucleus (CCN)concentration and first indirect aerosol effect, Atmos. Chem.Phys., 8, 6325–6339,doi:10.5194/acp-8-6325-2008, 2008.
Wang, J., Cubison, M. J., Aiken, A. C., Jimenez, J. L., and Collins,D. R.: The importance of aerosol mixing state and size-resolvedcomposition on CCN concentration and the variation of the im-portance with atmospheric aging of aerosols, Atmos. Chem.Phys., 10, 7267–7283,doi:10.5194/acp-10-7267-2010, 2010.
Wehner, B., Berghof, M., Cheng, Y. F., Achtert, P., Birmili,W., Nowak, A., Wiedensohler, A., Garland, R. M., Poschl,U., Hu, M., and Zhu, T.: Mixing state of nonvolatile aerosolparticle fractions and comparison with light absorption inthe polluted Beijing region, J. Geophys. Res., 114, D00G17,doi:10.1029/2008JD010923, 2009.
Wex, H., McFiggans, G., Henning, S., and Stratmann, F.: Influenceof the external mixing state of atmospheric aerosol on derivedCCN number concentrations, Geophys. Res. Lett., 37, L10805,doi:10.1029/2010GL043337, 2010.
Wiedensohler, A., Cheng, Y. F., Nowak, A., Wehner, B., Achtert,P., Berghof, M., Birmili, W., Wu, Z. J., Hu, M., Zhu, T.,Takegawa, N., Kita, K., Kondo, Y., Lou, S. R., Hofzumahaus,A., Holland, F., Wahner, A., Gunthe, S. S., Rose, D., Su, H.,and Poschl, U.: Rapid aerosol particle growth and increase ofcloud condensation nucleus activity by secondary aerosol for-mation and condensation: A case study for regional air pol-lution in northeastern China, J. Geophys. Res., 114, D00G08,doi:10.1029/2008JD010884, 2009.
Wiedensohler, A., Birmili, W., Nowak, A., Sonntag, A., Weinhold,K., Merkel, M., Wehner, B., Tuch, T., Pfeifer, S., Fiebig, M.,Fjaraa, A. M., Asmi, E., Sellegri, K., Depuy, R., Venzac, H., Vil-lani, P., Laj, P., Aalto, P., Ogren, J. A., Swietlicki, E., Roldin,P., Williams, P., Quincey, P., Huglin, C., Fierz-Schmidhauser, R.,Gysel, M., Weingartner, E., Riccobono, F., Santos, S., Gruning,C., Faloon, K., Beddows, D., Harrison, R. M., Monahan, C., Jen-nings, S. G., O’Dowd, C. D., Marinoni, A., Horn, H.-G., Keck,L., Jiang, J., Scheckman, J., McMurry, P. H., Deng, Z., Zhao,C. S., Moerman, M., Henzing, B., and de Leeuw, G.: Particle mo-bility size spectrometers: harmonization of technical standardsand data structure to facilitate high quality long-term observa-tions of atmospheric particle number size distributions, Atmos.Meas. Tech. Discuss., 3, 5521–5587,doi:10.5194/amtd-3-5521-
www.atmos-chem-phys.net/11/2817/2011/ Atmos. Chem. Phys., 11, 2817–2836, 2011

2836 D. Rose et al.: CCN in polluted air and biomass smoke – Part 2
2010, 2010.Yum, S. S. and Hudson, J. G.: Wintertime/summertime con-
trasts of cloud condensation nuclei and cloud microphysicsover the Southern Ocean, J. Geophys. Res., 109, D06204,doi:10.1029/2003JD003864, 2004.
Yum, S. S., Hudson, J. G., Song, K. Y., and Choi, B.-C.: Springtime cloud condensation nuclei concentrations onthe west coast of Korea, Geophys. Res. Lett., 32, L09814,doi:10.1029/2005GL022641, 2005.
Zhang, Q., Ma, X. C., Tie, X., Huang, M., and Zhao, C.:Vertical distributions of aerosols under different weatherconditions: Analysis of in-situ aircraft measurementsin Beijing, China, Atmos. Environ., 43, 5526–5535,doi:10.1016/j.atmosenv.2009.05.037, 2009.
Atmos. Chem. Phys., 11, 2817–2836, 2011 www.atmos-chem-phys.net/11/2817/2011/