closing the loop: enhancing collegiate performance by
TRANSCRIPT

Closing the Loop: Enhancing Collegiate Performance by Empowering Self-Assessment
Jerry Evensky Syracuse University
Wayne A. Grove
Le Moyne College
Yue Hu Wisconsin Center for Education Research
Timothy H Wasserman
Syracuse University
December 2007
Thanks to the Syracuse University’s Meredith Teaching Recognition Award for initial funding, to Dr. Ben Ware, Vice President for Research and Dean of the Graduate School at Syracuse University, for sustaining support along the way, to the Association of American Colleges and Universities “Bringing Theory to Practice” Project led by Sally Englehard Pingree and Don Harward for significant development support, to Professor Dessa K Bergen-Cico for securing this significant support, to Syracuse University Project Advance led by Jerry Edmonds for providing server support that made implementation possible, to Professor Jim Fawcett for invaluable software consulting, and to Rahul Chandrasekaran for excellent software development. Special thanks also go to the Office of Institutional Research & Assessment at Syracuse University for support of this project.

2
Closing the Loop:
Enhancing Collegiate Performance by Empowering Self-Assessment
Abstract Attrition and poor academic achievement of college students, long a concern of higher education faculty and administrators, increasingly has become the subject of public policy discussions and proposals. This paper reports on a randomized experiment of a program intended to develop students’ metacognitive skills conducted at a single large, private university in the northeastern United States. Students randomly assigned to the treatment group were required to complete a weekly on-line survey of their effort and engagement in the course with automatic weekly feedback about the individual’s cumulative effort and it relative to the class average, throughout the semester. When we measure the treatment as participation rates, rather than merely assignment to the treatment group, we find large and consistent student academic achievement gains. Thus, this evidence suggests the short run efficacy of this metacognitive skills enhancement program to improve student learning gains is tied to the intensity of their participation. Jerry Evensky Economics Department Syracuse University [email protected] Wayne A. Grove Economics Department Le Moyne College [email protected] Yue Hu Wisconsin Center for Education Research University of Wisconsin-Madison [email protected] Timothy H Wasserman Assistant Director, Office of Institutional Research & Assessment Syracuse University [email protected]
3
I. Introduction
Educators and policy makers have expressed increasing interest in the assessment of
higher education outcomes, namely attrition and academic performance. Colleges and
universities attempt to improve academic skills (and hence student success and retention) with a
variety of support services especially focused on first year students, such as remedial education
courses, “learning communities,” and academic tutoring and advising. Recently, financial
incentives have been widely used to improve collegiate academic performance, most notably in
state-wide systems such as Georgia’s Hope Program but now in many other states. In addition to
the importance of academic skills, the metacognitive skills of time management and self-
assessment of academic knowledge and understanding constitute another set of equally important
skills that frame students’ educational development. In this paper we report findings of a
randomized evaluation of an educational software program intended to promote these
metacognitive skills. Like studies by Bettinger and Long (2005), Bloom and Sommo (2005) and
Angrist, Lang and Oreopoulos (2007), we attempt to rigorously evaluate the efficacy of
particular initiatives to improve college student outcomes.
While few experimental assessments of college academic support programs have been
conducted, evaluations of three randomized programs provide evidence of at least some
effectiveness in improving student outcomes. Bettinger and Long (2005) find that remedial
classes for first year students reduced attrition. Bloom and Sommo (2005) evaluate random
assignment to first year “learning communities” and report some freshman but not sophomore
benefits. Finally, Angrist, Lang and Oreopoulos (2007) find that a combination of financial
incentives and service support provides the most promising intervention for improving college

4
freshman grades compared with treatment group that received either financial incentives alone or
just service support.
Like these studies, in this paper we report on a randomized experiment to evaluate a
program intended to develop students’ metacognitive skills conducted at a single large, private
university in the northeastern United States. Educational software called SAGE (“Self-Assess,
Grow, Educate”) allows students to complete a weekly on-line survey of their engagement in the
course (i.e., the number of classes attended, hours spent studying, assignments handed in, etc.)
with automatic weekly feedback about the individual’s cumulative effort and it relative to the
class average, throughout the semester. To evaluate the effectiveness of SAGE, students
randomly assigned to the treatment group were required to complete the weekly on-line survey
whereas those in the control group filled out a comparable weekly survey about campus social
life. Membership in the treatment group increased course performance by about 20 percent of
the magnitude of the effect of students’ general academic success in college. When we measure
the treatment as participation rates, though, student academic achievement gains are larger and
more statistically significant. Thus, evidence suggests the short run efficacy of this initiative to
improve students’ metacognitive skills with the resultant learning gains tied to the intensity of
participation in the treatment.
Although limited to a single professor’s classes, our results offer another empirical
analysis of the efficacy of collegiate academic support services to the small but growing body of
research regarding what faculty and administrators can do to improve academic outcomes.
Notably, SAGE is a program of very modest costs both in overhead to institutions of higher
education and of direct time to the faculty involved. Of those in the treatment group, freshman

5
and those with high math SAT scores participate at higher rates than others, whereas males,
members of the Greek system and Hispanics exhibited lower take-up rates.
II. The SAGE (Self-Assess, Grow, Educate) Software Experiment: A System for Rich,
Dynamic Self-Assessment
II.A. Metacognitive Skills and Student Learning
Economists have long recognized the value of education as a human capital investment
that makes individuals more productive. The traditional application of this human capital
analysis of education has been focused on the development of cognitive skills: skills developed
in the classroom and periodically measured by the instructor to assess skill development. These
skills increase the productivity of the individual when the cognitive content is mastered and
subsequently applied in educational settings, work or non-market activities. There is, however,
another set of equally important skills for student progress through stages of educational
development toward valuable post-educational productivity: metacognitive skills that frame the
classroom activity of the educational enterprise.
For example, many a high school student arrives at her college or university anxious to
do well and intellectually capable of success, but not “ready” to succeed. High school has taught
her the foundational cognitive skill prerequisites necessary for further progress, i.e., her cognitive
human capital is in place for math, science, social studies, and English, not time management …
a metacognitive skill necessary for success. Her time has been micro-managed at school (e.g.,
hall passes) and/or at home (“Hurry, you’ll miss the bus!”), so she has not learned a habit of
mind that is essential for success in college: managing time.

6
Once at college she may be living on her own in an environment (a residence hall) in
which maturity is not a universal norm, and she is dealing with having full responsibility for
managing all of her own time as she engages intellectual enterprises that rapidly develop
complex, higher order thinking. When college students lag behind or fail it is rarely because
they do not want to succeed. The biggest obstacle to success for college students is the lack of
the metacognitive human capital that is an essential tool for building cognitive mastery.
Summative assessment (e.g., grades on exams) is a universal college tool for assessing
cognitive mastery of the subject matter in a class, and many instructors use formative assessment
(e.g., feedback on exams or homework) to increase progress toward that mastery. What is all too
often missing in the college assessment mix is formative assessment that empowers students to
identify and develop the metacognitive skills necessary for success in the educational enterprise.
This failure is reflected in summative assessments (grades) that reflect poor cognitive outcomes.
There has been a growing recognition in recent educational research that college students
arrive with a deficit of “metacognitive knowledge; knowledge about different strategies, different
cognitive tasks, and, particularly, accurate knowledge about themselves.” (Pintrich, 223)
Pintrich writes: “In our work with college students (see Hofer, Yu, & Pintrich, 1998; Pintrich,
McKeachie, & Lin, 1987), we are continually surprised at the number of students who come to
college having very little metacognitive knowledge….” (Pintrich, 223)
If an instructor is going to “teach” the cognitive knowledge, the ideas and issues of the
course she offers, her students must be ready to learn. Being ready to learn requires knowing the
different strategies that make learning possible. “As experts in their field, teachers have all kinds
of implicit knowledge about strategies and when and why they are appropriate to use; however,
students often lack the means to gain access to this knowledge. If the knowledge is never shared
7
through discussion, modeling, or explicit instruction, it is difficult for students to learn.”
(Pintrich, 224)
An instructor can introduce students to this metacognitive knowledge in her course
syllabus, or she can remind students of this knowledge in her presentations.
Tutors, learning assistants, and learning professionals, for their part, can become
what Barrows calls, the student’s “metacognitive conscience” (1988) by asking
questions for the student in order to develop his or her awareness and analytical
processes. (Taylor, 41)
But in many courses, and especially in large gateway courses populated by the very lower
division undergraduate students least versed in this realm of metacognitive knowledge, there is
very little time for monitoring and mentoring of individual students’ attention to those skills and
strategies.
II.B. SAGE Educational Software
The SAGE software is a complement to “discussion, modeling, or explicit instruction.”
SAGE makes it possible for an instructor to keep her students continuously focused on the
learning strategies they are choosing relative to those the instructor deems effective (and, if the
instructor chooses, relative to the choices of other students). SAGE is a dynamic, formative self-
assessment system for students that instructors can efficiently develop before a course begins,
and that then runs during the course with minimal need for instructor time.
Many researchers (Marsh et. al, 1988; Nuthall & Alton-Lee, 1992; Pintrich & Garcia,
1994; Tishman, 1995; Blickle, 1996) recognize the importance of how motivation and academic
self-concept effect the learning outcome. If the student has a poor academic self concept, his/her
performance will become a self-fulfilling prophecy (Marsh et. al., 1988). An instructor who is

8
aware of the effects of academic self perception can enhance student performance by modeling a
variety of appropriate learning strategies. Strategy use, in turn increases self-regulation within
the student which will result in improved performance and enhanced self-concept. When
students begin to understand that the metacognitive process can be developed through the use of
relevant learning strategies which include planning, monitoring, and regulating their own
behavior, results are seen with an increase in academic performance (Pintrich & Garcia, 1994).
(Jacobson, 582)
SAGE is a tool for this modeling process. It efficiently and effectively allows instructors
to keep students continuously in touch with their strategy choices relative to the strategies the
instructor deems constructive. “Schoenfeld (1987) ties self-regulation into metacognition …
stat[ing] that ‘self awareness is a crucial aspect of metacognition, for awareness of one’s
intellectual behavior is a prerequisite for working to change it.’” (Jacobson, 582) By enhancing
the metacognition of students, SAGE can empower students to make choices for constructive
change.
Stander and Vadhan conclude in their piece, “Better Learning Through Better Thinking:
Developing Students’ Metacognitive Abilities”:
It is logical to infer from the results that if we help students increase their
metacognitive awareness, we can help them to become better learners. (Stander and
Vadhan, 309)
The key is to make students reflect on the patterns of their behaviors:

9
There are several implications of the relationships among metacognitive knowledge,
learning, teaching, and assessing. In terms of instruction, there is a need to teach for
metacognitive knowledge explicitly. (Pintrich, 223)
Students are capable of responsible performance and we can help them take that
responsibility by facilitating self-assessment that allows them to reflect on: “What are the
patterns of my behavior?” … in the context of reflection on: “What are the patterns of behavior
that lead to success?” … so they can efficiently and effectively answer the question: “How can I
do better?”
Of course, different courses require different strategies for success. Part of the
metacognitive maturation of a student is recognizing that strategies are context specific.
[I]ndividuals need to be aware of the different types of strategies they are likely to
rely on in different situations. … Students who know about the different kinds of
strategies for learning, thinking, and problem solving will be more likely to use
them. After all, if students do not know of a strategy, they will not be able to use
it. (Pintrich, 221-2)
Much of the extant assessment of students’ metacognitive skills is done by advisors or
ancillary programs that are external to or separate from the actual academic program in which
the student is engaged. Consequently the guidance these external agents offer to modify course
behavior toward more constructive patterns is either generic, i.e., not tailored to the specific
educational enterprise in which the student is engaged, or it “lags.” The latter is true because
given their distance from the ongoing academic activity the guidance external agents offer is in
response to issues/problems that are arising beyond their sight and thus the guidance must await
10
information from the instructor and/or the student regarding any issues/problems that are
unfolding.
In contrast, an instructor can tailor the SAGE questionnaire to her class. Thus it can set
the focus of her students’ self-assessment on any set of performance variables she deems
important for success. And, SAGE is a real time dynamic self-assessment tool. Students engage
the SAGE as they are engaging the course so the identification of patterns of course-related
behaviors that are problematic and the implementation of solutions related to those patterns is an
immediate, course specific, dynamic process.
As Claxton and Hinett write in a review of "Enhancing Learning through Self-assessment"
by D. Boud
You cannot learn unless you are getting a reliable answer as you go along to the crucial
question: ‘How am I doing?’ But if someone else always leaps in to answer that question
for you, your achievement may improve, but your ability to take on the formative
diagnostic role for yourself, to develop a reliable nose for the quality of your own
products, will not. Self-assessment gives people responsibility for, confidence in, and
practice at developing that nose, and it is therefore an essential ingredient of any course
that seeks, as it now must, to help students become better learners at the same time as
they are mastering specific bodies of knowledge and skill. (Claxton and Hinett, 319)
II.C. A Randomized Experiment to Assess SAGE
The hypothesis that SAGE offers an efficient tool for significant value added in cognitive
success by effectively enhancing metacognitive tools was tested in an introductory economics
course, ECN203 – Economic Ideas and Issues, offered at Syracuse University. ECN203 covers
micro and macroeconomics in one semester. It introduces most of the standard analytical

11
techniques involved in each of these dimensions of economic analysis. It employs a
developmental learning model so that as a general principle the student moves step by step from
a very simple level of analysis to a very complex and very powerful framework of analysis. In
terms of overall content coverage, students move step by step from micro foundations to micro
policy debates and then from macro foundations to domestic and global macro policy debates
informed by the micro foundations of these debates.
SAGE was implemented in four sections of ECN 203, two each semester for the two
semesters of the 2006-7 academic year. These four sections were all taught by the same
instructor (Jerry Evensky) with the same graduate assistants. Each section had approximately
130 students. Students were asked to sign permission forms approved and certified by
Institutional Review Board.
Each semester the students in both sections of ECN203 were combined into a single
database, separated by year in school, alphabetized, and then every other student was assigned to
the treatment group. The treatment group was assigned the SAGE questionnaire focused on
metacognitive skills that the instructor deemed important to success in ECN203. The students
who filled out this SAGE questionnaire are the “treatment group”. The control group “non-
SAGE” questionnaire focused on campus life. Both questionnaires are included in the appendix.
The “windows” for both questionnaires opened at 12:01am each Sunday and closed at
11:59pm each Monday. The email alert that informed students that the SAGE “window” was
open had identical wording for both questionnaires. In sum, aside from the content of the
questionnaire, all aspects of the SAGE process in particular and of the course more generally
were identical for all students.

12
At regular intervals determined by the instructor, participants fill in and submit an online
assessment (a SAGE questionnaire entirely designed by the instructor) and upon submission each
individual participant instantly sees
• A graphical display of the pattern of her responses to each closed ended question
over the series of submissions
• A list of her responses over the series of the submissions to each open ended
question
Thus each individual is continuously given the opportunity to reflect on the patterns (or the
lessons) of her participation in the educational enterprise.
SAGE also creates an environment for rich reflection: For each performance variable
assessed and displayed by the SAGE software:
The display for open ended questions includes (at the instructor’s discretion) not only
a list of that individual’s responses over time but also
• Displays five randomly selected responses that other participants submitted on the
last assessment questionnaire (reported anonymously)
… and the display for closed ended questions includes not only the individual’s pattern of
responses but also (again, at the instructor’s discretion)
• Displays an instructor standard of quality performance
• Displays the average reported performance pattern of all other participants
The following graphic simulates the closed ended feedback:

13
In this simulation, upon hitting “submit” the student (here Jeanne) instantly sees the
pattern of her own reported hours of study in yellow (triangles), the pattern that the instructor
feels is consistent with success in blue (diamonds), and the reported class average hours of study
in purple (squares). In this simulation Jeanne is immediately confronted with the fact that her
study pattern is below the average of her colleagues and is significantly below the pattern her
instructor has identified as the path to success.
A participant’s interface with the SAGE questionnaire stimulates reflection in two stages:
Simple reflection as she completes the questionnaire, e.g., “How much have I been
studying?”
… and this is immediately followed by
“Rich reflection” as she views the patterns she has reported in the context of her
instructor’s norm and her colleagues’ average performance.
This rich reflection process realizes one of the key “Principles of Good Practice for
Assessing Student Learning” cited by the American Association for Higher Education (AAHE):
“Assessment … entails comparing educational performance with educational purposes and
expectations….” (Austin, et. al.) As the AAHE’s “Principles” suggest: “Improvement is best
fostered when assessment entails a linked series of activities undertaken over time. … The point

14
is to monitor progress … in the spirit of continuous improvement.” (Austin, et. al.). Thus, SAGE
creates an opportunity for dynamic rich reflection: Each individual participant has a dynamic
sense of the pattern of his/her performance on which to self-assess, and this information is
continuously contextualized by a rich frame of reference for that self-assessment.
III. Data and Estimation Strategy
The following education production function framework is used to estimate the impact of
self-reflective activity on students’ academic achievement:
TestScore Treatment Xi i i i= + + +α β γ ε( ) (1)
Where the test score is grade point a student obtains for this course (on a 4 point scale),1
the set of control variables, X, includes student ability, denoted by standardized current semester
college GPA without the economics grade; demographic characteristics such as gender and race;
a dummy variable indicating which semester the student takes this course; a discrete variable
suggesting if the student is a freshman; merit indicator, which is a composite variable
representing student overall strength; and students’ membership in any fraternity or sorority.
Merit rating is an internal ranking of the application acumen/strength of SU undergraduates, at
the time they apply to SU. Each students gets assigned one value between 1 and 9; 1=highest;
7=lowest; 8 & 9 represent “opportunity program” applicants. The ranking can be used for
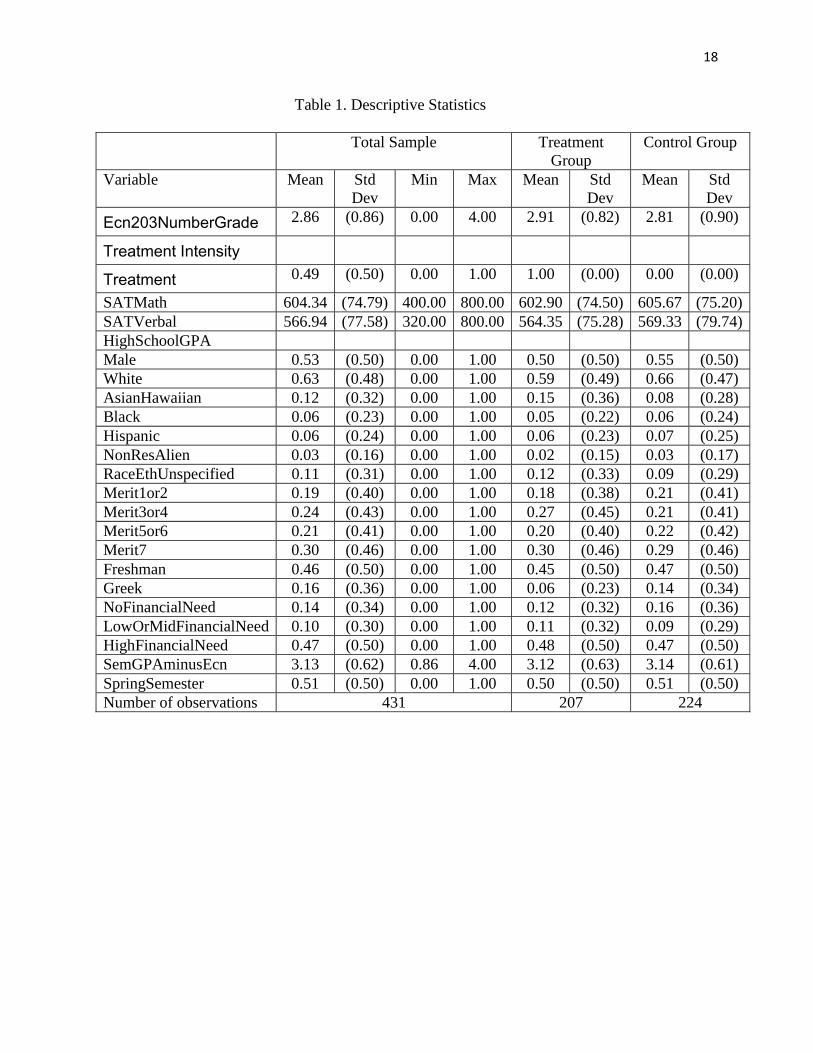
determination of provision of merit-based financial need. Table 1 provides descriptive statistics
for the entire sample and according to treatment and control group.
1 In this way, we can standardize the test scores from two semesters accounting for any inconsistency that might arise due to changes in test difficulty level or stringency of grading system.

15
We code treatment in two ways: either as a dichotomous variable indicating membership
in the treatment group (treatment = 1) or as a continuous variable ranging from zero to one
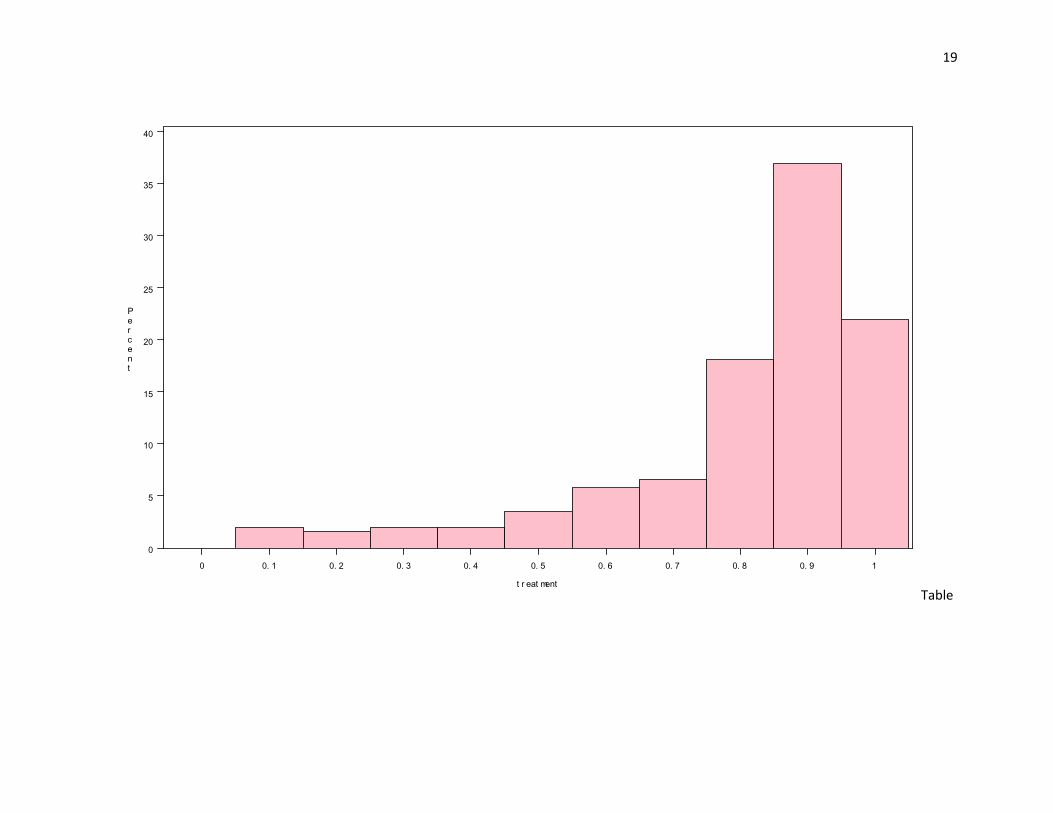
according to students’ take-up or participation rates (TreatmentIntensity). Figure 1 displays as a
histogram the participation rate of those in the treatment group, indicating that about a quarter of
the students participated less than 80 percent of the time.
IV. Assessing SAGE: Results
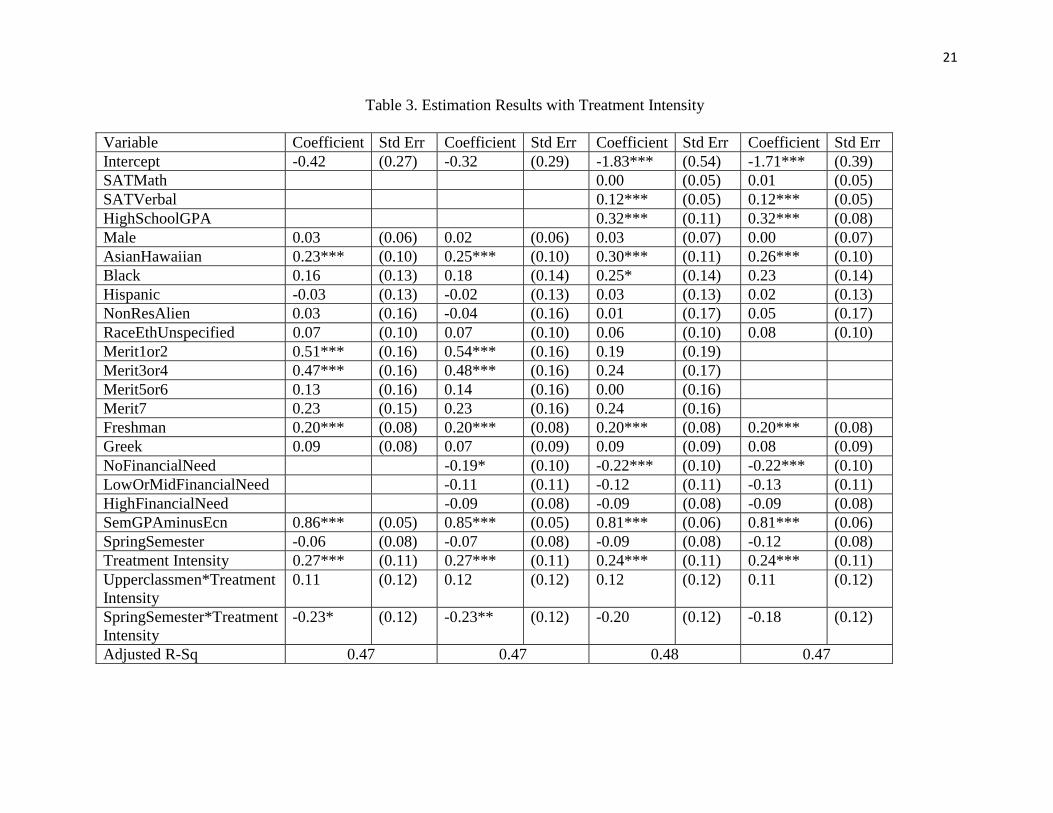
The estimation results shown in Table 2 are based on the dichotomously coded treatment
variable compared to treatment measured as participation rates in Table 3. Both tables begin
with a specification that includes demographic variables, student merit ratings, a control for the
spring semester, the treatment dummy variable, and interactions between the treatment and the
spring semester and with students’ year in school. We offer three specifications to evaluate the
robustness of our results: for specification 2 we add financial aid information; for specification 3
also add high school GPA and SAT scores; finally in the fourth specification keep the previous
added variables but omit the merit rankings.
The first specification in Table 2 indicates that inclusion in the treatment group increases
exam performance by 0.18 points, significant at the 5 percent level. To put that magnitude in
perspective, it is 21 percent of the value of the same semester GPA without the economics grade
(SemGPAminusECN) which proxy’s for student academic aptitude, both hard work and innate
ability. The treatment coefficient is roughly the same in column 3 but decreases slightly in
magnitude and significance when pre-college ability measures are added (specification 3) and
then when merit rankings are removed (specification 4).

16
Measuring treatment with participation rates yields larger coefficients (.24-.27) which are
significant at the 1 percent level, irrespective of the specification used and the inclusion various
control variables. All treatment intensity coefficients are from 32 to 30 percent of the value of
the parameter estimate of the same semester GPA without the economics grade
(SemGPAminusECN). Thus, SAGE seems like an efficient tool for significant productivity
gains if students can spend 5 minute of self-reflection once a week and generate such a pay off.
Beyond the treatment effect, a number of other coefficients significantly affect students’
course grades (see Tables 2 and 3). Academic ability measures strongly influence performance
in the course, namely same semester GPA minus the economics grade, high school grades, and
SAT verbal (but not math) scores. Note that merit rank variables “1or2” and “3or4” are strongly
significant until high school GPA and SAT scores are added since those are key variables used to
create the merit rankings. Asia-Hawaiian students did better than others, while those with “no
financial needs” performed worse.
Finally, the strongly positive freshman parameter estimate which is notable since first
year students typically perform worse than others, a major concern for retention. This may result
from the Supplemental Instruction (SI) which is required of all first year students in each of the
sections of ECN203. SI, designed to offer students a comfortable space where they can get high
quality help and guidance to enhance their success in ECN 203, is led by students who had this
instructor for ECN203 and did exceptionally well.2 See Appendix for more on SI
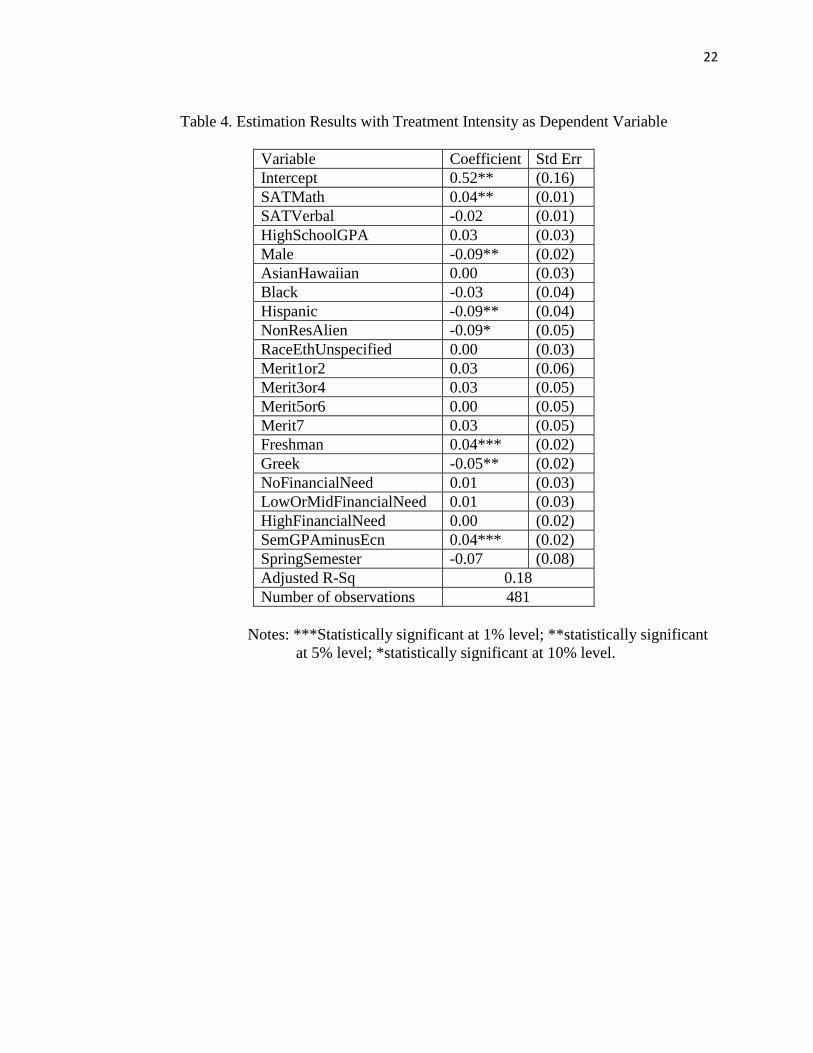
Given our findings of a treatment effect, we turn lastly to investigate the determinants of
participation rates. In Table 4 we report the results of a regression of our demographic and
control variables on SAGE participation rates. Freshman and students with high both semester
2 There are 6 SI leaders, each holds two sessions a week, so there are 12 alternative times from which to choose. End of semester student evaluations suggest that students find SI very helpful.

17
grades and SAT math scores completed a larger portion of the surveys, whereas males,
Hispanics, non-resident aliens and members of the Greek system completed fewer self-
assessment questions.
V. Conclusion
Although limited to a single professor’s classes, our results offer another empirical
analysis of the efficacy of collegiate academic support services to the small but growing body of
research regarding what faculty and administrators can do to improve academic outcomes.
Notably, SAGE is a program of very modest costs both in overhead to institutions of higher
education, of direct time to the faculty involved, and of students’ time.
18
Table 1. Descriptive Statistics
Total Sample Treatment Group
Control Group
Variable Mean Std Dev
Min Max Mean Std Dev
Mean Std Dev
Ecn203NumberGrade 2.86 (0.86) 0.00 4.00 2.91 (0.82) 2.81 (0.90)
Treatment Intensity
Treatment 0.49 (0.50) 0.00 1.00 1.00 (0.00) 0.00 (0.00)
SATMath 604.34 (74.79) 400.00 800.00 602.90 (74.50) 605.67 (75.20)SATVerbal 566.94 (77.58) 320.00 800.00 564.35 (75.28) 569.33 (79.74)HighSchoolGPA Male 0.53 (0.50) 0.00 1.00 0.50 (0.50) 0.55 (0.50) White 0.63 (0.48) 0.00 1.00 0.59 (0.49) 0.66 (0.47) AsianHawaiian 0.12 (0.32) 0.00 1.00 0.15 (0.36) 0.08 (0.28) Black 0.06 (0.23) 0.00 1.00 0.05 (0.22) 0.06 (0.24) Hispanic 0.06 (0.24) 0.00 1.00 0.06 (0.23) 0.07 (0.25) NonResAlien 0.03 (0.16) 0.00 1.00 0.02 (0.15) 0.03 (0.17) RaceEthUnspecified 0.11 (0.31) 0.00 1.00 0.12 (0.33) 0.09 (0.29) Merit1or2 0.19 (0.40) 0.00 1.00 0.18 (0.38) 0.21 (0.41) Merit3or4 0.24 (0.43) 0.00 1.00 0.27 (0.45) 0.21 (0.41) Merit5or6 0.21 (0.41) 0.00 1.00 0.20 (0.40) 0.22 (0.42) Merit7 0.30 (0.46) 0.00 1.00 0.30 (0.46) 0.29 (0.46) Freshman 0.46 (0.50) 0.00 1.00 0.45 (0.50) 0.47 (0.50) Greek 0.16 (0.36) 0.00 1.00 0.06 (0.23) 0.14 (0.34) NoFinancialNeed 0.14 (0.34) 0.00 1.00 0.12 (0.32) 0.16 (0.36) LowOrMidFinancialNeed 0.10 (0.30) 0.00 1.00 0.11 (0.32) 0.09 (0.29) HighFinancialNeed 0.47 (0.50) 0.00 1.00 0.48 (0.50) 0.47 (0.50) SemGPAminusEcn 3.13 (0.62) 0.86 4.00 3.12 (0.63) 3.14 (0.61) SpringSemester 0.51 (0.50) 0.00 1.00 0.50 (0.50) 0.51 (0.50) Number of observations 431 207 224
19
0 0. 1 0. 2 0. 3 0. 4 0. 5 0. 6 0. 7 0. 8 0. 9 1
0
5
10
15
20
25
30
35
40
Percent
t r eat mentTable

20
Table 2. Estimation Results with Treatment Coded as Discrete Variable Coefficient Std Err Coefficient Std Err Coefficient Std Err Coefficient Std Err Intercept -0.39 (0.28) -0.28 (0.29) -1.83*** (0.54) -1.68*** (0.39) SATMath 0.01 (0.05) 0.01 (0.05) SATVerbal 0.12*** (0.05) 0.12*** (0.05) HighSchoolGPA 0.32*** (0.11) 0.32*** (0.08) Male 0.02 (0.06) 0.01 (0.06) 0.02 (0.07) -0.01 (0.07) AsianHawaiian 0.24*** (0.10) 0.26*** (0.10) 0.30*** (0.11) 0.26*** (0.10) Black 0.15 (0.13) 0.17 (0.14) 0.25* (0.14) 0.22 (0.14) Hispanic -0.04 (0.13) -0.03 (0.13) 0.03 (0.13) 0.01 (0.13) NonResAlien 0.03 (0.16) -0.05 (0.16) 0.01 (0.17) 0.05 (0.17) RaceEthUnspecified 0.07 (0.10) 0.07 (0.10) 0.06 (0.10) 0.08 (0.10) Merit1or2 0.51*** (0.16) 0.53*** (0.16) 0.18 (0.19) Merit3or4 0.47*** (0.16) 0.48*** (0.16) 0.24 (0.17) Merit5or6 0.13 (0.16) 0.13 (0.16) 0.00 (0.16) Merit7 0.22 (0.16) 0.22 (0.16) 0.23 (0.16) Freshman 0.19*** (0.08) 0.19*** (0.09) 0.19*** (0.09) 0.18*** (0.09) Greek 0.09 (0.09) 0.06 (0.09) 0.09 (0.09) 0.07 (0.09) NoFinancialNeed -0.19* (0.10) -0.22*** (0.10) -0.22*** (0.10) LowOrMidFinancialNeed -0.12 (0.11) -0.12 (0.11) -0.13 (0.11) HighFinancialNeed -0.09 (0.08) -0.09 (0.08) -0.09 (0.08) SemGPAminusEcn 0.86*** (0.05) 0.85*** (0.05) 0.81*** (0.06) 0.81*** (0.06) SpringSemester -0.08 (0.08) -0.08 (0.08) -0.11 (0.08) -0.13 (0.08) Treatment 0.18*** (0.09) 0.18** (0.09) 0.16* (0.09) 0.15* (0.09) Upperclassmen*Treatment 0.09 (0.12) 0.10 (0.12) 0.09 (0.12) 0.08 (0.12) SpringSemester*Treatment -0.18 (0.12) -0.19 (0.12) -0.15 (0.12) -0.13 (0.12) Adjusted R-Sq 0.47 0.47 0.48 0.47 Number of observations 481 Notes: ***Statistically significant at 1% level; **statistically significant at 5% level; *statistically significant at 10% level
21
Table 3. Estimation Results with Treatment Intensity Variable Coefficient Std Err Coefficient Std Err Coefficient Std Err Coefficient Std Err Intercept -0.42 (0.27) -0.32 (0.29) -1.83*** (0.54) -1.71*** (0.39) SATMath 0.00 (0.05) 0.01 (0.05) SATVerbal 0.12*** (0.05) 0.12*** (0.05) HighSchoolGPA 0.32*** (0.11) 0.32*** (0.08) Male 0.03 (0.06) 0.02 (0.06) 0.03 (0.07) 0.00 (0.07) AsianHawaiian 0.23*** (0.10) 0.25*** (0.10) 0.30*** (0.11) 0.26*** (0.10) Black 0.16 (0.13) 0.18 (0.14) 0.25* (0.14) 0.23 (0.14) Hispanic -0.03 (0.13) -0.02 (0.13) 0.03 (0.13) 0.02 (0.13) NonResAlien 0.03 (0.16) -0.04 (0.16) 0.01 (0.17) 0.05 (0.17) RaceEthUnspecified 0.07 (0.10) 0.07 (0.10) 0.06 (0.10) 0.08 (0.10) Merit1or2 0.51*** (0.16) 0.54*** (0.16) 0.19 (0.19) Merit3or4 0.47*** (0.16) 0.48*** (0.16) 0.24 (0.17) Merit5or6 0.13 (0.16) 0.14 (0.16) 0.00 (0.16) Merit7 0.23 (0.15) 0.23 (0.16) 0.24 (0.16) Freshman 0.20*** (0.08) 0.20*** (0.08) 0.20*** (0.08) 0.20*** (0.08) Greek 0.09 (0.08) 0.07 (0.09) 0.09 (0.09) 0.08 (0.09) NoFinancialNeed -0.19* (0.10) -0.22*** (0.10) -0.22*** (0.10) LowOrMidFinancialNeed -0.11 (0.11) -0.12 (0.11) -0.13 (0.11) HighFinancialNeed -0.09 (0.08) -0.09 (0.08) -0.09 (0.08) SemGPAminusEcn 0.86*** (0.05) 0.85*** (0.05) 0.81*** (0.06) 0.81*** (0.06) SpringSemester -0.06 (0.08) -0.07 (0.08) -0.09 (0.08) -0.12 (0.08) Treatment Intensity 0.27*** (0.11) 0.27*** (0.11) 0.24*** (0.11) 0.24*** (0.11) Upperclassmen*Treatment Intensity
0.11 (0.12) 0.12 (0.12) 0.12 (0.12) 0.11 (0.12)
SpringSemester*Treatment Intensity
-0.23* (0.12) -0.23** (0.12) -0.20 (0.12) -0.18 (0.12)
Adjusted R-Sq 0.47 0.47 0.48 0.47
22
Table 4. Estimation Results with Treatment Intensity as Dependent Variable
Variable Coefficient Std Err Intercept 0.52** (0.16) SATMath 0.04** (0.01) SATVerbal -0.02 (0.01) HighSchoolGPA 0.03 (0.03) Male -0.09** (0.02) AsianHawaiian 0.00 (0.03) Black -0.03 (0.04) Hispanic -0.09** (0.04) NonResAlien -0.09* (0.05) RaceEthUnspecified 0.00 (0.03) Merit1or2 0.03 (0.06) Merit3or4 0.03 (0.05) Merit5or6 0.00 (0.05) Merit7 0.03 (0.05) Freshman 0.04*** (0.02) Greek -0.05** (0.02) NoFinancialNeed 0.01 (0.03) LowOrMidFinancialNeed 0.01 (0.03) HighFinancialNeed 0.00 (0.02) SemGPAminusEcn 0.04*** (0.02) SpringSemester -0.07 (0.08) Adjusted R-Sq 0.18 Number of observations 481
Notes: ***Statistically significant at 1% level; **statistically significant
at 5% level; *statistically significant at 10% level.
23
References Angrist, Joshua, Daniel Lang, and Philip Oreopoulos. 2007. “Incentives and Services for College
Achievement: Evidence from a Randomized Trial,” working paper (Feb.). Aston, Alexander W.; Banta, Trudy W.; Cross, K. Patricia; El-Khawas, Elaine; Ewell, Peter T.;
Hutchings, Pat; Marchese, Theodore J.; McClenney, Kay M.; Mentkowski, Marcia; Miller, Margaret A.; Moran, E. Thomas; Wright, Barbara D.. “9 Principles of Good Practice for Assessing Student Learning.” AAHE Principles: Assessment Forum. American Association for Higher Education. Original Source: http://www.aahe.org/assessment/principl.htm Cited 15 November 2007 from www.facet.iupui.edu/resources/AAHE%20Principles.pdf
Bettinger, Eric and Long (2005) “Addressing the Needs of Under-Prepared Students in Higher
Education: Does Remediation Work?,” working paper. Bloom, Dan and Colleen Sommo. 2005. “Building Learning Communities: Early Results from
the Opening Doors Demonstration in Kingsborough Community College,” MDRC Claxton, Guy and Karen Hinett. “Review of Enhancing Learning through Self-assessment by D.
Boud” Assessment in Education. Abingdon: Jul 1997. 4(2). 319-324 Jacobson, Rebecca. “Teachers improving learning using metacognition with self-monitoring
learning strategies.” Education, Summer 1998. 118(4). 579-591 Pintrich, Paul R.. “The role of metacognitive knowledge in learning, teaching, and assessing.”
Theory into Practice. Autumn 2002. 41(4). 219-225 Stander, Philip and Vimla Vadhan. “Metacognitive ability and test performance among college
students.” The Journal of Psychology. May 1994. 128(3). 307-309 Taylor, Shawn. “Better Learning Through Better Thinking: Developing Students' Metacognitive
Abilities.” Journal of College Reading and Learning. Fall 1999. 30(1), 34-45.

24
Appendix
On Supplemental Instruction (from syllabus – reformatted):
Supplemental Instruction, hereafter SI, is designed to offer you a comfortable space where you can get high quality help and guidance to enhance your success in ECN 203. SI is a program that targets the individual needs/concerns/curiosities of students as a complement to the broader format of the ECN 203 lectures.
SI leaders are undergrads selected based on the following criteria: • They took ECN 203 and did an excellent job, so they have mastered what you are working to master. • They have a resume that reflects overall excellence in their academic work and a commitment to
working with and helping others. • They have demonstrated through recommendations and conversations with me that they are good,
approachable people who will make it easy for you to ask questions and valuable for you if you do so.
SI is open to all, and all are encouraged to participate! First year students are required to attend at least one SI Session each week.
SI Sessions are 55 minute sessions held in a classroom and open to all. Each SI leader will hold two of these SI sessions a week for a total of 12 (see schedule at http://faculty.maxwell.syr.edu/jevensky/ecn203/help/si.htm). There are sufficient SI sessions for all to find a comfortable time and space, but space in any particular session is first come, first serve. The primary purpose of these sessions is to answer your questions about
• Concepts, graphs, or any other material covered in class or in the text on which you need more
clarification. • Strategies for success in the class in general and on the homeworks, Questions, and Exams in
particular. • Homeworks prep (SI leader will give you guidance on how to approach questions, not the answers.)
In addition to answering your questions, the SI leader may initiate activities designed to help you develop your
mastery of the ideas and issues covered in the course. The content and culture of the SI experience is determined by the SI leader. I do not attend these sessions and I
do not micro manage them. I have immense respect for the people I choose to be SI leaders and I communicate with them if they have questions for me, but on the whole I leave it to them and their creativity to make the SI experience valuable for you.
Over the years my confidence in the SI leaders has been consistently well founded. Those who have attended SI have almost all found it to be an invaluable tool for success in the class. On evaluations SI is consistently cited as a great resource. I strongly encourage you to take advantage of this resource.
On Grad Scaling (from syllabus – reformatted):
Grading is on an absolute scale. There are 500 points total possible in the course. 450-500 is the A range, 400-449 is the B range, 350-399 is the C range, 300-349 is the D range, and below 300 is an F. The only adjustment may come at the end of the course after all assignments have been graded. If at that point it appears to me that there may be a problem with the assessment process, then an adjustment may be made. Note: The scale will never be shifted upward (i.e., made harder). Here’s what this means in practice:
There are 500 points in this course. When the number of points each person has received for the entire course is determined, I line these numbers up in rank order from top to bottom. At that point, I first look to see if, by my absolute standards, “are there any A students in the results?” I know there are A students in my class. If the results are so skewed downward that no one or very few folks get an A, I look for any systematic problems in the assessment process. If there is a problem I shift the entire scale to adjust for my mistake.
With this scale as a point of departure, I then look at the cutoffs I’ve established between grades to see if they actually occur at natural breaks (significant gaps) in the distribution. My students have been very kind over the years – I find that there are often natural breaks, significant gaps, in the distribution of total points very close to my

25
cutoffs. If there is a natural break a bit below the cutoff I’ve tentatively set, I shift my cutoff down to that more natural position (I never shift up). Then, and only then, do I go back and assign +s and -s to the As, Bs, and Cs. Again, I do this by looking for natural breaks. I move from the top to the bottom in each grade category looking for that break in the list that says “this is the last person whose performance is like those above him/her than below.”
The whole process is always tedious and often stressful, but I belabor it because I care deeply about fairness. The only absolute with respect to the numbers is the initial guarantee that if you get into the ranges cited above you will get at least the grade cited. Beyond that the numbers are just guides.

26
Treatment Group Questionnaire (format adapted for presentation here)
1) I missed this many classes this past week: 0
2) I raised my hand in class about this many times this past week: 0
3) I dedicated about this many hours to ECN203 outside of class this past week: 0
4) I have checked the syllabus and I know where I'm supposed to be in the reading:
Yes No
5) I am this up to date with the reading:
Reading? We have reading? I'm way behind I'm behind I'm close I'm there
6) I'm this up to date on mastering (as described on page 313 of the text) the objectives we have covered to date:
Objectives? What objectives? I'm way behind where I should be I'm behind where I
should be I'm close I'm fully up to date on mastering the objectives
7) I've worked with others on ECN203 (e.g., office hours, SI, study group) this many times this past week:
0 1 2 3 4 or more
8) I've reviewed the answer key for this past week's graded homework and understand the correct answer:
Yes No
9) My current understanding of the ECN203 material can best be described as:
I'm lost Weak OK Good Excellent
10) One thing I can do to improve my ECN203 performance is:
11) One thing Mr.e can do to improve his ECN203 performance is:

27
12) The goal in ECN203 is to help you understand and learn economics as a tool for systematic thinking that empowers you to reflect on and think critically about the ideas and issues in your life and in the world around you. How are we doing? On a scale of 0 to 10 where 0 means "no value" and 10 means "great value", how much of that value of economics as a tool for systematic critical thinking have your gained from ECN203 to date?
0
13) As of today, my estimate of my expected grade in ECN203 is close to:
F D C- C C+ B- B B+ A- A Control Group Questionnaire (format adapted for presentation here) 1) I attended this many extra-curricular or Syracuse community events/activities this past week. (In this survey, extra-curricular or Syracuse community events/activities are defined as non-academic, organized events/activities, on or beyond campus.)
0 1 2 3 4 5 or more 2) I dedicated about this many hours to active participation in extra-curricular or Syracuse community events/activities this past week:
0 1 2 3 4 5 6 7 8 9 or more 3) The best description of my feelings about how easy it is for me to get engaged/involved with extra-curricular or Syracuse community events is:
I can't do it I have a big problem doing it I have a problem doing it It's pretty easy for
me It's very easy for me 4) If there's an obstacle to my getting engaged/involved with extra-curricular or Syracuse community events, I'd describe it as:
5) I'm feeling this level of comfort with my campus life:
I'm lost Weak OK Good Excellent 6) One thing I can do that might increase my comfort with my campus life is:
7) One goal of an SU education is to develop your engagement/involvement with the SU community and/or the larger Syracuse community. How is it going? On a scale of 0 to 9 where 0 means "no engagement" and 9 means "totally engaged", how would you rate your current level of community engagement?
0

28
8) One thing SU could do to increase my engagement/involvement with the SU community and/or the larger Syracuse community is:
9) This past week I dedicated in the range of this many hours to my academic activities (e.g., class time, lab time, study time, etc.)
10 or less 11-15 16-20 21-25 26-30 31-35 36-40 41-45
More than 45 10) As of today, my estimate of my expected grade in ECN203 is close to:
F D C- C C+ B- B B+ A- A