closing the gap - make uk
TRANSCRIPT

CLOSING THE GAP 1MakeUK.org/uksteel
CLOSING THE GAP: HOW COMPETITIVE ELECTRICIT Y PRICES C AN BUILD A SUSTAINABLE LOW-C ARBON STEEL SECTOR
February 2021

CLOSING THE GAP 2
Summary
CONTENTS
1. Executive Summary 3
2. Introduction 5
3. Overview of the UK steel sector 3
3.1. Steel production and energy costs 7
4. Price disparity 8
4.1. Causes of disparity 10
4.1.1. Network costs 10
4.1.1.1. Targeted Charging Review 10
4.1.2. Policy Costs 12
4.1.3. Wholesale costs 12
5. Effect of price disparity on UK sector 13
5.1. Decarbonisation of steel production 13
5.2. International competitiveness 13
5.3. Investment 14
6. Options for lowering the price disparity 15
6.1. Our recommendations 15
7. Methodology 17
8. UK Steel 18
9. Appendix 19
9.1. Benefits to the energy system 19
9.2. Causes of higher wholesale costs 20
CONTENTS
CLOSING THE GAP 2

CLOSING THE GAP 3
Here UK Steel presents its fifth annual benchmarking exercise investigating the energy prices faced by steel producers based in the UK, Germany, and France.
This year, our results show the average electricity price UK steel producers typically face in 2020/21 has reached £47 per megawatt-hour (MWh) compared to the estimated German price of £25/MWh and French price of £28/MWh. Therefore, UK production sites are paying 86% and 62% more, respectively, than their main competitors. The price disparities revealed by our research equate to a total additional cost to UK steel producers of around £54 million per year compared to those in Germany. Over the past five years, the disparity has cost the UK sector an additional £254 million. These additional costs represent funds that should and would have been directed towards critical capital investment, including decarbonisation efforts. Indeed, UK steel companies have long committed to reinvest any savings achieved resulting from Government action on this issue back into their UK plants. Therefore, achieving price parity with Germany would deliver at least an additional £54m/year of investment in the sector. All major UK steel producers are part of international companies, and the cost competitiveness of each national market is crucial to attracting investment. Persistent cost disadvantages in the UK lead to underinvestment, which in turn leads to further erosion of competitiveness.
CLOSING THE GAP 3
Figure 1: Energy prices for steel producers in France, Germany, and the UK (2020/21)
Source: UK Steel
£
50
40
30
20
10
0
£/M
Wh
France Germany UK
£28.74
£25.00
£46.60
n Wholesale costs (excl. carbon costs) n Network costsn Policy costs incl. carbon costs, after exemptions
The UK’s energy intensive industries face some of the highest industrial electricity prices in the world. This severely damages the steel sector’s competitiveness, as it is both electro-intensive and highly exposed to international competition, meaning it cannot pass on additional costs to customers. For the most electro-intensive producers, electricity can even represent a greater proportion of manufacturing costs than their labour cost. With UK steel producers’ levels of investment and direct competitiveness both being affected, electricity prices are a major barrier to meeting the Net Zero target and the recovery from the economic impact of the COVID-19.
1. EXECUTIVE SUMMARY
1. Executive Summary

1. Executive Summary
It is also becoming increasingly apparent that the price disparity is a barrier to meeting the Net Zero target, since all options for decarbonising steel production, from CCS, to hydrogen, to electric arc production, lead to significantly increased electricity consumption. Steel plant investment goes to the most cost-competitive regions, and increasingly that will be those with internationally competitive power prices. The UK Government must address the price disparity levelling electricity prices in line with our competitors to ensure that the sector can invest in new, low-carbon, but electricity-intensive production methods. This is a problem that goes to the very heart of the Government’s proposed ‘Green Industrial Revolution’.
While the level of UK power prices is not a new problem, it looks set to get significantly worse in the year ahead.
Reforms from the UK energy regulator, which are due to be implemented in 2022, could lead to network charges 24 - 60 times higher than comparable producers Germany and France. If these reforms are implemented, with no mitigating action from the Government, the cost of the power price disparity could easily grow from the current £54m per annum to over £100m which would lead to long-term damage to the UK steel industry and the jobs it provides.
This report focuses primarily on the immediate steps that the Government can take here and now to lower electricity prices and support employment and investment in our sector’s transition to the net zero carbon economy. Crucially, the UK’s exit from the EU opens up new options for the Government to address this issue, and it is vital it grasps this opportunity.
CLOSING THE GAP 4
Implementing the above recommendations for the steel sector would come to a total annual cost of £45m-£54m and reduce the electricity price disparity by £20/MWh. This report recommends that the costs of these proposals should be socialised, rather than laying it directly with other energy consumers. It is entirely within the discretion of Government,
Recommendations:
Implement German/French style network cost reductions
Increase the level of renewable levy exemptions
Provide 100% compensation for the Carbon Price Support’s indirect costs
Provide an exemption from Capacity Market costs
Link UK ETS to the EU ETS and compensation for indirect costs
Track industrial energy price disparities between countries
123456
as there are no regulatory trade barriers to implementing them. Through these proposals, the Government can create a competitive business landscape for the steel sector to thrive now that the UK has become an independent trading nation while supporting well-paid, highly skilled British jobs.

CLOSING THE GAP 5
2. Introduction
2. INTRODUCTIONThe Government’s own data shows1 that the UK has the highest industrial electricity prices in Europe. UK prices for extra-large industrial users currently stand 84% above the European median. All UK steel producers consistently cite this fact as harmful to their competitiveness, an impediment to investment, and decarbonisation.
The reasons for this are straightforward and are worth noting:
– Steel production and processing is an energy intensive process. Although energy efficiency has improved significantly over the past decades, the production of millions of tonnes of steel each year will consume vast amounts of energy, including electricity. In the UK, it is estimated that electricity costs represent up to 20% of ‘conversion costs’ on-site – i.e., the costs of converting the basic raw materials into steel. For the most electro-intensive producers, energy can even represent a greater proportion of operating costs than their labour cost.
– Steel is an intensively traded product, with 30-40% of the 1.9 billion tonnes of steel produced globally each year travelling across national borders. The UK imports some 6.1 million tonnes of steel each year, around 61% of requirements, and exports 3.2 million tonnes, about 45% of its production.
– The steel sector is one that must operate on relatively thin margins. Whilst there are increasingly specialised and high-value steels being produced, market requirements and economies of scale mean that the vast majority of steel made even in developed economies is commoditised and available from a broad range of sources. There is, therefore, intense competition, which keeps steel prices and margins low.
– High electricity prices generally lead to smaller profits and thus to less reinvestment. Further, high electricity prices also act as a disincentive to investment from international steel companies, with the UK seen as a less favourable investment location than other countries.
– The three main routes to decarbonise integrated sites (CCS, hydrogen, and electrification) all involve higher electricity consumption. High electricity price is thus a substantial barrier to meeting the Net Zero target.
– For the foreseeable future, the UK’s principal competitors are based in the EU. Around 4.7 million tonnes, or 66% of total UK imports in 2019, came from the EU, and the UK sent 2.5 million tonnes, 79% of its exports, across the Channel. Price differentials between the UK and EU competitors are particularly important to the health of UK steel producers; electricity costs have become the most persistent and stark of these cost differentials in recent years. As an independent trading nation, it is more important than ever to improve the cost base for steel producers here in the UK.
The UK’s high electricity price is a major ongoing concern for the steel sector and its long-term sustainability. UK Steel has conducted its benchmarking research examining the prices paid by their members based in the UK and, where possible, by their sister facilities in Germany and France. Where necessary, this has been supplemented with published data from other international price comparison studies. This report represents our fifth annual examination of the electricity price disparity between the UK and European competitors.
1BEIS, Industrial electricity prices in the EU, QEP 5.4.4, 2020

3. Overview of the UK steel sector
K
3. OVERVIEW OF THE UK STEEL SECTOR
31,900PEOPLE DIRECTLY EMPLOYED BY THEUK STEEL INDUSTRY
52,300FURTHER JOBS SUPPORTED IN SUPPLY CHAIN & LOCAL COMMUNITIES
£1.6DIRECTCONTRIBUTION TOTHE UK ECONOMY
£3.9ADDITIONALCONTRIBUTION CREATEDIN SUPPLY CHAINS &LOCAL COMMUNITIES
bn bn
AVERAGE STEEL SALARY 28% HIGHER THAN THE NATIONAL AVERAGE
AVERAGE STEEL SALARY 46% HIGHER THAN THE AVERAGE IN WALES AND YORKSHIRE &HUMBERSIDE
7.2STEEL PRODUCED AYEAR, EQUIVALENTTO 71% OF UK’S10.2MT DIRECTANNUAL STEELCONSUMPTION
£3.2POSITIVECONTRIBUTIONTO THE UK TRADEDEFICIT VIA EXPORTS
mt bn28% 46%
Figure 2: Steel employees across UK regions and sector salary
Source: ONS data and UK Steel analysis, 2017CLOSING THE GAP 6
12,000
10,000
8,000
6,000
4,000
2,000
0
£38,000
36,000
34,000
32,000
30,000
28,000
26,000
24,000
22,000
20,000
York
s &
Hum
Wal
es
Wes
t Mid
land
s
Nor
th E
ast
Nor
th W
est
Sout
h W
est
Scot
land
East
Mid
land
s
East
Sout
h Ea
st
Lond
on
n Steel employees Mean regional salary Mean UK salary Mean steel salary

CLOSING THE GAP 7
3. Overview of the UK steel sector
3.1. STEEL PRODUCTION AND ENERGY COSTS
Steel production is an extremely energy intensive process. There are two principal methods of producing steel: by recycling scrap steel in an electric arc furnace (EAF - Cardiff and Sheffield), which requires large amounts of electricity and more modest amounts of natural gas; or from iron ore using blast and basic oxygen furnaces at an integrated site (Port Talbot and Scunthorpe), which consume large quantities of coal, electricity, and some natural gas. Beyond the steel production itself, significant volumes of energy are used in downstream processes such as rolling, plating, and drawing. Much of this will occur on the same steel site as the steel production itself, but large volumes of steel are further processed at separate locations.
The proportion of the total costs of steel production that are attributable to energy vary significantly, from site to site and from country to country. The World Steel Association has estimated a global benchmark for energy on comprising an average of 20%2 of the cost of steel production. For integrated sites, the energy components are on average 50% coal, 35% electricity, 5% natural gas and 5% other gases3. For an EAF, the figures are approximately 75% electricity and 25% natural gas4.
An alternative demonstration of energy intensity is used by the UK Government when judging eligibility for various reductions in policy costs, such as renewables levies, added to bills. This requires companies to show that their electricity costs represent at least 20% of their Gross Value Added (GVA - i.e., total economic impact in terms of profit and jobs5). With steel companies in the UK demonstrating electro-intensities of up to 120%6 on this scale, it is clear the detrimental impact high electricity prices are having on profits, investment, and long-term sustainability within the steel sector.
To meet its Net Zero target, the UK needs to decarbonise its industrial production within the next decades, with the
Climate Change Committee suggesting integrated steel production should eliminate its emissions by 2035. However, all options for decarbonising the steelmaking process leads to increased electricity consumption. Available data suggests that converting the UK’s blast furnace steel production to hydrogen-based steelmaking could increase electricity consumption by 800%, a theoretical shift to 100% electric arc furnace production would increase power consumption by 300%, whilst the application of carbon capture technology could be expected to increase power consumption on a steel site substantially. This makes electricity prices not just a present-day issue, but a problem that will continue to exist in the future. It is highly unlikely that the sector will be able to meet the Net Zero target while remaining profitable if electricity prices are not addressed today.
It is important to point out that when the UK steel sector talks of uncompetitive energy prices, it specifically talks about electricity prices. Coal prices are set on a world market and, excluding state-subsidised coal supplies that some steel companies may be provided with, are broadly the same everywhere. Natural gas prices vary significantly from region to region, with very low prices in the US compared to very high ones in Japan. But with gas making up a smaller proportion of energy input of steel production, and somewhat limited steel trade between the UK and these regions, gas price differentials do not currently play a significant role in the cost competitiveness of UK producers.
It is also worth noting that the common claim that the UK experiences a price advantage with the EU in relation to gas and that this helps alleviate any cost disadvantage regarding electricity, is not supported by the data. Any difference in gas prices is so insignificant that it does not offset the enormous price difference in electricity prices7.
2World Steel Association (2015) Energy use in the steel industry 3World Steel Association (2015) Energy use in the steel industry 4UK Steel Climate Change Agreement data5GVA classified as Earnings (Before Interest, Taxation, Depreciation and Amortisation) plus all employee costs 6As demonstrated through applications to UK’s “Compensation for the indirect costs of the Renewables Obligation and Feed-in-Tariffs” scheme.7CREG/PWC (2020), A European comparison of electricity and gas prices for large industrial electricity consumers

CLOSING THE GAP 8
4. Price disparity
4. PRICE DISPARITYAggregated data collated at EU level has often been used to illustrate industrial electricity prices8. However, these present a misleading picture, as they do not accurately capture all the various exemptions and compensation given to our EU competitors and thereby the commercial reality experienced by steelmakers.
If fully considering all the various interventions, compensations and compensations provided by Governments in support of their energy intensive industrial bases, the average price faced by UK steelmakers for 2020/21 is £47/MWh compared to the estimated German price of £25/MWh. This indicates a price disparity of 86% – or a UK surcharge of £21.60/MWh. The disparity with French prices for 2020/21 is slightly lower at £17.86/MWh, or 62%.
As illustrated in figure 4, overall electricity prices have decreased marginally compared to last year, in both the UK and Germany, due to COVID-19 impacts on energy consumption. However, the price disparity still persists with UK steelmakers facing prices that are £22 and £18 higher than German and French competitors, respectively.
8https://www.gov.uk/government/statistical-data-sets/international-industrial-energy-prices9It should be noted that in both cases the carbon costs from the EU Emissions Trading System (ETS) and Carbon Price Support (CPS) have been deducted from the wholesale costs and added to the policy costs (including appropriate compensations) to better reflect the true nature of the policy costs.
Figure 4: Comparison of Electricity prices for the UK and German Steel producers 2016/17 to 2020/21
Source: UK Steel
Figure 3: Energy prices for steel producers in France, Germany, and the UK (2020/21)9
Source: UK Steel
£
50
40
30
20
10
0
£/M
Wh
France Germany UK
£28.74£25.00
£46.60
n Wholesale costs (excl. carbon costs) n Network costsn Policy costs incl. carbon costs, after exemptions
£80
70
60
50
40
30
20
10
0
£/M
Wh
Germany UK Germany UK Germany UK Germany UK Germany UK2016/17 2017/18 2018/19 2019/20 2020/21
+£17
+£18
+£22
+£19+£22
n Wholesale costs (excl. carbon costs) n Network costs n Policy costs incl. carbon costs, after exemptions
CLOSING THE GAP 9
4. Price disparity
Figure 5: Electricity prices for the UK and French Steel producers 2017/18 to 2020/21
Source: UK Steel
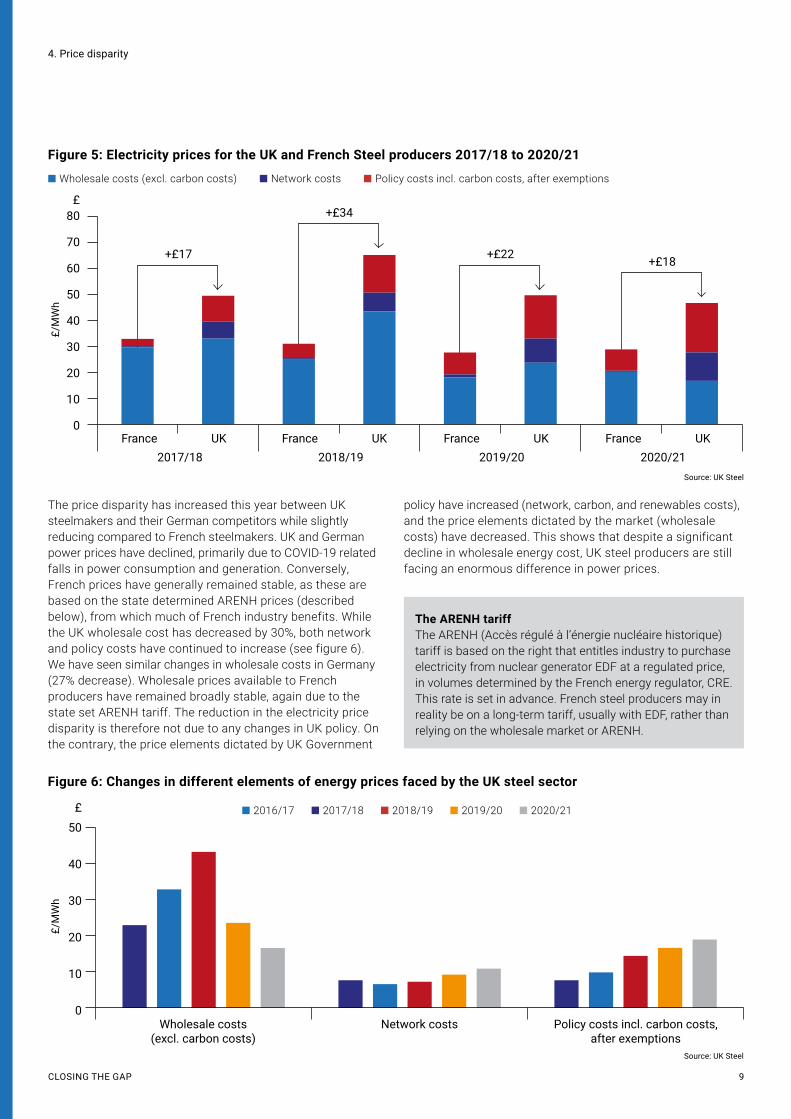
The price disparity has increased this year between UK steelmakers and their German competitors while slightly reducing compared to French steelmakers. UK and German power prices have declined, primarily due to COVID-19 related falls in power consumption and generation. Conversely, French prices have generally remained stable, as these are based on the state determined ARENH prices (described below), from which much of French industry benefits. While the UK wholesale cost has decreased by 30%, both network and policy costs have continued to increase (see figure 6). We have seen similar changes in wholesale costs in Germany (27% decrease). Wholesale prices available to French producers have remained broadly stable, again due to the state set ARENH tariff. The reduction in the electricity price disparity is therefore not due to any changes in UK policy. On the contrary, the price elements dictated by UK Government
policy have increased (network, carbon, and renewables costs), and the price elements dictated by the market (wholesale costs) have decreased. This shows that despite a significant decline in wholesale energy cost, UK steel producers are still facing an enormous difference in power prices.
Figure 6: Changes in different elements of energy prices faced by the UK steel sector
Source: UK Steel
The ARENH tariffThe ARENH (Accès régulé à l’énergie nucléaire historique) tariff is based on the right that entitles industry to purchase electricity from nuclear generator EDF at a regulated price, in volumes determined by the French energy regulator, CRE. This rate is set in advance. French steel producers may in reality be on a long-term tariff, usually with EDF, rather than relying on the wholesale market or ARENH.
£80
70
60
50
40
30
20
10
0
£/M
Wh
France UK France UK France UK France UK2017/18 2018/19 2019/20 2020/21
+£17
n Wholesale costs (excl. carbon costs) n Network costs n Policy costs incl. carbon costs, after exemptions
+£34
+£22 +£18
£
50
40
30
20
10
0
£/M
Wh
Wholesale costs (excl. carbon costs)
Network costs Policy costs incl. carbon costs, after exemptions
n 2016/17 n 2017/18 n 2018/19 n 2019/20 n 2020/21

CLOSING THE GAP 10
4. Price disparity
4.1. CAUSES OF DISPARITY
Several underlying factors contribute to the price disparities with France and Germany that are worth highlighting.
4.1.1. Network costs
Total network costs across all users are similar in the UK, France, and Germany at around €33–36/MWh. However, industrial consumers pay a far higher proportion in the UK, whereas the French and German Governments have chased to reduce network costs for industry10 recognising both the importance of this to international competitiveness and the vital role large energy users play in balancing the power networks. French and German steel sites examined for this report have networks prices at around £1/MWh compared to £9/MWh in the UK or £11/MWh once distribution charges are included. This £11/MWh can be further split as follows:
– Balancing costs - £4.84/MWH– Transmission costs - £4.15/MWh– Distribution costs (where relevant) - £1.93/MWh.
As such, a UK transmission-connected steel site faces over eight times higher network charges than their competitors, with distribution connected sites paying over ten times more. To be clear, the overall system costs for the electricity network are very similar in France, Germany, and the UK. Therefore, the problem does not lie with a more or less expensive electricity network, but how these costs are allocated to consumers.
4.1.1.1. Targeted Charging Review
In 2022, the energy regulator, Ofgem, is implementing a major new network reform, known as the Targeted Charging Review (TCR), which will increase network charges even further for steel producers. The process by which the reforms will be practically implemented is still being developed, and our estimated impact is therefore based on the latest proposals as understood by our members11. Based on the available data, when implemented the TCR reform will increase network costs by 200 to 300%. This would lead to a situation where steel producers in the UK face network charges 24 - 60 times higher than their main competitors in Germany and France, respectively, making network charges the single largest electricity price element in the UK.
10Ibid.11CUSC Workgroup Consultation (2020), CMP343 & CMP340: Transmission Demand Residual Bandings and allocation (TCR), 10 July 2020, Annex 8, https://www.nationalgrideso.com/industry-information/codes/connection-and-use-system-code-cusc-old/modifications/cmp343-and-cmp340
Figure 7: Network prices faced by steel producers
Source: UK Steel
£
12
10
8
6
4
2
0
£/M
Wh
FranceGermany UK
£1.07£0.44
£10.93
n Network costs n Balancing costs (BSUoS)n Transmission costs (TNUoS) n Distribution costs (DUoS)
Figure 8: TCR-related network charges, the average impact for the steel industry
Source: UK Steel
£
30
25
20
15
10
5
0
£/M
Wh
Germany France UK (One-band TCR)
£1.07 £0.44
£20.82
n Current network charges (excluding distribution charges) n Potential additional TCR charges
£26.41
UK (Two or Four-band TCR)
CLOSING THE GAP 11
4. Price disparity
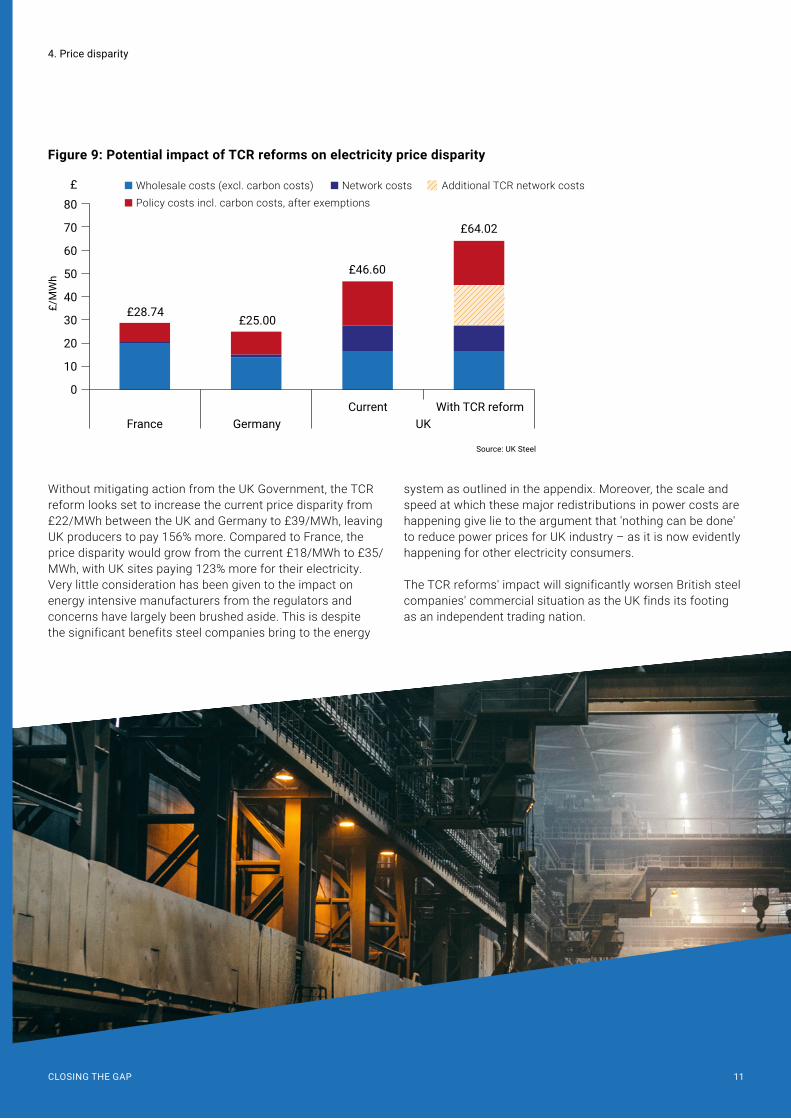
Without mitigating action from the UK Government, the TCR reform looks set to increase the current price disparity from £22/MWh between the UK and Germany to £39/MWh, leaving UK producers to pay 156% more. Compared to France, the price disparity would grow from the current £18/MWh to £35/MWh, with UK sites paying 123% more for their electricity. Very little consideration has been given to the impact on energy intensive manufacturers from the regulators and concerns have largely been brushed aside. This is despite the significant benefits steel companies bring to the energy
Figure 9: Potential impact of TCR reforms on electricity price disparity
£
80
70
60
50
40
30
20
10
0
£/M
Wh
France
n Wholesale costs (excl. carbon costs) n Network costs Additional TCR network costs n Policy costs incl. carbon costs, after exemptions
GermanyCurrent With TCR reform
UK
system as outlined in the appendix. Moreover, the scale and speed at which these major redistributions in power costs are happening give lie to the argument that 'nothing can be done' to reduce power prices for UK industry – as it is now evidently happening for other electricity consumers.
The TCR reforms' impact will significantly worsen British steel companies' commercial situation as the UK finds its footing as an independent trading nation.
Source: UK Steel
£28.74£25.00
£46.60
£64.02

CLOSING THE GAP 12
4. Price disparity
4.1.2. Policy Costs
UK policy costs, including levies to pay for renewables schemes like the CfD, Capacity Market costs, and carbon prices, are also an important factor in the disparity in electricity prices. Gross UK policy prices are £71/MWh, reduced by exemptions and compensations to a net £19/MWh. This is significantly higher than the net £10/MWh paid by steel companies in Germany and £8/MWh in France, again once compensations and exemptions are applied. The chief reasons for this difference in policy-related costs are detailed as follows:
– The German Government has chosen to minimise the costs of renewables levies on its most energy intensive industry. Capping these levies at the equivalent of 0.5% of GVA, provide the equivalent of a roughly 95% exemption from renewable energy costs. UK steel companies meanwhile get a maximum exemption of 85%. Renewables costs (after exemption) for steel companies examined in Germany are almost £3/MWh compared to £6/MWh in the UK.
– Since 2013, the UK has chosen to have a higher carbon price than the EU – putting in place the Carbon Price Support (CPS) to increase the overall carbon price faced by UK power generators. Some compensation for these costs is provided in all three countries to energy intensive
industry, but even taking this into account, the CPS adds a further £4/MWh to the disparity. (This is in addition to its impact on setting the marginal supply, as explained in appendix 9.2.) The Government aims to consult on the current compensations provided for the indirect costs of carbon costs and the CPS. However, it has already announced that the compensations will be reduced.
– The UK is one of the few in the world to have a Capacity Market and a corresponding levy on energy consumers to pay for it. This adds a further £1.5/MWh to UK power costs.
4.1.3. Wholesale costs
UK wholesale power prices have long been higher than in Germany and France. This is primarily due to the different power generation mixes in France and Germany, driven to a significant degree by government policy. France has a higher proportion of old nuclear power (underpinning the ARENH rate discussed above) than the UK, and Germany remains heavily reliant on coal and lignite compared to the gas-dependent UK. Discounting the carbon costs, German wholesale prices this year are in the region of £14/MWh compared to £17/MWh for the UK, whilst French steel plants continue to draw on the £20/MWh ARENH price. A further detailed explanation of the fundamental causes of higher wholesale costs is outlined in the appendix.
Figure 10: Policy Costs
£
20
15
10
5
0
£/M
Wh
France
n Policy costs n Feed-in Tariffs n Renewables Obligation n Contracts for Difference n Capacity Market n Carbon price costs
Germany UK
£8.21£9.89
£19.01
Source: UK Steel

CLOSING THE GAP 13
5. Effect of price disparity on UK sector
5. EFFECT OF PRICE DISPARITY ON UK SECTOR
5.1. DECARBONISATION OF STEEL PRODUCTION
The Government's Net-Zero target will require fundamental changes to steel production in the UK and will necessitate substantial investment in new processes and equipment over the next dozen years. The Climate Change Committee has recommended that the ore-based steelmaking sites be near-zero emissions by 2035. Should this recommendation be adopted by the Government, then billions will need to be invested in the UK to enable this transition. Although separate support will be required for this and the further decarbonisation of the electric arc furnace sites, high industrial electricity prices remain a substantial barrier to persuading the multi-national steel companies to invest in the UK.
The options for decarbonising the integrated steelmaking process involve CCS, electrification, and fuel switching (e.g., hydrogen). All these options, but in particularly
electrification and hydrogen steelmaking, leads to increased electricity consumption. Carbon Capture and Storage (CCS) experience energy losses of 8-15% when capturing 15-28% of emissions, so it would likely see much higher energy losses when capturing 80-90%, and thus much higher electricity consumption. If the integrated sites electrified, power consumption would increase more than 300%, and hydrogen-based steel production would increase the entire sector's electricity demand by over 800% if based on green hydrogen. A systemically higher electricity price would be a substantial barrier to any investment in decarbonisation options, as this would further worsen the industry's ability to compete with European and global steelmakers. Thus, lower industrial energy prices are a basic necessity for the industry to start decarbonising its production and, therefore, play an integral part in helping the UK Government meet its 2050 target.
5.2. INTERNATIONAL COMPETITIVENESS
The direct impact of the UK's high electricity prices is on the steel manufacturers' international competitiveness. Raw materials such as iron ore and coal are sold in global markets, and there will, therefore, be little difference in the price of iron ore used in France and the UK. It is where there are national and regional variations in costs that competitiveness issues arise. As outlined above, electricity costs can represent up to 120% of UK steel producers' GVA and around 20% of their
conversion costs . As they are competing in an international market, they are unable to pass on any additional costs over and above those faced by their competitors. A consistently higher energy price, therefore, impacts their ability to compete and diminishes their profitability. The power price disparities identified in this report translate into a total additional cost to UK steel producers compared to those in Germany of around £54 million per year13.
12Conversion costs are a manufacturer's production costs other than the cost of a product's direct materials and includes labour costs.13Electricity Consumption figure updated from ISSB. 2017 steel sector consumption of imported electricity was 2.5TWh.

CLOSING THE GAP 14
5. Effect of price disparity on UK sector
5.3. INVESTMENT
Besides the impact on direct competition, the more insidious impact is on long-term investment. All the major steel producers in the UK are part of multi-national companies with facilities in the EU and four also operating outside the EU. In this context, the cost competitiveness of each particular market is crucial to attracting investment. Persistent cost disadvantages in the UK lead to underinvestment, which in turn leads to further erosion of competitiveness. As outlined
below, this also has huge ramifications for investment in decarbonisation and meeting the Net Zero target.
Over the past five years, the industry has paid £256m more for their electricity than their competitors in Germany and £227m more than steelmakers in France. To place this in context, the average annual capital investment in the UK sectors is £200 million.
In 2017, 2018 and 2019 UK steel producers made a firm and direct commitment to Government that all savings on electricity costs resulting from Government action would be reinvested in the UK, including on decarbonisation measures. Such unambiguous commitment makes clear the impact on investment the UK's high power prices is having. Millions in capital investments are lost every year this continues.
Figure 11: Additional costs to UK steel sector due to electricity price disparity, compared to Germany
Source: UK Steel
£million
300
250
200
150
100
50
02016/17 2017/18 2018/19 2019/20 2020/21 Cumulative costs
2016-2021
£55m
£44m
£55m
£47m
£54m
£256m

6. Options for lowering the price disparity
6. OPTIONS FOR LOWERING THE PRICE DISPARITYThe Conservative Party has previously committed to delivering the lowest energy costs in Europe for domestic and industrial consumers14 and promised in the Industrial Strategy to make the UK the best place to start and grow a business. This included launching the Industrial Energy Transformation Fund and the Clean Steel Fund, which are vital and most welcome interventions but cannot alter the immediate and related challenge on electricity costs.
Steel companies outside the UK are making similar investments in energy efficiency but also have the major benefit of lower electricity costs. A competitive cost base on electricity would facilitate millions in new investments, many of them in energy efficiency and decarbonisation measures. This should be the first port of call for Government actions to support the steel sector. Outside of the EU's regulatory sphere, the UK can now review the energy price frameworks to provide energy intensive industries the best platform to grow and thrive.
Action on electricity will demonstrably lead to a significant increase in investment, capacity, and jobs within the steel
14Conservative Party Manifesto (2017) http://lp.dehavilland.co.uk/rs/543-BOR-062/images/ConservativeManifesto2017.pdf#page=24 15Office for Budget Responsibility, Environmental levies in Table 4.12, Economic and fiscal outlook March 2019.
sector, delivering benefits to the broader manufacturing sector and the UK economy while supporting COVID-19 recovery and facilitating the transition to Net Zero.
Outside of the EU, the UK has considerably more regulatory freedom at its disposals. The proposals set out below, have been implemented by EU countries and are therefore permissible under the EU's state aid and regulatory framework. However, the UK now obviously sits outside this framework and has considerable flexibility to go further in supporting its industry. It would be illogical not to use that new freedom and make bold changes in support of UK industry now that we can.
6.1. OUR RECOMMENDATIONS
Implement German/French style network cost reductions: In the light of the upcoming TCR reforms and the significant benefits energy intensive industries bring to the grid, new exemptions must be introduced. We urge the Government and Ofgem to move to a model similar to Germany, where a 90% exemption is provided to all three elements of network charging (transmission, distribution, and balancing). This would lower the average electricity price for steel producers by almost £10/MWh on our benchmark data.
Increase the level of renewable levy exemptions: The costs of supporting renewable energy generation are expected to increase in the coming years, from £10.6bn in 2019/20 to £13.1bn in 2023/2415. The UK has only provided relief at 85% aid intensity, whereas in Germany, companies achieving the necessary electro-intensity thresholds can access a higher level of relief – paying a maximum of 0.5% of their GVA (average over three years). We estimate that introducing a similar approach in the UK could reduce electricity costs for the steel sector by an average of £3/MWh or £7.7 million in total. Outside of the EU – the UK could even choose to provide a flat 100% exemption, given UK steel producers and essential advantage.
CLOSING THE GAP 15
1
2

CLOSING THE GAP 16
6. Options for lowering the price disparity
Provide 100% compensation for the Carbon Price Support's indirect costs: ETS prices have risen significantly, pushing the Total Carbon Price up above £48/tCO2. This is damaging, but even more so considering EU industrial consumers are not paying the Carbon Price Support or any equivalent. Either the Carbon Price Support should be removed, or full compensation should be provided. This would at most cost around £10.5m and could reduce electricity costs for the steel sector by £4/MWh. Furthermore, as the Government seeks to consult on the compensation for indirect costs of the CPS and UK ETS in early 2021, it should also consider providing full compensation for the ETS aspect as it is no longer bound by the EU's regulations in this area. It should be remembered that not all steel processes, or steel suppliers, are currently in receipt of compensation due to EU methodology, and further changes could be considered here.
Provide an exemption from Capacity Market costs: The Capacity Market is another policy cost arising from decarbonisation of the power sector. As such, the Government should provide an exemption from its charges. This is currently underway in Poland, where an 85% exemption will be provided16. This would lower the average electricity price for steel producers by about £1.5/MWh at the cost of £2.5m. The real figure would likely be much less as not all steel sites would be eligible for exemption.
Link UK ETS to the EU ETS and compensation for indirect costs: There is a concern that the UK ETS price could increase and diverge substantially from the EU ETS, leaving UK electricity suppliers and their customers paying much higher prices than their EU counterparts. It must therefore link the UK ETS to the EU ETS to avoid significant price divergence.
Track industrial energy price disparities between countries: Government should track the gap in industrial energy prices between the UK and other key competitors and reasons for the differences, to enable more informed policymaking. An update should be published every year alongside an Annual Energy Policy Statement giving a unified view for investors from Government and the regulator on the future of energy policy. The Belgian Government currently publishes an annual review of the impact of energy costs for energy-intensive, trade-exposed industries, headed up by the Commission for Electricity and Gas Regulation (CREG) and PwC.
In implementing the proposals outlined above, the electricity price disparity would be reduced by £20/MWh or 93% of the current price disparity between the UK and Germany at the cost of £45m-£54m.
16The Polish relief is designed in a manner analogic to RES surcharge reduction, already effective in Poland, where 20% relief is offer to consumers with an electro-intensity between 3-20%, 40% relief for electro-intensity between 20-40%, and 85% for electro-intensity above 40%.
Figure 12: Potential electricity prices for UK steel producers, compared to France and Germany
£
60
50
40
30
20
10
0
£/M
Wh
France
n Wholesale costs (excl. carbon costs) n Network costs n Policy costs incl. carbon costs, after exemptions
GermanyPotential Current
UK
Source: UK Steel
£29.00£25.00
£46.60-£20
£26.49
3
456

CLOSING THE GAP 17
7. Methodology
7. METHODOLOGYThe UK Steel research is based primarily on the electricity prices faced by typical UK steel producers based in the UK and their sister facilities in Germany and France. Where necessary, this has been supplemented by data from international price comparison studies such as the PWC/CREG report referred to above. The intention is to provide a much-needed sector-specific view with input from steel companies operating in those countries examined. Importantly, this analysis also considers all exemptions and compensations available to those companies and therefore provides the most accurate and up-to-date picture possible.
UK wholesale prices have been constructed by using the five monthly average spot prices (from April to August) and average forecasted price for the following seven months, based on published reference data. German and French wholesale prices are based on a similar methodology. The policy prices for the Renewables Obligation, Feed-in Tariffs, Contracts for Difference, and Capacity Market are based on average reported prices from UK steelmakers and exemptions have been applied. UK network prices are similarly based on the average prices steel producers face, including balancing, distribution, and transmission costs (assuming consumption during one Triad at 70% capacity). The French and German policy and network prices are based on the PWC/CREG data. This includes the CPSE, Contribution tarifaire d'acheminement
(CTA), CHP, StromNEV, Offshore, EEG-Umlage, Stromsteuer, and Konzessionsabgabe / Concession Fee. The exchange rate between 1st April to 31st August 2020 was €1:£0.8938, and the ETS prices are based on the average price for April to August 2020 and the forecasted prices for the following seven months. Compensation has been applied to this and, in the UK's case, the CPS. In all countries, we assume compensation provides 60% relief; based on the assumption of plants being at 80% of the electricity consumption efficiency benchmark and compensation provided at 75% aid intensity in 2019.
Any demand side response income or revenue from embedded benefits has been excluded from this analysis in all countries.

CLOSING THE GAP 18
8. UK Steel
8. UK STEELUK Steel is the trade association for the UK steel sector. As the voice of the steel industry, we interface with government and parliament to influence policy so that it underpins, rather than undermines, the long-term success of our sector.
Membership of UK Steel is open to all UK-based companies and organisations involved in the production of steel and downstream processes.

CLOSING THE GAP 19
9. Appendix
9. APPENDIX9.1. BENEFITS TO THE ENERGY SYSTEM
Germany and France provide lower network charges to their energy intensive industries due to their value to the energy system, which is not recognised in the UK to a similar degree. Steel producers can provide flexible electricity demand, in either two forms: Sites with batch processes can provide binary flexibility (on or off demand), whilst sites with continuous processes provide non-binary flexibility (modulating demand). The sector reduces the need for system reinforcement through their flexibility, whilst their significant baseload demand raises average network demand and can increase demand if they receive signals of the grid requirement, supporting efficient network use. The demand management occurs due to the price signals received, whether these are wholesale market-driven, or from regulated system charges (TNUoS, DUoS, Capacity Market). However, recent decisions by the regulator, Ofgem, will remove or reduce these price signals, which may disincentivise the use of industrial flexibility and increase overall costs for EIIs.
Furthermore, steelmakers have a flatter and more predictable demand profiles than domestic users. They also consume relatively more electricity in the periods it is most helpful to the electricity grid, notably overnights and summer daytime periods. In these periods, excessively low transmission system demand drives record levels of change of frequency and constraint management expenditure by the Electricity
Systems Operator (ESO). Baseload steel customers help moderate this expenditure. As evident during the first Covid-19 lockdown, an enforced and abnormal reduction in industrial energy demand led to record levels of ESO expenditure on constraints and frequency management – over £500m in the six months to Sep 2020 – out of a record total BSUoS expenditure of £835m for the same period17. The network charging regime should recognise the vital contribution baseload steel producers make to moderating constraint and change of frequency costs by the ESO. There is currently no recognition of this contribution in either transmission or balancing charges.
Competing jurisdictions in mainland Europe recognise that baseload electricity users entail reduced system costs compared to domestic users' higher peaking demand levels. The German Government notes that "The high predictability of baseload electricity consumption reduce[s] the need for balancing electricity and reserves as well as the need for re-dispatching. In general, the high predictability facilitates network planning and maximises the use of the generation fleet"18. The German regulators expressly recognise this system benefit in the form of lower network tariffs for large baseload users than their less predictable, peakier, domestic counterparts. Similar principles should be adopted in the charging regimes in the UK.
17Monthly Balancing Services Summary (MBSS) Sep 2020, https://data.nationalgrideso.com/balancing/mbss/r/monthly_balancing_services_summary_(mbss)_sep-2020 18European Commission (2018), Commission Decision Of 28.5.2018 on Aid Scheme, SA.34045 (2013/c) (ex 2012/nn), section 69, https://ec.europa.eu/competition/state_aid/cases/247905/247905_2014230_596_2.pdf

CLOSING THE GAP 20
9. Appendix
9.2. CAUSES OF HIGHER WHOLESALE COSTS
The UK's higher reliance on gas, as opposed to cheaper coal, is driven by the UK's unilaterally imposed Carbon Price Support – an additional 'top-up' carbon tax over and above the prevailing EU carbon price which currently almost doubles the price of carbon in the UK compared to the rest of the EU. This increases the UK wholesale costs in two ways: by directly adding to the costs of producing carbon-based power and subsequently by forcing the use of the more expensive fuel gas over coal. The "merit order" determines the power price – the sequence in which power stations contribute power to the market. The market determines that the cheapest mix of power available at any given time will be used to meet demand – the very cheapest plants will be called upon first, with progressively more expensive plants added to mix until
demand is met. The last and most costly plant required to meet demand sets the wholesale price paid to all generators in a market.
As illustrated by figure 13, where supply and demand dynamics set the price for every hour, with a lower operating price, coal is often the marginal supply in Germany, and it determines the clearing price – i.e., the wholesale price ultimately paid by consumers. The UK's introduction of the Carbon Price Support has made the typically more expensive combined cycle gas plant cheaper than coal-fired power stations, due to their lower carbon intensity. This has altered where coal and gas sit in the UK's merit order and ultimately increased the UK's wholesale prices.
Figure 13: Merit order curve, theoretical German and UK wholesale markets respectively
Source: UK Steel
Steelmakers are partially compensated for the costs of the Carbon Support Price passed through in power prices (the diagonal pattern in figure 13), but not for the costs resulting from the change in the merit order induced by the carbon price. Whilst the UK is entirely correct to have been at the vanguard of the move to phase out coal, the UK's approach should be contrasted with that now being developed by Germany. The UK has opted for a tax-based approach, significantly increasing electricity costs, and passing them all on to consumers. Germany has developed a regulated approach and will from 2023 introduce a "reasonable" annual grant for energy intensive companies for additional electricity costs to protect their international competitiveness19.
The UK separation from mainland Europe means it also has
a low level of interconnection compared to its European neighbours20, constraining our ability to import low-cost electricity. The UK's 5GW of interconnectors is equivalent to 6.5% of domestic generation capacity21, compared to 10% for France and Germany22. Several new interconnectors are currently being built and in the planning stage, this will ultimately help reduce UK wholesale prices, but it will take considerable time. In previous UK Steel reports on the electricity disparity, we have referenced virtual interconnection policies that certain EU countries have imaginatively employed. The UK Government had between 2015-20 also excluded some of the cheapest renewable energy technologies (i.e., onshore wind and solar PV) from its CfDs auctions, reducing their ability to bring down policy and wholesale costs.
Ope
ratin
g co
st, £
/MW
h
n Renewables n Existing Nuclear n Coal n Gas CCGT
DemandCapacity
n Renewables n Existing Nuclear n Coal n Gas CCGT
Ope
ratin
g co
st, £
/MW
h
Carbon Support Price
19Pressemitteilung, Nummer 21/20 vom 16. Januar 2020, Bund-/Länder-Einigung zum Kohleausstieg, https://www.bmwi.de/Redaktion/DE/Downloads/B/bund-laender-einigung-zum-kohleausstieg.pdf 20Grubb, M., & Drummond, P. (2018). UK Industrial Electricity Prices: Competitiveness in a low carbon world. UCL Institute of Sustainable Resources, https://www.ucl.ac.uk/bartlett/sustainable/sites/bartlett/files/uk_industrial_electricity_prices_-_competitiveness_in_a_low_carbon_world.pdf 21BEIS 2020, Digest of UK Energy Statistics, Chapter 5 Electricity, July 202022Grubb, M., & Drummond, P. (2018). UK Industrial Electricity Prices: Competitiveness in a low carbon world. UCL Institute of Sustainable Resources, https://www.ucl.ac.uk/bartlett/sustainable/sites/bartlett/files/uk_industrial_electricity_prices_-_competitiveness_in_a_low_carbon_world.pdf
DemandCapacity

MakeUK.org Make UK is a trading name of EEF Limited Registered Office: Broadway House, Tothill Street, London, SW1H 9NQ. Registered in England and Wales No. 05950172
©2021 Make UK
PROCESS INNOVATION: BRINGING MANUFACTURERS TO THE FRONTIER
Make UK champions and celebrates British manufacturing and manufacturers.We stimulate success for manufacturing businesses, allowing them to meet their objectives and goals. We empower individuals and we inspire the next generation. Together, we build a platform for the evolution of UK manufacturing.We are the catalyst for the evolution of UK manufacturing. We enable manufacturers to connect, share and solve problems together. We do this through regional and national meetings, groups, events and advisory boards.
We are determined to create the most supportive environment for UK manufacturers to thrive, innovate and compete.We provide our members with a voice, presenting the issues that are most important, and working hard to ensure UK Manufacturing performs and grows, now and for the future.
To find out more about this report, contact:
Name SurnameJob [email protected]
Name SurnameJob [email protected]
Name SurnameJob [email protected]
Queens Park Queens Way North Team Valley Trading Estate GatesheadTyne and Wear NE11 0NX t: 0191 497 3240e: [email protected] makeuk.org
Make Business is a trading name of EEF Ltd, an employers’ association regulated under part II of the Trade Union and Labour Relations (Consolidation) Act 1992.
EEF Limited. Registered Office. Broadway House, Tothill Street, London, SW1H 9NQ. Registered in England and Wales. No.05950172.
UK Steel is the trade association forthe UK steel industry and championsthe country’s steel manufacturers.
We represent the sector’s intereststo government and promote ourinnovative, vibrant and dynamicindustry to the public.
Together, we build the future of the UK steel industry.
For more information, please contact:
Frank AaskovEnergy & Climate Change Policy [email protected] 654 1506