clogging prevention in submerged entry nozzles …648403/fulltext01.pdf · clogging prevention in...
TRANSCRIPT
Clogging Prevention in Submerged
Entry Nozzles Focusing on CaTiO3 as a
Coating Material
Klara Takei
Felicia Lindén Bergman
Supervisors:
Prof. Pär Jönsson, KTH
Prof. Voicu Brabie, HDa
Jennie Svensson, HDa
Bachelor Thesis 2012
Dept. of Materials Science and Engineering
Royal Institute of Technology
Stockholm, Sweden

Abstract
Clogging of the SEN is a complex problem, which implies large annual costs to the steel
industry. Nozzle clogging leads to interrupted production when the nozzle or tundish need
replacement. Moreover, clogging reduces steel quality, as pieces of the clog may loosen and
give rise to larger inclusions in the cast steel.
The first part of this study presents an overview of the clogging mechanisms. Methods to
address the problem are discussed based on literature and earlier studies. Coatings, which
have been subjected to rather little research, are chosen to be further investigated.
In the second part, an experimental study on calcium titanate is performed. Five samples of -
325 mesh CaTiO3 powder were heated in alumina crucibles at temperatures of 1600°C,
1575°C, 1565°C and 1550°C for 60 minutes. One sample was kept at 1600°C for 12 minutes.
The treated samples were analyzed using SEM, and from the achieved compositions resulting
phases were calculated.
There are strong indications that liquid phases were partially obtained in all samples. As a
result, calcium titanate coating of graphite alumina SENs represents a promising method to
decrease clogging.
Pilot plant experiments are suggested to further evaluate the performance of calcium titanate
coatings during casting. Moreover, research is needed in areas such as: the application
method, the depletion and thickness of the coating, the interaction with the refractory, the
necessary amount of liquid phase, and the environmental as well as economic aspects.
Key words: Clogging, Nozzle, Coating, Calcium Titanate, Refractory, Liquid Phase
Table of Contents
Introduction 1
Purpose 2
Literature study 2
Clogging mechanisms 4
Methods to decrease clogging 5
Induction 5
Dimensional design 5
Argon bubbling 6
Heating 6
Adjustment of the melt 6
Design of the ceramic 7
Coating 9
- Coating materials 10
Experimental 12
Results and Discussion 13
Conclusions and Future work 17
Acknowledgements 18
References 19
Appendix A – SEM analyses for sample 1 A1
Appendix B – SEM analyses for sample 2 B1
Appendix C – SEM analyses for sample 3 C1
Appendix D– SEM analyses for sample 4 D1
Appendix E– SEM analyses for sample 5 E1
Appendix F – The results from SEM analysis plotted in phase diagrams F1

1
Stopper rod
Tundish Tundish Nozzle
Slide Gate
Submerged
Entry Nozzle Mould
Steel from
Ladle
Introduction
At continuous casting, steel flows from the tundish to the mould through a submerged entry
nozzle, SEN, as can be seen in Fig. 1. This protects the molten steel from reoxidizing in
contact with the atmosphere. The flow rate is controlled with a gate or stopper rod to maintain
optimum casting conditions. If the nozzle clogs and the flow control cannot make up for the
reduced flux, the nozzle has to be replaced which means the production is interrupted. The
clog buildup can also result in decreased steel quality as oxide particles may loosen from it,
giving rise to rather large inclusions[1]
.
Different methods can be applied to decrease clogging, including coating the interior of the
nozzle, inducing electromagnetic fields, designing the nozzle ceramic and dimensions, heating
of the nozzle, and argon injection. The cleanliness of the steel also affects the amount of
inclusions available to cause clogging. However, clogging can probably not be entirely
prevented by cleanliness of the steel since only one out of 1500 nonmetallic inclusion
deposited on the nozzle wall will be enough to cause clogging. Changed flow patterns due to
clogging can also reduce the steel quality.[1]
Through coating the nozzle refractory several desired effects can be achieved: decreased
roughness making particles less prone to stick to the surface, a denser surface which decreases
oxygen permeability, and protection of the refractory material from both mechanical and
chemical erosion.[2]
As a result, increased nozzle lifespan as well as higher steel quality is
obtained. Additionally, using coatings rather than a solid nozzle of the same material, could
potentially provide economic advantages. Calcium titanate (CaTiO3) has shown promising
properties as a nozzle material[3]
, and could possibly be applied as a coating. Its ability to
form a liquid phase in contact with alumina (Al2O3) will be further investigated in this project.
This is part of a project funded by VINNOVA and Jernkontoret.
Fig. 1: Schematic picture of the area of interest for this study.
[4]

2
Purpose
This report aims to give an overview of the clogging mechanism and the related problems,
such as shortened lifetime of the nozzle and decreased steel quality, which lead to increased
production costs. In particular coatings will be considered as a method for avoiding clogging.
An experiment with calcium titanate heated in alumina crucibles will be performed. The
presence of liquid phases will be evaluated.
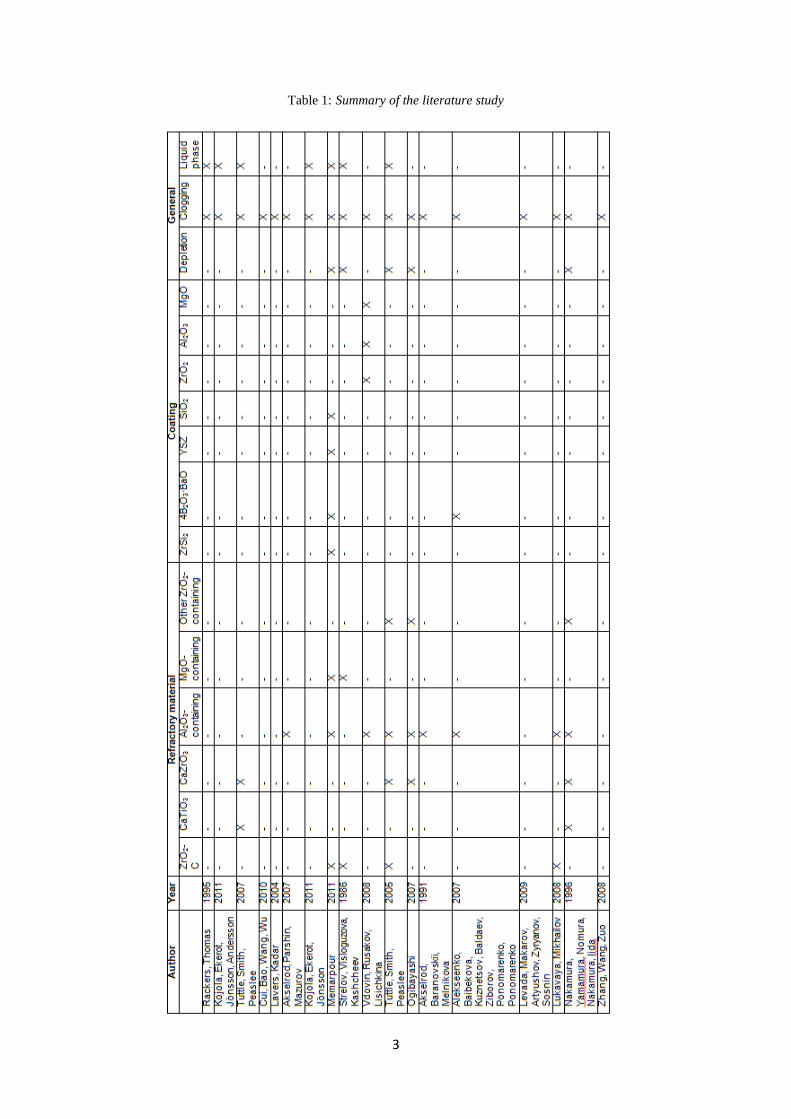
Literature study
To investigate previous work and gather knowledge in the area, a literature study was
performed. Table 1 gives an overview of the results from this study. Clogging is common to
all articles used since it is the central problem in this project. From the table it can be stated
that articles concerning the refractory material are far more common than those discussing
coatings. Also specific refractories are more often treated in more than one article. This is to
be compared to the specific coatings; articles treating the same coating material are rather
unique. The descriptive part of this report is based upon the literature study.
3
Table 1: Summary of the literature study

4
Clogging mechanisms
Clogging may occur in several ways, of which combinations can appear in a single
nozzle. Inclusions formed by deoxidation products, such as oxides of Zr, Al, and Ti, can sinter
together to form a matrix[1]
. This is believed to be the dominant mechanism. The rate at
which this type of clogging develops is dependent on inclusion size. Large inclusions can
stick to the nozzle wall only where the flow is slow, i.e. where the cross sectional area is
large. Thus, they tend to have less effect on the nozzle flow. In the case of small inclusions,
adhesion to the internal of the nozzle is possible even in areas with a high flow rate. The
clogging rate is therefore higher for smaller inclusions, that are probably formed during late
stage reoxidation.[5]
At steelmaking temperatures the sintering process is rather rapid; for two
ten-micron inclusions only about 0.03 seconds are required to form a sufficient neck to
withstand the force of the flow. In some cases the matrix contains steel, especially in steels
with a low concentration of deoxidation products.[1]
Complex oxides may also form accretions. There are a number of theories on how reoxidation
products can be brought in contact with the nozzle wall. The theories include turbulent
recirculation zones, turbulent flow, rough nozzle walls, and external corners. The attachment
to the nozzle walls depend on surface tension and sintered bonds between the particle and the
wall or another particle.[1]
The buildup can consist of solidified steel if the heat transfer from
the nozzle is high. This is one reason why nozzles have to be preheated correctly.[1]
Alternatively, deoxidants in the steel may form a film upon reaction with oxygen present due
to: air leaked in through porosity in the nozzle; oxygen from silica based refractories; oxygen
in the steel resulting from the lower solubility at the lower temperature in the nozzle[1]
. This
film is not believed to have a major impact on the flow rate through the nozzle.[5]
Fig. 2: Schematic picture of accretion layers[6]
In aluminium killed steel, a typical accretion forms when micron-sized alumina particles
attach to the nozzle wall, where they form a friable, powdery layer. Densification may then

5
occur at the nozzle interface, rendering a dense alumina layer between the refractory and the
powdery layer[3]
as pictured in Fig. 2. Sometimes three layers are identified: 1) the dense layer
next to the refractory wall mainly consisting of alumina, 2) an intermediate layer of alumina
dendrites and metal beads, and 3) a loose, powdery layer of mainly globular alumina
inclusions.[7]
The powdery and intermediate layers can be seen in Fig. 3.
Fig. 3: a) Powdery layer next to the steel, b) Intermediate layer. [7]
Methods to decrease clogging
Induction If the flow going into the nozzle separates, a stagnation zone can occur. Inclusions can get
trapped in this zone and cause clogging. Electromagnetic forces can be used to force the melt
in the stagnation zone to move. Calculations using several mathematical models suggest that
induction and injecting DC current would be feasible ways of preventing the formation of
stagnation zones. However, not many of the models have been verified experimentally.[8]
Dimensional design
Nozzle geometry can affect clog buildup; a common way to combat the effects of clogging is
to use oversized nozzle bores. A rounded entrance from the tundish can help reduce clogging
in this area through preventing separated flow. Proper vertical alignment is also important to
avoid flow separation. A 5-mm circular step in the middle of the SEN has proven to reduce
clog buildup in the lower part of the nozzle. Keeping the internal bottom of the nozzle and the
port bottom at the same level (no nozzle well) has also shown beneficial effects.[1]
Increasing the nozzle diameter just below the stopper rod could also decrease the amount of
accretions. Another factor influencing accretion is the joint sealing between the SEN and the
tundish nozzle. A tighter sealing which ensures a minimum of air leakage helps prevent
clogging.[1]
6
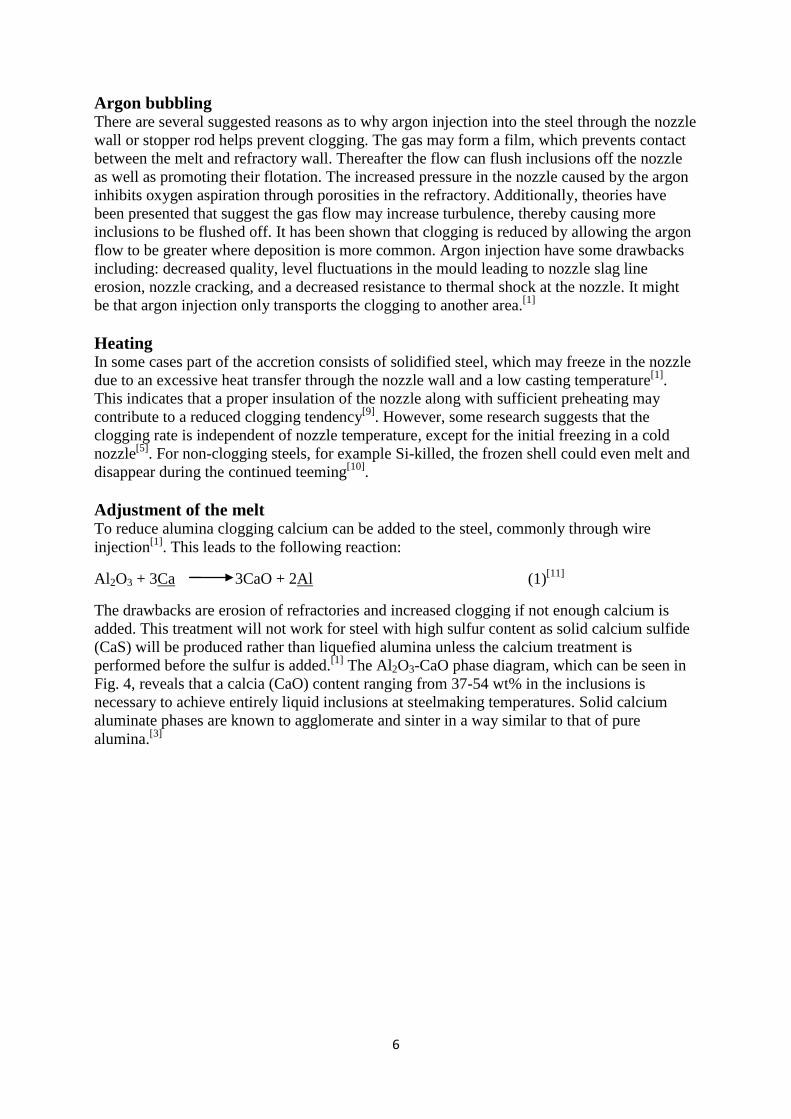
Argon bubbling
There are several suggested reasons as to why argon injection into the steel through the nozzle
wall or stopper rod helps prevent clogging. The gas may form a film, which prevents contact
between the melt and refractory wall. Thereafter the flow can flush inclusions off the nozzle
as well as promoting their flotation. The increased pressure in the nozzle caused by the argon
inhibits oxygen aspiration through porosities in the refractory. Additionally, theories have
been presented that suggest the gas flow may increase turbulence, thereby causing more
inclusions to be flushed off. It has been shown that clogging is reduced by allowing the argon
flow to be greater where deposition is more common. Argon injection have some drawbacks
including: decreased quality, level fluctuations in the mould leading to nozzle slag line
erosion, nozzle cracking, and a decreased resistance to thermal shock at the nozzle. It might
be that argon injection only transports the clogging to another area.[1]
Heating In some cases part of the accretion consists of solidified steel, which may freeze in the nozzle
due to an excessive heat transfer through the nozzle wall and a low casting temperature[1]
.
This indicates that a proper insulation of the nozzle along with sufficient preheating may
contribute to a reduced clogging tendency[9]
. However, some research suggests that the
clogging rate is independent of nozzle temperature, except for the initial freezing in a cold
nozzle[5]
. For non-clogging steels, for example Si-killed, the frozen shell could even melt and
disappear during the continued teeming[10]
.
Adjustment of the melt To reduce alumina clogging calcium can be added to the steel, commonly through wire
injection[1]
. This leads to the following reaction:
Al2O3 + 3Ca 3CaO + 2Al (1)[11]
The drawbacks are erosion of refractories and increased clogging if not enough calcium is
added. This treatment will not work for steel with high sulfur content as solid calcium sulfide
(CaS) will be produced rather than liquefied alumina unless the calcium treatment is
performed before the sulfur is added.[1]
The Al2O3-CaO phase diagram, which can be seen in
Fig. 4, reveals that a calcia (CaO) content ranging from 37-54 wt% in the inclusions is
necessary to achieve entirely liquid inclusions at steelmaking temperatures. Solid calcium
aluminate phases are known to agglomerate and sinter in a way similar to that of pure
alumina.[3]
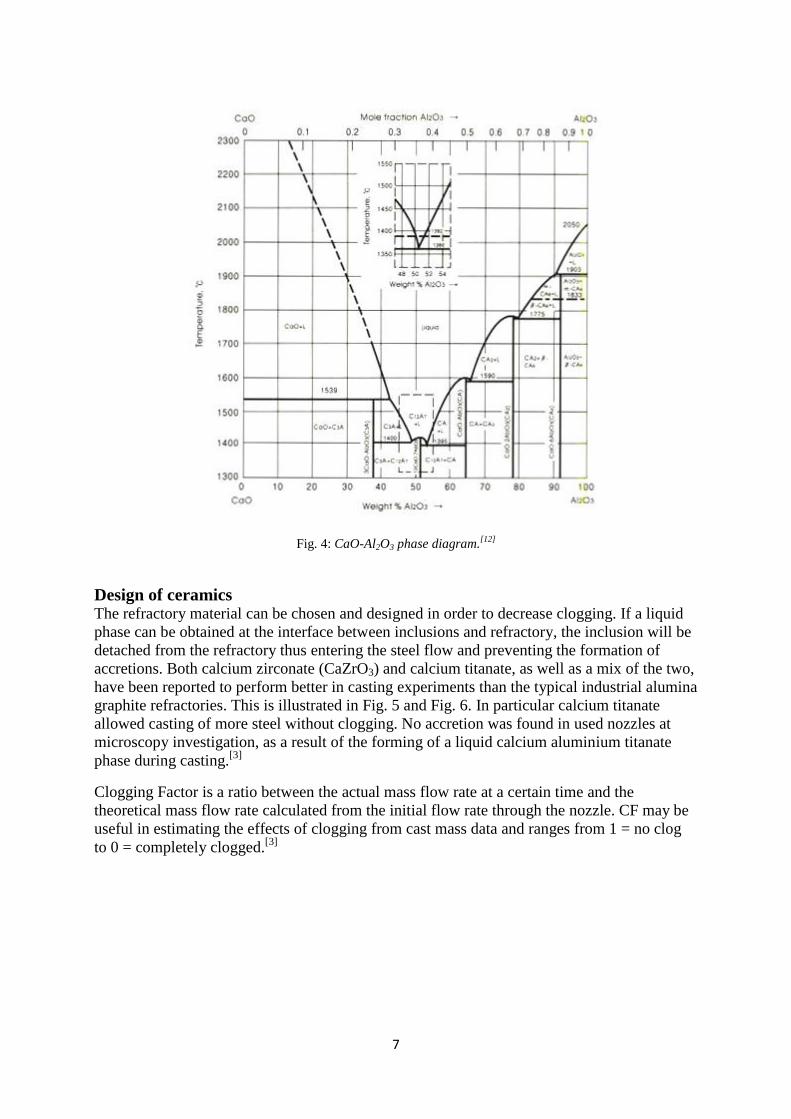
7
Fig. 4: CaO-Al2O3 phase diagram.[12]
Design of ceramics The refractory material can be chosen and designed in order to decrease clogging. If a liquid
phase can be obtained at the interface between inclusions and refractory, the inclusion will be
detached from the refractory thus entering the steel flow and preventing the formation of
accretions. Both calcium zirconate (CaZrO3) and calcium titanate, as well as a mix of the two,
have been reported to perform better in casting experiments than the typical industrial alumina
graphite refractories. This is illustrated in Fig. 5 and Fig. 6. In particular calcium titanate
allowed casting of more steel without clogging. No accretion was found in used nozzles at
microscopy investigation, as a result of the forming of a liquid calcium aluminium titanate
phase during casting.[3]
Clogging Factor is a ratio between the actual mass flow rate at a certain time and the
theoretical mass flow rate calculated from the initial flow rate through the nozzle. CF may be
useful in estimating the effects of clogging from cast mass data and ranges from 1 = no clog
to 0 = completely clogged.[3]
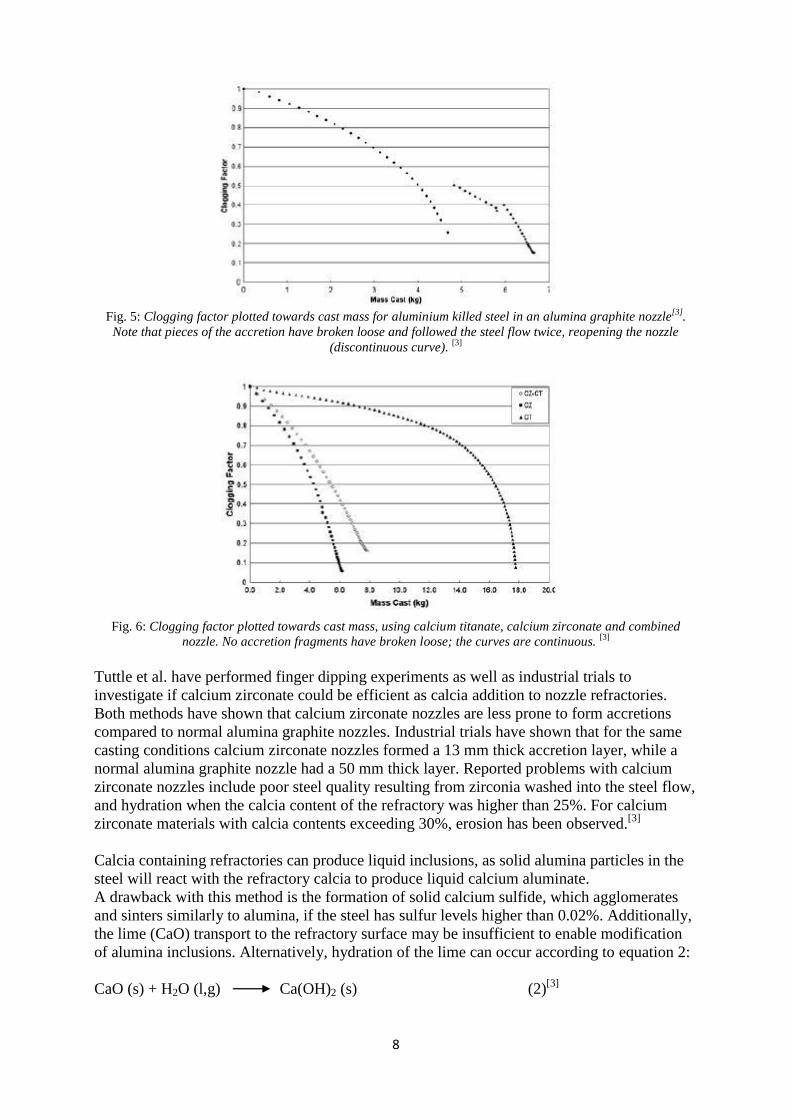
8
Fig. 5: Clogging factor plotted towards cast mass for aluminium killed steel in an alumina graphite nozzle[3]
.
Note that pieces of the accretion have broken loose and followed the steel flow twice, reopening the nozzle
(discontinuous curve). [3]
Fig. 6: Clogging factor plotted towards cast mass, using calcium titanate, calcium zirconate and combined
nozzle. No accretion fragments have broken loose; the curves are continuous. [3]
Tuttle et al. have performed finger dipping experiments as well as industrial trials to
investigate if calcium zirconate could be efficient as calcia addition to nozzle refractories.
Both methods have shown that calcium zirconate nozzles are less prone to form accretions
compared to normal alumina graphite nozzles. Industrial trials have shown that for the same
casting conditions calcium zirconate nozzles formed a 13 mm thick accretion layer, while a
normal alumina graphite nozzle had a 50 mm thick layer. Reported problems with calcium
zirconate nozzles include poor steel quality resulting from zirconia washed into the steel flow,
and hydration when the calcia content of the refractory was higher than 25%. For calcium
zirconate materials with calcia contents exceeding 30%, erosion has been observed.[3]
Calcia containing refractories can produce liquid inclusions, as solid alumina particles in the
steel will react with the refractory calcia to produce liquid calcium aluminate.
A drawback with this method is the formation of solid calcium sulfide, which agglomerates
and sinters similarly to alumina, if the steel has sulfur levels higher than 0.02%. Additionally,
the lime (CaO) transport to the refractory surface may be insufficient to enable modification
of alumina inclusions. Alternatively, hydration of the lime can occur according to equation 2:
CaO (s) + H2O (l,g) Ca(OH)2 (s) (2)[3]
9
This may lead to a volumetric expansion and loss of strength in the refractory, which can
cause crumbling. Lime-stabilized zirconia has been used for adding lime to refractories to
avoid hydration, however this has not solved the problem satisfactory. As a result, the use of
lime containing refractories has been limited.[3]
Zirconium disilicide (ZrSi2) has been proven to reduce decarburization of the nozzle during
preheating if added to the refractory in combination with barium tetraborate (4B2O3 ·BaO).
The carbon oxidation resistance is obtained as a result of the volumetric expansion due to
formation of zirconium silicate, while the barium tetraborate glaze fills up the pores. This
prevents oxygen from penetrating into the refractory material.[2]
Strelov et al. report a decreased clogging tendency in forsterite (Mg2SiO4) nozzles compared
to zirconia (ZrO2) and periclase (MgO) nozzles. The reason is believed to be a combination of
two mechanisms:
1) The deoxidizing capacity of the nozzle material is linked to the formation of a solid phase
upon contact with for example aluminium dissolved in the molten steel. Mg2SiO4 has a lower
deoxidizing capacity than MgO, Al2O3 and ZrO2, and is less prone to form oxides with the
components in the steel.
2) The reduced temperature of the steel in contact with the refractory may cause solidification
of the steel, an effect that is more significant in materials with high thermal conductivity.
Even in this aspect Mg2SiO4 nozzles have an advantage in comparison to ZrO2 and MgO.[13]
Coating A coating may provide several advantages. It protects the nozzle refractory during preheating
and if a smoother surface is obtained, inclusions do not stick as easily. A denser material
lowers gas permeability and inhibits oxidation from air leaking through the nozzle wall. If a
liquid phase is obtained in the refractory/steel interface through reactions with inclusions and
coating, the resulting liquid inclusions will be flushed away rather than being accumulated in
the nozzle, and clogging will be eliminated.
Industrial alumina-graphite SENs are in general coated with a glass-silicon powder to prevent
the graphite from oxidizing during preheating.[2]
The presence of carbon and SiO2 on the
surface of the nozzle facilitates formation of a loose layer of alumina deposits[14]
. It has been
shown that accretion thickness is dependent on the degree of decarburization. The glaze
penetrates the refractory and may react with the graphite to form CO-gas which migrates to
the refractory/metal interface.[2]
Dissociation of the CO leads to reoxidation of alloying
elements, creating an oxide film at the SEN interface with the steel[1]
. Several possible
reactions have been proposed for alumina-graphite SENs such as:
Refractory: SiO2(s) + C(s) SiO(g) + CO(g) (3)[6]
Al2O3(s) + 2C(s) Al2O(g) + 2CO(g) (4)[6]
Interface: Al2O(g) + 2CO(g) Al2O3(s) + 2C (5)[6]
3SiO(g) + 2Al Al2O3(s) + 3Si (6)[6]
3CO(g) +2Al 3C + Al2O3(s) (7)[2]
Furthermore, the interaction of the silicon glaze with refractory alumina may result in a
viscous glaze; thus making the SEN internal surface rougher. This facilitates the attachment
and agglomeration of inclusions. The alumina-rich glaze can also react with steel alloying
elements.[2]

10
Coating materials
Zirconia (ZrO2) has a good chemical resistance to molten steel and has been reported to
reduce nozzle accretions in aluminium killed steels. However, some sintering between the
zirconia and inclusions was reportedly found when a zirconium oxide powder was paint
sprayed to form a coating on an alumina graphite nozzle. It has to be taken into consideration
that this coating method may not have rendered a high density coating, but allowed gas to
pass through the pores.[14]
Yttria Stabilized Zirconia, YSZ, is a ceramic in which the crystal structure of zirconia has
been stabilized at room temperature by addition of yttria (Y2O3)[15]
. The structure of pure
zirconia is monoclinic below 1373 K, tetragonal in the range 1373-2953 K, and cubic at
higher temperatures. The monoclinic-tetragonal phase transformation leads to a volume
expansion of 3-5%, which may induce cracks in the coating allowing oxidizing agents to enter
the base refractory. This problem is avoided through the use of YSZ. Memarpour suggests
that a 250-290 μm thick plasma sprayed YSZ coating would provide an appropriate protection
against decarburization of alumina-graphite nozzles during preheating, as well as increased
surface smoothness. Furthermore, in contact with cerium alloyed steels, an YSZ coating has
proven to eliminate the reduction of alumina by cerium and thereby the formation of the main
clogging product on the refractory wall.[2]
Alumina, as well as pure zirconia, has according to Vdovin et al. shown the best results in
chemical resistance to liquid steel and reducing overgrowth of the SEN. Carbon and silicon
dioxide (SiO2) in the refractory material increases the oxygen potential of the melt causing the
aluminium to become oxidized. Once a reaction layer is created on the nozzle wall the build-
up starts, this can significantly reduce the nozzle radius. Liquid steel in contact with a coating
of alumina graphite will dissolve some of the carbon. Some of the alumina particles will then
leave the coating and enter the steel, where they are unlikely to react with the steel. The
synthetic slag contains calcia, which locally penetrates the refractory coating and forms a
layer of calcium aluminate (Al2O3∙CaO). Carbon and silicon containing coatings lead to
carbon monoxide and silicon monoxide gas formation. Using a dense alumina coating makes
it difficult for gas to penetrate through the pores. This was tested through heat treatment of the
coated nozzle at 1600°C. Tests of the nozzle in contact with nonmetallic inclusions, steel melt
and synthetic slag showed that the nozzle coating was chemically stable in contact with the
liquid steel and did not sinter with the nonmetallic inclusions.[14]
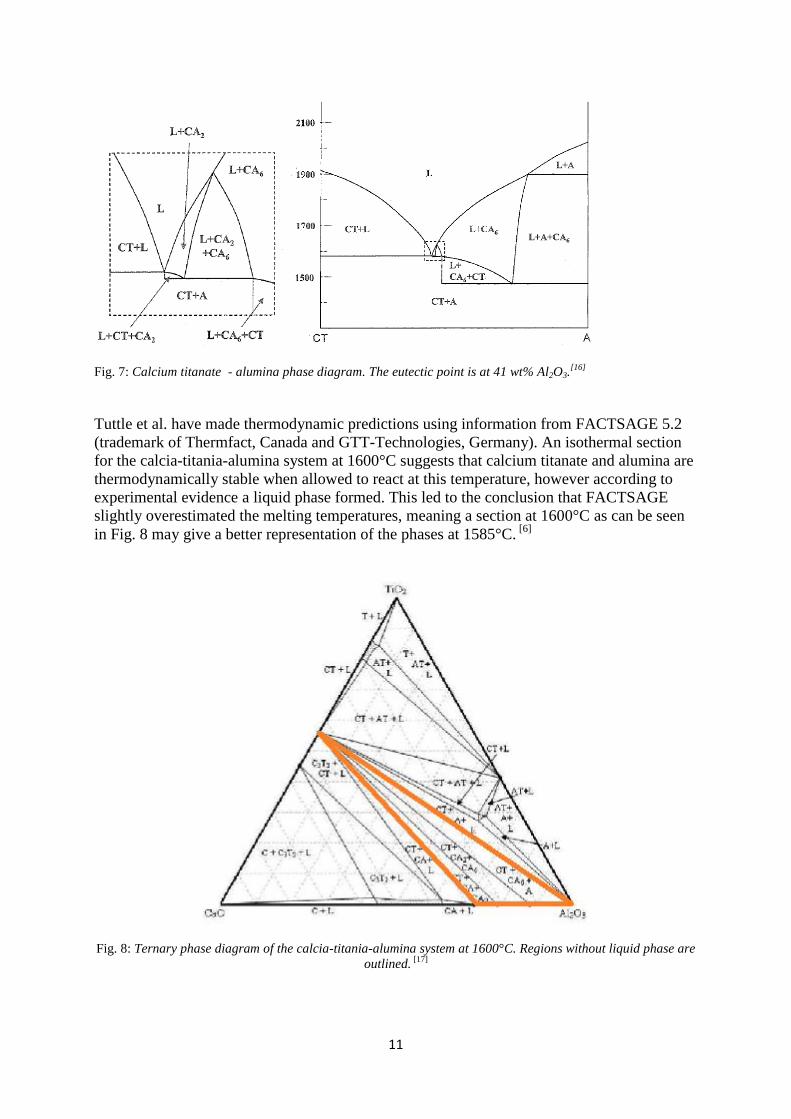
Calcium titanate has, as mentioned earlier, given promising results as a nozzle material due to
its ability to form a liquid phase with alumina which can be seen in Fig. 7. However, the
research on calcium titanate as a coating material has been limited.
11
Fig. 7: Calcium titanate - alumina phase diagram. The eutectic point is at 41 wt% Al2O3.
[16]
Tuttle et al. have made thermodynamic predictions using information from FACTSAGE 5.2
(trademark of Thermfact, Canada and GTT-Technologies, Germany). An isothermal section
for the calcia-titania-alumina system at 1600°C suggests that calcium titanate and alumina are
thermodynamically stable when allowed to react at this temperature, however according to
experimental evidence a liquid phase formed. This led to the conclusion that FACTSAGE
slightly overestimated the melting temperatures, meaning a section at 1600°C as can be seen
in Fig. 8 may give a better representation of the phases at 1585°C. [6]
Fig. 8: Ternary phase diagram of the calcia-titania-alumina system at 1600°C. Regions without liquid phase are
outlined. [17]
12
In this section, all regions except three are predicted to form liquid phases. As a result, almost
any reaction between a calcium titanate refractory and alumina inclusions would liquefy the
inclusions.[6]
Ogibayashi suggests that once a liquid layer is produced in the interface, new inclusions that
come into contact with this layer experience almost no attractive forces and are thus carried
away with the steel flow.[18]
Experimental
A sample was prepared by filling an Al2O3 crucible with CaTiO3 powder of the size -325
mesh packed tightly through pressing with a spoon. The crucible was 40 mm high with an
outer diameter of 30 mm and a thickness of 3 mm. It weighed around 32 g, and was filled
with approximately 13g of calcium titanate powder. The sample was placed in a graphite
crucible for protection. Thereafter sample and crucible were placed into a Labmaster graphite
furnace model no 1000 – 3060 – FP 20 with temperature increase set to 10°C/min. This
furnace model is water-cooled with a temperature accuracy of +/- 3°C. To achieve an inert
environment the furnace was flushed with argon at a flow rate of approximately 4 l/min. The
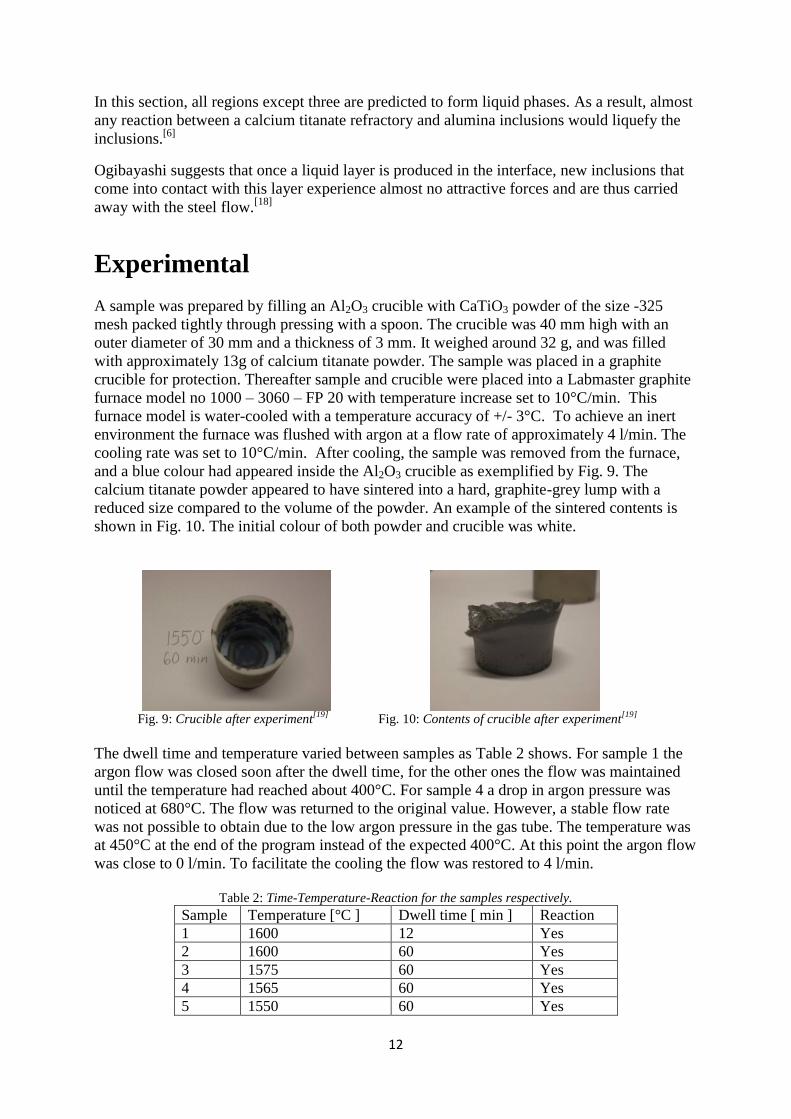
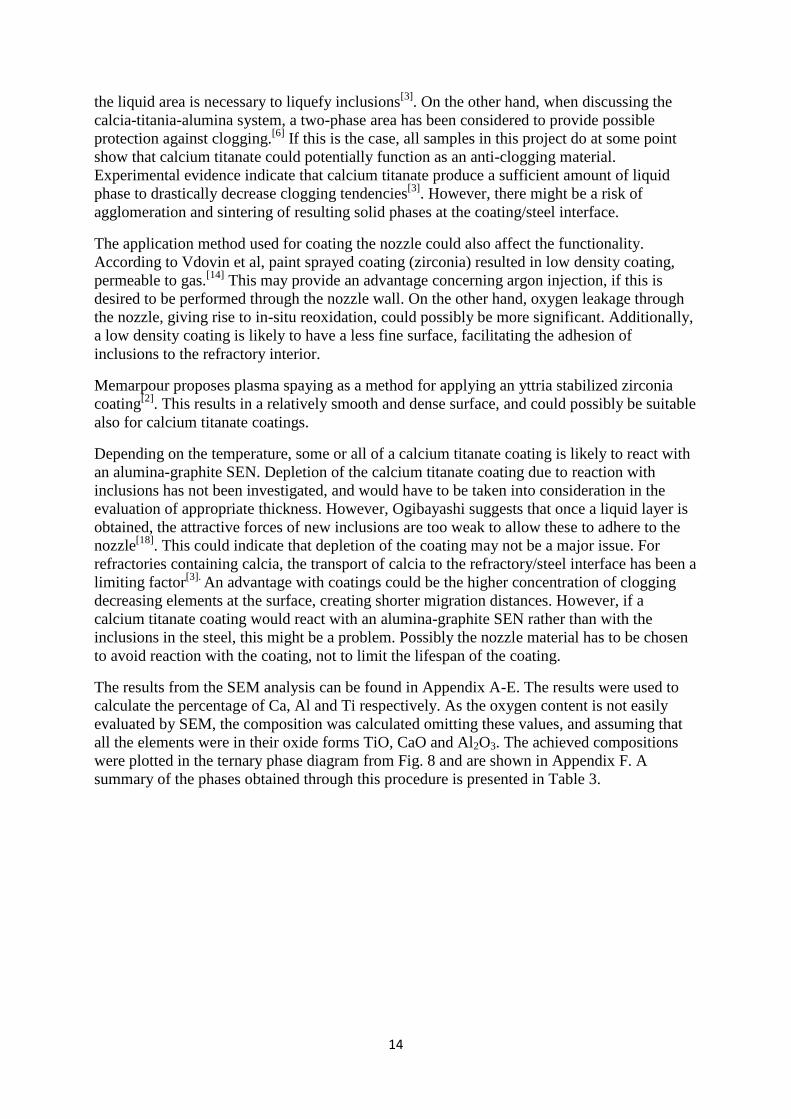
cooling rate was set to 10°C/min. After cooling, the sample was removed from the furnace,
and a blue colour had appeared inside the Al2O3 crucible as exemplified by Fig. 9. The
calcium titanate powder appeared to have sintered into a hard, graphite-grey lump with a
reduced size compared to the volume of the powder. An example of the sintered contents is
shown in Fig. 10. The initial colour of both powder and crucible was white.
Fig. 9: Crucible after experiment
[19] Fig. 10: Contents of crucible after experiment
[19]
The dwell time and temperature varied between samples as Table 2 shows. For sample 1 the
argon flow was closed soon after the dwell time, for the other ones the flow was maintained
until the temperature had reached about 400°C. For sample 4 a drop in argon pressure was
noticed at 680°C. The flow was returned to the original value. However, a stable flow rate
was not possible to obtain due to the low argon pressure in the gas tube. The temperature was
at 450°C at the end of the program instead of the expected 400°C. At this point the argon flow
was close to 0 l/min. To facilitate the cooling the flow was restored to 4 l/min.
Table 2: Time-Temperature-Reaction for the samples respectively.
Sample Temperature [°C ] Dwell time [ min ] Reaction
1 1600 12 Yes
2 1600 60 Yes
3 1575 60 Yes
4 1565 60 Yes
5 1550 60 Yes

13
The samples were prepared for scanning electron microscope (SEM) by using a Struers
Accutom-50 with a CBN cut-off wheel for cutting. The cutting rate was kept at 5-30 µm/s
depending on the sample thickness.
Sample 1, 3 and 4 were washed ultrasonically using an Ultrasons P Selecta, using acetone for
2 minutes and thereafter ethanol for 2 minutes. They were dried with a Braun Silencio 1600
hairdryer for 5 minutes. A Jeol JFC-1300 Auto Fine Coater was used for gold sputtering of
the samples, with a vacuum pressure of 1mA/Pa. A thin conductive layer was thus applied to
the ceramic samples, prohibiting electric charge buildup on the sample surface in the SEM.
This would otherwise distort the images.
The samples were mounted in the desired angle using conductive clay. A S-3700N Hitachi
SEM with a Bruker AXS Flash Detector, combined with a Quantax 800 software, was used to
analyze the variation in microstructure and composition in 3-5 points for each sample. A line
analysis was attempted. However, the results were inconsistent which may be an effect of the
large fraction of pores in the material. Sample 4 was initially incorrectly mounted, leaving
traces of clay on the surface to be studied. An analysis of the clay revealed that the
composition was, apart from some additional elements such as Fe and Si, close to that of the
samples. This means that the results for the contaminated sample were not reliable. However
the sample and the analysis were kept to see whether calcia and titania had penetrated the
crucible.
Sample 2 and 5 were washed 5 minutes using acetone and 5 minutes using ethanol in a Vico
AB Ultrasonic Steri-Cleaner. After washing the samples were allowed to dry in air and the
crucible samples were covered in tin foil (Al) except from a small area selected for
examination by field emission gun scanning electron microscope (FEG-SEM). A Polaron
Equipment E5400 High Resolution Sputter Coater was used for sputtering the crucible
samples with gold.
The analysis of sample 1,3 and 4 was performed by one team and sample 2 and 5 by another
to rationalize the work. Hence, the work procedures were not identical, and the results are
presented in slightly different ways.
Results and Discussion
The literature study reveals that clogging is a highly complex problem. It is affected by
several factors related to the steel, for example steel grade, alloying elements, deoxidation
elements, casting temperature, and the amount of inclusions. However, the focus of this study
is on the SEN. Numerous approaches may be useful in the attempt to eliminate clogging. To
achieve optimal results, it is likely that the solution should include more than one approach.
Here, an overview of the most common methods has been presented. Out of these methods
coatings, and particularly calcium titanate coating, are chosen for deeper investigation. The
reason for this choice is the limited research in the area despite promising results.
From the industrial point of view, it is not clear whether it is necessary to obtain liquid phase
only. Possibly, a two-phase reaction product would reduce clogging satisfactory. In the case
of calcia containing refractories, it has been suggested that a composition completely within
14
the liquid area is necessary to liquefy inclusions[3]
. On the other hand, when discussing the
calcia-titania-alumina system, a two-phase area has been considered to provide possible
protection against clogging.[6]
If this is the case, all samples in this project do at some point
show that calcium titanate could potentially function as an anti-clogging material.
Experimental evidence indicate that calcium titanate produce a sufficient amount of liquid
phase to drastically decrease clogging tendencies[3]
. However, there might be a risk of
agglomeration and sintering of resulting solid phases at the coating/steel interface.
The application method used for coating the nozzle could also affect the functionality.
According to Vdovin et al, paint sprayed coating (zirconia) resulted in low density coating,
permeable to gas.[14]
This may provide an advantage concerning argon injection, if this is
desired to be performed through the nozzle wall. On the other hand, oxygen leakage through
the nozzle, giving rise to in-situ reoxidation, could possibly be more significant. Additionally,
a low density coating is likely to have a less fine surface, facilitating the adhesion of
inclusions to the refractory interior.
Memarpour proposes plasma spaying as a method for applying an yttria stabilized zirconia
coating[2]
. This results in a relatively smooth and dense surface, and could possibly be suitable
also for calcium titanate coatings.
Depending on the temperature, some or all of a calcium titanate coating is likely to react with
an alumina-graphite SEN. Depletion of the calcium titanate coating due to reaction with
inclusions has not been investigated, and would have to be taken into consideration in the
evaluation of appropriate thickness. However, Ogibayashi suggests that once a liquid layer is
obtained, the attractive forces of new inclusions are too weak to allow these to adhere to the
nozzle[18]
. This could indicate that depletion of the coating may not be a major issue. For
refractories containing calcia, the transport of calcia to the refractory/steel interface has been a
limiting factor[3].
An advantage with coatings could be the higher concentration of clogging
decreasing elements at the surface, creating shorter migration distances. However, if a
calcium titanate coating would react with an alumina-graphite SEN rather than with the
inclusions in the steel, this might be a problem. Possibly the nozzle material has to be chosen
to avoid reaction with the coating, not to limit the lifespan of the coating.
The results from the SEM analysis can be found in Appendix A-E. The results were used to
calculate the percentage of Ca, Al and Ti respectively. As the oxygen content is not easily
evaluated by SEM, the composition was calculated omitting these values, and assuming that
all the elements were in their oxide forms TiO, CaO and Al2O3. The achieved compositions
were plotted in the ternary phase diagram from Fig. 8 and are shown in Appendix F. A
summary of the phases obtained through this procedure is presented in Table 3.

15
Table 3: Summary of the calculated phases from evaluated points and areas. Coloured rows indicate phase
diagram areas containing solely solid phases.
Area Sample 1 Sample 2 Sample 3 Sample 4 Sample 5 T+L T+AT+L 3 2 3 0,5 AT+L 0,5 CT+L CT+AT+L 1 CT+AT+L AT+L AT+A+L CT+L A+L 1
Total evaluated points
CT+A+L 1
57
CT+CA6+A 4 1,5 1 1
CT+CA3+CA6 4 5,5 1 2 4
Total in solid phase
T+CA+CA6
24
CT+CA+L
C3T2+CT+L 2 4 12
Total in liquid phase
C3T2+L
33
C+C3T2+L 2 1
C+L CA+L
The experimental results indicate that in many cases a liquid phase was achieved, despite a
short holding time for sample 1 and a rather low temperature for sample 3-5. However, it has
to be taken into account that the SEM-analysis of the compositions is not very precise as
oxygen is difficult to analyze. Also, the samples were not polished due to their hardness, this
may have contributed further to the uncertainty of the results. Ternary phase diagrams of the
actual temperatures were not to be found in literature, thus the available diagram at 1600°C,
which was suggested by Tuttle et al. [6]
to be valid at 1585°C, was used to investigate the
achieved compositions. The binary diagram in Fig. 7 ranges from pure CaTiO3 to pure Al2O3,
and does not consider the possible cases where calcia and titania have different reaction
equilibria or -kinetics with alumina. There are strong indications in the experimental data that
this may be the case, particularly sample 1, 3 and 4 show a pronounced separation between
calcia- and titania contents. Initially, the mole fractions of these should have been equal.
Sample 5 displays the least separation in calcia- and titania fractions, indicating a more
homogenous diffusion at lower temperatures. Moreover, at higher temperatures calcium may
evaporate, its boiling point being 1484˚C.[20]
However, it should be kept in mind that the used
phase diagram was modeled for a higher temperature. Thus, the calculated phases for the low
temperature samples are less certain.
Sample 4, cross section, was contaminated; hence the composition was not plotted in a phase
diagram. However the results strongly indicate that the composition does not vary much with
the distance to the surface. All evaluated points from the cross section contained almost pure
alumina. As a consequence, only the interface surfaces were analyzed in the following
samples. Sample 1, contents, gives further support to the theory that the changes in

16
composition are very concentrated to the actual interface. In this SEM-picture, one point is
situated on a thin flake that is seemingly broken off from the crucible. This point is composed
mostly of aluminium, in contrast to the points on the surface of the sintered contents. The
composition of the surface points is very close to pure calcium titanate, and includes only a
tiny fraction of aluminium.
In many cases the compositions in points evaluated from the same SEM-image vary
substantially. Thus, area analyses may not be a highly relevant means of investigating the
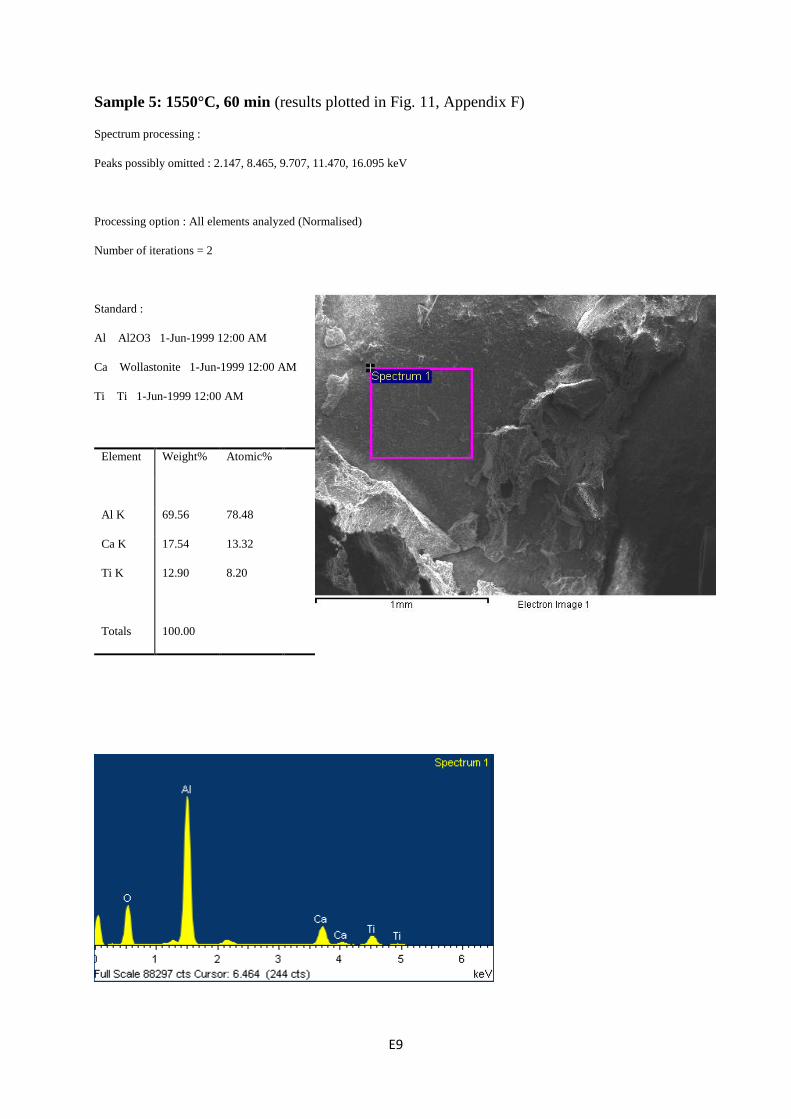
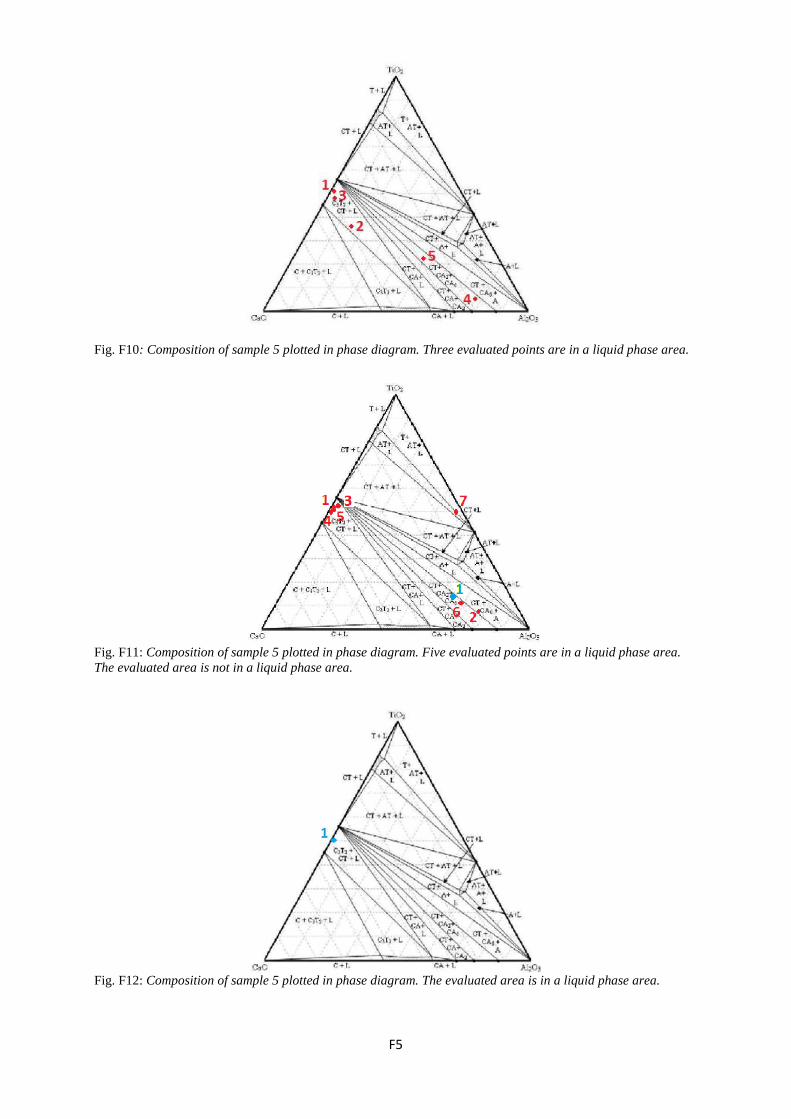
presence of liquid phases. For example, Fig. 11 shows the area composition in a solid phase
area, despite a majority of points having compositions in liquid phase areas.
Fig. 11: Composition of sample 5 plotted in phase diagram. Five evaluated points are in a liquid phase area. The
evaluated area is not in a liquid phase area.[17]
If applied as a coating, the variation in composition could possibly lead to local sintering of
inclusions in areas consisting of solid phases. This in turn may create a more uneven surface
of the SEN, facilitating further agglomeration. On the other hand, it is possible that solid areas
will be covered by flowing liquid phases from nearby regions, in which case the variations
may not constitute a problem. Empirical tests are likely to be necessary to properly answer
this question.
Another tendency found in cases where the compositions of nearby points are diverse, is that
points situated in areas appearing light in the SEM-pictures contain more titanium and less
aluminium and calcium than points in darker areas. Points within light areas are more often
plotted in liquid phase areas in the phase diagram.
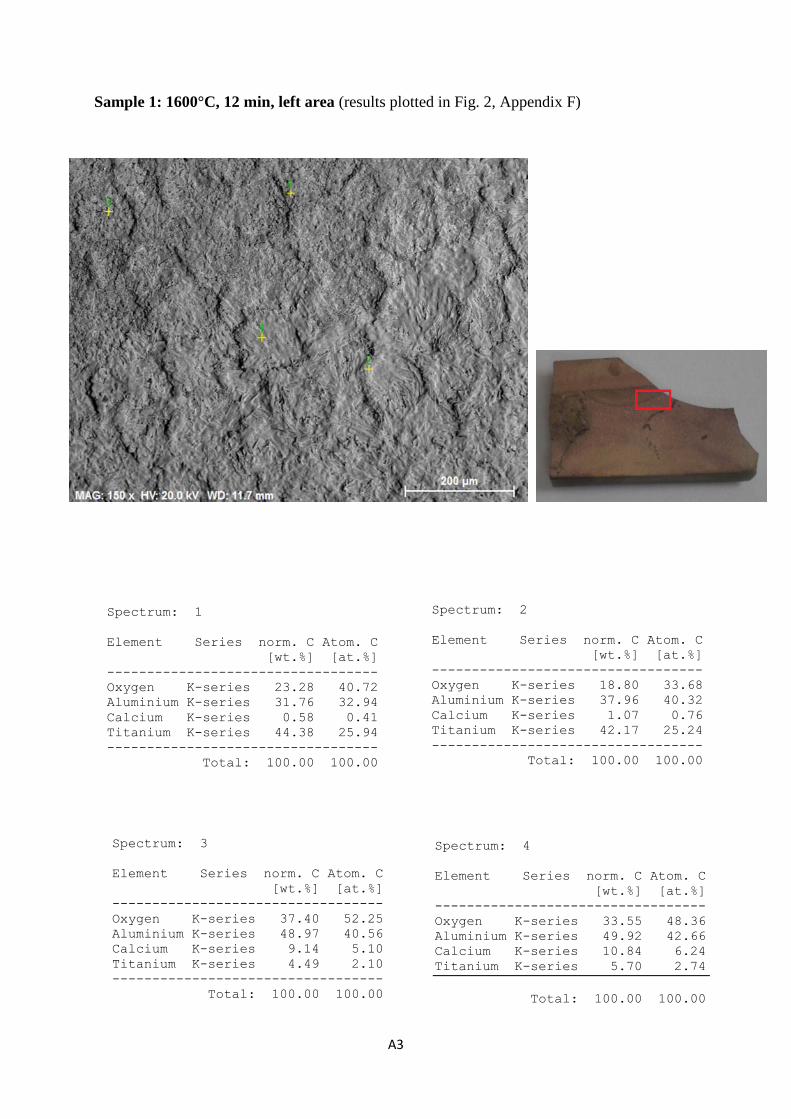
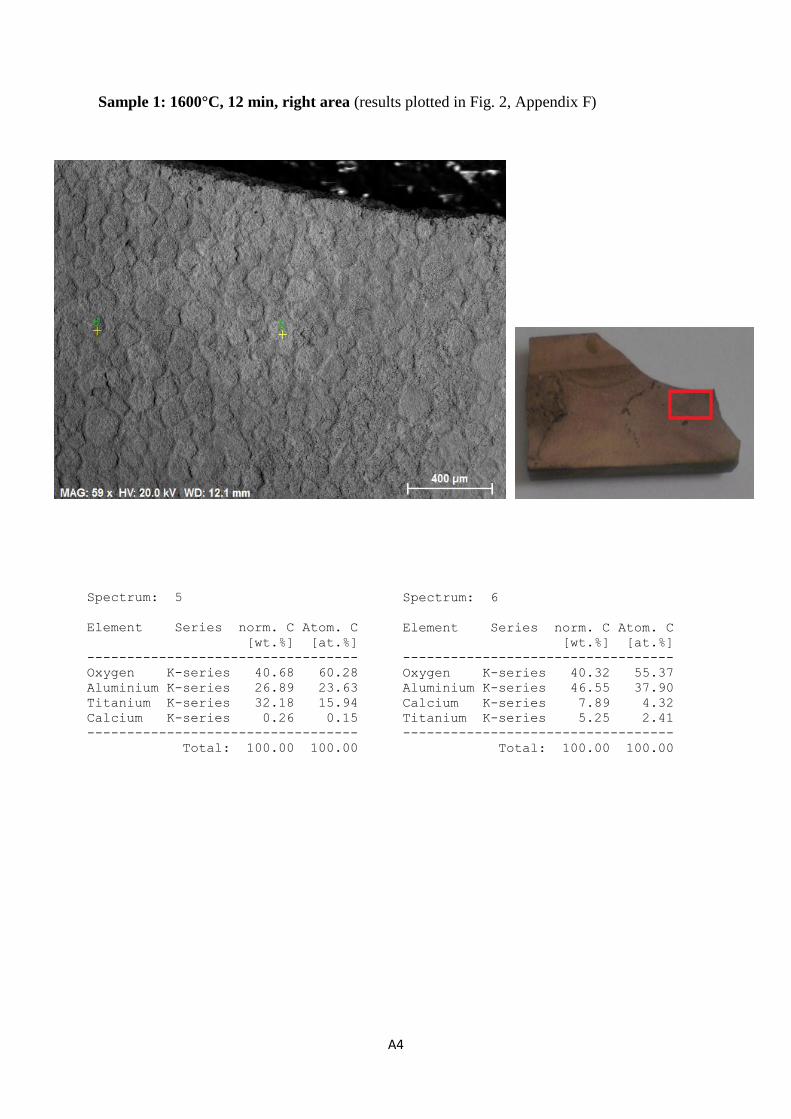
In a number of pictures, particularly from Sample 1, left and right area, a honeycomb-like
structure can be observed. There is no obvious difference in composition between the ridges
and the lower central areas, however a tendency to separation between light and dark areas is
noted.
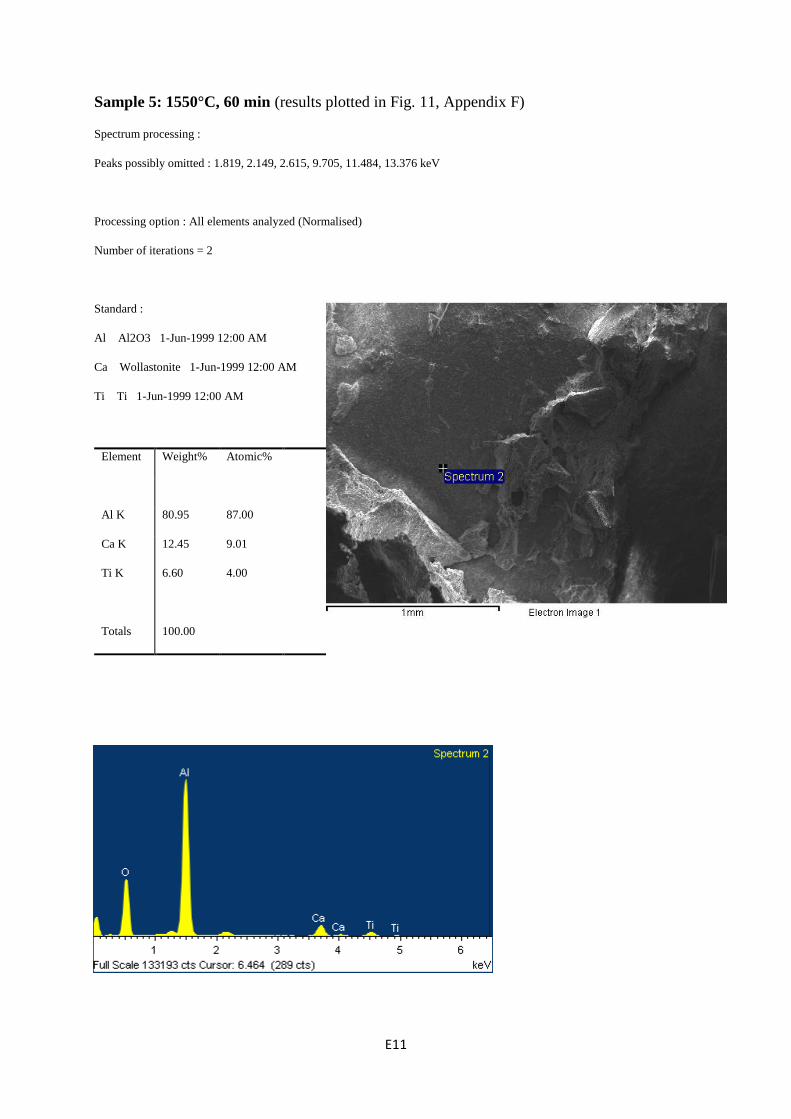
In Sample 2 and 5 flakes can be noted at the surface. The compositions in these more often
represent a liquid phase area, compared to the points situated on the crucible underneath.
Elongated particles can be seen in Sample 4, left area. These show no clear tendency to have
compositions differing from more round particles. Only point 1, situated on a small spherical

17
particle on the surface, stands out through its significant carbon content. Carbon was not
present in any other evaluated point. The carbon peak was omitted before calculating the
composition, the evaluation of which must be regarded as unreliable. A possible carbon
source may be the outer, protective crucible, from which a particle may have loosened and
entered the alumina crucible during the sample preparation.
A properly functioning coating could probably prolong the lifespan of the nozzle, which
would result in both economic and environmental advantages; every nozzle change means
interrupting the production, which leads to loss of production time as well as increased energy
consumption for keeping the steel at casting temperature. In addition, the amount of material
for deposition is decreased with increased lifespan. The application of a coating involves an
additional production process. The extra cost and environmental stress of this step must be
weighed against the benefits. The cost and environmental influence of the materials must be
balanced in a similar way.
Conclusions and Future work
The literature study and experiments have together led to a number of conclusions and
suggestions of future work. These can be summarized as follows:
Several measurements such as clean steel, inert gas injection, proper design of the
nozzle dimensions, preheating of the nozzle, calcium addition to the melt, choice of
nozzle material, inducing electromagnetic fields in the steel flow, and applying
coatings to the internal of the nozzle may contribute to the reduction of clogging.
It is not fully understood whether a liquid phase only has to be obtained for efficient
clogging reduction. Most likely, a fraction of liquid phase is sufficient to provide some
protection against clogging.
Indications of liquid phases were observed in experiments with calcium titanate
powder in alumina crucibles at all evaluated temperatures. Consequently, coating of
nozzles using calcium titanate has a high potential to diminish clogging problems in
the industry.
Temperatures as low as 1550˚C showed indications of liquid phases. Accordingly,
calcium titanate would be an appropriate coating material at steelmaking temperatures.
Significant local variations in composition were found. This may or may not represent
a problem. Casting experiments are probably essential to investigate this phenomenon
satisfactory.
Pilot plant studies are suggested to evaluate the performance of calcium titanate
coatings during casting.
To enable the industrial application of CaTiO3 further research is necessary in areas
such as: the application method, the depletion and thickness of the coating, the
interaction with the refractory, the necessary amount of liquid phase, and the
environmental as well as economic aspects.
18
Acknowledgements
We would like to thank our supervisors; Professor Pär Jönsson at KTH for his enthusiastic
support and guidance throughout the project, Jennie Svensson at HDa for sharing her work
and knowledge particularly in the experimental part, and Professor Voicu Brabie at HDa.
Thanks also to Anders Tilliander at KTH who have coordinated the bachelor thesis course.
The Swedish Governmental Agency for Innovation Systems (VINNOVA) and Jernkontoret
are acknowledged for their financial support, which made the presented research possible.
We wish to express our appreciation to Dalarna University for the use of equipment, and for
allowing us to perform the experiments at their premises.
Many thanks to Wen-Li Long at KTH for her assistance in using the SEM.
19
References
[1] Rackers, Thomas, ”Clogging in Continuous Casting Nozzles”, 78th Steelmaking Conference
Proceedings, Nashville, TN, April 2, 1995
[2] Memarpour, “An Experimental Study of Submerged Entry Nozzles (SEN) Focusing on
Decarburization and Clogging”, Doctoral thesis, KTH, 2011
[3] Tuttle, Smith, Peaslee, “Casting Simulation of Calcium Titanate and Calcium Zirconate
Nozzles for Continuous Casting of Aluminum-Killed Steels”, Metallurgical and Materials
Transactions B, Volume 38, Number 1, 2007
[4] Picture by: Felicia Lindén Bergman, 2012
[5] Kojola, Ekerot, Jönsson, Andersson, “Pilot plant study of nozzle clogging mechanisms during
casting of REM treated stainless steels”, Ironmaking & Steelmaking, Volume 38, Number 1,
2011
[6] Tuttle, Smith, Peaslee, “Interaction of Alumina Inclusions in Steel with Calcium-Containing
Materials”, Metallurgical and Materials Transactions B, Volume 36, Number 6, 2005
[7] Cui, Bao, Wang, Wu, “Clogging behavior of submerged entry nozzles for Ti-bearing IF steel”,
International journal of minerals, metallurgy, and materials, Volume 17, Number 2, 2010
[8] Lavers, Kadar, “Application of electromagnetic forces to reduce tundish nozzle clogging”,
Applied Mathematical Modelling, Volume 28, Issue 1, 2004
[9] Akselrod, Parshin, Mazurov, “Mechanism of Submersible-Nozzle Clogging in Continuous
Casting of Steel”, Steel in translation, Volume 37, Number 4, 2007
[10] Kojola, Ekerot, Jönsson, “Pilot plant study of clogging rates in low carbon and stainless steel
grades”, Ironmaking & Steelmaking, Volume 38, Number 2, 2011
[11] Jernkontorets utbildningspaket del 1(Historia, grundläggande metallurgi) p. 14
[12] Modified picture from: http://skm96.com/english/etc/prouse01.html 2012-02-25
[13] Strelov, Visloguzova, Kascheev, “Clogging of the channel of a forsterite nozzle in teeming of
aluminum-deoxidized steel”, Refractories and industrial ceramics, Volume 26, Numbers 7-8,
1986
[14] Vdovin, Rusakov, Lisichkina, “Prevention of overgrowth on submerged nozzles during
casting of steel deoxidized by aluminum”, Metallurgist, Volume 52, Numbers 5-6, 2008
[15] David W. Richerson, “Modern Ceramic Engineering”, CRC press, Taylor & Francis, 3rd
ed.,
2006, p. 642
[16] Modified picture from: AISI/DOE Industry Briefing, Pittsburgh, 2005
[17] Modified picture from: Tuttle, Smith, Peaslee, “Interaction of Alumina Inclusions in Steel
with Calcium-Containing Materials”, Metallurgical and Materials Transactions B, Volume 36,
Number 6, 2005
[18] Ogibayashi, “Mechanism and Countermeasure of Alumina Buildup on Submerged Nozzle in
Continuous Casting”, Taikabutsu Overseas, Volume 15, Number 1, 2007
[19] Picture by: Klara Takei, 2012
[20] Jefferson Lab, http://education.jlab.org/itselemental/ele020.html 2012-05-08

A1
Appendix A – SEM analyses for sample 1

A2
Spectrum: 1
Element Series norm. C Atom. C
[wt.%] [at.%]
----------------------------------
Oxygen K-series 42.74 55.79
Aluminium K-series 56.89 44.04
Titanium K-series 0.38 0.16
----------------------------------
Total: 100.00 100.00
Spectrum: 2
Element Series norm. C Atom. C
[wt.%] [at.%]
----------------------------------
Oxygen K-series 37.46 52.09
Aluminium K-series 50.08 41.30
Calcium K-series 8.97 4.98
Titanium K-series 3.49 1.62
----------------------------------
Total: 100.00 100.00
Sample 1: 1600°C, 12 min, interface/cross section (results plotted in Fig. 1, Appendix F)
A3
Sample 1: 1600°C, 12 min, left area (results plotted in Fig. 2, Appendix F)
Spectrum: 1
Element Series norm. C Atom. C
[wt.%] [at.%]
----------------------------------
Oxygen K-series 23.28 40.72
Aluminium K-series 31.76 32.94
Calcium K-series 0.58 0.41
Titanium K-series 44.38 25.94
----------------------------------
Total: 100.00 100.00
Spectrum: 2
Element Series norm. C Atom. C
[wt.%] [at.%]
----------------------------------
Oxygen K-series 18.80 33.68
Aluminium K-series 37.96 40.32
Calcium K-series 1.07 0.76
Titanium K-series 42.17 25.24
----------------------------------
Total: 100.00 100.00
Spectrum: 3
Element Series norm. C Atom. C
[wt.%] [at.%]
----------------------------------
Oxygen K-series 37.40 52.25
Aluminium K-series 48.97 40.56
Calcium K-series 9.14 5.10
Titanium K-series 4.49 2.10
----------------------------------
Total: 100.00 100.00
Spectrum: 4
Element Series norm. C Atom. C
[wt.%] [at.%]
----------------------------------
Oxygen K-series 33.55 48.36
Aluminium K-series 49.92 42.66
Calcium K-series 10.84 6.24
Titanium K-series 5.70 2.74
Total: 100.00 100.00
A4
Sample 1: 1600°C, 12 min, right area (results plotted in Fig. 2, Appendix F)
Spectrum: 5
Element Series norm. C Atom. C
[wt.%] [at.%]
----------------------------------
Oxygen K-series 40.68 60.28
Aluminium K-series 26.89 23.63
Titanium K-series 32.18 15.94
Calcium K-series 0.26 0.15
----------------------------------
Total: 100.00 100.00
Spectrum: 6
Element Series norm. C Atom. C
[wt.%] [at.%]
----------------------------------
Oxygen K-series 40.32 55.37
Aluminium K-series 46.55 37.90
Calcium K-series 7.89 4.32
Titanium K-series 5.25 2.41
----------------------------------
Total: 100.00 100.00

A5
Spectrum: 1
Element Series norm. C Atom. C
[wt.%] [at.%]
----------------------------------
Oxygen K-series 50.36 65.02
Aluminium K-series 38.76 29.68
Calcium K-series 7.25 3.73
Titanium K-series 3.63 1.57
----------------------------------
Total: 100.00 100.00
Spectrum: 2
Element Series norm. C Atom. C
[wt.%] [at.%]
----------------------------------
Oxygen K-series 27.98 51.21
Aluminium K-series 3.04 3.30
Calcium K-series 27.67 20.22
Titanium K-series 41.31 25.27
----------------------------------
Total: 100.00 100.00
Sample 1: 1600°C, 12 min, contents (results plotted in Fig. 3, Appendix F)
Spectrum: 3
Element Series norm. C Atom. C
[wt.%] [at.%]
----------------------------------
Oxygen K-series 38.04 62.53
Aluminium K-series 1.34 1.30
Calcium K-series 26.89 17.64
Titanium K-series 33.74 18.53
----------------------------------
Total: 100.00 100.00

B1
Appendix B – SEM analyses for sample 2

B2
Sample 2: 1600°C, 60 min (results plotted in Fig. 4, Appendix F)
Spectrum processing :
Peaks possibly omitted : 2.147, 6.404, 9.703, 11.483 keV
Processing option : All elements analyzed (Normalised)
Number of iterations = 2
Standard :
Al Al2O3 1-Jun-1999 12:00 AM
Ca Wollastonite 1-Jun-1999 12:00 AM
Ti Ti 1-Jun-1999 12:00 AM
Element Weight% Atomic%
Al K 77.87 84.66
Ca K 14.94 10.93
Ti K 7.19 4.40
Totals 100.00

B3
Sample 2: 1600°C, 60 min (results plotted in Fig. 4, Appendix F)
Spectrum processing :
Peaks possibly omitted : 0.795, 2.150, 2.430, 2.630, 2.805, 6.409, 9.705, 11.477 keV
Processing option : All elements analyzed (Normalised)
Number of iterations = 2
Standard :
Al Al2O3 1-Jun-1999 12:00 AM
Ca Wollastonite 1-Jun-1999 12:00 AM
Ti Ti 1-Jun-1999 12:00 AM
Element Weight% Atomic%
Al K 2.81 4.53
Ca K 41.79 45.27
Ti K 55.40 50.21
Totals 100.00
B4
Sample 2: 1600°C, 60 min (results plotted in Fig. 4, Appendix F)
Spectrum processing :
Peaks possibly omitted : 2.149, 2.640, 6.408, 8.540, 9.703, 11.468 keV
Processing option : All elements analyzed (Normalised)
Number of iterations = 2
Standard :
Al Al2O3 1-Jun-1999 12:00 AM
Ca Wollastonite 1-Jun-1999 12:00 AM
Ti Ti 1-Jun-1999 12:00 AM
Element Weight% Atomic%
Al K 80.57 86.65
Ca K 13.40 9.70
Ti K 6.03 3.65
Totals 100.00
0:
3

B5
Sample 2: 1600°C, 60 min (results plotted in Fig. 4, Appendix F)
Spectrum processing :
Peaks possibly omitted : 0.815, 2.148, 2.790, 9.706, 11.482 keV
Processing option : All elements analyzed (Normalised)
Number of iterations = 2
Standard :
Al Al2O3 1-Jun-1999 12:00 AM
Ca Wollastonite 1-Jun-1999 12:00 AM
Ti Ti 1-Jun-1999 12:00 AM
Element Weight% Atomic%
Al K 1.07 1.74
Ca K 42.89 46.94
Ti K 56.04 51.32
Totals 100.00

B6
Sample 2: 1600°C, 60 min (results plotted in Fig. 4, Appendix F)
Spectrum processing :
Peaks possibly omitted : 2.148, 5.905, 6.402, 8.530, 9.710, 11.490, 13.365 keV
Processing option : All elements analyzed (Normalised)
Number of iterations = 2
Standard :
Al Al2O3 1-Jun-1999 12:00 AM
Ca Wollastonite 1-Jun-1999 12:00 AM
Ti Ti 1-Jun-1999 12:00 AM
Element Weight% Atomic%
Al K 81.58 87.37
Ca K 12.95 9.33
Ti K 5.47 3.30
Totals 100.00

B7
Sample 2: 1600°C, 60 min (results plotted in Fig. 5, Appendix F)
Spectrum processing :
Peaks possibly omitted : 2.148, 6.383, 9.703, 11.489, 13.374 keV
Processing option : All elements analyzed (Normalised)
Number of iterations = 2
Standard :
Al Al2O3 1-Jun-1999 12:00 AM
Ca Wollastonite 1-Jun-1999 12:00 AM
Ti Ti 1-Jun-1999 12:00 AM
Element Weight% Atomic%
Al K 52.86 64.41
Ca K 24.09 19.76
Ti K 23.06 15.83
Totals 100.00

B8
Sample 2: 1600°C, 60 min (results plotted in Fig. 5, Appendix F)
Spectrum processing :
Peaks possibly omitted : 2.147, 5.895, 6.409, 9.703, 11.466, 13.379 keV
Processing option : All elements analyzed (Normalised)
Number of iterations = 2
Standard :
Al Al2O3 1-Jun-1999 12:00 AM
Ca Wollastonite 1-Jun-1999 12:00 AM
Ti Ti 1-Jun-1999 12:00 AM
Element Weight% Atomic%
Al K 80.80 86.85
Ca K 12.92 9.35
Ti K 6.28 3.80
Totals 100.00

B9
Sample 2: 1600°C, 60 min (results plotted in Fig. 5, Appendix F)
Spectrum processing :
Peaks possibly omitted : 2.146, 2.635, 6.412, 9.703, 11.471, 13.426 keV
Processing option : All elements analyzed (Normalised)
Number of iterations = 2
Standard :
Al Al2O3 1-Jun-1999 12:00 AM
Ca Wollastonite 1-Jun-1999 12:00 AM
Ti Ti 1-Jun-1999 12:00 AM
Element Weight% Atomic%
Al K 80.05 86.72
Ca K 9.33 6.80
Ti K 10.63 6.48
Totals 100.00
B10
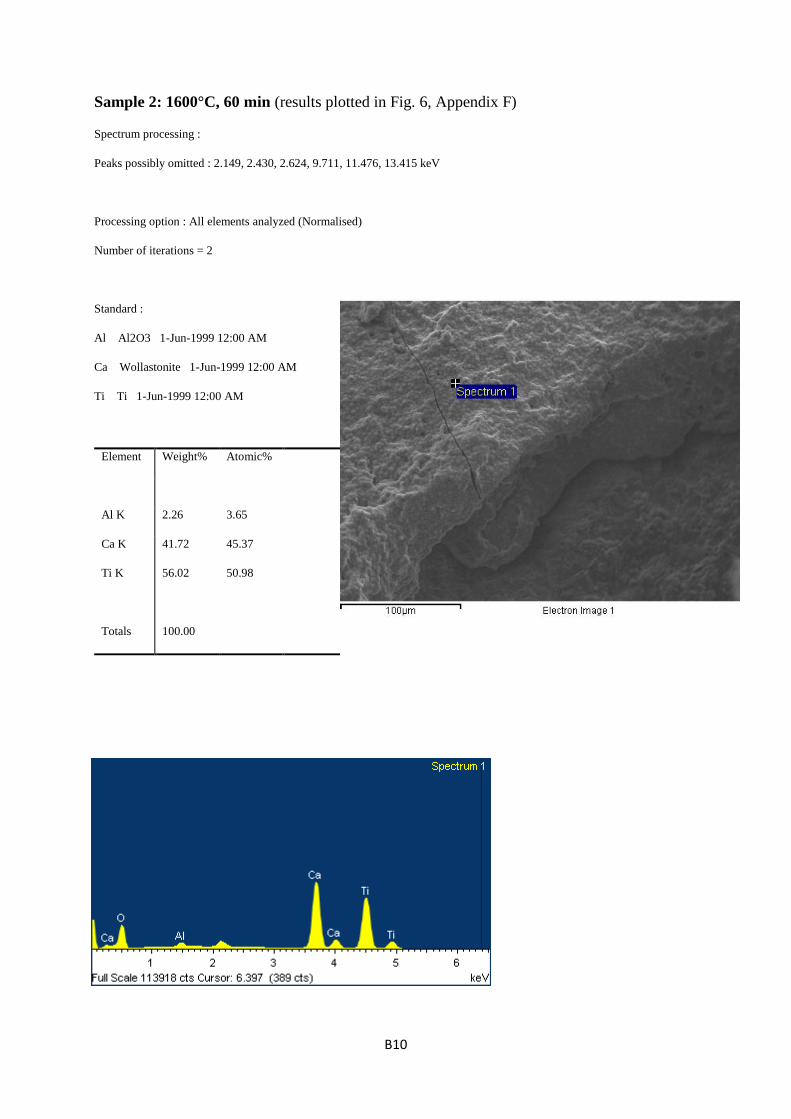
Sample 2: 1600°C, 60 min (results plotted in Fig. 6, Appendix F)
Spectrum processing :
Peaks possibly omitted : 2.149, 2.430, 2.624, 9.711, 11.476, 13.415 keV
Processing option : All elements analyzed (Normalised)
Number of iterations = 2
Standard :
Al Al2O3 1-Jun-1999 12:00 AM
Ca Wollastonite 1-Jun-1999 12:00 AM
Ti Ti 1-Jun-1999 12:00 AM
Element Weight% Atomic%
Al K 2.26 3.65
Ca K 41.72 45.37
Ti K 56.02 50.98
Totals 100.00

B11
Sample 2: 1600°C, 60 min (results plotted in Fig. 6, Appendix F)
Spectrum processing :
Peaks possibly omitted : 2.147, 9.712, 11.493 keV
Processing option : All elements analyzed (Normalised)
Number of iterations = 3
Standard :
Al Al2O3 1-Jun-1999 12:00 AM
Ca Wollastonite 1-Jun-1999 12:00 AM
Ti Ti 1-Jun-1999 12:00 AM
Element Weight% Atomic%
Al K 6.64 10.41
Ca K 41.80 44.09
Ti K 51.56 45.50
Totals 100.00

B12
Sample 2: 1600°C, 60 min (results plotted in Fig. 6, Appendix F)
Spectrum processing :
Peaks possibly omitted : 1.953, 2.140, 9.709, 16.085 keV
Processing option : All elements analyzed (Normalised)
Number of iterations = 2
Standard :
Al Al2O3 1-Jun-1999 12:00 AM
Ca Wollastonite 1-Jun-1999 12:00 AM
Ti Ti 1-Jun-1999 12:00 AM
Element Weight% Atomic%
Al K 20.13 27.95
Ca K 62.84 58.73
Ti K 17.03 13.31
Totals 100.00

B13
Sample 2: 1600°C, 60 min (results plotted in Fig. 6, Appendix F)
Spectrum processing :
Peaks possibly omitted : 2.155, 2.641, 6.405, 9.725, 14.606 keV
Processing option : All elements analyzed (Normalised)
Number of iterations = 1
Standard :
Al Al2O3 1-Jun-1999 12:00 AM
Ca Wollastonite 1-Jun-1999 12:00 AM
Ti Ti 1-Jun-1999 12:00 AM
Element Weight% Atomic%
Al K 21.85 29.92
Ca K 65.13 60.03
Ti K 13.02 10.04
Totals 100.00

B14
Sample 2: 1600°C, 60 min (results plotted in Fig. 6, Appendix F)
Spectrum processing :
Peaks possibly omitted : 2.153, 2.625, 5.915, 6.414, 9.707, 11.477 keV
Processing option : All elements analyzed (Normalised)
Number of iterations = 2
Standard :
Al Al2O3 1-Jun-1999 12:00 AM
Ca Wollastonite 1-Jun-1999 12:00 AM
Ti Ti 1-Jun-1999 12:00 AM
Element Weight% Atomic%
Al K 81.47 87.34
Ca K 12.52 9.03
Ti K 6.01 3.63
Totals 100.00

C1
Appendix C – SEM analyses for sample 3
C2
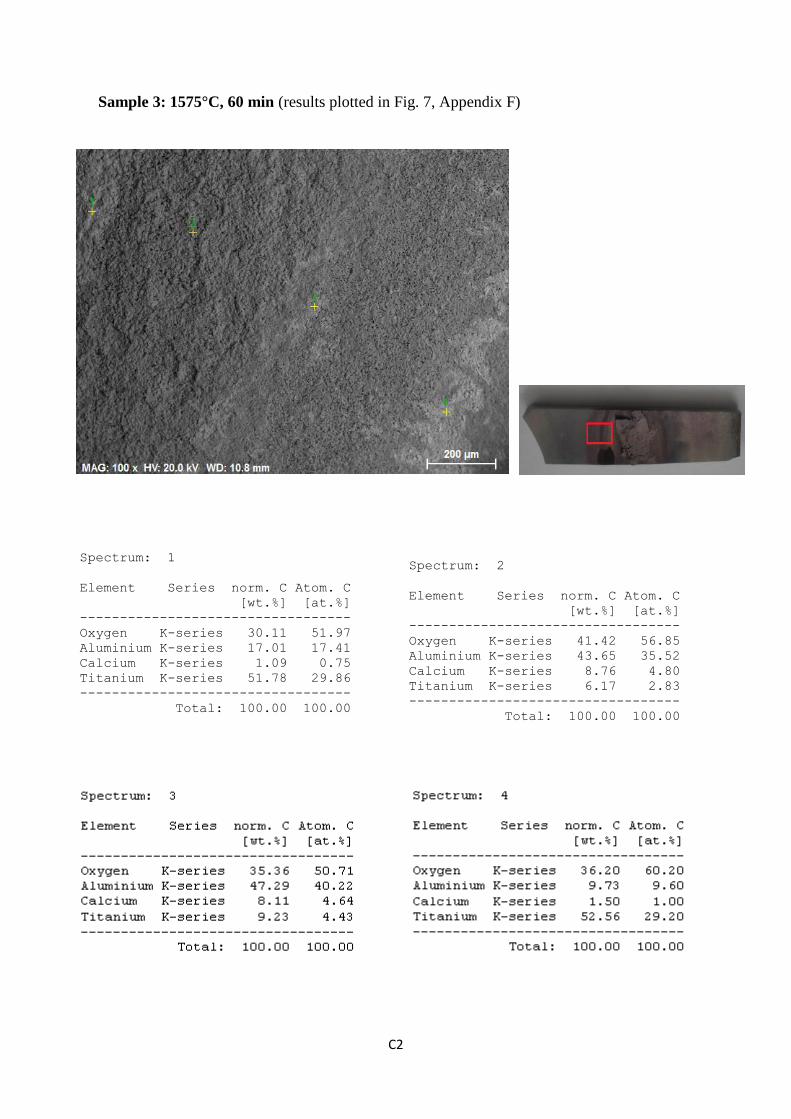
Spectrum: 1
Element Series norm. C Atom. C
[wt.%] [at.%]
----------------------------------
Oxygen K-series 30.11 51.97
Aluminium K-series 17.01 17.41
Calcium K-series 1.09 0.75
Titanium K-series 51.78 29.86
----------------------------------
Total: 100.00 100.00
Spectrum: 2
Element Series norm. C Atom. C
[wt.%] [at.%]
----------------------------------
Oxygen K-series 41.42 56.85
Aluminium K-series 43.65 35.52
Calcium K-series 8.76 4.80
Titanium K-series 6.17 2.83
----------------------------------
Total: 100.00 100.00
Sample 3: 1575°C, 60 min (results plotted in Fig. 7, Appendix F)

D1
Appendix D – SEM analyses for sample 4

D2
Spectrum: 4
Element Series norm. C Atom. C
[wt.%] [at.%]
----------------------------------
Oxygen K-series 39.28 53.00
Aluminium K-series 55.49 44.40
Calcium K-series 2.75 1.48
Titanium K-series 2.49 1.12
----------------------------------
Total: 100.00 100.00
Sample 4: 1565°C, 60 min (not plotted due to the contamination)
Spectrum: 1
Element Series norm. C Atom. C
[wt.%] [at.%]
----------------------------------
Oxygen K-series 41.08 55.99
Aluminium K-series 46.37 37.47
Calcium K-series 9.30 5.06
Titanium K-series 3.25 1.48
----------------------------------
Total: 100.00 100.00
Spectrum: 1
Element Series norm. C Atom. C
[wt.%] [at.%]
----------------------------------
Oxygen K-series 41.08 55.99
Aluminium K-series 46.37 37.47
Calcium K-series 9.30 5.06
Titanium K-series 3.25 1.48
----------------------------------
Total: 100.00 100.00
D3
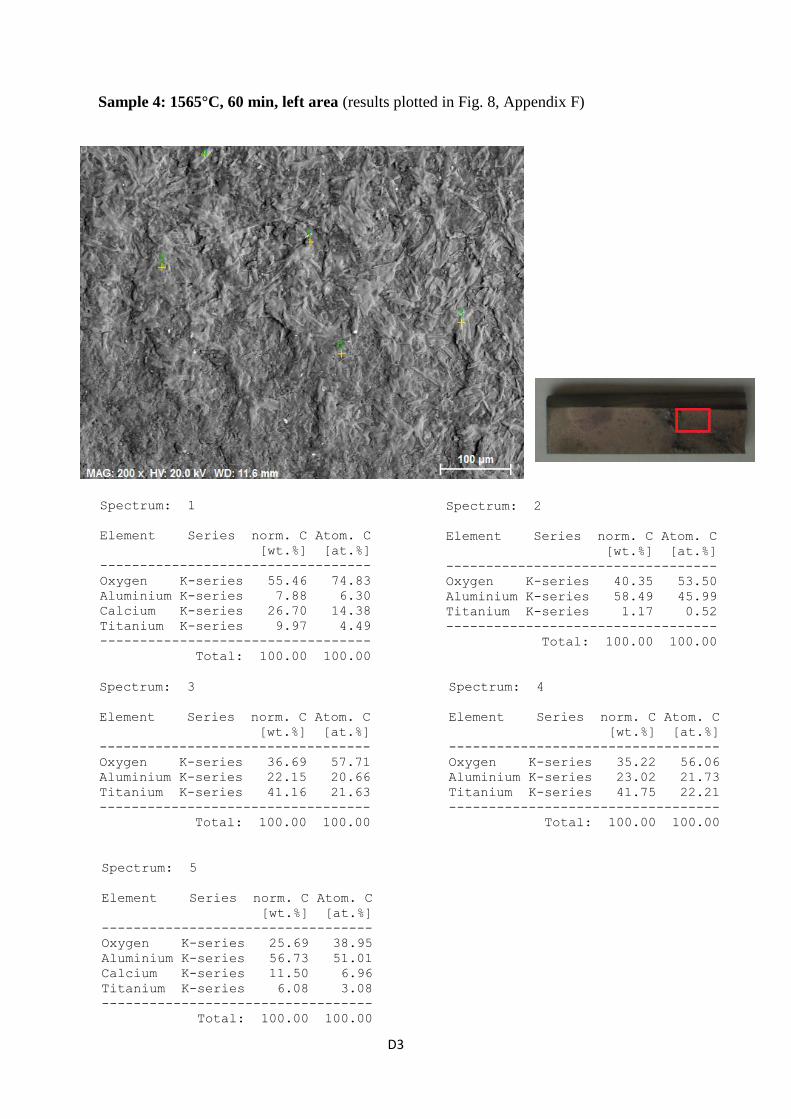
Sample 4: 1565°C, 60 min, left area (results plotted in Fig. 8, Appendix F)
Spectrum: 1
Element Series norm. C Atom. C
[wt.%] [at.%]
----------------------------------
Oxygen K-series 55.46 74.83
Aluminium K-series 7.88 6.30
Calcium K-series 26.70 14.38
Titanium K-series 9.97 4.49
----------------------------------
Total: 100.00 100.00
Spectrum: 2
Element Series norm. C Atom. C
[wt.%] [at.%]
----------------------------------
Oxygen K-series 40.35 53.50
Aluminium K-series 58.49 45.99
Titanium K-series 1.17 0.52
----------------------------------
Total: 100.00 100.00
Spectrum: 3
Element Series norm. C Atom. C
[wt.%] [at.%]
----------------------------------
Oxygen K-series 36.69 57.71
Aluminium K-series 22.15 20.66
Titanium K-series 41.16 21.63
----------------------------------
Total: 100.00 100.00
Spectrum: 4
Element Series norm. C Atom. C
[wt.%] [at.%]
----------------------------------
Oxygen K-series 35.22 56.06
Aluminium K-series 23.02 21.73
Titanium K-series 41.75 22.21
----------------------------------
Total: 100.00 100.00
Spectrum: 5
Element Series norm. C Atom. C
[wt.%] [at.%]
----------------------------------
Oxygen K-series 25.69 38.95
Aluminium K-series 56.73 51.01
Calcium K-series 11.50 6.96
Titanium K-series 6.08 3.08
----------------------------------
Total: 100.00 100.00
D4
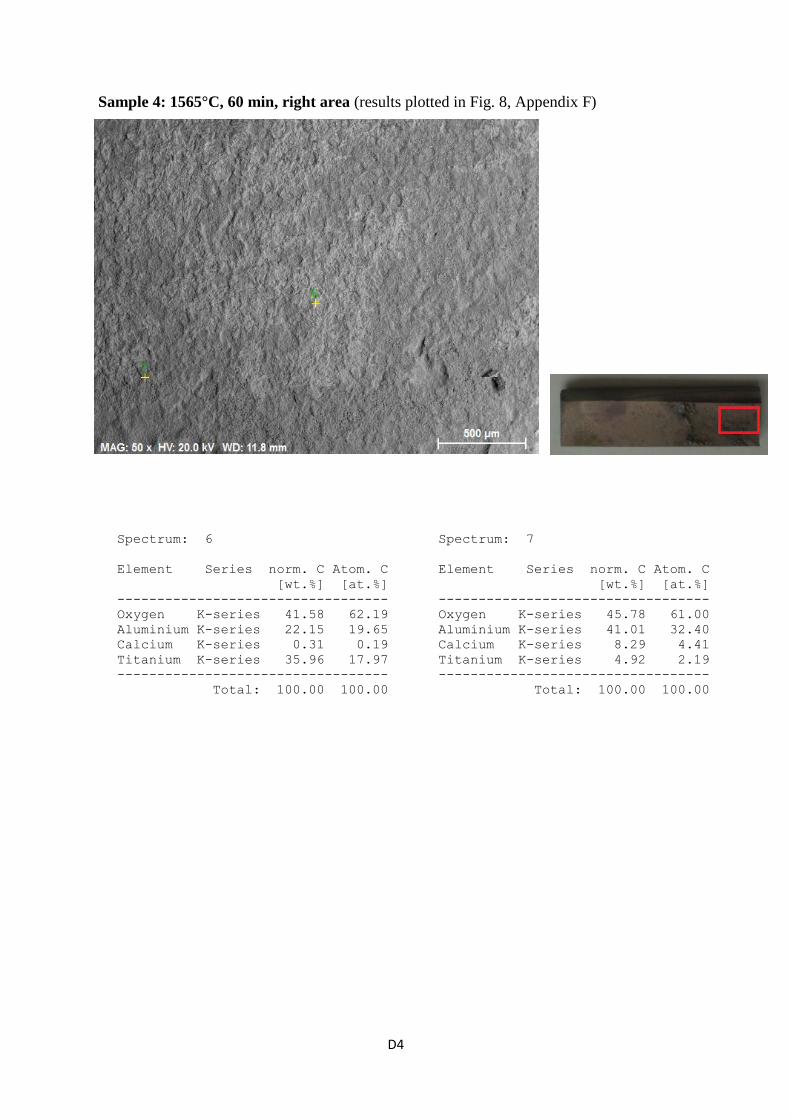
Sample 4: 1565°C, 60 min, right area (results plotted in Fig. 8, Appendix F)
Spectrum: 6
Element Series norm. C Atom. C
[wt.%] [at.%]
----------------------------------
Oxygen K-series 41.58 62.19
Aluminium K-series 22.15 19.65
Calcium K-series 0.31 0.19
Titanium K-series 35.96 17.97
----------------------------------
Total: 100.00 100.00
Spectrum: 7
Element Series norm. C Atom. C
[wt.%] [at.%]
----------------------------------
Oxygen K-series 45.78 61.00
Aluminium K-series 41.01 32.40
Calcium K-series 8.29 4.41
Titanium K-series 4.92 2.19
----------------------------------
Total: 100.00 100.00

E1
Appendix E – SEM analyses for sample 5

E2
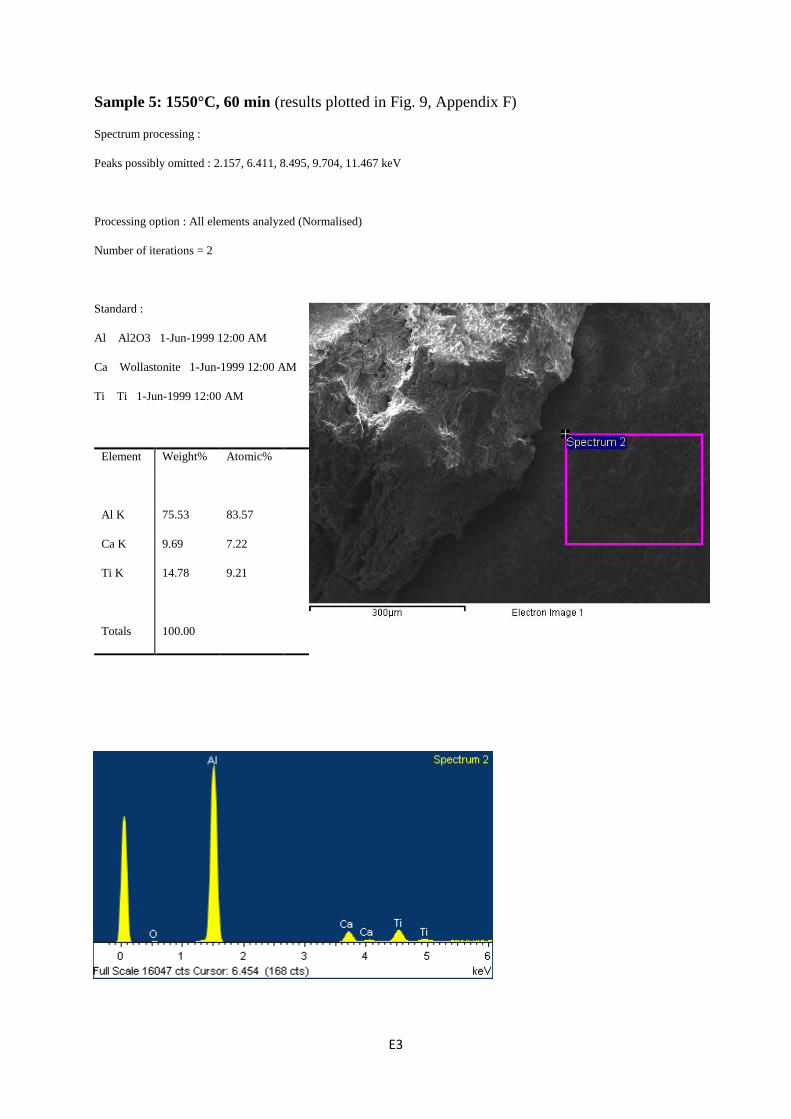
Sample 5: 1550°C, 60 min (results plotted in Fig. 9, Appendix F)
Spectrum processing :
Peaks possibly omitted : 7.405, 9.000 keV
Processing option : All elements analyzed (Normalised)
Number of iterations = 4
Standard :
O SiO2 1-Jun-1999 12:00 AM
Al Al2O3 1-Jun-1999 12:00 AM
Ca Wollastonite 1-Jun-1999 12:00 AM
Ti Ti 1-Jun-1999 12:00 AM
Element Weight% Atomic%
O K 46.13 70.19
Al K 0.08 0.08
Ca K 24.21 14.71
Ti K 29.57 15.03
E3
Sample 5: 1550°C, 60 min (results plotted in Fig. 9, Appendix F)
Spectrum processing :
Peaks possibly omitted : 2.157, 6.411, 8.495, 9.704, 11.467 keV
Processing option : All elements analyzed (Normalised)
Number of iterations = 2
Standard :
Al Al2O3 1-Jun-1999 12:00 AM
Ca Wollastonite 1-Jun-1999 12:00 AM
Ti Ti 1-Jun-1999 12:00 AM
Element Weight% Atomic%
Al K 75.53 83.57
Ca K 9.69 7.22
Ti K 14.78 9.21
Totals 100.00

E4
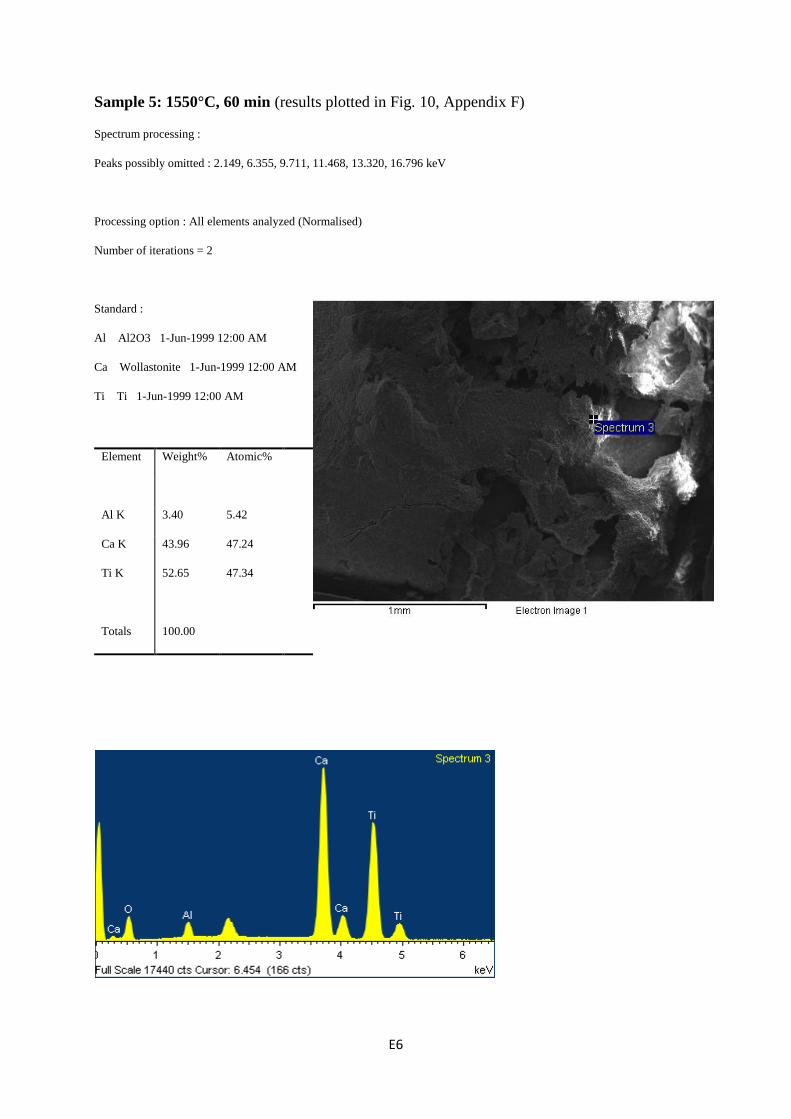
Sample 5: 1550°C, 60 min (results plotted in Fig. 10, Appendix F)
Spectrum processing :
Peaks possibly omitted : 2.147, 2.435, 2.805, 8.515, 9.704, 11.482, 12.795, 13.342 keV
Processing option : All elements analyzed (Normalised)
Number of iterations = 2
Standard :
Al Al2O3 1-Jun-1999 12:00 AM
Ca Wollastonite 1-Jun-1999 12:00 AM
Ti Ti 1-Jun-1999 12:00 AM
Element Weight% Atomic%
Al K 0.49 0.80
Ca K 43.06 47.31
Ti K 56.45 51.89
Totals 100.00

E5
Sample 5: 1550°C, 60 min (results plotted in Fig. 10, Appendix F)
Spectrum processing :
Peak possibly omitted : 2.131 keV
Processing option : All elements analyzed (Normalised)
Number of iterations = 1
Standard :
Al Al2O3 1-Jun-1999 12:00 AM
Ca Wollastonite 1-Jun-1999 12:00 AM
Ti Ti 1-Jun-1999 12:00 AM
Element Weight% Atomic%
Al K 18.96 27.36
Ca K 42.85 41.61
Ti K 38.19 31.03
Totals 100.00
E6
Sample 5: 1550°C, 60 min (results plotted in Fig. 10, Appendix F)
Spectrum processing :
Peaks possibly omitted : 2.149, 6.355, 9.711, 11.468, 13.320, 16.796 keV
Processing option : All elements analyzed (Normalised)
Number of iterations = 2
Standard :
Al Al2O3 1-Jun-1999 12:00 AM
Ca Wollastonite 1-Jun-1999 12:00 AM
Ti Ti 1-Jun-1999 12:00 AM
Element Weight% Atomic%
Al K 3.40 5.42
Ca K 43.96 47.24
Ti K 52.65 47.34
Totals 100.00

E7
Sample 5: 1550°C, 60 min (results plotted in Fig. 10, Appendix F)
Spectrum processing :
Peaks possibly omitted : 2.148, 6.375, 9.711, 11.533, 13.380 keV
Processing option : All elements analyzed (Normalised)
Number of iterations = 2
Standard :
Al Al2O3 1-Jun-1999 12:00 AM
Ca Wollastonite 1-Jun-1999 12:00 AM
Ti Ti 1-Jun-1999 12:00 AM
Element Weight% Atomic%
Al K 79.55 85.87
Ca K 14.31 10.40
Ti K 6.14 3.73
Totals 100.00

E8
Sample 5: 1550°C, 60 min (results plotted in Fig. 10, Appendix F)
Spectrum processing :
Peaks possibly omitted : 2.147, 9.710, 11.490 keV
Processing option : All elements analyzed (Normalised)
Number of iterations = 2
Standard :
Al Al2O3 1-Jun-1999 12:00 AM
Ca Wollastonite 1-Jun-1999 12:00 AM
Ti Ti 1-Jun-1999 12:00 AM
Element Weight% Atomic%
Al K 53.88 65.38
Ca K 23.15 18.91
Ti K 22.97 15.70
Totals 100.00
E9
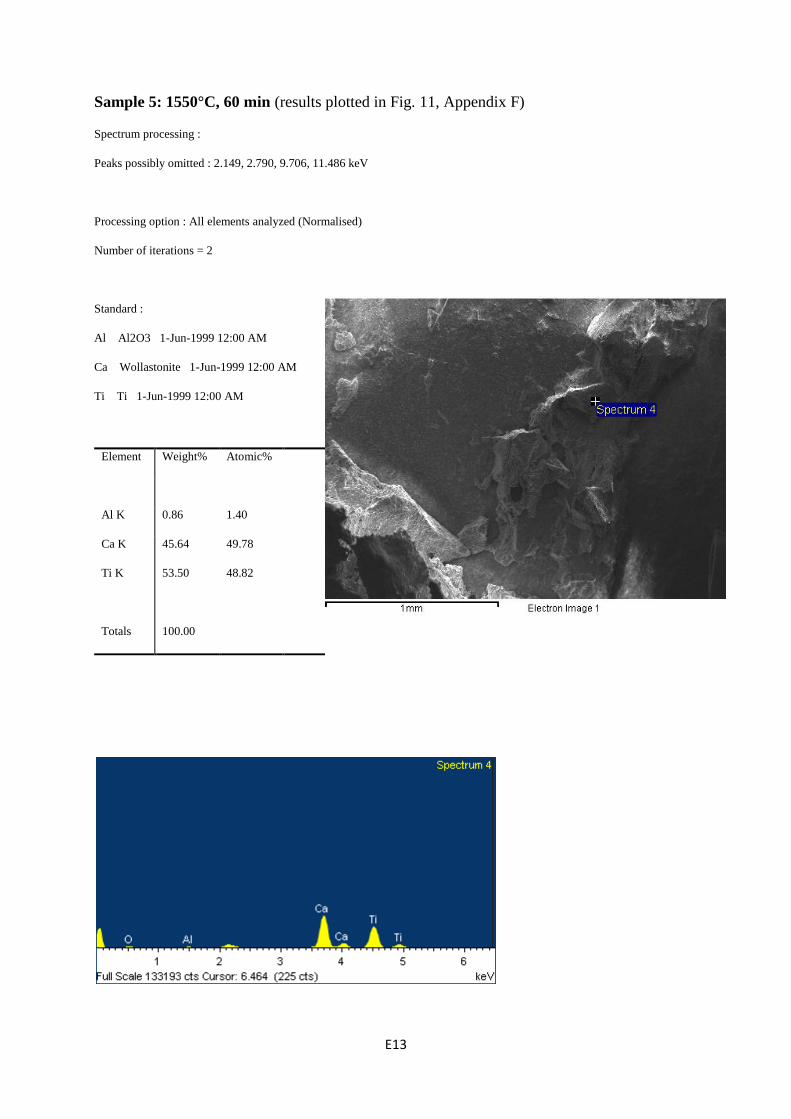
Sample 5: 1550°C, 60 min (results plotted in Fig. 11, Appendix F)
Spectrum processing :
Peaks possibly omitted : 2.147, 8.465, 9.707, 11.470, 16.095 keV
Processing option : All elements analyzed (Normalised)
Number of iterations = 2
Standard :
Al Al2O3 1-Jun-1999 12:00 AM
Ca Wollastonite 1-Jun-1999 12:00 AM
Ti Ti 1-Jun-1999 12:00 AM
Element Weight% Atomic%
Al K 69.56 78.48
Ca K 17.54 13.32
Ti K 12.90 8.20
Totals 100.00

E10
Sample 5: 1550°C, 60 min (results plotted in Fig. 11, Appendix F)
Spectrum processing :
Peaks possibly omitted : 2.150, 2.626, 9.707, 11.489 keV
Processing option : All elements analyzed (Normalised)
Number of iterations = 2
Standard :
Al Al2O3 1-Jun-1999 12:00 AM
Ca Wollastonite 1-Jun-1999 12:00 AM
Ti Ti 1-Jun-1999 12:00 AM
Element Weight% Atomic%
Al K 0.54 0.88
Ca K 43.31 47.54
Ti K 56.15 51.58
Totals 100.00
E11
Sample 5: 1550°C, 60 min (results plotted in Fig. 11, Appendix F)
Spectrum processing :
Peaks possibly omitted : 1.819, 2.149, 2.615, 9.705, 11.484, 13.376 keV
Processing option : All elements analyzed (Normalised)
Number of iterations = 2
Standard :
Al Al2O3 1-Jun-1999 12:00 AM
Ca Wollastonite 1-Jun-1999 12:00 AM
Ti Ti 1-Jun-1999 12:00 AM
Element Weight% Atomic%
Al K 80.95 87.00
Ca K 12.45 9.01
Ti K 6.60 4.00
Totals 100.00

E12
Sample 5: 1550°C, 60 min (results plotted in Fig. 11, Appendix F)
Spectrum processing :
Peaks possibly omitted : 2.148, 2.800, 8.490, 9.706, 11.496, 13.335, 13.800 keV
Processing option : All elements analyzed (Normalised)
Number of iterations = 2
Standard :
Al Al2O3 1-Jun-1999 12:00 AM
Ca Wollastonite 1-Jun-1999 12:00 AM
Ti Ti 1-Jun-1999 12:00 AM
Element Weight% Atomic%
Al K 1.75 2.83
Ca K 42.26 46.08
Ti K 56.00 51.09
Totals 100.00
E13
Sample 5: 1550°C, 60 min (results plotted in Fig. 11, Appendix F)
Spectrum processing :
Peaks possibly omitted : 2.149, 2.790, 9.706, 11.486 keV
Processing option : All elements analyzed (Normalised)
Number of iterations = 2
Standard :
Al Al2O3 1-Jun-1999 12:00 AM
Ca Wollastonite 1-Jun-1999 12:00 AM
Ti Ti 1-Jun-1999 12:00 AM
Element Weight% Atomic%
Al K 0.86 1.40
Ca K 45.64 49.78
Ti K 53.50 48.82
Totals 100.00
E14
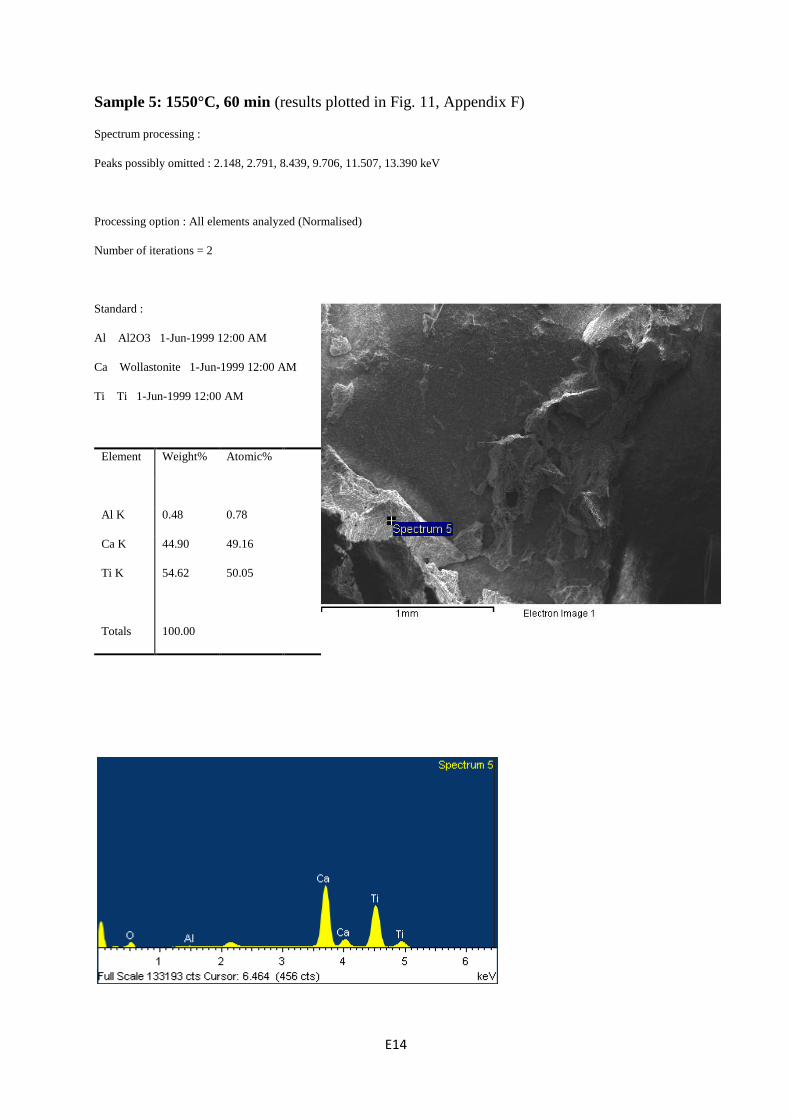
Sample 5: 1550°C, 60 min (results plotted in Fig. 11, Appendix F)
Spectrum processing :
Peaks possibly omitted : 2.148, 2.791, 8.439, 9.706, 11.507, 13.390 keV
Processing option : All elements analyzed (Normalised)
Number of iterations = 2
Standard :
Al Al2O3 1-Jun-1999 12:00 AM
Ca Wollastonite 1-Jun-1999 12:00 AM
Ti Ti 1-Jun-1999 12:00 AM
Element Weight% Atomic%
Al K 0.48 0.78
Ca K 44.90 49.16
Ti K 54.62 50.05
Totals 100.00

E15
Sample 5: 1550°C, 60 min (results plotted in Fig. 11, Appendix F)
Spectrum processing :
Peaks possibly omitted : 2.148, 9.710, 11.487 keV
Processing option : All elements analyzed (Normalised)
Number of iterations = 2
Standard :
Al Al2O3 1-Jun-1999 12:00 AM
Ca Wollastonite 1-Jun-1999 12:00 AM
Ti Ti 1-Jun-1999 12:00 AM
Element Weight% Atomic%
Al K 72.37 80.67
Ca K 16.21 12.16
Ti K 11.42 7.17
Totals 100.00
E16
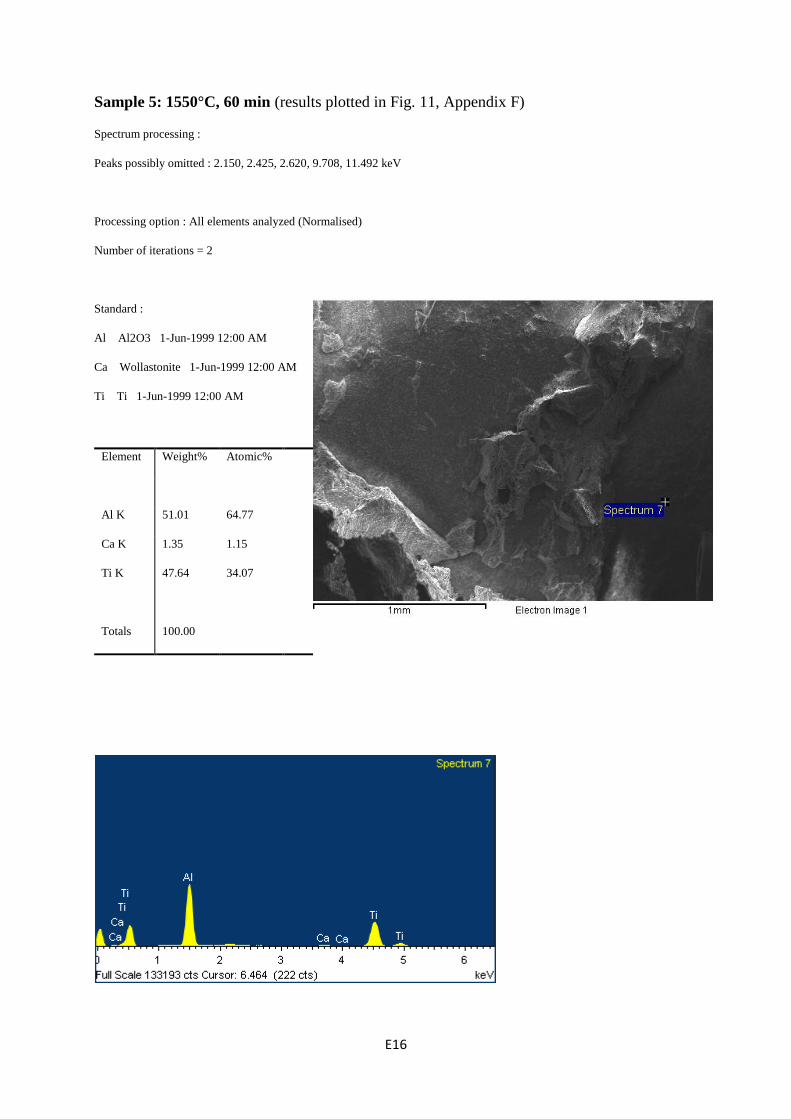
Sample 5: 1550°C, 60 min (results plotted in Fig. 11, Appendix F)
Spectrum processing :
Peaks possibly omitted : 2.150, 2.425, 2.620, 9.708, 11.492 keV
Processing option : All elements analyzed (Normalised)
Number of iterations = 2
Standard :
Al Al2O3 1-Jun-1999 12:00 AM
Ca Wollastonite 1-Jun-1999 12:00 AM
Ti Ti 1-Jun-1999 12:00 AM
Element Weight% Atomic%
Al K 51.01 64.77
Ca K 1.35 1.15
Ti K 47.64 34.07
Totals 100.00

E17
Sample 5: 1550°C, 60 min (results plotted in Fig. 12, Appendix F)
Spectrum processing :
Peaks possibly omitted : 2.148, 9.702, 11.487, 17.644 keV
Processing option : All elements analyzed (Normalised)
Number of iterations = 2
Standard :
Al Al2O3 1-Jun-1999 12:00 AM
Ca Wollastonite 1-Jun-1999 12:00 AM
Ti Ti 1-Jun-1999 12:00 AM
Element Weight% Atomic%
Al K 5.30 8.49
Ca K 34.97 37.67
Ti K 59.73 53.84
Totals 100.00
E18
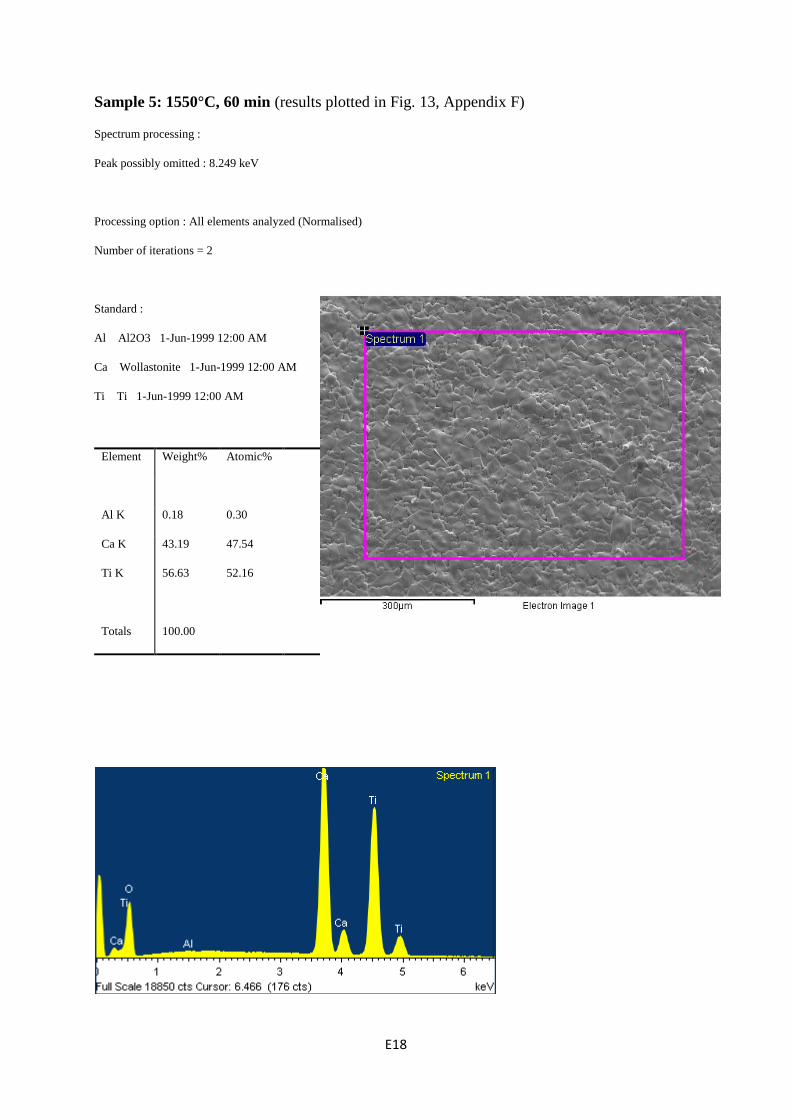
Sample 5: 1550°C, 60 min (results plotted in Fig. 13, Appendix F)
Spectrum processing :
Peak possibly omitted : 8.249 keV
Processing option : All elements analyzed (Normalised)
Number of iterations = 2
Standard :
Al Al2O3 1-Jun-1999 12:00 AM
Ca Wollastonite 1-Jun-1999 12:00 AM
Ti Ti 1-Jun-1999 12:00 AM
Element Weight% Atomic%
Al K 0.18 0.30
Ca K 43.19 47.54
Ti K 56.63 52.16
Totals 100.00
E19
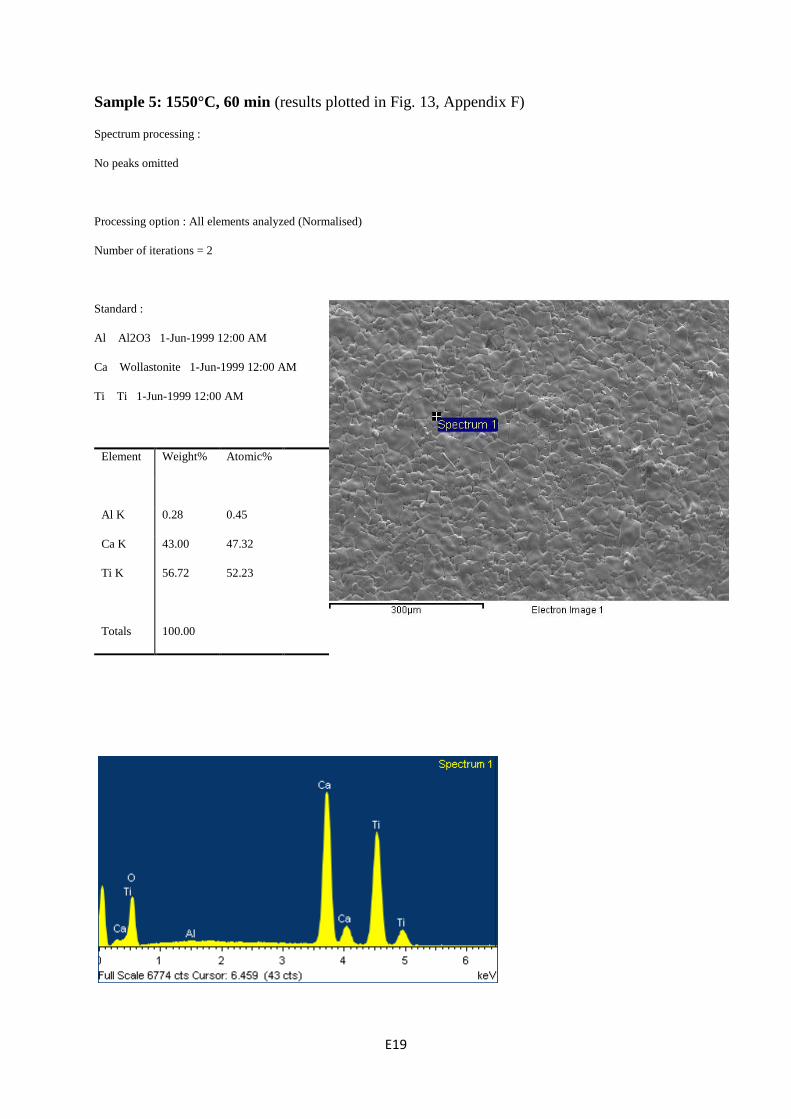
Sample 5: 1550°C, 60 min (results plotted in Fig. 13, Appendix F)
Spectrum processing :
No peaks omitted
Processing option : All elements analyzed (Normalised)
Number of iterations = 2
Standard :
Al Al2O3 1-Jun-1999 12:00 AM
Ca Wollastonite 1-Jun-1999 12:00 AM
Ti Ti 1-Jun-1999 12:00 AM
Element Weight% Atomic%
Al K 0.28 0.45
Ca K 43.00 47.32
Ti K 56.72 52.23
Totals 100.00

E20
Sample 5: 1550°C, 60 min (results plotted in Fig. 13, Appendix F)
Spectrum processing :
Peaks possibly omitted : 2.615, 8.200 keV
Processing option : All elements analyzed (Normalised)
Number of iterations = 2
Standard :
Al Al2O3 1-Jun-1999 12:00 AM
Ca Wollastonite 1-Jun-1999 12:00 AM
Ti Ti 1-Jun-1999 12:00 AM
Element Weight% Atomic%
Al K 0.17 0.28
Ca K 43.32 47.68
Ti K 56.51 52.04
Totals 100.00
E21
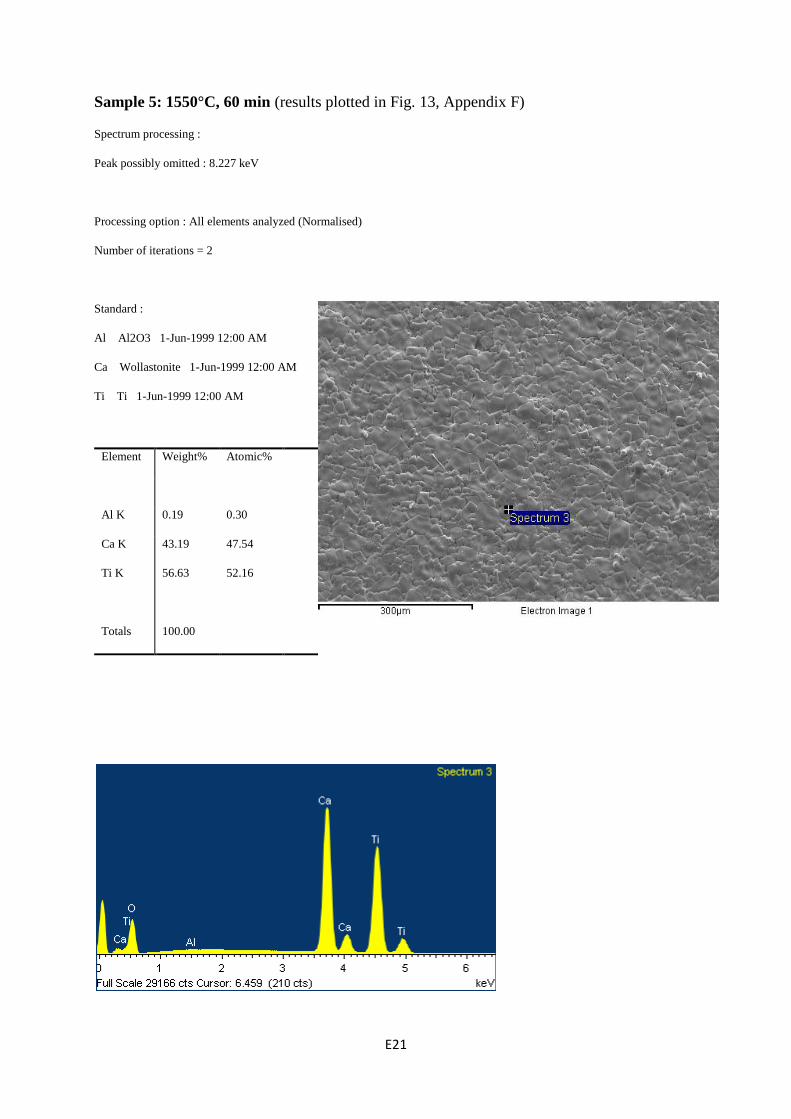
Sample 5: 1550°C, 60 min (results plotted in Fig. 13, Appendix F)
Spectrum processing :
Peak possibly omitted : 8.227 keV
Processing option : All elements analyzed (Normalised)
Number of iterations = 2
Standard :
Al Al2O3 1-Jun-1999 12:00 AM
Ca Wollastonite 1-Jun-1999 12:00 AM
Ti Ti 1-Jun-1999 12:00 AM
Element Weight% Atomic%
Al K 0.19 0.30
Ca K 43.19 47.54
Ti K 56.63 52.16
Totals 100.00

F1
Appendix F – The results from SEM analysis plotted in ternary phase diagrams.
Point analyses are plotted in red, areas in blue.

F2
Fig. 1: Composition of Sample 1, interface/cross section, plotted in phase diagram. No evaluated point is in a
liquid phase area. Point number 4 was not possible to analyze due to the positioning.
Fig. 2: Composition of sample 1 (points 1-4 left area, 5-6 right area) plotted in phase diagram. Three points are
in a liquid phase area.
Fig. 3: Composition of Sample 1, contents, plotted in phase diagram. Two evaluated points are in a liquid phase
area.

F3
Fig. F4: Composition of Sample 2 plotted in phase diagram. Two evaluated points are in a liquid phase area.
Fig. F5: Composition of Sample 2 plotted in phase diagram. No evaluated areas are in a liquid phase area.
Fig. F6: Composition of Sample 2 plotted in phase diagram. All evaluated points except one are in a liquid phase
area.
F4
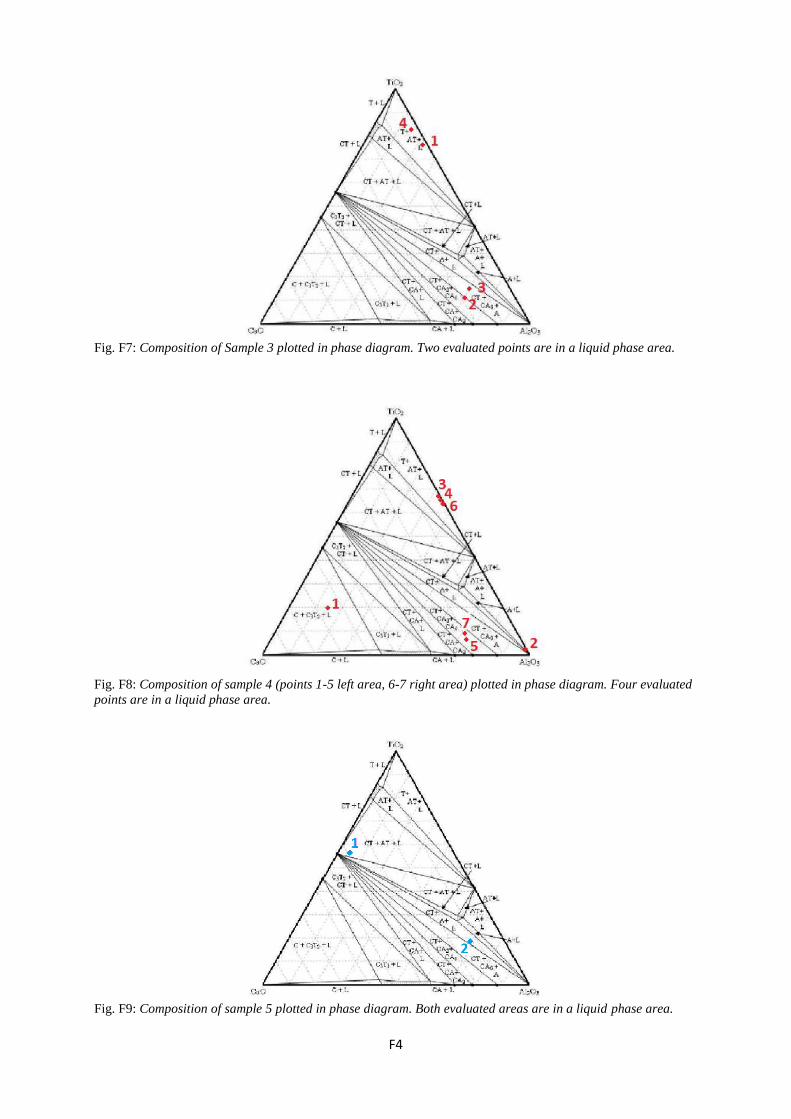
Fig. F7: Composition of Sample 3 plotted in phase diagram. Two evaluated points are in a liquid phase area.
Fig. F8: Composition of sample 4 (points 1-5 left area, 6-7 right area) plotted in phase diagram. Four evaluated
points are in a liquid phase area.
Fig. F9: Composition of sample 5 plotted in phase diagram. Both evaluated areas are in a liquid phase area.
F5
Fig. F10: Composition of sample 5 plotted in phase diagram. Three evaluated points are in a liquid phase area.
Fig. F11: Composition of sample 5 plotted in phase diagram. Five evaluated points are in a liquid phase area.
The evaluated area is not in a liquid phase area.
Fig. F12: Composition of sample 5 plotted in phase diagram. The evaluated area is in a liquid phase area.

F6
Fig. F13: Composition of sample 5 plotted in phase diagram. The evaluated area and all evaluated points are in
a liquid phase area. The compositions are almost identical.