clinical psychology review - um · pdf fileintroduction ... support in pediatric ocd has been...
TRANSCRIPT

Clinical Psychology Review 28 (2008) 1310–1325
Contents lists available at ScienceDirect
Clinical Psychology Review
Psychological treatment of obsessive–compulsive disorder: Ameta-analysis☆
Ana I. Rosa-Alcázar a, Julio Sánchez-Meca b,⁎,Antonia Gómez-Conesa c, Fulgencio Marín-Martínez b
a Department Personality, Assessment and Psychological Treatment, Faculty of Psychology, University of Murcia, Espinardo Campus, 30100-Murcia, Spainb Department Basic Psychology and Methodology, Faculty of Psychology, University of Murcia, Espinardo Campus, 30100-Murcia, Spainc Department Physiotherapy, Faculty of Medicine, University of Murcia, Espinardo Campus, 30100-Murcia, Spain
a r t i c l e i n f o
☆ This research was supported by a grant of the MiniSEJ2004-07278/PSIC).⁎ Corresponding author. Tel.: +34 968364114; fax: +
E-mail address: [email protected] (J. Sánchez-Meca).URL: http://www.um.es/facpsi/metaanalysis (J. Sán
0272-7358/$ – see front matter © 2008 Elsevier Ltd.doi:10.1016/j.cpr.2008.07.001
a b s t r a c t
Article history:Received 18 March 2008Received in revised form 30 June 2008Accepted 1 July 2008
The benefits of cognitive–behavioral treatment for obsessive–compulsive disorder (OCD) havebeen evidenced by several meta-analyses. However, the differential effectiveness of behavioraland cognitive approaches has shown inconclusive results. In this paper a meta-analysis on theeffectiveness of psychological treatment for OCD is presented by applying random- and mixed-effects models. The literature search enabled us to identify 19 studies published between 1980and 2006 that fulfilled our selection criteria, giving a total of 24 independent comparisonsbetween a treated and a control group. The effect size index was the standardized meandifference in the posttest. The effect estimates for exposure with response prevention (ERP)alone (d+=1.127), cognitive restructuring (CR) alone (d+=1.090), and ERP plus CR (d+=0.998)were very similar, although the effect estimate for CR alone was based on only threecomparisons. Therapist-guided exposure was better than therapist-assisted self-exposure, andexposure in vivo combined with exposure in imagination was better than exposure in vivoalone. The relationships of subject, methodological and extrinsic variables with effect size werealso examined, and an analysis of publication bias was carried out. Finally, the implications ofthe results for clinical practice and for future research in this field were discussed.
© 2008 Elsevier Ltd. All rights reserved.
Keywords:Obsessive–compulsive disorderOCDTreatment outcome evaluationExposureCognitive therapyMeta-analysis
Contents
1. Introduction . . . . . . . . . . . . . . . . . . . . . . . . . . . . . . . . . . . . . . . . . . . . . . . . . . . . . . 13111.1. Psychological treatment of OCD . . . . . . . . . . . . . . . . . . . . . . . . . . . . . . . . . . . . . . . . . . 13111.2. Goals of the current study . . . . . . . . . . . . . . . . . . . . . . . . . . . . . . . . . . . . . . . . . . . . 1311
2. Method . . . . . . . . . . . . . . . . . . . . . . . . . . . . . . . . . . . . . . . . . . . . . . . . . . . . . . . . 13122.1. Selection criteria of the studies . . . . . . . . . . . . . . . . . . . . . . . . . . . . . . . . . . . . . . . . . . 13122.2. Search procedure . . . . . . . . . . . . . . . . . . . . . . . . . . . . . . . . . . . . . . . . . . . . . . . . 13122.3. Coding moderator variables . . . . . . . . . . . . . . . . . . . . . . . . . . . . . . . . . . . . . . . . . . . 13132.4. Computation of effect sizes . . . . . . . . . . . . . . . . . . . . . . . . . . . . . . . . . . . . . . . . . . . 13132.5. Statistical analysis . . . . . . . . . . . . . . . . . . . . . . . . . . . . . . . . . . . . . . . . . . . . . . . . 1314
3. Results. . . . . . . . . . . . . . . . . . . . . . . . . . . . . . . . . . . . . . . . . . . . . . . . . . . . . . . . . 13143.1. Distribution of effect sizes . . . . . . . . . . . . . . . . . . . . . . . . . . . . . . . . . . . . . . . . . . . . 13143.2. Publication bias . . . . . . . . . . . . . . . . . . . . . . . . . . . . . . . . . . . . . . . . . . . . . . . . . 13143.3. Type of treatment . . . . . . . . . . . . . . . . . . . . . . . . . . . . . . . . . . . . . . . . . . . . . . . . 1315
sterio de Educación y Ciencia of the Spanish Government and by European Union FEDER founds (Project No
34 968364115.
chez-Meca).
All rights reserved.
.
1311A.I. Rosa-Alcázar et al. / Clinical Psychology Review 28 (2008) 1310–1325
3.4. Other treatment characteristics . . . . . . . . . . . . . . . . . . . . . . . . . . . . . . . . . . . . . . . . . 13173.5. Subject characteristics . . . . . . . . . . . . . . . . . . . . . . . . . . . . . . . . . . . . . . . . . . . . . 13173.6. Methodological characteristics . . . . . . . . . . . . . . . . . . . . . . . . . . . . . . . . . . . . . . . . . . 1319
3.6.1. Controlling for the d index in the pretest . . . . . . . . . . . . . . . . . . . . . . . . . . . . . . . . 13193.7. Extrinsic variables. . . . . . . . . . . . . . . . . . . . . . . . . . . . . . . . . . . . . . . . . . . . . . . . 1320
4. Discussion. . . . . . . . . . . . . . . . . . . . . . . . . . . . . . . . . . . . . . . . . . . . . . . . . . . . . . . 13204.1. Implications for clinical practice . . . . . . . . . . . . . . . . . . . . . . . . . . . . . . . . . . . . . . . . . 13224.2. Implications for future research . . . . . . . . . . . . . . . . . . . . . . . . . . . . . . . . . . . . . . . . . 1322
References⁎ . . . . . . . . . . . . . . . . . . . . . . . . . . . . . . . . . . . . . . . . . . . . . . . . . . . . . . . . . 1323
1. Introduction
Obsessive–compulsive disorder (OCD) is one of the most frequent and serious psychological problems, with prevalence rates ofbetween 1% and 4% (Karno, Golding, Sorenson, & Burnam, 1988). According to the Diagnostic and Statistical Manual of MentalDisorders, DSM-IV-R (American Psychiatric Association, 2000), OCD is characterized by the presence of thoughts, impulses anddisturbing images that cause suffering, annoyance or discomfort, associatedwith repetitive compulsions (behaviors or thoughts) towhich the patient is impelled in response to an obsession, with the aim of reducing the discomfort caused. This disorder is oftenassociated with other psychological disorders that complicate its treatment (e.g., depression, phobias, panic attacks, generalizedanxiety, etc.; cf. Keeley, Storch, Merlo, & Geffken, 2008, for a recent review).
1.1. Psychological treatment of OCD
Following the criteria of the Task Force on Promotion and Dissemination of Psychological Procedures (1995), only exposurewithresponse prevention (ERP) is considered to be an empirically-supported psychological treatment for OCD. Similarly, various meta-analyses (Abramowitz, 1996, 1998; Abramowitz, Franklin, & Foa, 2002; Kobak, Greist, Jefferson, Katzelnick, & Henk, 1998; Sánchez-Meca, Gómez-Conesa, & Méndez, 2003) also indicated that ERP is effective for this problem, even in follow-ups of three years, andinsisted on its particular benefit for the treatment of compulsive rituals (Abramowitz, 2006). Some investigations haveincorporated cognitive components in order to test whether they provide any additional benefit to those of ERP. The cognitivetechniques most used are cognitive restructuring (CR), self-instructional training, rational emotive behavior therapy or Beck'scognitive therapy (Emmelkamp & Beens, 1991; Van Oppen et al., 1995). Several meta-analyses have compared the differentialeffectiveness of ERP, CR, and ERP+CR. For example, Abramowitz et al. (2002) obtained mean effect sizes, in terms of thestandardizedmean difference, of d=1.50,1.19, and 0.99, for ERP, CR, and ERP+CR, respectively. Sánchez-Meca et al. (2003) obtainedmeans, in terms of standardized change scores, of d=1.26,1.53, and 1.75, respectively; and Eddy, Dutra, Bradley, andWesten (2004)obtained standardized change scores of d=1.53, 1.54, and 1.39. Therefore, the results have not been consistent and it has beensuggested that there is a need to carry out controlled studies that enable us to distinguish between the benefits achieved by thecognitive components and those of the behavioral ones.
Since the effectiveness of ERP has been accepted, the research in this field has focused on comparing this effectiveness with thatof other treatments, examining its components separately and studying the benefits of the different techniques of exposure. Foa,Steketee, Grayson, Turner, and Latimer (1984) compared three groups independently: exposure, response prevention, andexposure with response prevention (ERP). They concluded that although the isolated components achieved some symptomreduction (around 25%), it was less than that achieved with the complete treatment. In respect to the comparison betweendifferent types of exposure, the results are not conclusive. On the one hand, Emmelkamp, van Oppen, and van Balkom (2002)indicated that, although the presence of the therapist in exposure is important, there is not enough evidence that this is strictlynecessary. However, the meta-analyses of Abramowitz (1996) and Sánchez-Meca et al. (2003) have shown that therapist-guidedexposure (d=1.58 and 1.36, respectively) is better than therapist-assisted self-exposure (d=0.81 and 0.91, respectively). On theother hand, these same meta-analyses have shown that combining exposure in vivo with exposure in imagination (d=1.46 and1.49, respectively) is better than exposure in vivo alone (d=1.27 and 1.21, respectively). Moreover, although the benefit of familysupport in pediatric OCD has been empirically proven (Barrett, Farrell, Dadds, & Boulter, 2005; Barrett, Healy-Farrell, & March,2004; Storch et al., 2007a,b), the results found with adults are contradictory (e.g., Emmelkamp, de Haan, & Hoogduin, 1990; Mehta,1990). Finally, the comparative studies between-group ERP and individual ERP conclude that both modes are effective, but they donot indicate if one of them ismore so than another (*Fals-Stewart, Marks, & Schafer,1993;McLean et al., 2001;Whittal andMcLean,2002). Treatment characteristics that are currently being researched include the number of sessions, the benefit of imaginalexposure and the use of the telephone and the computer as supports for exposure, amongst others.
1.2. Goals of the current study
The purpose of our study was to analyze the effectiveness of psychological interventions in the treatment of OCD in adults bycarrying out a meta-analysis and contributing the following improvements with respect to the meta-analyses already carried outon this subject. First, the meta-analyzed studies had to include a control group, in order to guarantee the internal validity of the
1312 A.I. Rosa-Alcázar et al. / Clinical Psychology Review 28 (2008) 1310–1325
effect size estimates. This is a characteristic that our meta-analysis shares only with that of Abramowitz et al. (2002). Second, therange of years of inclusion of the studies is more updated, going up to 2006. Themost recentmeta-analyses have included up to theyear 2001 (Abramowitz et al., 2002; Eddy et al., 2004; Sánchez-Meca et al., 2003). Third, in addition to the symptoms of obsessive–compulsive disorder, we have included effect size estimates for other outcome measures, such as social adjustment, generalanxiety, depression and other measures. Only the meta-analyses of Abramowitz (1996), Cox, Swinson, Morrison, and Lee (1993)and Christensen, Hadzi-Pavlovic, Andrews, and Mattick (1987) included general anxiety and depression in addition to themeasures of obsessions and compulsions. Fourth, we applied random- and mixed-effects statistical models, which are currentlyconsidered to be the most appropriate for integrating the results of the studies (cf. e.g., Field, 2001, 2003; Hedges & Vevea, 1998;National Research Council, 1992). These models fit the reality of meta-analytic data more closely than the fixed-effects modelstypically used, in considering that the individual studies do not estimate the same effect in the population, but rather theirdifferential characteristics make them estimate different population effects.1 In fifth place, we have included as a moderatorvariable the standardized mean difference in the pretest, in order to test its possible relationship to the effect sizes in the posttest.None of the previous meta-analyses have applied random- and mixed-effects models, just as they have not used the standardizedmean difference in the pretest as a moderator variable. Finally, we included in our analyses a study of publication bias to test if thiscould be a threat to the validity of our meta-analytic results, for which we used innovative statistical techniques (cf. Rothstein,Sutton, & Borenstein, 2005). Of the previous meta-analyses on the psychological treatment of OCD, only the one by Kobak et al.(1998) addressed publication bias.
2. Method
2.1. Selection criteria of the studies
In order to be included in our meta-analysis, the studies had to fulfill the following selection criteria: (a) the study had to apply apsychological treatment to a sample of adult subjects diagnosed with OCD via an explicit, standardized diagnostic criteria (anyversion of the DSM, the ICD—International Classification of Diseases and Related Health problems—, or other); (b) the study had toinclude a control group (placebo and/or waiting-list); therefore the following designs were all excluded: pretest–posttest one-group designs and N=1 designs;2 (c) the study had to report statistical data for the groups involved in at least the posttest (means,standard deviations, t tests, ANOVAs, etc.); (d) the sample size of each group should not be less than 5 subjects in the posttest;(e) the study had to be carried out or published between 1980 and 2006 and written in English, French or Spanish.
2.2. Search procedure
To select the studies that could fulfill our selection criteria the following databases were consulted: PsycINFO, Medline, theCochrane Library, the Spanish database Psicodoc and the OCD database of the Madison Institute of Medicine. The following keywordswere combined for the electronic searches: (((treatment⁎) or (therap⁎) or (behavio⁎) or (cognitiv⁎) or (program⁎)) in TI) and((obsessive–compulsive) in TI). In addition, the references of 8 meta-analyses previously published on the effectiveness ofpsychological interventions for OCD were reviewed (Abramowitz, 1996, 1997, 1998; Abramowitz et al., 2002; Ball, Baer, & Otto,1996; Cox et al., 1993; Eddy et al., 2004; Sánchez-Meca et al., 2003). Finally, the references of the studies that were located werealso reviewed.
The search produced over 2000 references, of which 19 articles that fulfilled the selection criteria were chosen, enabling us todefine 24 independent comparisons between a treated group and a control group. Although an attempt was made to localizenon-published works, all those selected were studies published in peer-reviewed journals and written in English. The degree ofoverlap of the studies included in our meta-analysis with respect to previous meta-analyses was 0% (Abramowitz, 1998), 5%(Abramowitz, 1996, 1997; Ball et al., 1996; Cox et al., 1993), 20% (Sánchez-Meca et al., 2003), 30% (Eddy et al., 2004), and 40%(Abramowitz et al., 2002).3 Theminor overlap between ourmeta-analysis and the previous ones guarantees the originality of ourresults.
The total sample size of the meta-analysis involved 752 individuals in the posttest, of which 431 subjects formed the 24treatment groups (mean sample size=18 subjects; SD=13.2) and the remaining 321 subjects made up 19 independent controlgroups (mean sample size=17 subjects; SD=14.2). The 24 comparisons represented eight countries distributed through five
1 The consequences of assuming a random-effects model instead of a fixed-effects one concern the interpretation of the results and also the results obtainedthemselves. A meta-analyst that applies a fixed-effects model is assuming that his/her results can only be generalized to an identical population of studies to thaof the individual studies included in the meta-analysis. On the contrary, in a random-effects model the results can be generalized to a wider population of studiesOn the other hand, in a fixed-effects model the error attributed to the effect size estimates is smaller than in a random-effects model, which is why in the firsmodel the confidence intervals are narrower and the statistical tests more liberal than in the second one. The principal consequence of assuming a fixed-effectsmodel when the meta-analytic data come from a random-effects model is that we may attribute more precision to the effect size estimates than is reallyappropriate and that, in addition, we may find statistically significant relationships between variables that are actually spurious (cf. Field, 2003; Hedges andVevea, 1998; Marín-Martínez and Sánchez-Meca, 1998; National Research Council, 1992; Sánchez-Meca and Marín-Martínez, 1998, 2008).
2 The reason for requiring a control group in the studies was to assure the calculation of the same effect-size index in all of them: the standardized meandifference between the means of the treated and the control group. Mixing different designs in the same meta-analysis is unadvisable, as it involves applyingeffect-size indices that estimate different parametric effects.
3 It was not possible to calculate the degree of overlap with the meta-analyses of Christensen et al. (1987) and Kobak et al. (1998) as these two studies did noreport the list of meta-analyzed studies.
t.t
t

1313A.I. Rosa-Alcázar et al. / Clinical Psychology Review 28 (2008) 1310–1325
continents: Asia (1 comparison carried out in Japan, 4.1%), Australia (2 comparisons, 8.4%), Europe (7 comparisons—29.2%—carriedout in Holland—2 comparisons—, Norway—2 comparisons—, and UK—3 comparisons—), North America (13 comparisons—54.2%—carried out in Canada—7 comparisons— and USA—6 comparisons—), and South America (1 comparison carried out in Brazil, 4.1%).
2.3. Coding moderator variables
In order to analyze the heterogeneity between the results of the studies, the characteristics that could be related with the effectsizes were coded. The moderator variables were classified as treatment, subject, methodological and extrinsic variables.
The treatment characteristics coded were: (a) the type of intervention that the treated group received (behavioral versusnonbehavioral therapy); (b) the technique of behavioral or cognitive behavioral intervention (reducing psychophysiologicalarousal, exposure, response prevention, systematic desensitization, anxietymanagement training, cognitive restructuring, etc.); (c)the type of exposure (in vivo, in imagination, and mixed); (d) the mode of application of the exposure (therapist-guided, self-controlled exposure, therapist-assisted self-exposure and mixed); (e) the duration of the treatment (in weeks); (f) the averageintensity of the treatment (number of weekly hours of treatment); (g) the magnitude of the treatment (total number of hoursreceived by each subject); (h) the homogeneity of the treatment (whether all patients received the treatment in the sameconditions); (i) the inclusion of a follow-up program; (j) the utilization of external agents to the therapeutic group (whether familyor other); (k) the mode of training (group, individual and mixed); (l) the mode of intervention (direct, indirect and mixed), and(m) the training of the therapist (psychologist, psychiatrist).
The subject characteristics coded for the samples of each study were: (a) the average age of the sample (in years); (b) the genderof the sample (percentage of males); (c) the mean duration of OCD symptoms (average in years of the group); (d) whetherindividuals had received any previous treatment (N50% versus b50% of the sample), and (e) the presence of comorbid disorders(N50% versus b50% of the sample).
Themethodological characteristicswere coded as follows: (a) design type (experimental versus quasi-experimental); (b) type ofcontrol group (active versus non-active); (c) control of consumption of psychodrugs by the subjects throughout the research;(d) attrition in the posttest of the treated group and the control group, global attrition for both groups and differential attritionbetween the two groups; (e) the d index in the pretest, and (f) the methodological quality of the study (on a scale from 0 to 5points).4
Finally, four extrinsic characteristics were coded: (a) publication year of the study; (b) the publication source (published versusunpublished); (c) the discipline of the first author (psychologist or psychiatrist), and (d) the country and continent in which thestudy was carried out.
In order to assure the maximum possible objectivity, we produced a codebook in which we specified the standards followed incoding each of the characteristics of the studies.5 The coding of some characteristics required the adoption of complex decisionjudgments. In order to assess the appropriateness of these judgments, a coding reliability studywas carried out via the analysis of arandom sample of the studies (20% of the total) by two independent coders. The agreement level attained for all the codedvariables was highly satisfactory, on average, around 78%. The inconsistencies between the coders were resolved by consensus andthe codebook was corrected when the inconsistencies were due to an error in the book.
2.4. Computation of effect sizes
The standardized mean difference, d, was used as the effect size index. It was defined as the difference between the means ofthe treated group and the control group, both taken in the posttest, divided by a pooled estimate of the within-study standarddeviation, S, corrected by the factor c(m) for small samples (Hedges and Olkin, 1985): d=c(m)(yE− yC) /S. Positive values of dindicated a favorable outcome to the treatment. When the study did not report means and standard deviations of the groups, theprocedures developed by Glass, McGaw, and Smith (1981; cf. also Lipsey & Wilson, 2001) were used to calculate the d index fromthe results of t tests, ANOVAs, etc. When the dependent variable was dichotomic or had been dichotomized, formulaewere appliedto obtain an estimate of the effect size in terms of the d index (cf. Haddock, Rindskopf, & Shadish, 1998; Sánchez-Meca, Marín-Martínez, & Chacón-Moscoso, 2003).
In each study a different d index was calculated for the outcome measures of obsessions and compulsions, anxiety, depression,social adjustment, and othermeasures and, in turn, for two types of report: self-reports and clinician assessments. Therefore, in thesame study we could calculate up to 5 (outcome measures)×2 (types of report)=10 d indices. In addition to these, a mean d indexwas also calculated for each of the two types of report (self-reports and clinician assessments) and for each of the five outcomemeasures. Finally, the mean d index of all the types of reports and measures was obtained. Therefore this made a total of 18 dindices calculated in the posttest for each study.
In addition, the standardized mean difference between the two groups in the pretest was calculated, with the aim of usingthis index as a methodological moderator variable that would allow us to check if was related with the d index in theposttest. Therefore in each study that reported data from the pretest, a total of up to 18 d indices could be calculated in thepretest.
4 The items that were used to evaluate the methodological quality concerned attrition, sample size, the type of control group, random versus nonrandomassignment of subjects to groups, and the use of intent-to-treat analysis as opposed to completer analysis.
5 The codebook can be obtained from the corresponding author.

1314 A.I. Rosa-Alcázar et al. / Clinical Psychology Review 28 (2008) 1310–1325
A review of the measurement instruments applied in the meta-analyzed studies revealed that those most frequently used toassess obsession and compulsion symptoms were the Yale–Brown Obsessive–Compulsive Scale (Y-BOCS; Goodman et al., 1989),the Padua Inventory (Sanavio, 1988), and the Maudsley Obsessive–Compulsive Inventory (MOCI; Hodgson & Rachman, 1977). Themost frequently used instruments to assess anxiety, depression, and social adjustment were, respectively, the State-Trait AnxietyInventory (STAI; Spielberger, Gorsuch, & Lushene,1970), the Beck Depression Inventory (BDI; Beck, Rush, Shaw, & Emery,1979), andthe Work and Social Adjustment Scale (WSAS; Marks, 1986). Finally, other measurement instruments used to assess otherpsychological constructs were the Clinical Global Impression scale (CGI; Guy, 1976) and the Symptom Checklist (SCL-90; Derogatis,1977).
In order to check the reliability of the effect size calculations, two independent coders performed the calculations for a randomsample of the studies. The results were highly satisfactory, obtaining Pearson correlations between the d indices obtained by thetwo coders that reached a mean correlation of 0.95.
2.5. Statistical analysis
Separate meta-analyses were carried out for each d index according to the outcome measure and type of report in order toavoid problems of statistical dependence. In each meta-analysis a random-effects model was applied according to which the dindex in the posttest was weighted by its inverse variance, this being the sum of the within-study variance and an estimate of thebetween-studies variance. The process of analysis consisted of calculating themean effect sizewith its 95% confidence interval, theheterogeneity test, Q, and the I2 index to evaluate the degree of homogeneity of the effect sizes around the average effect (Higgins& Thompson, 2002; Huedo-Medina, Sánchez-Meca, Marín-Martínez, & Botella, 2006). Once the existence of heterogeneitybetween the effect sizes was proven, mixed-effects models were applied to test the influence of the moderator variables. Theseconsisted of ANOVAs for the qualitative moderator variables and simple regression analysis for the continuos moderator variablesall by weighted least squares (Cooper & Hedges, 1994; Hedges & Olkin, 1985). Finally, and given that our meta-analysis did notinclude any unpublished studies, a study of publication bias was carried out (Rothstein, Sutton, & Borenstein, 2005). The statisticalanalyses were performed using the SPSS macros elaborated by David B. Wilson.6
3. Results
3.1. Distribution of effect sizes
For each combination between outcomemeasure (obsessions and compulsions, general anxiety, depression, social adjustment,and other measures) and type of report (self-reports and clinician assessments) a separate meta-analysis was carried out in orderto obtain an estimate of themean effect size together with a 95% confidence interval, the heterogeneity Q statistic, and the I2 index.In addition, separate meta-analyses were also carried out for each type of report (by combining all the outcome measures) and foreach outcome measure (by combining the two types of report), as well as for the combination of all of the outcome measures andtypes of reports. The results are shown in Table 1. As we can see in this table, the global result (by combining all of the outcomemeasures and types of report) for the 24 comparisons between a treated group and a control group produced a statisticallysignificant mean effect size, d+=0.918 (95% CI: 0.712, 1.124), which can be considered to be of high magnitude in favor of thepsychological treatments of OCD according to the classification proposed by Cohen (1988).
As was to be expected, the best results were obtained with the measures of obsessions and compulsions, d+=1.075 (95% CI:0.843, 1.306), followed by “other outcome measures”, d+=0.844 (95% CI: 0.407, 1.280), social adjustment, d+=0.757 (95% CI: 0.348,1.166), general anxiety, d+=0.674 (95% CI: 0.333, 1.014), and depression, d+=0.580 (95% CI: 0.261, 0.899). Self-reports showed asmaller mean effect size than that of clinician assessments when measuring obsession and compulsion symptoms (self-reports:d+=0.725; clinicians: d+=1.175), social adjustment (self-reports: d+=0.776; clinicians: d+=0.806), and ‘other outcome measures’(self-reports: d+=0.312; clinicians: d+=1.199). On the contrary, the effect sizes of self-reports were higher than those of cliniciansfor depression measures (self-reports: d+=0.638; clinicians: d+=0.099) and general anxiety (self-reports: d+=0.907; clinicians:d+=0.036).
When the heterogeneity Q test is statistically significant (pb .05) and the I2 index is at least 50%, then we can assume that theindividual effect sizes are heterogeneous. As Table 1 shows, this result was obtained for the symptoms of obsessions andcompulsions (I2=57%), depression (I2=70%), social adjustment (I2=63.7%), and other outcome measures (I2=75.3%), whereasgeneral anxiety measures approached statistical significance (p= .056; I2=45.6%). The presence of high heterogeneity justified thesearch for study characteristics that could explain the variability in the effect sizes. To this end, ANOVAs and simple regressionswere performed assuming a mixed-effects model. Before presenting the results of these analyses however, a study of publicationbias is outlined in the next section.
3.2. Publication bias
Since all the studies included in the meta-analysis were published papers, we tested whether publication bias against nullresults could be a bias source in the effect size estimates obtained in our meta-analysis. In order to test this, two complementary
6 These macros can be obtained from the web address: http://mason.gmu.edu/~dwilsonb/ma.html.

Table 1Summary results for the effect size as a function of the outcome measure and type of measurement instrument
Outcome/report type k d+ (95% C.I.) Q I2
Obsessions/compulsionsSelf-reports 9 0.725 (0.345; 1.104) 16.271⁎ 50.8Clinicians 22 1.175 (0.910; 1.441) 59.167⁎⁎ 64.5Combined 24 1.075 (0.843; 1.306) 53.452⁎⁎ 57.0
General anxietySelf-reports 7 0.907 (0.630; 1.185) 4.330 0.0Clinicians 3 0.036 (−0.637; 0.709) 3.792 47.3Combined 10 0.674 (0.333; 1.014) 16.548a 45.6
DepressionSelf-reports 14 0.638 (0.293; 0.982) 45.553⁎⁎ 71.5Clinicians 3 0.099 (−0.629; 0.827) 4.412 54.7Combined 16 0.580 (0.261; 0.899) 49.607⁎⁎ 70.0
Social adjustmentSelf-reports 5 0.776 (0.207; 1.345) 16.216⁎⁎ 75.3Clinicians 2 0.806 (0.300; 1.311) 0.002 0.0Combined 7 0.757 (0.348; 1.166) 16.534⁎ 63.7
Other outcome measuresSelf-reports 3 0.312 (−0.086; 0.710) 0.874 0.0Clinicans 5 1.199 (0.565; 1.833) 23.646⁎⁎ 83.1Combined 8 0.844 (0.407; 1.280) 28.347⁎⁎ 75.3
Global resultsSelf-reports 17 0.654 (0.419; 0.890) 31.489⁎ 49.2Clinicians 22 1.084 (0.844; 1.323) 49.190⁎⁎ 57.3Total (self-reports+clinicians) 24 0.918 (0.712; 1.124) 44.298⁎⁎ 48.1
⁎ pb .05. ⁎⁎ pb .01. k: number of studies. d+: weighted mean effect size. 95% C.I.: 95% confidence interval around the mean effect size. Q: heterogeneity Q statistic.I2: I2 heterogeneity index (%). a p= .056.
1315A.I. Rosa-Alcázar et al. / Clinical Psychology Review 28 (2008) 1310–1325
analyses were carried out. First, we applied the Egger test,7 obtaining a non-statistically significant result for the intercept of theregression model of precision on the effect size for anxiety measures [Intercept=−0.677; T(8)=−0.394, p= .704], depression[Intercept=1.717; T(14)=1.523, p= .150], social adjustment [Intercept=1.430; T(5)=0.990, p= .367], and other outcome measures[Intercept=3.064; T(6) =1.861, p= .112]. Only in the case of obsessions and compulsions did the intercept reach a statisticallysignificant result [Intercept=1.802; T(22)=2.282, p= .032]. Second, we calculated the Fail-Safe N, Nfs (Becker, 2005), for the meaneffect size resulting from averaging all of the outcome measures (d+=0.918) and for obsession and compulsion symptoms(d+=1.075). The Nfs indices were 160 and 844 respectively, meaning that, in order for the mean effect sizes to be zero, there shouldbe, respectively, about 160 and 844 studies in the file drawers of the journals with a null effect and not recovered in our meta-analysis. Therefore, taking these results into account and on a reasonable basis, we can discard publication bias as a serious threatto the validity of our meta-analytic results.
3.3. Type of treatment
Although our meta-analysis was open to the inclusion of empirical studies that apply any type of psychological intervention, ofthe 24 comparisons selected only one of them (*Cordiolli et al., 2003) incorporated a component of external treatment to thebehavioral or cognitive–behavioral models, specifically group dynamics. The most frequent techniques of psychologicalintervention were exposure with response prevention (ERP, 21 comparisons or 87.5%) and cognitive restructuring (CR, 11comparisons, 45.8%). Of the various modes of exposure, the most frequent were those based on exposure in vivo, with 13comparisons (54.2%), followed by 7 comparisons (29.2%) that combined exposure in vivo with exposure in imagination.Furthermore, with respect to the type of contact between the therapist and the patient, the studies applied therapist-guidedexposure, with 17 comparisons (70.8%) and, to a lesser extent, therapist-assisted self-exposure, with only 3 comparisons (12.5%).
The differential analysis of the types of treatment was carried out on the effect sizes obtained with the combined measures ofobsessions and compulsions (self-reports and clinician assessments), since these are the most important symptoms in OCD.However, since OCD is often accompanied by depression, we also analyzed the differential effects of the techniques of interventionon depressive symptoms.
As the most frequent techniques of intervention were ERP and CR, alone or in combination, the comparisons were classified inthree categories: ERP alone (13 comparisons), CR alone (3 comparisons) and ERP and CR combined (8 comparisons). Fig. 1 presentsa forest plot of the effect estimates grouped by the type of treatment applied, and Table 2 shows the weighted ANOVA of these
7 The ‘Egger test’ is an unweighted regression which consists of taking the precision of each study as the independent variable (precision being defined as theinverse of the standard error of each effect size) and the effect size divided by its standard error as the dependent variable. When the t-test for the hypothesis ofan intercept equal to zero shows a non-statistically significant result, then we can assume that publication bias is not a threat against the validity of the overalleffect size (Sterne and Egger, 2005).

Table 2Results of comparing different treatment combinations on the effect sizes for obsession and compulsion symptoms and for depression measures
Moderator variable/outcome measure 95% C. I. ANOVA results
k d+ dl du
Treatment combination/obsessions–compulsionsExposure+RP (ERP) 13 1.127 0.802 1.452 QB(2)=0.216, p= .897CR 3 1.090 0.421 1.760 QW(21)=30.125, p= .089ERP+CR 8 0.998 0.559 1.437 ω2=0.0
Type of exposure/obsessions–compulsions QB(1)=1.306, p= .253In vivo exposure 13 0.976 0.644 1.307 QW(18)=26.739, p= .084Mixed exposure 7 1.303 0.850 1.756 ω2=0.0
Mode of exposure/obsessions–compulsions QB(1)=3.712, p= .054Therapist-guided exposure 17 1.217 0.910 1.524 QW(18)=23.508 p= .172Therapist-assisted self-expos. 3 0.480 −0.204 1.164 ω2= .084
Treatment combination/depressionExposure+RP (ERP) 10 0.526 0.108 0.943 QB(2)=0.715, p= .699CR 2 0.418 −0.521 1.357 QW(13)=17.433 p= .180ERP+CR 4 0.838 0.148 1.528 ω2=0.0
Type of exposure/depression QB(1)=6.964, p= .008In vivo exposure 9 0.299 −0.066 0.665 QW(12)=16.088 p= .187Mixed exposure 5 1.142 0.634 1.649 ω2=0.230
Mode of exposure/depression QB(1)=2.153, p= .142Therapist-guided exposure 11 0.781 0.352 1.209 QW(11)=13.969 p= .235Therapist-assisted self-expos. 2 −0.006 −0.965 0.953 ω2=0.051
ERP: exposure with response prevention. CR: cognitive restructuring. k: number of studies. d+: Mean effect size. 95% C.I.: 95% confidence interval. dl and du: lowerand upper confidence limits. QB: between-categories Q statistic. p: probability level. QW: within-categories Q statistic. ω2: proportion of variance accounted for.
Fig. 1. Forest plot of d indices for obsession and compulsion symptoms as a function of the type of treatment applied. ERP: Exposure with response prevention. CRCognitive restructuring. d: standardized mean difference. SE: Standard error of d index.
1316 A.I. Rosa-Alcázar et al. / Clinical Psychology Review 28 (2008) 1310–1325
:
three types of treatment on the effect sizes for the measures of obsessions and compulsions, which did not show statisticallysignificant differences [QB(2)=0.216, p=.897; ω2=0.0]. ERP (d+=1.127) and CR (d+=1.090) proved to be highly effective in reducingobsessive–compulsive symptoms, their average effect being clearly higher than the value d=0.8 considered to be of high effectmagnitude (Cohen, 1988). The combined treatment of ERP and CR (d+=0.998) was also highly effective, but it did not improve thebenefits that each technique obtained alone; in fact, the mean effect of the combined treatment was slightly lower than those ofthe two techniques separately.

1317A.I. Rosa-Alcázar et al. / Clinical Psychology Review 28 (2008) 1310–1325
Focusing our attention on the 20 comparisons that reported sufficient information to enable us to identify the type of exposureapplied (Table 2), there were no statistically significant differences found between the 13 comparisons that applied exposure invivo (d+=0.976) and the 7 comparisons that applied a mixture of exposure in vivo and in imagination (d+=1.303) [QB(1)=1.306,p= .253; ω2=0.0]. However, when comparing the 17 comparisons that applied therapist-guided exposure (d+=1.217) with the 3comparisons that applied therapist-assisted self-exposure (d+=0.480), the difference between the two types of exposure wasmarginally significant and had 8.4% of variance accounted for [QB(1)=3.712, p=.057; ω2= .084]. It seems then, that there is clearevidence that therapist-supervised exposure is more effective than assisted self-exposure. Furthermore, the latter techniqueobtained a mean effect size whose confidence interval contained the null effect (95% CI: −0.204 and 1.164), so its effectiveness wasnot proven, possibly due to the low number of comparisons (only 3).
Although our analyses focused on the measures of obsessions and compulsions, in Table 2 we also show the comparisonbetween the different treatments with respect to the symptoms of depression. As with obsessions and compulsions, no statisticallysignificant differences were found with regards to the reduction of depressive symptoms between ERP alone (d+=0.526), CR alone(d+ 0.418) and ERP with CR (d+=0.838), even though the combination of ERP and CR seemed to present a higher mean effect sizethan that obtained for the two techniques separately [QB(2)=0.715, p= .699; ω2=0.0]. Furthermore, the mean effect size for CRalone was not significantly different from 0 (95% CI: −0.521 and 1.357), although this could be due to the low number ofcomparisons (only 2). With regards to the types of exposure, mixed exposure (d+=1.142) proved to bemore effective than exposurein vivo (d+=0.299), the latter not seeming able to significantly decrease depressive symptoms (95% CI: −0.066 and 0.665). Althoughthe superiority of mixed exposure over exposure in vivo on the symptoms of depression coincided with that obtained for themeasures of obsessions and compulsions, in the case of depression the difference was statistically significant and had 23% ofvariance accounted for [QB(1)=6.964, p= .008; ω2= .230]. Finally, just as for the symptoms of obsessions and compulsions,therapist-guided exposure (d+=0.781) showed a higher mean effect size than therapist-assisted self-exposure (d+=−0.006) for thesymptoms of depression, but in this case the difference was not statistically significant [QB(1)=2.153, p=.142; ω2= .051].
3.4. Other treatment characteristics
Table 3 shows the results of the ANOVAs for other moderator variables related with the treatment characteristics on themeasuresof obsessions and compulsions (homogeneity of the treatment, follow-up program, external agents, mode of intervention, type oftraining, and therapist's training). Table 5 shows the simple regression analyses for three continuous moderator variables relatedwith the treatment: treatment duration (in weeks), treatment intensity (number of hours per week), and treatment magnitude(total number of hours). The only characteristic that had a marginally significant association with the effect size was the mode ofintervention (direct versus indirect intervention), direct interventions (d+=1.214) resulting more effective than indirect ones(d+=0.688), and showing a noteworthy percentage of variance accounted for of 13.8% [QB(1)=6.365, p=.056; ω2=.138] (see Table 3).
3.5. Subject characteristics
Table 4 shows the ANOVAs applied to two characteristics of the patient samples to examine their relationship with the effectsize: the presence versus absence of comorbidity in the patients and whether they had received previous treatment (in both cases
Table 3Results of analyzing the influence of qualitative moderator variables related with the treatment implementation on the effect sizes for obsession and compulsionsymptoms
Moderator variable 95% C. I. ANOVA results
k d+ dl du
Homogeneity of the treatment QB(1)=0.016, p= .901Homogeneous treatment 23 1.081 0.839 1.323 QW(22)=31.480, p= .087Non-homogeneous treatment 1 1.007 −0.132 2.146 ω2=0.0
Follow-up program? QB(1)=0.111, p= .739Yes 5 0.990 0.425 1.554 QW(22)=31.568, p= .085No 19 1.096 0.837 1.354 ω2=0.0
External agents? QB(1)=1.116, p= .291Yes 2 0.698 −0.053 1.449 QW(22)=29.556, p= .130No 22 1.125 0.870 1.380 ω2=0.0
Mode of intervention QB(1)=6.365, p= .056Indirect intervention 5 0.688 0.226 1.150 QW(21)=28.536, p= .126Direct intervention 18 1.214 0.937 1.490 ω2= .138
Type of training QB(2)=0.686, p= .710Group training 6 1.079 0.651 1.506 QW(20)=29.015, p= .087Individual training 14 0.969 0.661 1.277 ω2=0.0Mixed training 3 1.257 0.625 1.889
Therapists' training QB(1)=0.415, p= .519Psychology 12 1.263 0.889 1.636 QW(15)=21.058, p= .135Psychiatry 5 1.047 0.507 1.587 ω2=0.0
k: number of studies. d+: Mean effect size. 95% C.I.: 95% confidence interval. dl and du: lower and upper confidence limits. QB: between-categories Q statistic. p:probability level. QW: within-categories Q statistic. ω2: proportion of variance accounted for.
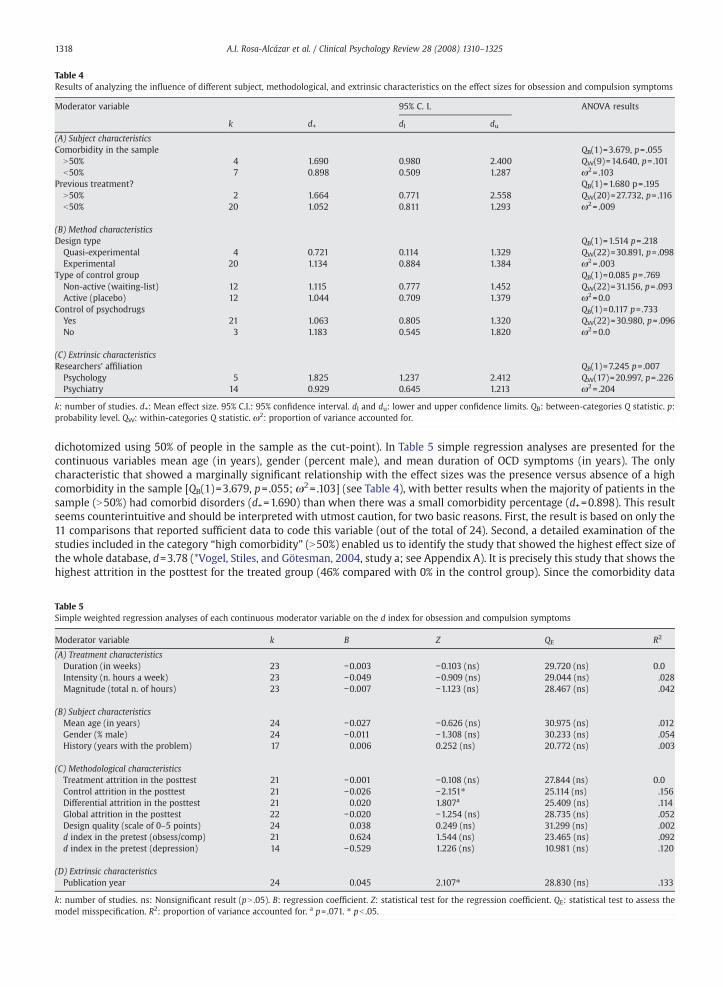
Table 4Results of analyzing the influence of different subject, methodological, and extrinsic characteristics on the effect sizes for obsession and compulsion symptoms
Moderator variable 95% C. I. ANOVA results
k d+ dl du
(A) Subject characteristicsComorbidity in the sample QB(1)=3.679, p= .055
N50% 4 1.690 0.980 2.400 QW(9)=14.640, p= .101b50% 7 0.898 0.509 1.287 ω2= .103
Previous treatment? QB(1)=1.680 p= .195N50% 2 1.664 0.771 2.558 QW(20)=27.732, p= .116b50% 20 1.052 0.811 1.293 ω2= .009
(B) Method characteristicsDesign type QB(1)=1.514 p= .218
Quasi-experimental 4 0.721 0.114 1.329 QW(22)=30.891, p= .098Experimental 20 1.134 0.884 1.384 ω2= .003
Type of control group QB(1)=0.085 p= .769Non-active (waiting-list) 12 1.115 0.777 1.452 QW(22)=31.156, p= .093Active (placebo) 12 1.044 0.709 1.379 ω2=0.0
Control of psychodrugs QB(1)=0.117 p= .733Yes 21 1.063 0.805 1.320 QW(22)=30.980, p= .096No 3 1.183 0.545 1.820 ω2=0.0
(C) Extrinsic characteristicsResearchers' affiliation QB(1)=7.245 p= .007
Psychology 5 1.825 1.237 2.412 QW(17)=20.997, p= .226Psychiatry 14 0.929 0.645 1.213 ω2= .204
k: number of studies. d+: Mean effect size. 95% C.I.: 95% confidence interval. dl and du: lower and upper confidence limits. QB: between-categories Q statistic. p:probability level. QW: within-categories Q statistic. ω2: proportion of variance accounted for.
1318 A.I. Rosa-Alcázar et al. / Clinical Psychology Review 28 (2008) 1310–1325
dichotomized using 50% of people in the sample as the cut-point). In Table 5 simple regression analyses are presented for thecontinuous variables mean age (in years), gender (percent male), and mean duration of OCD symptoms (in years). The onlycharacteristic that showed a marginally significant relationship with the effect sizes was the presence versus absence of a highcomorbidity in the sample [QB(1)=3.679, p=.055; ω2= .103] (see Table 4), with better results when the majority of patients in thesample (N50%) had comorbid disorders (d+=1.690) than when there was a small comorbidity percentage (d+=0.898). This resultseems counterintuitive and should be interpreted with utmost caution, for two basic reasons. First, the result is based on only the11 comparisons that reported sufficient data to code this variable (out of the total of 24). Second, a detailed examination of thestudies included in the category “high comorbidity” (N50%) enabled us to identify the study that showed the highest effect size ofthe whole database, d=3.78 (*Vogel, Stiles, and Götesman, 2004, study a; see Appendix A). It is precisely this study that shows thehighest attrition in the posttest for the treated group (46% compared with 0% in the control group). Since the comorbidity data
Table 5Simple weighted regression analyses of each continuous moderator variable on the d index for obsession and compulsion symptoms
Moderator variable k B Z QE R2
(A) Treatment characteristicsDuration (in weeks) 23 −0.003 −0.103 (ns) 29.720 (ns) 0.0Intensity (n. hours a week) 23 −0.049 −0.909 (ns) 29.044 (ns) .028Magnitude (total n. of hours) 23 −0.007 −1.123 (ns) 28.467 (ns) .042
(B) Subject characteristicsMean age (in years) 24 −0.027 −0.626 (ns) 30.975 (ns) .012Gender (% male) 24 −0.011 −1.308 (ns) 30.233 (ns) .054History (years with the problem) 17 0.006 0.252 (ns) 20.772 (ns) .003
(C) Methodological characteristicsTreatment attrition in the posttest 21 −0.001 −0.108 (ns) 27.844 (ns) 0.0Control attrition in the posttest 21 −0.026 −2.151⁎ 25.114 (ns) .156Differential attrition in the posttest 21 0.020 1.807a 25.409 (ns) .114Global attrition in the posttest 22 −0.020 −1.254 (ns) 28.735 (ns) .052Design quality (scale of 0–5 points) 24 0.038 0.249 (ns) 31.299 (ns) .002d index in the pretest (obsess/comp) 21 0.624 1.544 (ns) 23.465 (ns) .092d index in the pretest (depression) 14 −0.529 1.226 (ns) 10.981 (ns) .120
(D) Extrinsic characteristicsPublication year 24 0.045 2.107⁎ 28.830 (ns) .133
k: number of studies. ns: Nonsignificant result (pN .05). B: regression coefficient. Z: statistical test for the regression coefficient. QE: statistical test to assess themodel misspecification. R2: proportion of variance accounted for. a p= .071. ⁎ pb .05.

1319A.I. Rosa-Alcázar et al. / Clinical Psychology Review 28 (2008) 1310–1325
reported in the study referred to the pretest, the high attrition suffered between the pretest and the posttest may have affected thereal percentage of patients with comorbidity in the posttest. It is reasonable to assume that the majority of the patients thatabandoned the treatment were those that had comorbid disorders and, consequently, more difficulties in remaining on theprogram. For this reason we carried out a sensitivity analysis which consisted of eliminating the aforementioned study, obtainingin this case non-statistically significant differences between the mean effect sizes for high (d+=1.295) and low comorbidity(d+=0.893) [QB(1)=1.071, p= .301; ω2=0.0].
3.6. Methodological characteristics
The analysis of the possible influence of the methodological characteristics of the studies plays a fundamental role in meta-analysis, since it allows us to explore the presence of bias in the effect size estimates. Table 4 shows the ANOVAs of three qualitativemethodological characteristics: the design type (experimental versus quasi-experimental), the type of control group (active versusnon-active), and the control of psychodrugs during the treatment. In Table 5 simple regression analyses are presented for thecontinuous methodological variables treatment group attrition, control group attrition, global attrition, and differential attrition inthe posttest, as well as the design quality (on a scale of 0 to 5 points) and the d index in the pretest for obsession and compulsionsymptoms and for depression measures.
Twenty of the 24 comparisons randomly assigned the subjects to the groups, whereas only 4 comparisons applied a non-equivalent pretest–posttest control group design. Experimental comparisons obtained a mean effect size (d+=1.134) that wasslightly higher than that of quasi-experimental comparisons (d+=0.721), but the difference between them was not statisticallysignificant [QB(1)=1.514, p= .218; ω2= .003] (see Table 4).
The type of control group did not reach statistically significant differences either [QB(1)=0.085, p= .769; ω2=0.0], the meaneffect size for the comparisons that used an active control group (psychological and or pharmacological placebo) being very similarto that in the studies which used a non-active, waiting-list control group (dActive=1.044 and dNon-active=1.115, respectively). Anapproximate estimate of the non-specific effects of psychological treatment for OCD, dNon-specific, can be obtained by calculating thedifference between the mean d indices for the two types of control groups: dNon-specific=dNon-active−dActive=1.115–1.044=0.071. A dindex of 0.071 reveals that psychological treatment for OCD has non-specific effects with a practically negligible relevance.
Other methodological variables such as the control of psychodrugs during the treatment (ω2=0.0) and the design quality(R2= .002) showed a no statistically significant relationship with effect size, both with practically null proportions of varianceaccounted for (see Tables 4 and 5, respectively). The onlymethodological variables that showed statistically significant associationswith effect size were the control group attrition and the differential attrition between the treatment and the control groups in theposttest (see Table 5). In particular, the control group attrition had a negative relationship with effect size (B=−0.026; Z=−2.151,pb .05; R2= .156); that is, the larger the attrition in the control group the lower the effect size. The differential attrition between thetreatment and the control groups showed a positive, marginally significant relationship with the effect size (B=0.020; Z=1.807,p= .071; R2= .114). Since the differential attrition was calculated as the difference between the attrition of the treated group minusthat of the control group, the existence of a positive relationship between this variable and the effect size shows that the higher theattrition of the treated group in comparison with the control group the more the effect size increased. Nevertheless, a sensitivityanalysis revealed that once the study by *Vogel et al. (2004, study a) was deleted, which had a high differential attrition (46% in thetreated group compared with 0% in the control group), the relationship between differential attrition and effect size disappeared(p= .655; R2= .009).
3.6.1. Controlling for the d index in the pretestThe d values in the posttest can provide a biased estimate of the treatment effect if the two groups were not equated in the
pretest with regards to the dependent variable(s). This can happen even when studies apply an experimental design (i.e., randomassignment of subjects to the groups) if the sample sizes are small (nb30 subjects per group) and/or there is differential attrition. Away of testing whether the studies examined had equated the dependent variables in the treated and control groups in the pretestconsists of calculating the d index, defined as the difference between the means of the two groups in the pretest divided by apooled estimate of the standard deviation.
Table 6 shows themean d indices in the pretest for the different outcomemeasures, as well as the heterogeneity Q tests and theI2 indices. As Table 6 shows, for all the outcome measures the mean d index was close to the value zero and the corresponding
Table 6Summary results for the d index in the pretest for the different outcome measures (combining self-reports and clinician assessments)
Outcome measure k d+ (95% C.I.) Q a I2
Obsessions and compulsions 20 0.006 (−0.127; 0.138) 13.432 0.0General anxiety 6 0.096 (−0.194; 0.385) 5.053 1.0Depression 13 −0.078 (−0.246; 0.091) 12.750 5.9Social adjustment 7 0.118 (−0.072; 0.307) 3.009 0.0Other outcome measures 8 0.059 (−0.114; 0.231) 2.412 0.0Global results 20 0.005 (−0.127; 0.138) 10.507 0.0
a All the Q statistics were not statistically significant (pN .05). k: number of studies. d+: weighted mean d index in the pretest. 95% C.I.: 95% confidence intervalaround the mean d index. Q: heterogeneity Q statistic. I2: I2 heterogeneity index (%).

1320 A.I. Rosa-Alcázar et al. / Clinical Psychology Review 28 (2008) 1310–1325
confidence intervals reflected an absence of statistically significant differences between the means of the treated and controlgroups. Therefore we can confirm that the examined studies were able to equate the treatment and control groups in the pretestwith regards to the dependent variables. Furthermore, the analysis of the heterogeneity of the d indices in the pretest proved thatthese were homogeneous around the mean effect for all the outcome measures, since none of the Q tests were statisticallysignificant (pN .05) and the I2 indices were practically null. For all of these reasons, we can conclude that the studies included in themeta-analysis controlled for the starting point of the two groups in the dependent variables reasonably well.
Nevertheless, there was still the possibility that there was a relationship between the d index in the pretest and the d index inthe posttest of the studies. In order to examine this possibility, we carried out simple weighted regression analyses, taking the dindex in the pretest as a predictor variable and the d index in the posttest (the effect size) as a dependent variable. Table 5 showsthe results for the two most relevant outcome measures: obsession and compulsion symptoms and depression measures. In bothcases the d index in the pretest showed a slight, but relevant, proportion of variance accounted for (R2= .092 and .120, respectively),although not reaching statistical significance (pN .05). The positive sign of the regression coefficient for obsessions andcompulsions means that the better the subjects of the treated group in the pretest with respect to those of the control group themore favorable the d index in the posttest for the treated group. Quite the contrary happened with depression symptoms: thenegative sign of the regression coefficient means that the worse the subjects of the treated group in the pretest in comparison tothose of the control group, the more favorable the d index in the posttest for the treated group.
Focusing our attention on the symptoms of obsessions and compulsions, and since the d index in the pretest showed aconsiderable proportion of variance explained of .092, (although not statistically significant), the average effect sizes obtained forERP and CR shown in Table 2 could be biased due to the relationship that exists between the d indices of the pretest and theposttest. In order to control for the influence of the d index in the pretest we applied a multiple regression model inwhich we tookthe d index in the posttest as the dependent variable andwe defined three predictor variables: the d index in the pretest (to controlfor its influence) and two dummy variables that indicated the presence versus absence (1, presence; 0, absence) of ERP and CR,respectively. The resulting regression model did not reach statistical significance and the proportion of variance explained wasirrelevant [QR(3)=2.477, p=.479; R2= .103]. Furthermore, none of the three predictors were statistically significant (pN .05),indicating that once the influence of the d index was controlled for in the pretest, ERP and CR did not show a differential effect inthe treatment of OCD. Applying the predictivemodel to obtain amean estimate of the effects of applying ERP and CR separately andERP together with CR, we obtained predicted d indices of 1.073,1.069 and 0.963, respectively.8 These estimates were very similar tothe mean effects obtained with the ANOVA shown in Table 2: d+=1.127, 1.090 and 0.998 for ERP alone, CR alone, and ERP with CR,respectively. Therefore, all the analyses carried out led us to conclude that ERP and CR are equally effective in the treatment of OCDand that the combination of the two techniques did not seem to produce an improvement in effectiveness over and above thatshowed by the two techniques separately.
3.7. Extrinsic variables
Finally, we tested the relationship between the effect size for obsessions and compulsions and two extrinsic variables: thediscipline of the principal researcher of each study, distinguishing between psychologists and psychiatrists (Table 4), and the yearthe study was carried out or published (Table 5). Although the extrinsic characteristics are so called because they refer to aspectsthat, a priori, should not affect the results of the studies, the existence of a statistical association with the effect sizes hasoccasionally been detected in other meta-analyses. In fact, we have found such a relationship with both variables in our meta-analysis. First, the classification of the studies depending on whether the principal researcher was a psychologist or psychiatristreached a statistically significant relationship [QB(1)=7.245, p= .007; ω2= .204], the effect size being greater for psychologists(d+=1.825) than for psychiatrists (d+=0.929). Second, we obtained a positive and marginally significant relationship of thepublication year with the effect size (B=0.045; Z=2.107; R2= .133); the positive sign of the regression coefficient indicated that themost recent studies seem to obtain larger effect sizes than the older studies.
4. Discussion
In this paper we have presented the results of ameta-analytic investigation on the effectiveness of the psychological treatmentsof OCD. In order to do this, we selected a total of 19 studies that fulfilled our selection criteria creating a total of 24 comparisonsbetween a group treated with psychological treatment and a control group. Unlike the previous meta-analyses on this subject,which applied fixed-effects models, in the statistical analysis of the data we applied random- and mixed-effects models, since it iscurrently considered that they better represent the variability exhibited by the empirical studies (Field, 2001, 2003; Hedges &Vevea, 1998; National Research Council, 1992).
The results showed that the psychological treatment of OCD achieves a clinically relevant effectiveness, both for themeasures ofobsessions and compulsions and for those of general anxiety, depression, social adjustment, and other related measures. As was tobe expected, the improvement was greater for obsessions and compulsions, followed by other outcome measures, socialadjustment, general anxiety, and depression, in order of the effect magnitude exhibited. The effect sizes obtained with the self-reports were smaller for the symptoms of obsessions and compulsions than the clinician assessments, a result that coincides with
8 The predictive equation was: d' =1.180+0.612×dPretest–0.107×ERP−0.111×CR, where d' was the effectiveness prediction in the posttest and dPretest was the dindex in the pretest. The predictions reported in the text were obtained fixing dPretest=0.
1321A.I. Rosa-Alcázar et al. / Clinical Psychology Review 28 (2008) 1310–1325
the findings of the meta-analyses by Abramowitz (1996, 1997) and Christensen et al. (1987), and differs from those of Kobak et al.(1998). The high heterogeneity found between the effect sizes of the studies indicated that multiple factors exist to cause suchvariability.
Once the relevant statistical adjustments weremade, we found that ERP, CR, and a combination of the twowere very effective inreducing the symptoms of obsessions and compulsions and they seemed to show a similar effectiveness. In addition, thecombination of ERP and CR did not improve the benefits achieved by these two techniques separately. Our estimates of the meaneffect size for ERP (d+=1.127), CR (d+=1.099), and ERP+CR (d+=0.998) were very similar to those obtained in the meta-analyses ofAbramowitz (1997), Abramowitz et al. (2002), and Eddy et al. (2004).9 In particular, Abramowitz et al. (2002) obtainedmean effectsizes for ERP, CR, and ERP+CR of d=1.50, 1.19, and 0.99, respectively. Although Abramowitz et al. (2002) concluded that the “resultsof comparisons between treated and non-treated patients indicate that ERP is associated with larger reductions in OCD symptomsthan either cognitive therapy alone, or in combination with ERP” (p. 100), the effect sizes obtained do not seem to back up thisstatement. In our meta-analysis the only three studies that compared ERP and CR directly with a control group were *McLean et al.(2001), *Van Balkom et al. (1998), and *Vogel et al. (2004) (see Appendix A). Whereas *McLean et al. (2001, studies a and b)obtained a higher effect size for ERP (d=1.62) than for CR (d=0.98), *Van Balkom et al. (1998, studies a and b) obtained the oppositeresult (ERP: d=0.49; CR: d=0.67). Finally, *Vogel et al. (2004, studies a and b) obtained a greater effect size with ERP alone (d=3.78)than with ERP+CR (d=1.59), but the differential attrition between the treated and control groups in the comparison of ERP alonewas unusually high (46%), which gives cause to suspect that the aforementioned estimatemight have suffered a positive bias due toa substantial loss of subjects in the treatment group.
The reason that ERP and CR are so similar could be due to the fact that both techniques incorporate similar treatment strategies.Thus, for example, the application of CR often involves behavioral experiments that include exposure to anxiety-evoking situationsto negate their irrational thoughts, so CR also incorporates behavioral as well as cognitive components. On the other hand, theapplication of ERP involves arguing with the patient about his/her beliefs on fear and his/her irrational thoughts on decision-making under uncertainty, so ERP contains its own elements of cognitive therapy. An alternative interpretation of the absence ofclear differences between the effectiveness of ERP and CR (e.g., Emmelkamp et al., 2002) involves considering that ERP is moreeffective than CR, but the studies that compare ERP with CR have taken special care to avoid the use of cognitive elements in ERP,while the application of CR often includes elements of exposure.
Of the different types of exposure, our results are in line with those obtained by Abramowitz (1996; Abramowitz et al., 2002) inthat they indicate that the combination of exposure in vivo with exposure in imagination obtains slightly improved benefits incomparisonwith those of exposure in vivo alone, and that therapist-guided exposure is more effective than assisted self-exposurein reducing the symptoms of obsessions and compulsions.
With regards to the reduction of depression symptoms, we have found evidence in favor of ERP and the combination of ERP andCR, although CR alone does not seem to achieve beneficial results. This last result should be interpreted cautiously however, sincewe only have two comparisons that evaluated the effect of CR on the symptoms of depression. On the other hand, the combinationof exposure in vivo and in imagination achieved a greater reduction of depressive symptoms than exposure in vivo alone.
With respect to other treatment variables, we did not find a relationship between the duration, the intensity, and themagnitude of the intervention with the effect size. These results agree with those of Abramowitz (1996), but not with those ofAbramowitz et al. (2002), who obtained a negative and statistically significant relationship between the duration and the intensityof the intervention with the effect size. The comparison of individual versus group therapy did not produce relevant differences,which enables us to conclude that group therapy is equally effective in patients with OCD, as Anderson and Rees (2007) haverecently found.
The only patient characteristic that had a significant relationshipwith effect sizewas the presence of comorbidity in the sample,the results being better for the samples that had a high percentage of patients with comorbid disorders (over 50%) than for thesamples with a low percentage of comorbidity. However, this result should be interpreted with extreme caution, since a sensitivityanalysis allowed us to detect a study with high comorbidity that also presented high attrition for the treated group in the posttest,and in addition, it obtained the highest effect size of all the comparisons (*Vogel et al., 2004, study a). Its elimination from theanalyses led to the disappearance of the relationship between effect size and comorbidity.
In accordance with the results of Abramowitz et al. (2002), neither the average age of the patients, the percentage of men in thesample nor the average illness duration presented a statistical relationship with the effect size.
In our meta-analysis we took great care to test the possible influence of methodological characteristics on the results. We foundthat the effect size estimates for the experimental and quasi-experimental studies were very similar, as well as the effect sizesobtained for the comparisons with active and non-active control groups. The comparison between these last two mean effect sizesallowed us to estimate the degree towhich the non-specific effects of the treatments could be affecting the results.We showed thatin the psychological treatment of OCD non-specific effects can be considered to be of a practically negligible magnitude and of noclinical relevance (dNon-specific=0.071). The design quality showed a non-significant relationship with the effect size, as did theattrition of the treated group and the global attrition in the posttest. The only methodological variables that presented a significantrelationship with the effect size were the attrition of the control group and the differential attrition between the treated andcontrol groups. However, the elimination of a comparison that showed a high differential attrition (*Vogel et al., 2004, study a)
9 Actually, Eddy et al. (2004) concluded that the use of ERP alone or in combination with CR was more effective than CR alone. However, the average effect sizesthat these authors reported in their meta-analysis for the three treatments were d=1.53, 1.39, and 1.54, respectively. These estimates are similar to the ones thatwe obtained in our meta-analysis and they do not seem to show a clear superiority of ERP over CR.

1322 A.I. Rosa-Alcázar et al. / Clinical Psychology Review 28 (2008) 1310–1325
cancelled the statistical significance found for differential attrition. Finally, the analysis of publication bias enabled us to discardthis as a possible threat against the validity of the results of our meta-analysis.
Since the d index in the pretest showed a positive, although weak and non-significant, relationship with the effect size in theposttest, we applied a multiple regression model to test the differential effectiveness of ERP and CR controlling for the influence ofthe d index in the pretest. The results confirmed those previously obtainedwith the ANOVA in not finding a significant relationshipbetween these predictors and the effect size. In fact, the effect size estimates for ERP, CR, and ERP+CR with the regression modelwere very similar to those obtained in the previous ANOVA.
4.1. Implications for clinical practice
Our results have clear implications for clinical practice with OCD patients. Both ERP and CR have proved to be effectivetreatments to reduce obsessive–compulsive symptoms in patients with OCD. In spite of the lack of studies that offermore clarifyingdata, and although a clear superiority of ERP over CR has not been proven in terms of effectiveness, the higher simplicity of ERP incomparison with CR constitutes an important advantage for its implementation in professional practice. This, together with thelarge number of analyzed studies that have used ERP with positive results, leads us to suggest that ERP would be the treatment ofchoice. One weakness in the results of our meta-analysis is that we have only been able to detect three comparisons that analyzedthe effectiveness of CR alone in comparisonwith a control group (*Jones &Menzies,1998;McLean et al., 2001, study a; *Van Balkomet al., 1998, study a). Therefore, more research is required to examine the benefits of CR alone before we can recommend it as atreatment of choice.
Of the various modes of exposure, the most effective is the therapist-guided exposure and that which combines exposure invivo with exposure in imagination. In this sense, the alternatives based on the self-application of ERP and the use of the telephoneor the computer as a substitute for direct patient–therapist contact do not seem to offer guaranties of effectiveness. Furthermore,the fact that group treatment achieved similar results to individual therapy demonstrates its greater efficiency in reducing thecosts and resources necessary for its application. All these considerations lead us to propose that the basic elements of ERP can beimplemented following a standard protocol, but leaving a small margin of adaptation to the personal characteristics of the patient(age, sex, illness duration, comorbidity) and of the therapist (degree of experience).
Although the Task Force on Promotion and Dissemination of Psychological Procedures (1995) has recommended ERP andselective serotonin reuptake inhibitors (SSRIs) as the empirically validated treatments for OCD in adults, ERP treatment is beingunderexploited in the national health services because of its high cost. Thus, a nationally representative sample of psychiatrists inthe USA studied by Blanco, Olfson, Stein, Simpson, Gameroff, and Narrow (2006) showed that 65% of adult patients with OCDweretreatedwith an SSRI, whereas only 7.5% of patients received cognitive–behavioral therapy. Future research in this field should carryout cost-effectiveness analyses in terms of treatment duration, number of sessions, and level of expertise needed by the clinicians.In this way, the good results found for group therapy can help to optimize resources.
4.2. Implications for future research
Our results enable us to present several implications for future research in this field. First, the primary studies on the treatmentof OCD show deficiencies in the reporting of important characteristics related to the treatment applied, such as a detaileddescription of the specific components of the treatment, and to the patient samples, such as the distribution of comorbidity in thesample or the illness duration. These deficiencies affect the capability of the meta-analyses to detect moderator variables of theresults.
Another aspect that should be improved in the design of these studies concerns the obtaining of follow-up data for the treatedand control groups. Half of the comparisons of ourmeta-analysis obtained follow-up data, but the periodswere very short (medianfollow-up=3 months; minimum=3 months; maximum=12 months). Furthermore, the studies that reported follow-up data onlydid so for the treated group, since for ethical reasons the control group patients often receive treatment once the experimentalphase of the study has finished. In our meta-analysis the only study that reported follow-up data for the two groups was that of*Fineberg, Hughes, Gale, and Roberts (2005) which, in a follow-up of two months, enabled us to obtain an effect size estimate forthe symptoms of obsessions and compulsions of d=0.492. This limitation of the primary studies limits, in turn, the possibilities ofinvestigating via meta-analysis how the benefits achieved by the treatment evolve over time. One solution to this problem consistsof calculating a d index for each group separately via the difference between the means of the pretest and the follow-up divided byan estimate of the standard deviation. These indices do not enable us to control numerous confounding variables however. For thisreason, it would be ideal to obtain comparisons between the treated group and the control group over long enough follow-upperiods to enable us to evaluate the stability of the therapeutic benefits achieved by the treatment. The need to build follow-up intothe studies is of particular importance in chronic disorders such as OCD.
Finally, it is necessary to consider that the differences between the results of ourmeta-analysis and those of previous ones couldbe due to differences in the meta-analytic method applied. As it was stated in the Introduction, we have applied meta-analytictechniques based on random- and mixed-effects models, as opposed to the fixed-effects models that were used in previous meta-analyses. Since random- and mixed-effects models are more appropriate for the nature of the data that are examined in meta-analysis, we recommend their use instead of the fixed-effects model.
Another difference between the different meta-analyses carried out on this subject lies in the effect size index used. Eventhough in all cases a standardized mean difference is used, meta-analyses differ in how they define such a difference, which could
1323A.I. Rosa-Alcázar et al. / Clinical Psychology Review 28 (2008) 1310–1325
be a within-group difference (pretest versus posttest; e.g., Abramowitz, 1996; Christensen et al., 1987; Eddy et al., 2004), abetween-group difference (treated group versus control group in the posttest; e.g., Abramowitz, 1997; Abramowitz et al., 2002;Eddy et al., 2004), or even a difference that combines the pretest–posttest changes with between-group comparison (e.g., Kobaket al., 1998). These effect size indices are in different metrics and are not therefore directly comparable (cf e.g., Morris & DeShon,2002; Viechtbauer, 2007).
We also recommend that the meta-analyses in this field calculate the d index in the pretest to test its possible relationship withthe effect size. And finally, given the difficulty of incorporating unpublished studies into the meta-analysis in this field, it is advisedto routinely examine whether publication bias may be a threat to the validity of the results.
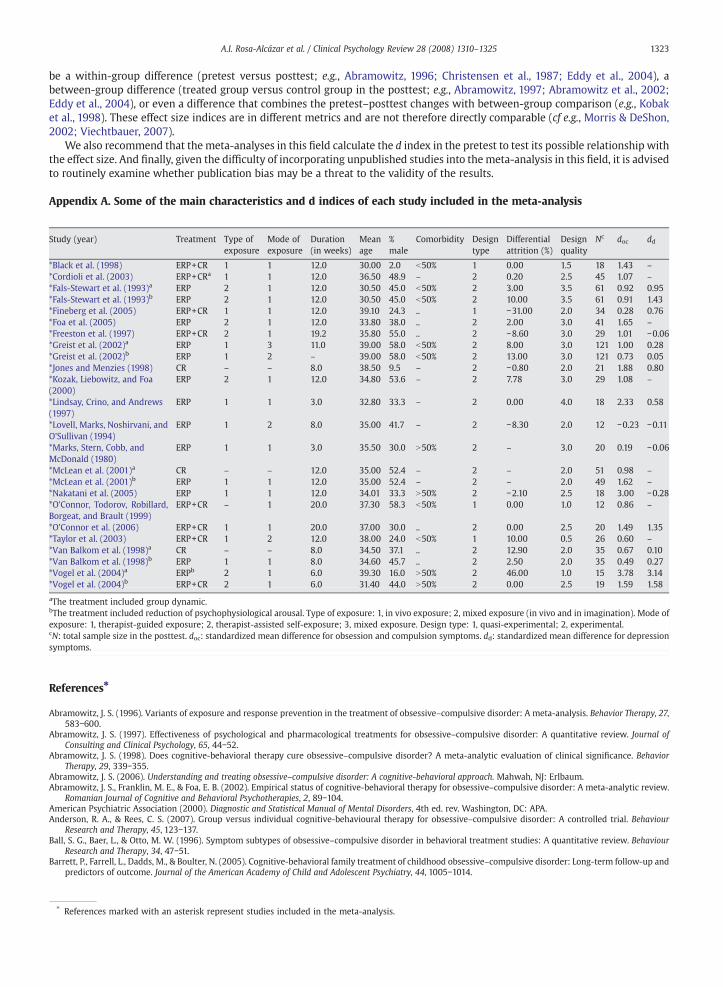
Appendix A. Some of the main characteristics and d indices of each study included in the meta-analysis
⁎ References marked with an asterisk represent studies included in the meta-analysis.
Study (year) Treatment Type ofexposure
Mode ofexposure
Duration(in weeks)
Meanage
%male
Comorbidity Designtype
Differentialattrition (%)
Designquality
Nc doc dd
*Black et al. (1998) ERP+CR 1 1 12.0 30.00 2.0 b50% 1 0.00 1.5 18 1.43 –
*Cordioli et al. (2003) ERP+CRa 1 1 12.0 36.50 48.9 – 2 0.20 2.5 45 1.07 –
*Fals-Stewart et al. (1993)a ERP 2 1 12.0 30.50 45.0 b50% 2 3.00 3.5 61 0.92 0.95*Fals-Stewart et al. (1993)b ERP 2 1 12.0 30.50 45.0 b50% 2 10.00 3.5 61 0.91 1.43*Fineberg et al. (2005) ERP+CR 1 1 12.0 39.10 24.3 .. 1 −31.00 2.0 34 0.28 0.76*Foa et al. (2005) ERP 2 1 12.0 33.80 38.0 .. 2 2.00 3.0 41 1.65 –
*Freeston et al. (1997) ERP+CR 2 1 19.2 35.80 55.0 .. 2 −8.60 3.0 29 1.01 −0.06*Greist et al. (2002)a ERP 1 3 11.0 39.00 58.0 b50% 2 8.00 3.0 121 1.00 0.28*Greist et al. (2002)b ERP 1 2 – 39.00 58.0 b50% 2 13.00 3.0 121 0.73 0.05*Jones and Menzies (1998) CR – – 8.0 38.50 9.5 – 2 −0.80 2.0 21 1.88 0.80*Kozak, Liebowitz, and Foa(2000)
ERP 2 1 12.0 34.80 53.6 – 2 7.78 3.0 29 1.08 –
*Lindsay, Crino, and Andrews(1997)
ERP 1 1 3.0 32.80 33.3 – 2 0.00 4.0 18 2.33 0.58
*Lovell, Marks, Noshirvani, andO'Sullivan (1994)
ERP 1 2 8.0 35.00 41.7 – 2 −8.30 2.0 12 −0.23 −0.11
*Marks, Stern, Cobb, andMcDonald (1980)
ERP 1 1 3.0 35.50 30.0 N50% 2 – 3.0 20 0.19 −0.06
*McLean et al. (2001)a CR – – 12.0 35.00 52.4 – 2 – 2.0 51 0.98 –
*McLean et al. (2001)b ERP 1 1 12.0 35.00 52.4 – 2 – 2.0 49 1.62 –
*Nakatani et al. (2005) ERP 1 1 12.0 34.01 33.3 N50% 2 −2.10 2.5 18 3.00 −0.28*O'Connor, Todorov, Robillard,Borgeat, and Brault (1999)
ERP+CR – 1 20.0 37.30 58.3 b50% 1 0.00 1.0 12 0.86 –
*O'Connor et al. (2006) ERP+CR 1 1 20.0 37.00 30.0 .. 2 0.00 2.5 20 1.49 1.35*Taylor et al. (2003) ERP+CR 1 2 12.0 38.00 24.0 b50% 1 10.00 0.5 26 0.60 –
*Van Balkom et al. (1998)a CR – – 8.0 34.50 37.1 .. 2 12.90 2.0 35 0.67 0.10*Van Balkom et al. (1998)b ERP 1 1 8.0 34.60 45.7 .. 2 2.50 2.0 35 0.49 0.27*Vogel et al. (2004)a ERPb 2 1 6.0 39.30 16.0 N50% 2 46.00 1.0 15 3.78 3.14*Vogel et al. (2004)b ERP+CR 2 1 6.0 31.40 44.0 N50% 2 0.00 2.5 19 1.59 1.58
aThe treatment included group dynamic.bThe treatment included reduction of psychophysiological arousal. Type of exposure: 1, in vivo exposure; 2, mixed exposure (in vivo and in imagination). Mode oexposure: 1, therapist-guided exposure; 2, therapist-assisted self-exposure; 3, mixed exposure. Design type: 1, quasi-experimental; 2, experimental.cN: total sample size in the posttest. doc: standardized mean difference for obsession and compulsion symptoms. dd: standardized mean difference for depressionsymptoms.
f
References⁎
Abramowitz, J. S. (1996). Variants of exposure and response prevention in the treatment of obsessive–compulsive disorder: A meta-analysis. Behavior Therapy, 27,583−600.
Abramowitz, J. S. (1997). Effectiveness of psychological and pharmacological treatments for obsessive–compulsive disorder: A quantitative review. Journal ofConsulting and Clinical Psychology, 65, 44−52.
Abramowitz, J. S. (1998). Does cognitive-behavioral therapy cure obsessive–compulsive disorder? A meta-analytic evaluation of clinical significance. BehaviorTherapy, 29, 339−355.
Abramowitz, J. S. (2006). Understanding and treating obsessive–compulsive disorder: A cognitive-behavioral approach. Mahwah, NJ: Erlbaum.Abramowitz, J. S., Franklin, M. E., & Foa, E. B. (2002). Empirical status of cognitive-behavioral therapy for obsessive–compulsive disorder: A meta-analytic review.
Romanian Journal of Cognitive and Behavioral Psychotherapies, 2, 89−104.American Psychiatric Association (2000). Diagnostic and Statistical Manual of Mental Disorders, 4th ed. rev. Washington, DC: APA.Anderson, R. A., & Rees, C. S. (2007). Group versus individual cognitive-behavioural therapy for obsessive–compulsive disorder: A controlled trial. Behaviour
Research and Therapy, 45, 123−137.Ball, S. G., Baer, L., & Otto, M. W. (1996). Symptom subtypes of obsessive–compulsive disorder in behavioral treatment studies: A quantitative review. Behaviour
Research and Therapy, 34, 47−51.Barrett, P., Farrell, L., Dadds, M., & Boulter, N. (2005). Cognitive-behavioral family treatment of childhood obsessive–compulsive disorder: Long-term follow-up and
predictors of outcome. Journal of the American Academy of Child and Adolescent Psychiatry, 44, 1005−1014.
1324 A.I. Rosa-Alcázar et al. / Clinical Psychology Review 28 (2008) 1310–1325
Barrett, P., Healy-Farrell, L., & March, J. S. (2004). Cognitive-behavioral family treatment of childhood obsessive–compulsive disorder: A controlled trial. Journal ofthe American Academy of Child and Adolescent Psychiatry, 43, 46−62.
Beck, A. T., Rush, A. J., Shaw, B. F., & Emery, G. (1979). Cognitive therapy of depressions. New York: Basic Books.Becker, B. J. (2005). Failsafe N or file-drawer number. In H. R. Rothstein, A. J. Sutton, & M. Borenstein (Eds.), Publication bias in meta-analysis: Prevention, assessment
and adjustments (pp. 111−125). Chichester, UK: Wiley.Black, D., Monahan, P., Gable, J., Blue, N., Clancy, G., & Baker, P. (1998). Hoarding and treatment response in 38 nondepressed subjects with obsessive–compulsive
disorder. Journal of Clinical Psychiatry, 59, 420−425.Blanco, C., Olfson, M., Stein, D. J., Simpson, H. B., Gameroff, M. J., & Narrow,W. H. (2006). Treatment of obsessive–compulsive disorder by U.S. psychiatrists. Journal of
Clinical Psychiatry, 67, 946−951.Christensen, H., Hadzi-Pavlovic, D., Andrews, G., &Mattick, R. (1987). Behavior therapy and tricyclic medication in the treatment of obsessive–compulsive disorder:
A quantitative review. Journal of Consulting and Clinical Psychology, 55, 701−711.Cohen, J. (1988). Statistical power analysis for the behavioral sciences, 2nd ed. Hillsdale, NJ: Erlbaum.Cooper, H., & Hedges, L. V. (Eds.). (1994). The handbook of research synthesis New York: Russell Sage Foundation.Cordioli, A. V., Heldt, E., Bochi, D. B., Margis, R., de Sousa, M. B., Tonello, J. F., Manfro, G. G., & Kapczinski, F. (2003). Cognitive-behavioral group therapy in obsessive–
compulsive disorder: A randomized clinical trial. Psychotherapy and Psychosomatics, 72, 211−216.Cox, B. J., Swinson, R. P., Morrison, B., & Lee, P. S. (1993). Clomipramine, fluoxetine, and behavior therapy in the treatment of obsessive–compulsive disorder: A
meta-analysis. Journal of Behavior Therapy and Experimental Psychiatry, 24, 149−153.Derogatis, L. R. (1977). SCL-90: Administration, scoring and procedures manual-I for the revised version and other instrumetns of the psychopathology rating scales.
Baltimore, MD: The Johns Hopkins University School of Medicine.Eddy, K. T., Dutra, L., Bradley, R., &Westen, D. (2004). Amultidimensional meta-analysis of psychotherapy and pharmacotherapy for obsessive–compulsive disorder.
Clinical Psychology Review, 24, 1011−1030.Emmelkamp, P. M., & Beens, H. (1991). Cognitive therapy with obsessive–compulsive disorder: A comparative evaluation. Behaviour Research and Therapy, 29,
293−300.Emmelkamp, P. M., de Haan, E., & Hoogduin, C. A. (1990). Marital adjustment and obsessive–compulsive disorder. British Journal of Psychiatry, 156, 55−60.Emmelkamp, P. M., van Oppen, P., & van Balkom, A. J. (2002). Cognitive changes in patients with obsessive compulsive rituals treated with exposure in vivo and
response prevention. In R. O. Frost, & G. Stekee (Eds.), Cognitive approaches to obsessions and compulsions: Theory, assessment and treatment (pp. 391−401).Amsterdam: Pergamon Press.
Fals-Stewart, W., Marks, A. P., & Schafer, J. (1993). A comparison of behavioral group therapy and individual behavior therapy in treating obsessive–compulsivedisorder. Journal of Nervous and Mental Disease, 181, 189−193.
Field, A. P. (2001). Meta-analysis of correlation coefficents: A Monte Carlo comparison of fixed- and random-effects methods. Psychological Methods, 6, 161−180.Field, A. P. (2003). The problems of using fixed-effects models of meta-analysis on real-world data. Understanding Statistics, 2, 77−96.Fineberg, N., Hughes, A., Gale, T., & Roberts, A. (2005). Group cognitive behaviour therapy in obsessive–compulsive disorder (OCD): A controlled study. International
Journal of Psychiatry in Clinical Practice, 9, 257−263.Foa, E. B., Liebowitz, M. R., Kozak, M. J., Davies, S., Campeas, R., Franklin, M. E., Huppert, J. D., Kjernisted, K., Rowan, V., Schmidt, A. B., Simpson, H. B., & Tu, X. (2005).
Randomized, placebo-controlled trial of exposure and ritual prevention, clomipramine, and their combination in the treatment of obsessive–compulsivedisorder. American Journal of Psychiatry, 162, 151−161.
Foa, E. B., Steketee, G., Grayson, J. B., Turner, R. M., & Latimer, P. (1984). Deliberate exposure and blocking of obsessive–compulsive rituals: Immediate and long termeffects. Behavior Therapy, 15, 450−472.
Freeston, M. H., Ladouceur, R., Gagnon, F., Thibodeau, N., Rhéaume, J., Letarte, H., & Bujold, A. (1997). Cognitive-behavioral treatment of obsessive thoughts: Acontrolled study. Journal of Consulting and Clinical Psychology, 65, 405−413.
Goodman,W. K., Price, L. H., Rasmussen, S. A., Mazure, C., Fleischmann, R. L., Hill, C. L., Heninger, G. R., & Charney, D. S. (1989). The Yale–BrownObsessive CompulsiveScale (Y-BOCS): Part I. Development, use, and reliability. Archives of General Psychiatry, 46, 1006−1011.
Greist, J. H., Marks, I. M., Baer, L., Kobak, K. A., Wenzel, K. W., Hirsch, M. J., Mantle, J. M., & Clary, C. M. (2002). Behavior therapy for obsessive–compulsive disorderguided by a computer or by a clinician compared with relaxation as a control. Journal of Clinical Psychiatry, 63, 138−145.
Guy, W. (1976). ECDEU. Assessment manual for psychopharmacology revised. Washington: NIMH.Haddock, C. K., Rindskopf, D., & Shadish, W. R. (1998). Using odds ratios as effect sizes for meta-analysis of dichotomous data: A primer on methods and issues.
Psychological Methods, 3, 339−353.Hedges, L. V., & Olkin, I. (1985). Statistical methods for meta-analysis. Orlando, FL: Academic Press.Hedges, L. V., & Vevea, J. L. (1998). Fixed- and random-effects models in meta-analysis. Psychological Methods, 3, 486−504.Higgins, J. P. T., & Thompson, S. G. (2002). Quantifying heterogeneity in a meta-analysis. Statistics in Medicine, 21, 1539−1558.Hodgson, R. J., & Rachman, S. (1977). Obsessional–compulsive complaints. Behaviour Research and Therapy, 15, 389−395.Huedo-Medina, T. B., Sánchez-Meca, J., Marín-Martínez, F., & Botella, J. (2006). Assessing heterogeneity in meta-analysis: Q statistic or I2 index? Psychological
Methods, 11, 193−206.Jones, M. K., & Menzies, R. G. (1998). Dander ideation reduction therapy (DIRT) for obsessive–compulsive washers: A controlled trial. Behaviour Research and
Therapy, 36, 959−970.Karno, M., Golding, J. J., Sorenson, S. B., & Burnam, M. A. (1988). The epidemiology of obsessive–compulsive disorder in five US communities. Archives of General
Psychiatry, 45, 1094−1099.Keeley, M. L., Storch, E. A., Merlo, L. J., & Geffken, G. R. (2008). Clinical predictors of response to cognitive-behavioral therapy for obsessive–compulsive disorder.
Clinical Psychology Review, 28, 118−130.Kobak, K. A., Greist, J. H., Jefferson, J. W., Katzelnick, D. J., & Henk, H. J. (1998). Behavioral versus pharmacological treatments of obsessive compulsive disorder: A
meta-analysis. Psychopharmacology, 136, 205−216.Kozak, M., Liebowitz, M., & Foa, E. B. (2000). Cognitive Behavior therapy and pharmacotherapy for obsessive–compulsive disorder: The NIMH-Sponsored
collaborative study. In W. K. Goodman (Ed.), Obsessive–compulsive disorder (pp. 501−530). Mahwah, NJ: Erlbaum.Lindsay, M., Crino, R., & Andrews, G. (1997). Controlled trial of exposure and response prevention in obsessive–compulsive disorder. British Journal of Psychiatry,
171, 135−139.Lipsey, M. W., & Wilson, D. B. (2001). Practical Meta-analysis. Thousand Oaks, CA: Sage.Lovell, K., Marks, I. M., Noshirvani, H., & O'Sullivan, G. (1994). Should treatment distinguish anxiogenic from anxiolytic obsessive–compulsive rumiations?
Psychotherapy and Psychosomatics, 61, 150−155.Marín-Martínez, F., & Sánchez-Meca, J. (1998). Testing for dichotomous moderators in meta-analysis. Journal of Experimental Education, 67, 69−81.Marks, I. M. (1986). Behavioral Psychotherapy. Bristol, England: John Wright.Marks, I. M., Stern, D. M., Cobb, J., & McDonald, R. (1980). Clomipramine and exposure for obsessive–compulsive rituals: I. British Journal of Psychiatry, 136, 1−25.McLean, P. D., Whittal, M. L., Söchting, I., Koch, W. J., Paterson, R., Thordarson, D. S., Taylor, S., & Anderson, K. W. (2001). Cognitive versus behavior therapy in the
group treatment of obsessive–compulsive disorder. Journal of Consulting and Clinical Psychology, 69, 205−214.Mehta, M. (1990). A comparative study of family-based and patients-based behavioural management in obsessive–compulsive disorder. Journal of Consulting and
Clinical Psychology, 69, 205−214.Morris, S. B., & DeShon, R. P. (2002). Combining effect size estimates in meta-analysis with repeated measures and independent-groups designs. Psychological
Methods, 7, 105−125.Nakatani, E., Nakagawa, A., Nakao, T., Yoshizato, C., Nabeyama, M., Kudo, A., Isomura, K., Kato, N., Yoshioka, K., & Kawamoto, M. (2005). A randomized controlled trial
of Japanese patients with obsessive–compulsive disorder: Effectiveness of behavior therapy and fluvoxamine. Psychotherapy and Psychosomatics, 74, 269−276.National Research Council (1992). Combining information: Statistical issues and opportunities for research. Washington, DC: National Academy Press.

1325A.I. Rosa-Alcázar et al. / Clinical Psychology Review 28 (2008) 1310–1325
O'Connor, K., Aardema, F., Robillard, S., Guay, S., Pélissier, M. -C., Todorov, C., Borgear, F., Leblane, V., Grenier, S., & Doucet, P. (2006). Cognitive behaviour therapy andmedication in the treatment of obsessive–compulsive disorder. Acta Psychiatrica Scandinavia, 113, 408−419.
O'Connor, K., Todorov, C., Robillard, S., Borgeat, F., & Brault, M. (1999). Cognitive-behaviour therapy and medication in the treatment of obsessive–compulsivedisorder: A controlled study. Canadian Journal of Psychiatry, 44, 64−71.
Rothstein, H. R., Sutton, A. J., & Borenstein, M. (Eds.). (2005). Publication bias in meta-analysis: Prevention, assessment, and adjustments Chichester, UK: Wiley.Sanavio, E. (1988). Obsessions and compulsions: The Padua Inventory. Behaviour Research and Therapy, 26, 169−177.Sánchez-Meca, J., Gómez-Conesa, A., & Méndez, F. X. (2003). El tratamiento psicológico del trastorno obsesivo–compulsivo en Europa: Un estudio meta-analítico
[The psychological treatment of obsessive–compulsive disorder in Europe: A meta-analytic study.]. Psicología Conductual, 11, 213−237.Sánchez-Meca, J., & Marín-Martínez, F. (1998). Testing continuous moderators in meta-analysis: A comparison of procedures. British Journal of Mathematical &
Statistical Psychology, 51, 311−326.Sánchez-Meca, J., & Marín-Martínez, F. (2008). Confidence intervals for the overall effect size in random-effects meta-analysis. Psychological Methods, 13, 31−48.Sánchez-Meca, J., Marín-Martínez, F., & Chacón-Moscoso, S. (2003). Effect-size indices for dichotomized outcomes in meta-analysis. Psychological Methods, 8,
448−467.Spielberger, C. D., Gorsuch, R. L., & Lushene, R. E. (1970). The State-Trait anxiety inventory. Palo Alto, CA: Consulting Psychologist Press.Sterne, J. A. C., & Egger, M. (2005). Regression methods to detect publication and other bias in meta-analysis. In H. R. Rothstein, A. J. Sutton, & M. Borenstein (Eds.),
Publication bias in meta-analysis: Prevention, assessment and adjustments (pp. 99−100). Chichester, UK: Wiley.Storch, E. A., Geffken, G. R., Merlo, L. J., Jacob, M. L., Murphy, T. K., Goodman, W. K., Larson, M. J., Fernandez, M., & Grabill, K. (2007). Family accommodation in
pediatric obsessive–compulsive disorder. Journal of Clinical Child and Adolescent Psychiatry, 36, 207−216.Storch, E. A., Geffken, G. R., Merlo, L. J., Mann, G., Duke, D., Munson, M., Adkins, J., Grabill, K. M., Murphy, T. K., & Goodman, W. K. (2007). Family-based cognitive-
behavioral therapy for pediatric obsessive–compulsive disorder: Comparison of intensive and weekly approaches. Journal of Clinical Child and AdolescentPsychiatry, 36, 207−216.
Task Force on Promotion and Dissemination of Psychological Procedures (1995). Training in and dissemination of empirically-validated psychological treatments:Report and recommendations. The Clinical Psychologist, 48, 3−23.
Taylor, S., Thordarson, D. S., Spring, T., Yeh, A. H., Corcoran, K. M., Eugster, K., & Tisshaw, C. (2003). Telephone-administered cognitive behavior therapy forobsessive–compulsive disorder. Cognitive and Behavioral Therapy, 32, 13−25.
Van Balkom, J. L. M., de Haan, E., van Oppen, P., Spinhoven, P., Hoogduin, K. A. L., & van Dyck, R. (1998). Cognitive and behavioral therapies alone versus incombination with fluvoxamine in the treatment of obsessive–compulsive disorder. Journal of Nervous and Mental Disease, 186, 492−499.
Van Oppen, P., de Haan, E., van Balkom, A. J., Spinhoven, P., Hoogduin, K. A. L., & van Dyck, R. (1995). Cognitive therapy and exposure in vivo in the treatment ofobsessive–compulsive disorder. Behaviour Research and Therapy, 33, 379−390.
Viechtbauer, W. (2007). Approximate confidence intervals for standardized effect sizes in the two-independent and two-dependent samples design. Journal ofEducational and Behavioral Statistics, 32, 39−60.
Vogel, P. A., Stiles, T. C., & Götesman, K. G. (2004). Adding cognitive therapy elements to exposure therapy for obsessive–compulsive disorder: A controlled study.Behavioural and Cognitive Psychotherapy, 32, 275−290.
Whittal, M. L., & McLean, P. D. (2002). Group cognitive behavioural therapy for obsessive compulsive disorder. In R. O. Frost & G. Steketee (Eds.), Cognitiveapproaches to obsessions and compulsions: Theory, assessment and treatment (pp. 417−433). Amsterdam: Pergamon Press.