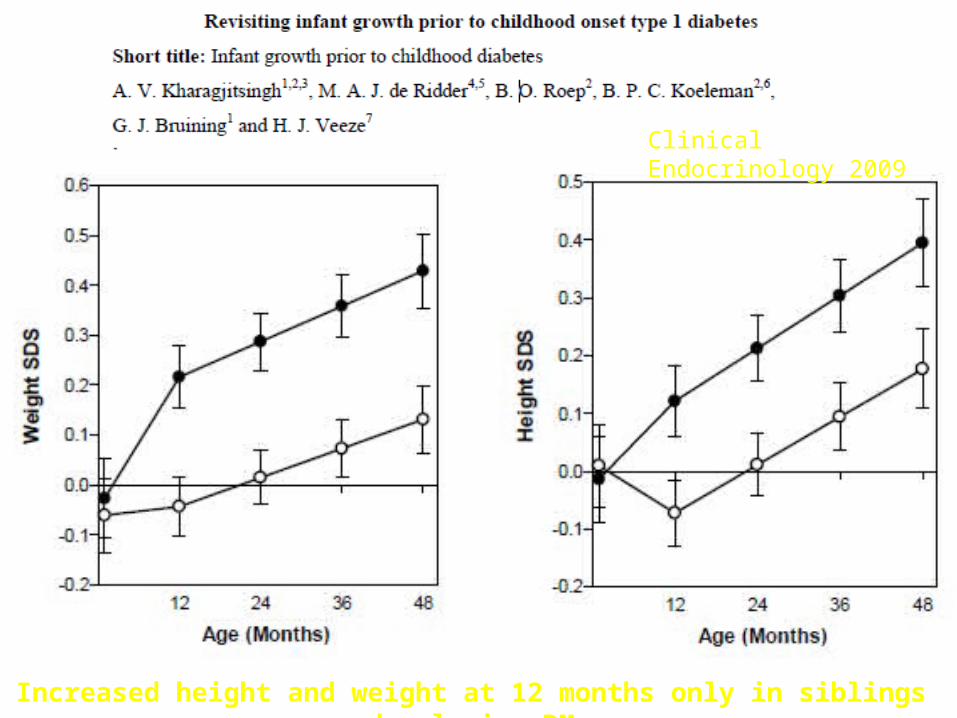
clinical endocrinology 2009 increased height and weight at 12 months only in siblings developing dm
Post on 22-Dec-2015
213 views
TRANSCRIPT
Clinical Endocrinology 2009
Increased height and weight at 12 months only in siblings developing DM

Type 1 DiabetesType 1 Diabetes
The incidence of childhood type 1 diabetes
varies with geographic location, age, sex,
ethnicity and time period.
Increase in Type 1 incidence worldwide
SEARCH study “indicates” rise incidence vs.
CO registry

Diabetes in YouthDiabetes in Youthin the U.S.in the U.S.
170,000 patients younger than 20 y
1,500,000 patients with type 1 diabetes
all ages
Number of new patients annually has tripled in the past 20 years
REWERS

0
10
20
30
40
50
60
70
80
90
100
White Af Am Hispanic Asian AmericanIndian
Type 1 0-9 Type 2 0-9 Type 1 10-19 Type 2 10-19
Percent Type 1 versus Type 2 Diabetes by Age onset (0-9 versus 10-19)
Dabelea, SEARCH JAMA 2007; 297:2716-2724

BDA Cohort Study 1972-1993 All Cause Mortality
0
0.5
1
1.5
2
2.5
1-9 10-19 20-29
Age Cohort
Perc
ent D
ead
Per 1
0 ye
ars Diabetic
General
Extra 2.9% Dead by Age 30
Laing et al Diabetic Medicine 16, 459-465, 1999

Cause Specific Mortality rates
0
50
100
150
200
1-9 10-19 20-29
Age Groups
Mor
talit
y Ra
te p
er
100,
000
pers
on y
ears
Metabolic
Other
Laing et al Diabetic Medicine 16, 466-471, 1999
Of Diabetes Deaths 18% male hypo and 6% female not counting epilepsy and dead unattended

0
10
20
30
40
50
60
70
1950 1960 1970 1980 1990 2000
Finland
Sweden
Colorado
Germany
T1D incidence is rising 3-5% per year Due to environmental cause(s)
Incidence /100,000/ yr in children aged 0-14
REWERS

Accelerating Incidence Type 1 Diabetes Finland: Lancet 371:1778
Harjutsalo; Sjoberg; Tuomilehto May 2008

Finland Incidence Type 1 Finland Incidence Type 1 DM/100K 1965-1996DM/100K 1965-1996
05
10
1520
2530
3540
4550
Yrs. 65-74 75-84 85-96
1-4 yrs5-9 yrs10-14 yrs
Diabetes Care: 22:1066-1070

Finland Type 1 Diabetes Incidence Finland Type 1 Diabetes Incidence 1965-1996 (32 years)1965-1996 (32 years)
Relative Percent IncreaseRelative Percent Increase
0
50
100
150
200
250
300
350
Age 1-4 Age 5-9 Age 10-14
Diabetes Care: 22:1066-1070

Incidence per 100,000 per yearIncidence per 100,000 per yearSwiss MalesSwiss Males
02468
101214161820
1940 1950 1960 1970 1980 1990 2000 2010
Year
Inci
den
ce/1
00,0
00 (
Ag
e 0-
4)
Schoenle et al. Diabetologia: 2,001, 44:286
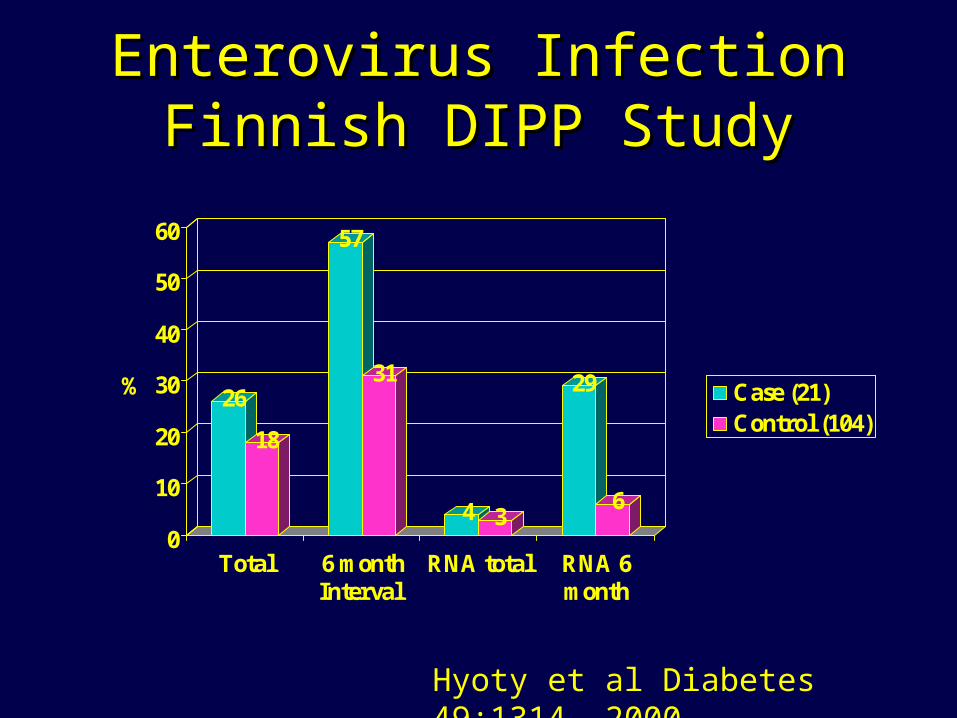
Enterovirus Infection Finnish Enterovirus Infection Finnish DIPP StudyDIPP Study
26
18
57
31
4 3
29
6
0
10
20
30
40
50
60
%
Total 6 monthInterval
RNA total RNA 6month
Case (21)Control (104)
Hyoty et al Diabetes 49:1314, 2000

Incidence Type 1 DiabetesIncidence Type 1 Diabetesper 100,000 per year Children <=14per 100,000 per year Children <=14
05
10
1520
2530
3540
Karvonnen et al., Diabetes Care, 23:1516, 2000

0 10 20 30 40 50
China, BeijingHong Kong
IsraelRomania
PolandHungaryGermanyDenmark
UK, OxfordUS BlackUS WhiteSardiniaFinland
Incidence (per 100,000/year)
Boys Girls
Worldwide Incidence of Type 1 Diabetes in Children < 14 Years, by Sex
Karvonen et al., Diabetes Care, 23, 2000

Relative Increase in Incidence of Type Relative Increase in Incidence of Type 1 Diabetes in Children < 14 Years1 Diabetes in Children < 14 Years
-2
0
2
4
6
8
10
Incr
ease
in I
ncid
ence
% p
er Y
ear UK
HungaryHawaiiChinaPoland, KrakowSlovakiaNorwayUSA, AlleghenySwedenLithuaniaEstoniaUSA, CO
Change globally: 2.5 % per year (2.32-2.66)
Onkamo et al, Diabetologia 42, 1999

Incidence of Type 1 Diabetes in Romania, by CountyAge < 14 years
Serban, et al, JPEM, 14 2001

Risk by the age of 20 years Risk by the age of 20 years
Risk group Autoimmunity T1 DM
Population 1:30 1:300
Maternal offspring 1:15 1:50
Paternal offspring Siblings HLA-DR3/4,DQB1*0302
1:5
1:15
Monozygotic twins 1:1 (?) 1:3

High Risk GroupsHigh Risk Groups
Scandinavia - < 5% IDDM cases worldwide
Relatives - only about 10% of the cases
Children - < 40% of the cases
HLA-DR3/4 - about 30-40% of childhood cases

Promoters- genes?- virus?- diet ?
Natural history of type 1 diabetesNatural history of type 1 diabetes
Geneticsusceptibility
Initiators- virus?- diet?
No autoimmunity
Autoimmunity
Remission
Clinicaldiabetes

Genetic Susceptibility Genetic Susceptibility to T1 DM to T1 DM

Locus/Loci Unique Alleles/Haplotypes DRB1 34
DQB1 16
DPB1 23
A 33
B 52
DRB1-DQB1 57
DRB1-DQB1-DPB1 232
DRB1-DQB1-B 313
DPB1-DRB1-DQB1-B 558
DPB1-DRB1-DQB1-B-A 779
Alleles and Haplotypes in T1 DM FamiliesAlleles and Haplotypes in T1 DM Families
J. Noble , HBDI
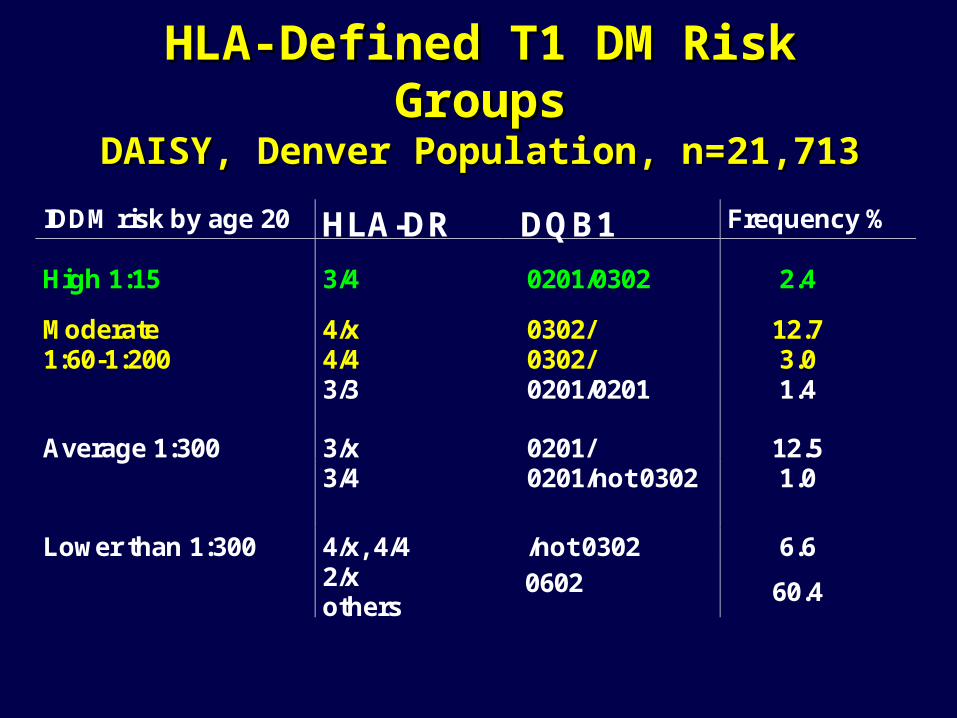
IDDM risk by age 20 HLA-DR DQB1 Frequency %
High 1:15 3/4 0201/0302 2.4
Moderate 4/x 0302/ 12.71:60-1:200 4/4 0302/ 3.0
3/3 0201/0201 1.4
Average 1:300 3/x 0201/ 12.53/4 0201/not 0302 1.0
Lower than 1:300 4/x, 4/4 /not 0302 6.62/xothers
0602 60.4
HLA-Defined T1 DM Risk GroupsHLA-Defined T1 DM Risk GroupsDAISY, Denver Population, n=21,713DAISY, Denver Population, n=21,713

Congenital Rubella Syndrome Congenital Rubella Syndrome
30% diabetic usually early IDDM, some NIDDM incubation period 5-20 yrs ICA, IAA in up to 80% of those with diabetes HLA-DR3 or 3/4 in those with diabetes other autoimmune diseases (thyroid, AD) molecular mimicry with a 52kD autoantigen animal model - Syrian hamsters no diabetes after postnatal infection or MMR
vacc.
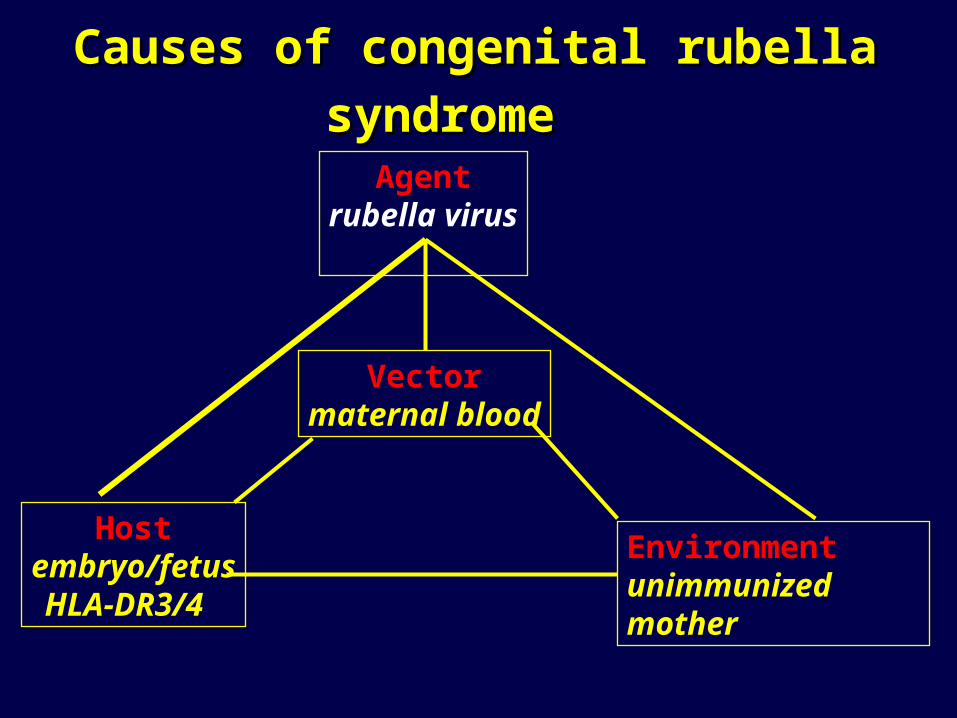
Causes of congenital rubella syndromeCauses of congenital rubella syndrome
Hostembryo/fetusHLA-DR3/4
Agentrubella virus
Environmentunimmunized mother
Vectormaternal blood

Enteroviruses - recent studiesEnteroviruses - recent studies
Study Autoimmunity DiabetesFrisk 1992 CVB 1-5 IgM
Dahlquist 1995 CVB 2-4 IgM
Hyoty 1995 IgM, IgG CVB CVB IgM, IgG
Clements 1995 EV RNA
Graves (DAISY) 1996 no EV RNA ? EV IgM

Enterovirus Infection Finnish Enterovirus Infection Finnish DIPP StudyDIPP Study
26
18
57
31
4 3
29
6
0
10
20
30
40
50
60
%
Total 6 monthInterval
RNA total RNA 6month
Case (21)Control (104)
Hyoty et al Diabetes 49:1314, 2000

Interferon-alpha Therapy and Type 1 Interferon-alpha Therapy and Type 1 Diabetes MellitusDiabetes Mellitus
Fabris et al, Aliment Pharmacol Ther 2003: 18: 549-558Fabris et al, Aliment Pharmacol Ther 2003: 18: 549-558
Review: 31 cases type 1 diabetes Hepatitis C- 3% islet ab+, increase to 7% 9/18 cases type 1 diabetes had anti-islet
antibodies (ab+) prior to interferon Rx 23/30 (77%) ab+ at diagnosis 8 cases transient insulin dependence
Consider Islet Ab Testing Interferon Rx

Early childhood dietEarly childhood dietand T1 DM ?and T1 DM ?

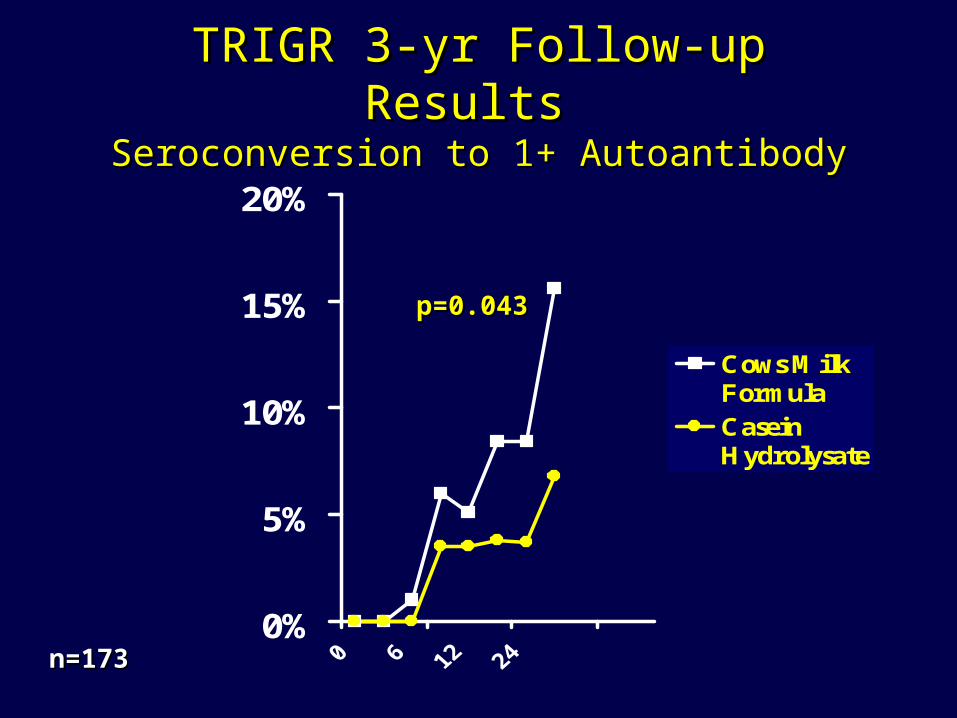
TRIGR 3-yr Follow-up Results TRIGR 3-yr Follow-up Results Seroconversion to 1+ AutoantibodySeroconversion to 1+ Autoantibody
0%
5%
10%
15%
20%
Cows MilkFormulaCaseinHydrolysate
p=0.043p=0.043
n=173n=173

Exposure to cow’s milk and islet autoimmunity
0.1
1
10
<3m
Norris et al., JAMA 1996
0.1
1
10
1-3m 4-6m 7+m
Norris, et al., JAMA 2003
N=1,181
Similar results:Hummel 2000Couper 1999
Odds Ratio Relative Risk
Rewers
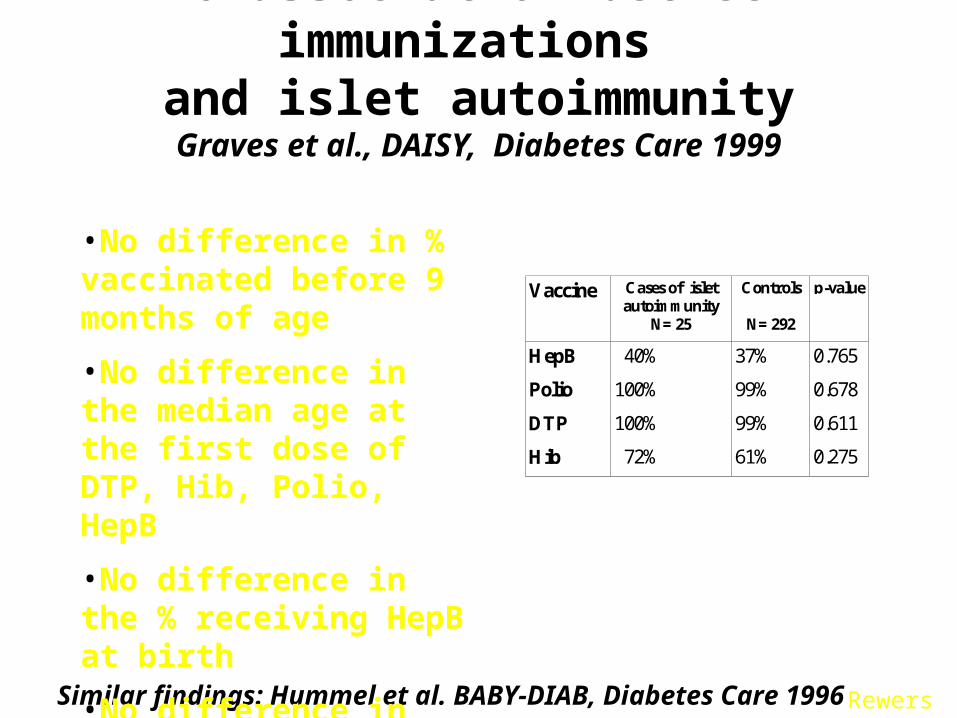
Similar findings: Hummel et al. BABY-DIAB, Diabetes Care 1996
No association between immunizations and islet autoimmunity
Graves et al., DAISY, Diabetes Care 1999
Vaccine Cases of isletautoimmunity
N= 25
Controls
N= 292
p-value
HepB
Polio
DTP
Hib
40%
100%
100%
72%
37%
99%
99%
61%
0.765
0.678
0.611
0.275
•No difference in % vaccinated before 9 months of age
•No difference in the median age at the first dose of DTP, Hib, Polio, HepB
•No difference in the % receiving HepB at birth
•No difference in the median number of doses of Polio, DTP
Rewers
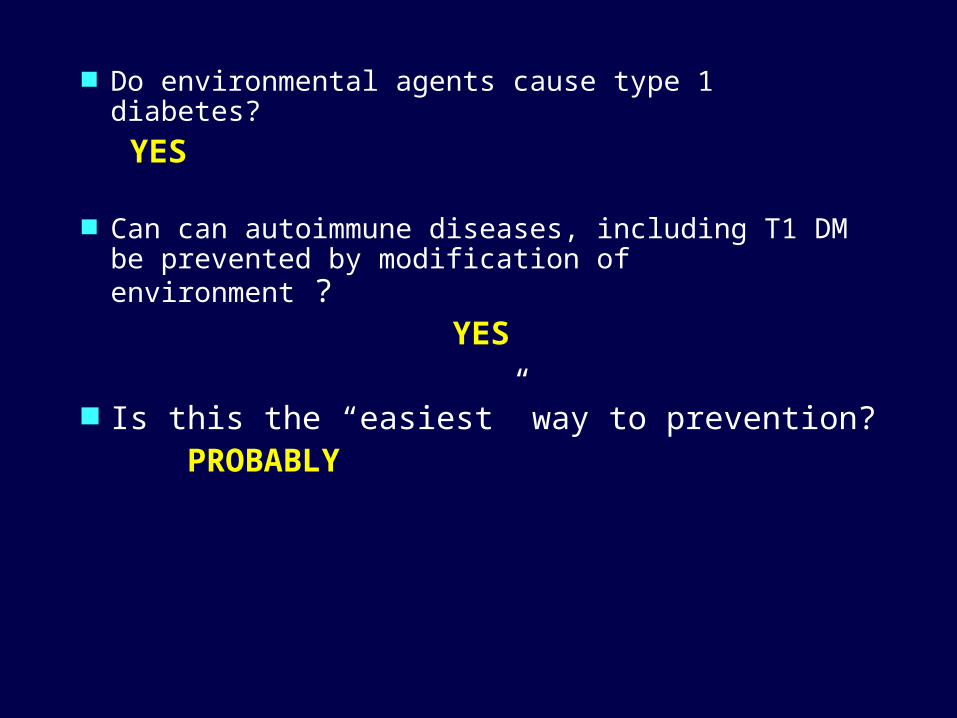
Do environmental agents cause type 1 diabetes?
YES
Can can autoimmune diseases, including T1 DM be prevented by modification of environment ?
YES
Is this the “easiest” way to prevention? PROBABLY

Where are We Today?Average A1c by Age, 2005-06
*11-18 yrs; ^the original 14 centers, unchanged compared to 1998
Age Intensive Rx Hvidoere N=1,295^
Sweden(80% of the nation)
Los AngelesN=1664
BDCDenverN=3910
DCCTN=195
EDICN=175
<6
7.5 8.0 7.8
6-12
7.9 7.8 8.2
13-18 8.1 8.4 8.6*^ 8.4 8.4* 8.6
>18
7.1 7.9 8.0 7.8
REWERS

T1D patients diagnosed in childhoodlive longer
NishmuraR, et al. Diabetes Care 2001
Duration of diabetes (yrs)
0.5
0.6
0.7
0.8
0.9
1
0 5 10 15 20 25 30 35
1975-1970-
1965-
Duration of diabetes (yrs)
0.5
0.6
0.7
0.8
0.9
1
0 5 10 15 20 25 30 35
1970-74
1965-69
1975-79
REWERS

Incidence of microvascular complications is declining
Hovind P, et al. Diabetes Care 2003
1961-65
1966-70
1966-70
1971-751971-75
1976-80 1976-80
Diabetic nephropathyProliferative diabetic retinopathy1965-691965-69
1970-741970-74
1975-79
1975-79
1980-841980-84
30
20
10
40
REWERS

Poor control of hypertension and dyslipidemia in young adult patients with T1D
7%
10%
30%
53%
Normal Treated, controlled
Treated, uncontrolled Untreated
6%11%
16%
67%
Hypertension DyslipidemiaMaahs D, Diabetes Care 2005 Wadwa P, Diabetes Care 2005
REWERS

Type 2 DiabetesType 2 Diabetes
Apparent increase in 2 diabetes in youth in several
populations – especially American Indians, Hispanics and
African Americans
Lack of population based studies
Undiagnosed cases
Cases with severe acute symptoms misclassified
Cases reported mainly by pediatric endocrinologists

Reports of Type 2 Diabetes in YouthReports of Type 2 Diabetes in Youth
Population-basedo Pimao Navajoo Cree & Ojibwayo NHANES III
School-basedo Japan
Clinic-based or Case serieso IHS
» AIo Cincinnati OH
» NHW and AAo Little Rock AK
o AA, NHWo Charleston SC
» AAo San Diego CA
» NHW, H, A, AAo Ventura CA
» Ho San Antonio TX
» H, NHW
A – Asian AmericansAI – American IndiansAA – African AmericansH - Hispanics NHW – non-Hispanic whites

Characteristics of Adolescents at Characteristics of Adolescents at Diagnosis with Type 2 Diabetes Diagnosis with Type 2 Diabetes
Most are minority children (AA, AI, H)
More girls than boys (F:M ratio = 1.7-3.0)
Mean age: 13 years
> 80% have a history of diabetes in a first degree relative
Obese (Average BMI > 30)
> 60% have acanthosis nigricans

The Changing Face of Diabetes in The Changing Face of Diabetes in YouthYouth
0
5
10
15
20
25
30
35
% w
ith ty
pe 2
87 88 89 90 91 92 93 94 95 96
Cincinnati <19 years Little Rock 8-21 years San Antonio <19 years

Type 2 by Ethnicity, Type 2 by Ethnicity, the Barbara Davis Center Experiencethe Barbara Davis Center Experience
0
20
40
60
Per
cen
t
NHW n=121 H n=12 AA n=9
Dabelea

Incidence of Type 2 Diabetes Incidence of Type 2 Diabetes in Japanese Children, in Japanese Children, 1976-19951976-1995
0
2
4
6
8
10
12
14
16In
cide
nce
per
100,
000/
year 1976-1980
1991-1995
Kitagawa et. al., Clinical Ped, 37, 1998
Age (years) 13-156-12

Prevalence of Type 2(?) DiabetesPrevalence of Type 2(?) Diabetesin Population-Based Studiesin Population-Based Studies
--per 1000 [95%CI]per 1000 [95%CI]-- New Mexico (1991-1992) Navajo Indians 12-19 years
14.1 [0-33.5] Arizona (1992-1996) Pima Indians 10-14 years
22.3 [11.1-33.5] Manitoba (1996-1997) Cree & Ojibway Indians 4-19
years
11.1[5.4-18.8] NHANES III (1988-1994) NHW, AA, H 12-19 years
4.1 [0-8.6]
Fagot-Campagna, et al., J Pediatr,136, 2000

0
1
2
3
4
5
6
7
67-76 77-86 87-96
Examination time period (years)
Pre
vale
nce
%
Boys
0
1
2
3
4
5
6
7
67-76 77-86 87-96
Examination time period (years)
5-9 years
10-14 years
15-19 years
Girls
Prevalence of Type 2 DM in Pima Indian YouthPrevalence of Type 2 DM in Pima Indian Youth
Dabelea et al., Diabetologia, 41, 1998

Recent observationsRecent observations Possible change in the phenotype of
“typical” Type 1 diabetes in youth – to more obese, with less severe clinical onset
Reports of “atypical” diabetes with mixed phenotypes in youth
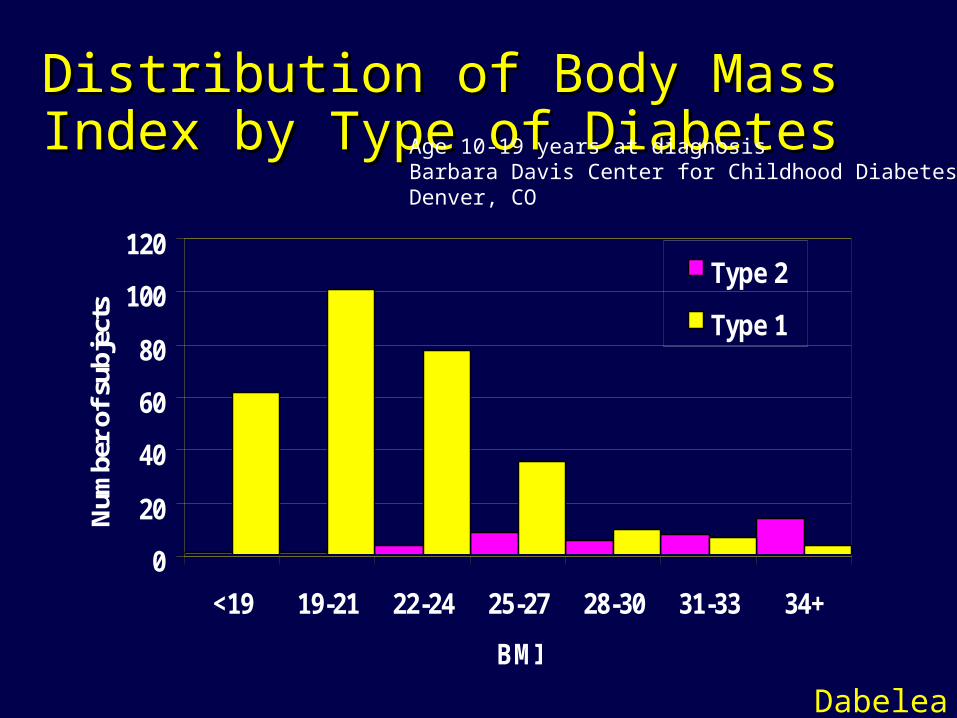
Distribution of Body Mass Index by Distribution of Body Mass Index by Type of DiabetesType of Diabetes
0
20
40
60
80
100
120
<19 19-21 22-24 25-27 28-30 31-33 34+
BMI
Num
ber
of s
ubje
cts
Type 2
Type 1
Age 10-19 years at diagnosisBarbara Davis Center for Childhood DiabetesDenver, CO
Dabelea

Incidence of Diabetes in U.S. Incidence of Diabetes in U.S. Children, by ethnicity*Children, by ethnicity*
0
5
10
15
20
25
Type 1 Type 2
Inci
denc
e (p
er 1
00,0
00/y
ear)
NHW (1)
H (1)AA (2)
AA (3)
Pima (4)
NHW, H: 0-17 years AA Type 1: 0-14 yearsAA Type 2: 10-19 yearsPima: 10-19 years
*1. Kostraba, Epidemiology, 3, 19922. Libman, Diabetes Care, 16, 19933. Pinhas-Hamiel, J Pediatr, 128,19964. Unpublished data
Is it still so?
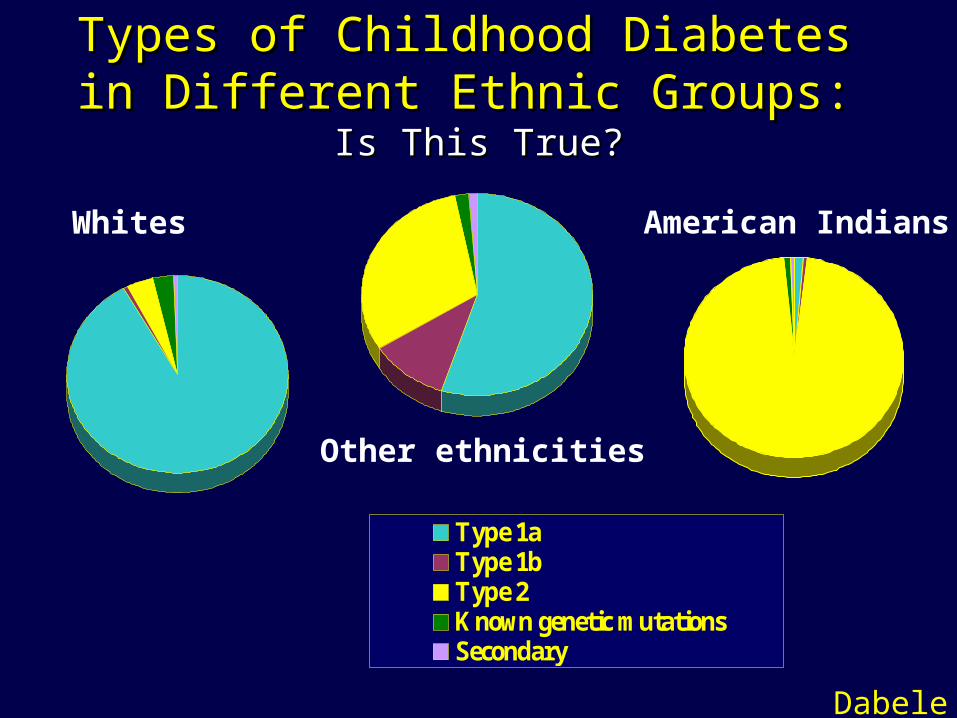
Types of Childhood Diabetes Types of Childhood Diabetes in Different Ethnic Groups: in Different Ethnic Groups:
Is This True?Is This True?
Type 1aType 1bType 2Known genetic mutationsSecondary
Whites
Other ethnicities
American Indians
Dabelea

Instructions for obtaining article and slideset:
Early infant feeding and risk of developing type 1 diabetes-associated autoantibodies. Ziegler AG, Schmid S, Huber D, Hummel M, Bonifacio E. JAMA 2003 Oct 1;290(13):1721-8
Go to http://www.biocritique.com/Sign in or register.Select the Diabetes Forum from the drop down list.Click on the Selected Articles link.In the chronological list, scroll to Oct. 6th, 2003 articles.Select Early infant feeding and risk of developing type 1 diabetes-associated autoantibodies. Ziegler AG, Schmid S, Huber D, Hummel M, Bonifacio E. JAMA 2003 Oct 1;290(13):1721-8:
The abstract will appear. Choose from many options, including Download Article & Download Slides.