climatic impacts on the runoff generation processes in ... · in contrast, in the interior snow ......
TRANSCRIPT

Climatic impacts on the runoff generation processes in British Columbia, Canada
211
Hydrology and Earth System Sciences, 6(2), 211–227 (2002) © EGS
Climatic impacts on the runoff generation processes in BritishColumbia, CanadaAthanasios Loukas1, Lampros Vasiliades2 and Nicolas R. Dalezios3
1Department of Civil Engineering, University of Thessaly, Pedion Areos, 383 34 Volos, Greece2Department of Management of Environment and Natural Resources, University of Thessaly, Fitoko, 384 46 N.Ionia, Greece3Department of Agriculture, University of Thessaly, Fitoko, 384 46 N. Ionia, Greece
Email for corresponding author: [email protected]
AbstractThe potential impact of future climate change on runoff generation processes in two southern British Columbia catchments was exploredusing the Canadian Centre for Climate Modelling Analysis General Circulation Model (CGCMa1) to estimate future changes in precipitation,temperature and cloud cover while the U.B.C. Watershed Model was used to simulate discharges and quantify the separate runoff components,i.e. rainfall, snowmelt, glacier melt and groundwater. Changes, not only in precipitation and temperature but also in the spatial distribution ofprecipitation with elevation, cloud cover, glacier extension, altitude distribution of vegetation, vegetation biomass production and plantphysiology were considered. The future climate of the catchments would be wetter and warmer than the present. In the maritime rain-fedcatchment of the Upper Campbell, runoff from rainfall is the most significant source of flow for present and future climatic conditions in theautumn and winter whereas runoff from groundwater generates the flow in spring and summer, especially for the future climate scenario. Thetotal runoff, under the future climatic conditions, would increase in the autumn and winter and decrease in spring and summer. In contrast, inthe interior snow-covered Illecillewaet catchment, groundwater is the most significant runoff generation mechanism in the autumn andwinter although, at present, significant flow is generated from snowmelt in spring and from glacier runoff in summer. In the future scenario,the contribution to flow from snowmelt would increase in winter and diminish in spring while the runoff from the glacier would remainunchanged; groundwater would then become the most significant source of runoff, which would peak earlier in the season.
Keywords: climatic change, hydrological simulation, rainfall, snowmelt, runoff processes
IntroductionThe global atmospheric concentration of carbon dioxide(CO2) has increased dramatically over the last century and,at the present rate of increase, will double by the end of thecentury. Global circulation models (GCMs) have been usedto study the effects of the increasing concentration of carbondioxide and the other greenhouse gases on the Earth’sclimate (Wilson and Mitchell, 1987; Johns et al., 1997; Boeret al., 2000). The second generation of GCMs (Manabe andStouffer, 1996; Johns et al., 1997; Boer et al., 2000; Hirstet al., 2000) are transient models and simulate the Earth’satmospheric circulation; they predict the changes intemperature, in the amount and distribution of precipitationand other climatic variables on the assumption of a rate ofincrease in CO2 concentration of 1% per annum from 1990to 2100. Such a change in climate will have important
implications on the hydrological balance and waterresources.
The most realistic and widely used approach to simulatethe effect of future changes in climate on hydrologicalprocesses is to combine the output of the GCMs with adeterministic or conceptual hydrological model that containsphysically-based mathematical descriptions of hydrologicalphenomena (Kite, 1993; Gellens and Roulin, 1998; Leungand Wigmosta, 1999; Hamlet and Lettenmaier, 1999). Thisapproach is realistic, although there are inherentuncertainties about the details of regional climate changes.The major problem with the current generation of globalclimate models is the limitation in their spatial resolutionand the resolution of the output. Usually, the output of GCMsis given for a much larger scale than that of even a largecatchment. Interpolation techniques (McCabe and Wolock,

Athanasios Loukas, Lampros Vasiliades and Nicolas Dalezios
212
1999), statistical downscaling (Brandsma and Buishand,1997; Wilby et al., 1999) and downscaling through couplingof GCM output and regional meteorological models (Leungand Wigmosta, 1999; Miller et al., 1999) are all methodsthat have been used to overcome the limitation of the spatialresolution of the GCMs (IPCC, 1999).
However, other uncertainties in the results of such coupledsimulations may be due to errors in the GCM simulationand/or the hydrological simulation. The main sources ofGCM uncertainty (IPCC, 1999) are: (a) uncertainty in thefuture greenhouse gas concentration and aerosol emissions,(b) uncertainty in global climate sensitivity assessed bydifferent GCMs because of the way the physical processesand feedback mechanisms are simulated within the variousGCMs, and (c) uncertainty in regional climate changes dueto differences in the results of different GCMs for the samemean global warming. The uncertainty of the hydrologicalsimulations results from: (d) the representation of thephysical processes (model or parameter error), and (e) thedata used to drive the hydrological model (data error)(Kaleris et al., 2001). Since this study examines the relativesensitivity of the runoff processes to the possible futureclimate change, it is assumed that the output of the GCM isreliable and the above uncertainties are not tested. On theother hand, the overall validity of the hydrologicalsimulations is tested against historical flow data.
In Canada, most studies of the effects of climate changeon catchment hydrology have concentrated on those wheresnowmelt is the major proportion of the streamflow, mainlybecause climate has a strong influence on snowpack, itsmelting rate and melting period. However, it is alsoimportant to analyse and compare the effects of climatechange on rain-fed and snowmelt catchments. A few studies(Kite, 1993; Loukas and Quick, 1996, 1999) have consideredthe effects of climate change on vegetation distribution andtranspiration as well as on changes in temperature andprecipitation. Most studies assume that the basin itselfremains unchanged and ignore changes in vegetation patternand physiology as well as changes in meteorologicalvariables, other than precipitation and temperature, that mayresult from climate change. For example, climate changewill affect not only the precipitation and temperature butalso the distribution of glaciers; soil processes such asdrainage capacity and soil quality; land surface processessuch as erosion; characteristics, type and coverage ofvegetation. Furthermore, some meteorological variables maybe affected by feedback mechanisms. For example, climatechange would change not only the relative proportion ofrain and snow but also the spatial distribution of precipitationand cloud cover.
This study investigates the possible impacts of climate
change on the runoff processes of two mountainouscatchments located in different climatic regions of BritishColumbia, Canada, by considering the meteorological andvegetative factors that are likely to be affected by the climatechange scenario. The latest version of the U.B.C. WatershedModel (Version 4) (Quick, 1995), used here to estimate therunoff from the catchments, can account for changes in thevegetation cover and physiology, elevation, aspect, cloudcover and other meteorological factors. The objectives ofthis study are:
1. to incorporate the most important meteorological andgeophysical variables that, under an altered climatescenario, are likely to change and influence the runoff(i.e. precipitation, temperature, spatial distribution ofprecipitation with elevation, cloud cover, glacierextension, altitude distribution of vegetation, vegetationbiomass production and plant physiology);
2. to determine the runoff generation processes in twobasins located in two climatically different areas ofBritish Columbia under present and future climateconditions;
3. to evaluate and compare the importance of the runoffgeneration processes for present and future climaticconditions.
Study areas and data baseThe U.B.C. Watershed Model has been applied to twocontrasting catchments in British Columbia, the UpperCampbell and the Illecillewaet. The Upper Campbell, arugged 1194 km2 basin to the east of the Vancouver IslandMountains, peaks at 2200 m with a mean basin elevationof 950 m and drains to the north and east into the Strait ofGeorgia (Fig. 1). The lower elevations of the catchmentare dammed by a reservoir, 50 km long and 5 km wide,which controls the Upper Campbell and Buttle Lakes.
The climate is maritime with mild wet winters and warmdry summers. Most precipitation is generated by cyclonicfrontal systems that develop over the North Pacific Oceanand travel eastwards. The mean annual precipitation is about2000 mm, of which about 60% is rain. The wettest period,receiving 75% of the total annual precipitation, is betweenNovember and March. Significant snowpacks accumulate,especially at upper elevations; some melt occurs even duringthe accumulation period from October to April and fromMay onwards until the disappearance of snow at the higherelevations, usually by mid-August, melt occurs rapidly.
Although measurements were made at two meteorologicalstations in the catchment at 370 m and 1470m, daily
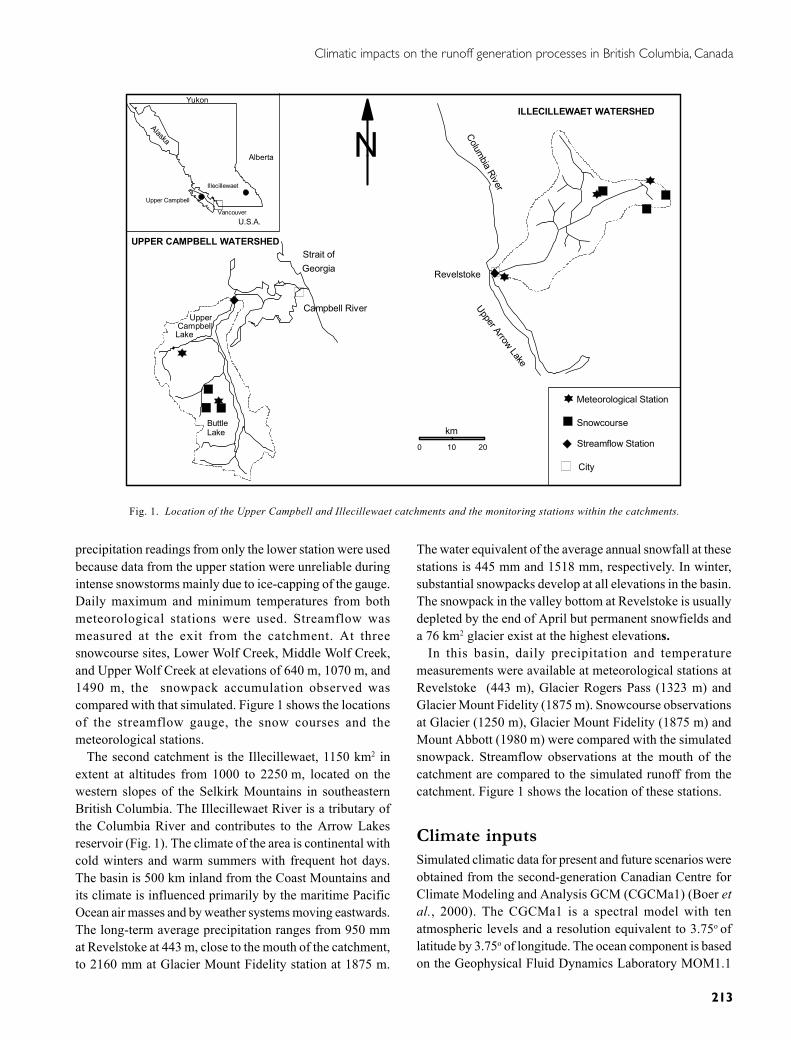
Climatic impacts on the runoff generation processes in British Columbia, Canada
213
precipitation readings from only the lower station were usedbecause data from the upper station were unreliable duringintense snowstorms mainly due to ice-capping of the gauge.Daily maximum and minimum temperatures from bothmeteorological stations were used. Streamflow wasmeasured at the exit from the catchment. At threesnowcourse sites, Lower Wolf Creek, Middle Wolf Creek,and Upper Wolf Creek at elevations of 640 m, 1070 m, and1490 m, the snowpack accumulation observed wascompared with that simulated. Figure 1 shows the locationsof the streamflow gauge, the snow courses and themeteorological stations.
The second catchment is the Illecillewaet, 1150 km2 inextent at altitudes from 1000 to 2250 m, located on thewestern slopes of the Selkirk Mountains in southeasternBritish Columbia. The Illecillewaet River is a tributary ofthe Columbia River and contributes to the Arrow Lakesreservoir (Fig. 1). The climate of the area is continental withcold winters and warm summers with frequent hot days.The basin is 500 km inland from the Coast Mountains andits climate is influenced primarily by the maritime PacificOcean air masses and by weather systems moving eastwards.The long-term average precipitation ranges from 950 mmat Revelstoke at 443 m, close to the mouth of the catchment,to 2160 mm at Glacier Mount Fidelity station at 1875 m.
The water equivalent of the average annual snowfall at thesestations is 445 mm and 1518 mm, respectively. In winter,substantial snowpacks develop at all elevations in the basin.The snowpack in the valley bottom at Revelstoke is usuallydepleted by the end of April but permanent snowfields anda 76 km2 glacier exist at the highest elevations.
In this basin, daily precipitation and temperaturemeasurements were available at meteorological stations atRevelstoke (443 m), Glacier Rogers Pass (1323 m) andGlacier Mount Fidelity (1875 m). Snowcourse observationsat Glacier (1250 m), Glacier Mount Fidelity (1875 m) andMount Abbott (1980 m) were compared with the simulatedsnowpack. Streamflow observations at the mouth of thecatchment are compared to the simulated runoff from thecatchment. Figure 1 shows the location of these stations.
Climate inputsSimulated climatic data for present and future scenarios wereobtained from the second-generation Canadian Centre forClimate Modeling and Analysis GCM (CGCMa1) (Boer etal., 2000). The CGCMa1 is a spectral model with tenatmospheric levels and a resolution equivalent to 3.75o oflatitude by 3.75o of longitude. The ocean component is basedon the Geophysical Fluid Dynamics Laboratory MOM1.1
Vancouver
Alberta
U.S.A.
Alaska
Yukon
Upper Campbell
Illecillewaet
0 10 20
km
UPPER CAMPBELL WATERSHED
ILLECILLEWAET WATERSHED
Columbia River
Revelstoke
Upper Arrow Lake
Campbell River
Strait ofGeorgia
Upper CampbellLake
Buttle Lake
Meteorological Station
Snowcourse
Streamflow Station
City
N
Fig. 1. Location of the Upper Campbell and Illecillewaet catchments and the monitoring stations within the catchments.
Athanasios Loukas, Lampros Vasiliades and Nicolas Dalezios
214
model with a resolution of roughly 1.8o of latitude by 1.8o
of longitude and 29 vertical levels.The CGCMa1 simulations used in this study are transient.
Each simulation includes observed increases in atmosphericconcentration of CO2 from 1900 to 1989 and subsequentincreases in atmospheric concentration of CO2 of 1% peryear to the end of this century. Compared to the decade ofthe 1980s, this implies a doubling of CO2 near the year 2050and a tripling of CO2 near the year 2100. The CGCMa1simulations also include the direct effects of sulphateaerosols.
For the year 2100, the output from this model shows aglobally averaged surface temperature increase of 2.7oC anda 4% increase in precipitation. These values are consistentwith the predictions of other second generation transientGCMs (IPCC, 1999).
Using the model, monthly values of climatologicalvariables such as precipitation, minimum and maximumtemperature and cloud cover were estimated for the period1970 to 1990 (present climate) and for 2080–2100 (futureclimate) at a number of grid points near the study basins.Although the output of GCMs is considered to be a realisticrepresentation of the response of the atmosphere to theincrease in concentration of greenhouse gases, there are stillmany uncertainties in climatic simulations from GCMs. Thisis particularly true for mountainous regions such as BritishColumbia where the GCM uses an over-smoothed terrainrather than detailed topographical features. Hence, todevelop regional GCM-based scenarios at the sub-grid scale,a procedure known as “downscaling” has been adopted(IPCC, 1999); it includes interpolation techniques (McCabeand Wolock, 1999), statistical downscaling (Brandsma andBuishand, 1997; Wilby et al., 1999), spatial disaggregation(Mehrotra and Singh, 1998) and downscaling throughcoupling of GCM output and regional meteorologicalmodels (Leung and Wigmosta, 1999; Miller et al., 1999).
However, statistical downscaling of GCM predictions anddownscaling of GCM simulations through regionalmeteorological modelling driven by the GCM boundaryconditions in the Pacific Northwest (Hamlet andLettenmaier, 1999) showed that these methods cannotreproduce the decadal and interannual climatic variabilityand, consequently, the observed streamflow. Also, the GCMsimulations are not, in general, synchronised with observedhistoric events. Hence, in the present study, only the spatiallyaveraged changes of the CGCMa1-estimated monthly valuesof precipitation, minimum and maximum temperature forthe present climate (1970–1990) and the predicted futureclimate (2080–2100) were used in the comparison. Then,the historically recorded daily station measurements for theperiod 1970–1990 were adjusted by these monthly changesto produce climatic estimates for the period 2080–2100. Thisprocedure is often called the “delta” method of downscalingof GCM simulations, because it superimposes the predictedchanges on the historical records. This relatively simpledownscaling approach alters the long-term mean of theclimatic data for each month, while preserving most aspectsof the observed variability (Hamlet and Lettenmaier, 1999).Hay et al., 2000 compared downscaled GCM output usingthe “delta” method with a statistical downscaling techniquein three mountainous catchments in the USA and showedthat the simple “delta” method gives reasonable results.
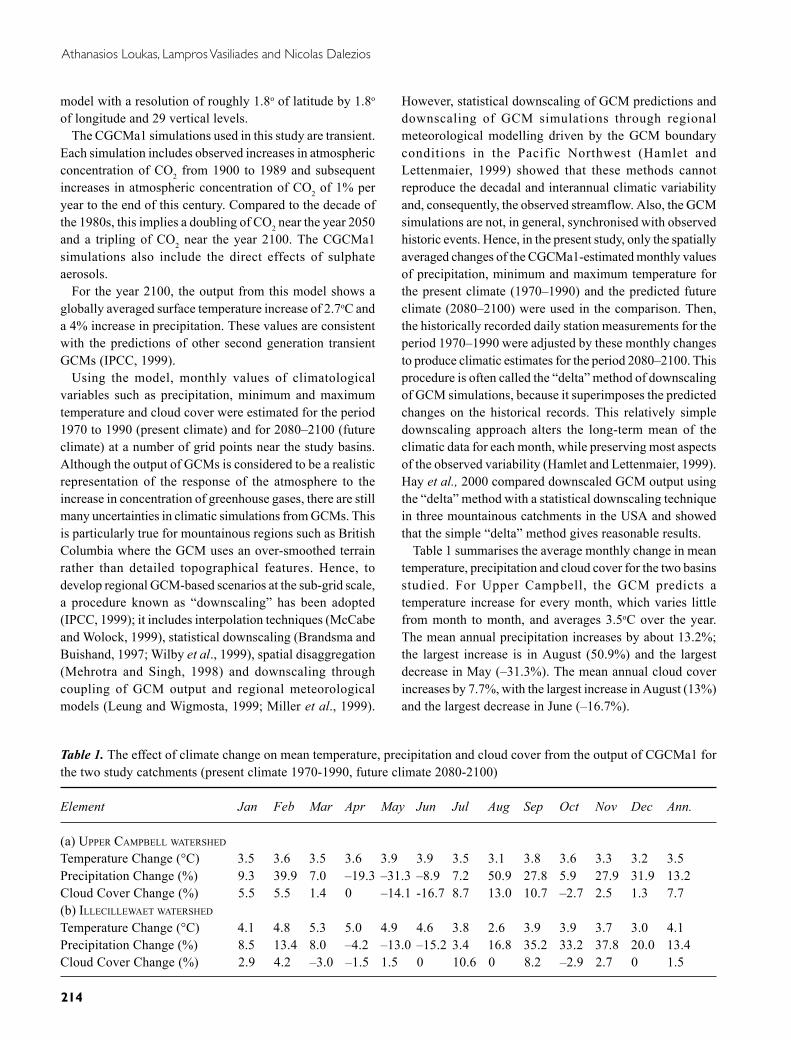
Table 1 summarises the average monthly change in meantemperature, precipitation and cloud cover for the two basinsstudied. For Upper Campbell, the GCM predicts atemperature increase for every month, which varies littlefrom month to month, and averages 3.5oC over the year.The mean annual precipitation increases by about 13.2%;the largest increase is in August (50.9%) and the largestdecrease in May (–31.3%). The mean annual cloud coverincreases by 7.7%, with the largest increase in August (13%)and the largest decrease in June (–16.7%).
Table 1. The effect of climate change on mean temperature, precipitation and cloud cover from the output of CGCMa1 forthe two study catchments (present climate 1970-1990, future climate 2080-2100)
Element Jan Feb Mar Apr May Jun Jul Aug Sep Oct Nov Dec Ann.
(a) UPPER CAMPBELL WATERSHED
Temperature Change (°C) 3.5 3.6 3.5 3.6 3.9 3.9 3.5 3.1 3.8 3.6 3.3 3.2 3.5Precipitation Change (%) 9.3 39.9 7.0 –19.3 –31.3 –8.9 7.2 50.9 27.8 5.9 27.9 31.9 13.2Cloud Cover Change (%) 5.5 5.5 1.4 0 –14.1 -16.7 8.7 13.0 10.7 –2.7 2.5 1.3 7.7(b) ILLECILLEWAET WATERSHED
Temperature Change (°C) 4.1 4.8 5.3 5.0 4.9 4.6 3.8 2.6 3.9 3.9 3.7 3.0 4.1Precipitation Change (%) 8.5 13.4 8.0 –4.2 –13.0 –15.2 3.4 16.8 35.2 33.2 37.8 20.0 13.4Cloud Cover Change (%) 2.9 4.2 –3.0 –1.5 1.5 0 10.6 0 8.2 –2.9 2.7 0 1.5

Climatic impacts on the runoff generation processes in British Columbia, Canada
215
The results for the Illecillewaet show similar changes(Table 1). The annual average temperature increases by4.1oC with larger increases during the winter and springmonths. The average annual precipitation increases by13.4% with November exhibiting the largest increase(37.8%) and June the largest decrease (–15.2%). The meanannual increase in cloud cover is small (1.5%) but it variesmonthly from 10.6% in July to –3% in March.
Hydrological model — modellingapproachThe U.B.C. Watershed Model (Quick and Pipes, 1976) withsubsequent updates has been used to simulate the effect ofclimate change on the runoff of the two catchments. Thismodel has been shown to be applicable to diverse climaticregions, ranging from coastal to inland mountain regions ofBritish Columbia including the Rocky Mountains and thesubarctic region of Canada (Assaf and Quick, 1991a;Hudson and Quick, 1997; Micovic and Quick, 1999; Druce,2001). The model has also been successful in the Himalayasand Karakoram ranges in India and Pakistan, the SouthernAlps in New Zealand and the Snowy Mountains in Australia(Khan, 1995; Singh and Kumar, 1997).
From input data of precipitation and maximum andminimum air temperatures, the U.B.C. calculates daily orhourly streamflow. Originally designed to simulatestreamflow from mountainous catchments, where runofffrom snowpack and glacier melt may be important, themodel conceptualises the catchments as a number of altitudebands, since meteorological and hydrological processes arefunctions of elevation in upland catchments; indeed,orographic gradients of precipitation and temperature aremajor determinants of hydrological behaviour inmountainous catchments. These gradients are assumed tobehave similarly for each storm event so that, based ontemperature, the model estimates whether precipitation fallsas rain or snow and estimates snowpack accumulation as afunction of elevation. A simplified energy budget approach,based only on data of maximum and minimum temperatureis used to estimate snowmelt (Quick, 1995). Furthermore,the geophysical characteristics of each elevation band in acatchment, such as impermeable area, forested areas,vegetation density, open areas, aspect and glaciated areascan be estimated from maps or remotely sensed data, on theassumption of homogeneity of the characteristics withineach elevation band.
For each band, the runoff from rainfall, snowmelt andglacier melt is distributed into four runoff components by asoil moisture control mechanism which represents the non-linear behaviour of the catchment. This mechanism
apportions the water from rainfall, snowmelt and glaciermelt into fast or surface runoff, medium or interflow runoff,slow or upper zone groundwater runoff and the very slowor deep zone groundwater runoff. For each elevation band,the water that reaches the soil surface, after interceptionand sublimation, is divided into fast surface runoff andinfiltrated water. The water infiltrated satisfies the soilmoisture deficit and the evapotranspiration and then passesto groundwater or runs off as interflow. The groundwater isfurther divided into upper and lower groundwater zones.When the soil moisture accounting sub-routine has beenapplied to all the elevation bands, each runoff component isrouted to the catchment outlet by the flow routing sub-routine.
The flow routing uses the linear reservoir cascadetechnique, which simplifies, significantly, the modelstructure, conserves the water mass, and provides a simpleand accurate water budget balance. The flow routingvariables are: the snowmelt and rainfall fast runoff timeconstants, the snowmelt and rainfall interflow timeconstants, the glacier time constant, the upper groundwatertime constant and the deep zone groundwater time constant.The summation of the runoff from all bands and for all runoffcomponents gives the catchment runoff for the time step.Apart from the total runoff, the U.B.C. model providesinformation on snow-covered area, snowpack waterequivalent, potential and actual evapotranspiration, soilmoisture, interception losses, groundwater storage, surfaceand subsurface runoff for each elevation band separatelyand for the whole catchment.
In the present study, the Canadian Centre for ClimateModeling Analysis GCM (CGCMa1) has estimated thechanges in precipitation, temperature, and cloud cover. Thechanges in tree cover, density and physiology as well as thechanges in the areal extension of glacierised areas have beenestimated using contemporary methods. The key featuresof the model are its capability to incorporate changes intree cover and density and cloud cover in calculating theresulting change in radiation energy exchange. Thefollowing can be computed:
1. Changes in the form of precipitation from snow to rainand the corresponding changes in precipitation gradientswith altitude in the catchments;
2. Changes in snowmelt between forested and open areas,including the effects of north and south aspect,calculation of modifications in albedo and cloud coverand the consequent short-wave energy changes. Theenergy budget routine is especially important for thistype of study and has been well proven in other studies(Assaf et al., 1995; Micovic and Quick, 1999);

Athanasios Loukas, Lampros Vasiliades and Nicolas Dalezios
216
3. Changes in glacial melt, which depend on the energybudget and are particularly sensitive to early melting ofthe seasonal snowcover on the glacier;
4. Changes in evapotranspiration estimated according tovegetation and temperature, but modified by theenhanced CO2 effect on stomata.
TEMPERATURE
In the U.B.C. model, the temperature data are distributedover the elevation range of the catchment according to twotemperature lapse rates, one for the maximum temperatureand one for the minimum temperature. Furthermore, themodel distinguishes rainy conditions from clear sky and dryweather conditions. In rainy conditions, the lapse rate is thesaturated adiabatic rate, while in dry weather the lapse rateis the dry adiabatic rate during the warm part of the day butat night, it is low and occasionally zero. The lapse rate iscalculated for each day using the diurnal temperature rangeas an index (Quick, 1995). The historical temperature dataare adjusted by the mean monthly temperature changespredicted by the GCM (Table 1) to produce the future climatetemperature estimates.
PRECIPITATION AND ITS SPATIAL DISTRIBUTION
The average monthly changes of precipitation (Table 1) wereapplied to the daily meteorological measurements used inthis study to estimate precipitation under the altered climaticconditions. However, in addition to the changes inprecipitation amount, global warming would increase therainfall and reduce the snowfall so that the spatialdistribution of precipitation and the runoff response will beaffected. Storr and Ferguson (1972) studied three Albertacatchments and concluded that the altitudinal gradient ofsnowfall was ten times that of rainfall. Similar conclusionshave been reached in another study in coastal BritishColumbia (Schaefer and Nikleva, 1973). The U.B.C. modelcalculates the precipitation in any elevation band using theequation,
100,,1,, )1(
elev
ljilji GRADRPPRPR∆
+ +⋅= (1)
where PRi,j,l is the precipitation from meteorological stationi for day j and elevation band l, GRADRP is the percentageprecipitation gradient, and ∆elev is the elevation differencebetween the meteorological station and the elevation band.The U.B.C. model, then, adjusts the precipitation gradientaccording to the temperature,
)(' TSTGRADRPGRADRP −= (2)
where ST(T) is affected by the stability of the air mass. TheST(T) parameter is related (Quick, 1995) to the square ofthe ratio of the saturated, LS, and dry, LD, adiabatic lapse
rates: i.e. LL
S
D
2. A plot of L
LS
D
2 versus temperature
reveals an almost linear variation between -30oC and +20oCwith a gradient of 0.01. Hence, ST(T) can be estimated as,
meanTTST ⋅= 01.0)( (3)
where Tmean is the mean daily temperature.Due to the change in the form of precipitation from snow
to rain under the future climate and the different gradientsused for the distribution of rainfall and snowfall over theelevation range of the catchment, the average basin valuesof total precipitation produced by the hydrologicalsimulations, differ from those based on the station data.Thus, the average future precipitation change may not agreewith the estimates obtained by imposing the CGCMa1 outputon the historic station data.
CLOUD COVER
Another meteorological variable that changes under theclimate change scenario is cloud cover, which controls theincoming solar radiation and long wave radiation from theclouds. Changes in these variables affect the energy balanceon the Earth’s surface, which influences the temperature,evapotranspiration and snowmelt rates. In British Columbiaan increase of 25% in cloud cover caused the snowpack tomelt about 15 to 20 days early (Assaf and Quick, 1991b).Although cloud cover is an output parameter of the GCM,in the U.B.C. model the cloud cover is calculated using airtemperature data.
The U.B.C. model calculates the cloud cover, CLL, as afunction of the daily maximum and minimum temperature,Tmax and Tmin as:
RL DT
TTCL minmax1
−−= (4)
where DTR is the diurnal temperature range for open skyconditions. This daily cloud cover, calculated for presentclimatic conditions is, then, modified by the monthlychanges of cloud cover estimated by the CGCMa1 outputfor present (1970–1990) and future (2080–2100) climates(Table 1), to produce the cloud cover for the future climaticscenario.

Climatic impacts on the runoff generation processes in British Columbia, Canada
217
VEGETATION
Vegetation exerts a major influence on the microclimate ofa particular site, regulating the temperature, moisture andwind regime; this, in turn, influences the quantity and qualityof runoff. Changes in vegetation can decreaseevapotranspiration, increase erosion and degrade waterquality. These changes in evapotranspiration can thenincrease the availability of water and hence the runoff froma particular site. Also, the vegetation coverage affects theinterception losses and the antecedent soil moistureconditions.
Recent studies have dealt with the effects of climatechange on vegetation. Those identified so far are a decreasein transpiration due to stomatal closure (Cure and Acock,1986; Parry, 1992), an increase in the production of biomass(Post et al., 1992) which may offset the decrease oftranspiration due to stomatal closure and areal and altitudinalredistribution of vegetation. Zoltai (1988) estimated thatthere would be only a small areal change in the PacificCordilleran ecoclimatic region, which covers western BritishColumbia, and in the Cordilleran ecoclimatic province,which covers the Rocky Mountains and the northern interiorof British Columbia; hence, any change in these two regionsshould be restricted to altitudinal shift in the vegetation.Recent studies (Ozenda and Borel, 1990; Fanta, 1992)indicated that a 1oC rise in temperature would raise thealtitudinal boundaries of the tree line by 100–180 m in theEuropean Alps and the Central European Mountains so thattrees would occupy most of the present alpine zone (Korner,1992).
In the present study, the mean annual change intemperature for the future climate scenario was used tocalculate the upward shift of vegetation. Tables 2 and 3 listthe percentages of land use in each elevation band for eachclimate scenario in each catchment. In the Upper Campbell,the first elevation band is occupied by the Upper Campbelland Buttle lakes, which are classed with rock outcrops inthe UBC model as impermeable areas. Under the futureclimate scenario, the second elevation band will be occupiedby deciduous trees like arbutus and garry oak which nowoccupy the coastal fringe of the southeast Vancouver Island;also, a reduction of the impermeable area is expected becauseof the increase in the vegetation coverage (Table 2).
In the Illecillewaet, at the two lowest elevation bands, thegrass area expands at the expense of the forest and theimpermeable area (Table 3). These changes in land use areconsistent with the results of previous studies (Smith et al.,1992; Kite, 1993; Loukas and Quick, 1999).
In agreement with previous plant physiological (Cure andAcock, 1986; Parry, 1992) and hydrological studies (Wigleyand Jones, 1985; Kite, 1993), an increase of 30% in CO2
concentration will reduce transpiration from the vegetationdue to the closure of stomata. Also, increased net ecosystemproduction results from the increase in the forested area andthe tree canopy density (Tables 2 and 3). However, thesechanges are highly qualitative since there is no way ofexpressing more quantitatively the effect of climate changeon biomass production.
Table 2. Description of land uses by elevation band of Upper Campbell catchment
Band 1 2 3 4 5 6 7Mean Elevation of Band (m) 223 406 721 983 1238 1485 1939Area of Band(km2) 66.7 218.4 218.4 218.4 218.4 218.4 34.8
(a) Present Climate (1970-1990)Forested Area(%) 0 90 90 90 70 50 25Tree Canopy Density (%) 0 90 90 90 80 60 60Impermeable Area* (%) 100 10 10 10 30 50 75
Grassland Area (%) 0 0 0 0 0 0 0
(b) Future Climate (2080-2100)Forested Area (%) 0 95 100 100 95 90 90Tree Canopy Density (%) 0 60 95 95 95 95 95Impermeable Area* (%) 100 5 0 0 5 10 10Grassland Area (%) 0 0 0 0 0 0 0
* The impermeable area represents rock outcrops and water surfaces
Athanasios Loukas, Lampros Vasiliades and Nicolas Dalezios
218
GLACIERS
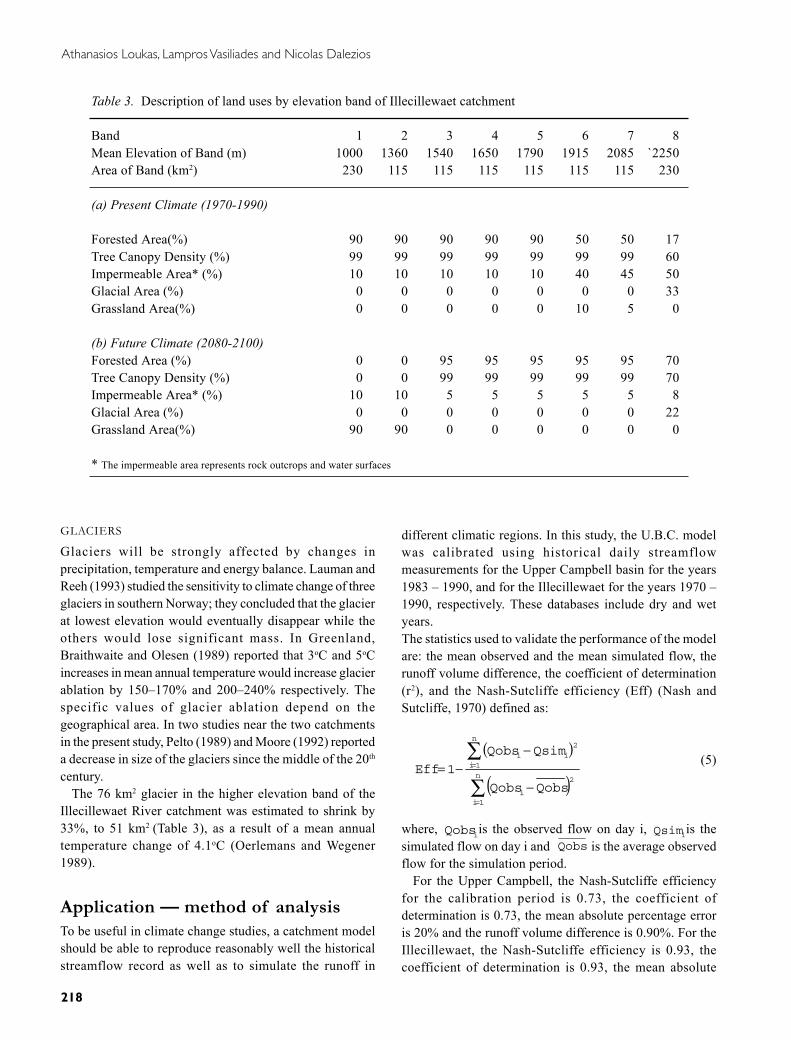
Glaciers will be strongly affected by changes inprecipitation, temperature and energy balance. Lauman andReeh (1993) studied the sensitivity to climate change of threeglaciers in southern Norway; they concluded that the glacierat lowest elevation would eventually disappear while theothers would lose significant mass. In Greenland,Braithwaite and Olesen (1989) reported that 3oC and 5oCincreases in mean annual temperature would increase glacierablation by 150–170% and 200–240% respectively. Thespecific values of glacier ablation depend on thegeographical area. In two studies near the two catchmentsin the present study, Pelto (1989) and Moore (1992) reporteda decrease in size of the glaciers since the middle of the 20th
century.The 76 km2 glacier in the higher elevation band of the
Illecillewaet River catchment was estimated to shrink by33%, to 51 km2 (Table 3), as a result of a mean annualtemperature change of 4.1oC (Oerlemans and Wegener1989).
Application — method of analysisTo be useful in climate change studies, a catchment modelshould be able to reproduce reasonably well the historicalstreamflow record as well as to simulate the runoff in
different climatic regions. In this study, the U.B.C. modelwas calibrated using historical daily streamflowmeasurements for the Upper Campbell basin for the years1983 – 1990, and for the Illecillewaet for the years 1970 –1990, respectively. These databases include dry and wetyears.The statistics used to validate the performance of the modelare: the mean observed and the mean simulated flow, therunoff volume difference, the coefficient of determination(r2), and the Nash-Sutcliffe efficiency (Eff) (Nash andSutcliffe, 1970) defined as:
( )
( )∑
∑
=
=
−
−−=
n
1i
2
i
n
1i
2
ii
QobsQobs
QsimQobs
1Eff(5)
where, iQobs is the observed flow on day i,
iQsim is thesimulated flow on day i and Qobs is the average observedflow for the simulation period.
For the Upper Campbell, the Nash-Sutcliffe efficiencyfor the calibration period is 0.73, the coefficient ofdetermination is 0.73, the mean absolute percentage erroris 20% and the runoff volume difference is 0.90%. For theIllecillewaet, the Nash-Sutcliffe efficiency is 0.93, thecoefficient of determination is 0.93, the mean absolute
Table 3. Description of land uses by elevation band of Illecillewaet catchment
Band 1 2 3 4 5 6 7 8Mean Elevation of Band (m) 1000 1360 1540 1650 1790 1915 2085 `2250Area of Band (km2) 230 115 115 115 115 115 115 230
(a) Present Climate (1970-1990)
Forested Area(%) 90 90 90 90 90 50 50 17Tree Canopy Density (%) 99 99 99 99 99 99 99 60Impermeable Area* (%) 10 10 10 10 10 40 45 50Glacial Area (%) 0 0 0 0 0 0 0 33Grassland Area(%) 0 0 0 0 0 10 5 0
(b) Future Climate (2080-2100)Forested Area (%) 0 0 95 95 95 95 95 70Tree Canopy Density (%) 0 0 99 99 99 99 99 70Impermeable Area* (%) 10 10 5 5 5 5 5 8Glacial Area (%) 0 0 0 0 0 0 0 22Grassland Area(%) 90 90 0 0 0 0 0 0
* The impermeable area represents rock outcrops and water surfaces

Climatic impacts on the runoff generation processes in British Columbia, Canada
219
percentage error is 21% and the runoff volume difference is–0.73 %. These runoff statistics and the comparison ofsimulated and observed hydrographs for wet and dry yearsindicate that the model simulates the recorded streamflowwell.
To test the model’s ability to simulate snow accumulation,the simulated snow accumulation was compared withobservations from snowcourses. Of course, the simulatedvalues are averaged over the area of the elevation band orbands, whereas the observations represent the accumulationat the location of the snowcourse. Only the comparisonswith the snowcourses at the higher elevations where deepsnowpacks are observed and their melting affects the runoffvolume and its distribution in the two catchments arepresented here.
For the Upper Campbell, the simulated snow accumulationin elevation band 6 (mean elevation 1485 m) was comparedwith measurements at the Upper Wolf Creek snowcourse
Snow Accumulation 1984 - 85 (D ry Ye ar)
0
250
500
750
1000
1250
1500
1750
2000
O ct N ov Dec Jan Feb Mar Apr May Jun Jul Aug Sep
SWE
(mm
)
Simulated SWE forPresent Climate
Simulated SWE forFuture Climate
Snowcourse Data
Snow Accumulation 1986 - 87 (We t Year)
0
250
500
750
1000
1250
1500
1750
2000
O ct N ov Dec Jan Feb Mar Apr May Jun Jul Aug Sep
SWE
(mm
)
Simulated SWE forPresent C limate
Simulated SWE forFuture Climate
Snowcourse Data
(a)
(b)
Fig. 2. Comparison between the simulated snow accumulation for present and future climate andthe observed data from Upper Wolf Creek snowcourse – Upper Campbell catchment.
(1490 m) in the driest recorded year 1984–85 (Fig.2a) andthe wettest year 1986–87 (Fig. 2b). The U.B.C. modelsimulates the snowpack accumulation and its subsequentmelting reasonably well.
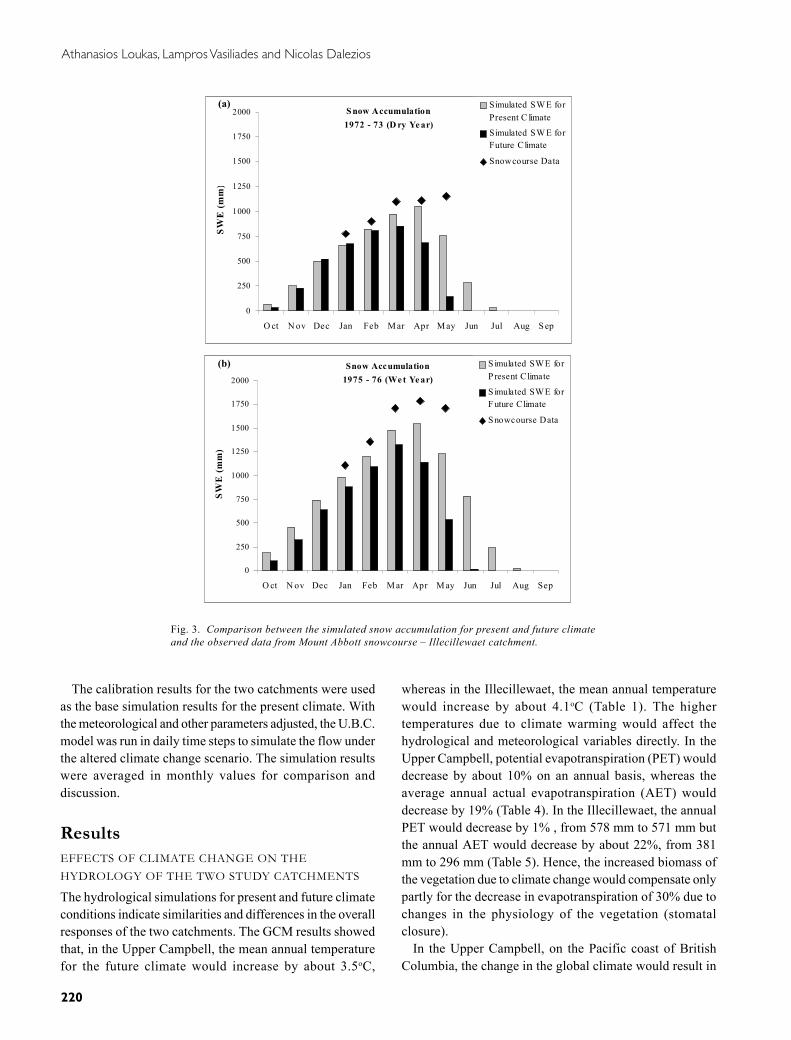
For the Illecillewaet, the simulated snow accumulation inelevation bands 6 (1915 m) and 7 (2085 m) was comparedwith snow data from the snowcourse at Mount Abbot,(1980 m) for the driest (1972–73) and wettest years (1975–76) of the 20 year record. (Fig. 3a and b) Again, the U.B.C.model estimates the snow accumulation reasonably well.In the absence of data for the melting period, no comparisonbetween simulation and observation of the snow-water-equivalent of the snowpack is possible. However, thecomparison of the simulated and observed snowpacks,together with the results of the flow calibration, indicatethat the U.B.C. model is successful in simulating the runofffrom both catchments using historical data for presentclimatic conditions.
Athanasios Loukas, Lampros Vasiliades and Nicolas Dalezios
220
The calibration results for the two catchments were usedas the base simulation results for the present climate. Withthe meteorological and other parameters adjusted, the U.B.C.model was run in daily time steps to simulate the flow underthe altered climate change scenario. The simulation resultswere averaged in monthly values for comparison anddiscussion.
ResultsEFFECTS OF CLIMATE CHANGE ON THEHYDROLOGY OF THE TWO STUDY CATCHMENTS
The hydrological simulations for present and future climateconditions indicate similarities and differences in the overallresponses of the two catchments. The GCM results showedthat, in the Upper Campbell, the mean annual temperaturefor the future climate would increase by about 3.5oC,
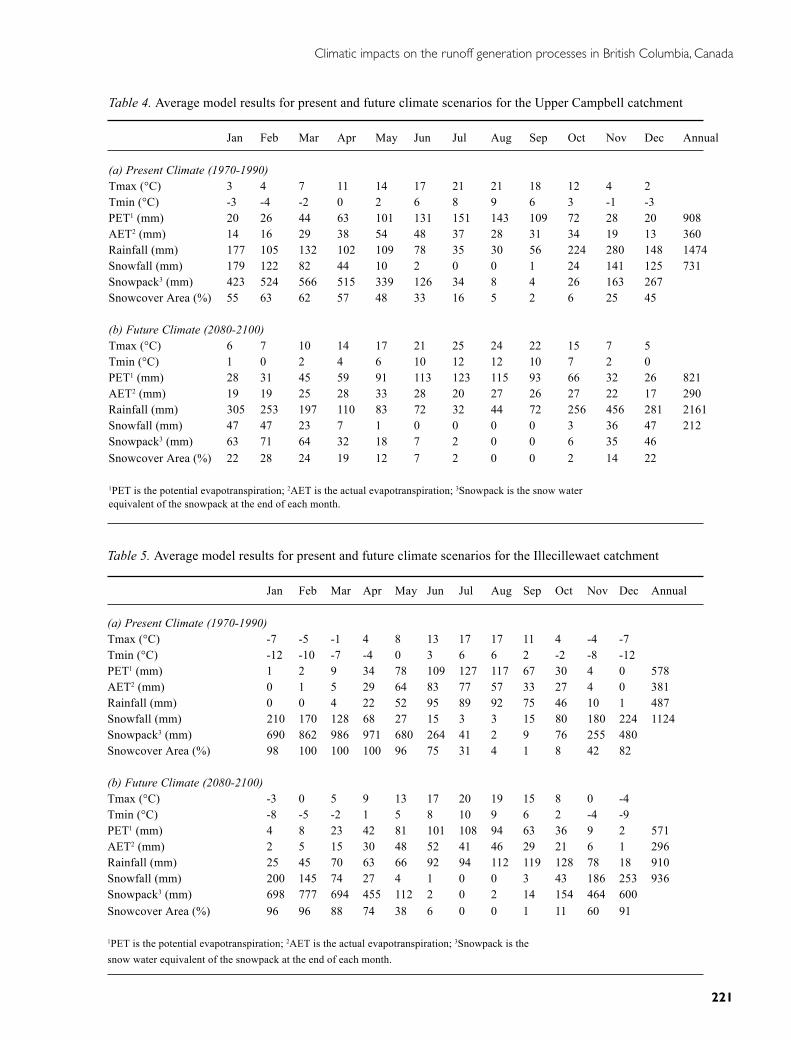
whereas in the Illecillewaet, the mean annual temperaturewould increase by about 4.1oC (Table 1). The highertemperatures due to climate warming would affect thehydrological and meteorological variables directly. In theUpper Campbell, potential evapotranspiration (PET) woulddecrease by about 10% on an annual basis, whereas theaverage annual actual evapotranspiration (AET) woulddecrease by 19% (Table 4). In the Illecillewaet, the annualPET would decrease by 1% , from 578 mm to 571 mm butthe annual AET would decrease by about 22%, from 381mm to 296 mm (Table 5). Hence, the increased biomass ofthe vegetation due to climate change would compensate onlypartly for the decrease in evapotranspiration of 30% due tochanges in the physiology of the vegetation (stomatalclosure).
In the Upper Campbell, on the Pacific coast of BritishColumbia, the change in the global climate would result in
S now Accumulation 1972 - 73 (D ry Ye ar)
0
250
500
750
1000
1250
1500
1750
2000
O ct N ov Dec Jan Feb M ar Apr M ay Jun Jul Aug S ep
SWE
(mm
)
Simulated SW E forPresent C limate
Simulated SW E forFuture Climate
Snowcourse Data
Snow Accumulation 1975 - 76 (We t Ye ar)
0
250
500
750
1000
1250
1500
1750
2000
O ct N ov Dec Jan Feb M ar Apr M ay Jun Jul Aug Sep
SWE
(mm
)
S imulated SWE forP resent Climate
S imulated SWE forF uture Climate
S nowcourse Data
(a)
(b)
Fig. 3. Comparison between the simulated snow accumulation for present and future climateand the observed data from Mount Abbott snowcourse – Illecillewaet catchment.
Climatic impacts on the runoff generation processes in British Columbia, Canada
221
Table 4. Average model results for present and future climate scenarios for the Upper Campbell catchment
Jan Feb Mar Apr May Jun Jul Aug Sep Oct Nov Dec Annual
(a) Present Climate (1970-1990)Tmax (°C) 3 4 7 11 14 17 21 21 18 12 4 2Tmin (°C) -3 -4 -2 0 2 6 8 9 6 3 -1 -3PET1 (mm) 20 26 44 63 101 131 151 143 109 72 28 20 908AET2 (mm) 14 16 29 38 54 48 37 28 31 34 19 13 360Rainfall (mm) 177 105 132 102 109 78 35 30 56 224 280 148 1474Snowfall (mm) 179 122 82 44 10 2 0 0 1 24 141 125 731Snowpack3 (mm) 423 524 566 515 339 126 34 8 4 26 163 267Snowcover Area (%) 55 63 62 57 48 33 16 5 2 6 25 45
(b) Future Climate (2080-2100)Tmax (°C) 6 7 10 14 17 21 25 24 22 15 7 5Tmin (°C) 1 0 2 4 6 10 12 12 10 7 2 0PET1 (mm) 28 31 45 59 91 113 123 115 93 66 32 26 821AET2 (mm) 19 19 25 28 33 28 20 27 26 27 22 17 290Rainfall (mm) 305 253 197 110 83 72 32 44 72 256 456 281 2161Snowfall (mm) 47 47 23 7 1 0 0 0 0 3 36 47 212Snowpack3 (mm) 63 71 64 32 18 7 2 0 0 6 35 46Snowcover Area (%) 22 28 24 19 12 7 2 0 0 2 14 22
1PET is the potential evapotranspiration; 2AET is the actual evapotranspiration; 3Snowpack is the snow waterequivalent of the snowpack at the end of each month.
Table 5. Average model results for present and future climate scenarios for the Illecillewaet catchment
Jan Feb Mar Apr May Jun Jul Aug Sep Oct Nov Dec Annual
(a) Present Climate (1970-1990)Tmax (°C) -7 -5 -1 4 8 13 17 17 11 4 -4 -7Tmin (°C) -12 -10 -7 -4 0 3 6 6 2 -2 -8 -12PET1 (mm) 1 2 9 34 78 109 127 117 67 30 4 0 578AET2 (mm) 0 1 5 29 64 83 77 57 33 27 4 0 381Rainfall (mm) 0 0 4 22 52 95 89 92 75 46 10 1 487Snowfall (mm) 210 170 128 68 27 15 3 3 15 80 180 224 1124Snowpack3 (mm) 690 862 986 971 680 264 41 2 9 76 255 480Snowcover Area (%) 98 100 100 100 96 75 31 4 1 8 42 82
(b) Future Climate (2080-2100)Tmax (°C) -3 0 5 9 13 17 20 19 15 8 0 -4Tmin (°C) -8 -5 -2 1 5 8 10 9 6 2 -4 -9PET1 (mm) 4 8 23 42 81 101 108 94 63 36 9 2 571AET2 (mm) 2 5 15 30 48 52 41 46 29 21 6 1 296Rainfall (mm) 25 45 70 63 66 92 94 112 119 128 78 18 910Snowfall (mm) 200 145 74 27 4 1 0 0 3 43 186 253 936Snowpack3 (mm) 698 777 694 455 112 2 0 2 14 154 464 600Snowcover Area (%) 96 96 88 74 38 6 0 0 1 11 60 91
1PET is the potential evapotranspiration; 2AET is the actual evapotranspiration; 3Snowpack is thesnow water equivalent of the snowpack at the end of each month.

Athanasios Loukas, Lampros Vasiliades and Nicolas Dalezios
222
an increase of mean annual precipitation of 7.6% with amarked change in the partition of precipitation between rainand snowfall. The annual rainfall would increase by about47%, increasing in the autumn, winter and spring anddecreasing in the summer (Table 4), while the annualsnowfall would decrease dramatically by 71%. The changein the form of precipitation in winter would result from thehigher winter temperatures (Table 4). In the Illecillewaet,mean annual precipitation would increase by 14.6%, withrainfall increasing by about 87% while snowfall decreasedby 17%. Under the climate change scenario, rainfall wouldincrease for all months except for June (Table 5).
The warmer future climate and the large decrease in theannual snowfall would result in a dramatic decrease of thesnowpack (Figs. 2 and 3) and the snow-covered area (Tables4 and 5). In the Upper Campbell basin the average maximumbasin winter snowpack would decrease by more than 87%while the maximum snow-covered area of the basindecreases by 35%. In the Illecillewaet catchment, the climatechange affects the average winter snowpack, which woulddecrease by 21%.
The accumulation and depletion periods of theaccumulated snowpack would also alter. In the UpperCampbell, the snowpack under the future climate scenariowould start accumulating in November rather than inOctober. The peak accumulation period would shift fromMarch to February. However, these changes areovershadowed by a significant decrease in the snowpack(Fig. 2 and Table 4). The effects in the Illecillewaet wouldbe smaller; although the peak accumulation period wouldshift from March to February, the snowpack would notdecrease so dramatically as in the Upper Campbell. (Fig. 3;Table 5).
The large increase in rainfall and the dramatic decreaseof the snowfall and snowpack accumulation in the UpperCampbell under future climatic conditions, affect the meanannual surface and interflow rainfall runoff directly whichwould increase by 30% and the mean annual surface andinterflow snowmelt runoff would decrease by 83%,respectively (Fig. 4). Under the climate change scenario,the rainfall runoff would increase in winter and the lateautumn and would decrease in spring and summer mainlybecause the precipitation in spring and summer would beless. Furthermore, the basin would become more permeableas the vegetation advanced to higher elevations and thesurface runoff would decrease; interception by thevegetation would enhance the catch of rain and snow. Thisintercepted water is either evaporated or soaks into the soiland thus increases the soil moisture storage. Hence, runofffrom groundwater would increase in the late autumn andwinter months (Fig. 4). The overall effect of the above
changes would increase the total runoff of the UpperCampbell by 13%, mostly in the late autumn and wintermonths although runoff would be less in summer. (Fig. 6a).
In the Illecillewaet basin, the mean annual runoff fromthe surface and interflow would decrease by about 21%,despite the 87% increase of rainfall. This can be attributedto the expansion of the vegetation in the alpine and sub-alpine zone and the reduction of the impermeable area underthe future climatic conditions (Table 3). In consequence, alarger amount of rainwater would infiltrate the soil andcontribute to the groundwater and less rain would flow overthe soil surface and through the top soil layers. The rainfallrunoff would increase slightly during the winter and springmonths and decrease considerably during the summer andautumn months (Fig. 5) mainly because of the increase inrainfall during these months (Table 5).
The mean annual surface and interflow snowmelt runoff,
a) R ainfall R unoff
0
50
100
150
200
250
Jan Feb M ar A pr M ay Jun Ju l A ug Sep Oc t No v D ec
Run
off (
mm
) Present C limate
Future C limate
b) Snowme lt R unoff
0
50
100
150
200
250
Jan Feb M ar A pr M ay Jun Ju l A ug Sep Oc t No v D ecR
unof
f (m
m)
Present Climate
Future Climate
c) Groundwate r Runoff
0
50
100
150
200
250
Jan Feb M ar A pr M ay Jun Ju l A ug Sep Oc t No v D ec
Run
off (
mm
) Present Climate
Future Climate
Fig. 4. Average model results for runoff generating processes forpresent and future climate scenarios - Upper Campbell catchment

Climatic impacts on the runoff generation processes in British Columbia, Canada
223
a) Rainfall Runoff
0
50
100
150
200
250
300
Jan Feb M ar A p r M ay Jun Ju l A ug Sep Oct N ov Dec
Run
off (
mm
) Present Climate
Future Climate
b) Snowmelt Runoff
0
50
100
150
200
250
300
Jan Feb M ar A p r M ay Jun Ju l A ug Sep Oct N ov Dec
Run
off (
mm
)
Present C limateFuture C limate
c) Glacier R unoff
0
50
100
150
200
250
300
Jan Feb M ar A p r M ay Ju n Jul A ug Sep Oct No v D ec
Run
off (
mm
) Present Climate
Future Climate
d) Groundwate r Runoff
0
50
100
150
200
250
300
Jan Feb M ar Ap r M ay Jun Jul A ug Sep Oct Nov DecR
unof
f (m
m)
Present ClimateFuture Climate
Fig. 5. Average model results for runoff generating processes for present and future climate scenarios – Illecillewaet catchment
a) Total R unoff - Upper Campbe ll wate rshed
0
50
100
150
200
250
300
350
400
Jan Feb M ar A pr M ay Jun Jul A ug Sep O ct Nov D ec
Run
off (
mm
)
Present Climate
Future Climate
b) Total R unoff - Ille cillewae t watershed
0
50
100
150
200
250
300
350
400
Jan Feb M ar A pr M ay Jun Ju l A ug Sep Oct No v Dec
Run
off (
mm
) Present Climate
Future Climate
Fig. 6. Average model results for total runoff for present and futureclimate scenarios for the two study catchments
in the Illecillewaet basin, would decrease by 62% mainlybecause of the reduced snowfall and the increasedpermeability of the catchment. The snowmelt would increaseslightly in the late fall, winter and spring because of thehigher melt rates and would decrease in summer as thesnowpack depleted earlier in the season (Fig. 5). The meanannual glacier runoff would decrease by about 26% and thearea of the glacier would shrink by 33%. The higher meltingrates of the glacier reflecting the higher summertemperatures would tend to offset the reduction in the glacierarea (Fig. 5). Furthermore, the increased permeability ofthe Illecillewaet catchment would result in higher soilinfiltration rates; higher contributions of rainfall andsnowmelt to groundwater would double the mean annualrunoff from groundwater. However, this increase is notevenly distributed throughout the year and the groundwaterrunoff would decrease during July and August (Fig. 5).
The above changes in the runoff generation processesaffect the total runoff, which, under the altered climaticscenario, would increase, on an annual basis, by about 37%.Nevertheless, the most significant effect would be the changein the time distribution of the total runoff; the peak runoffwould occur one month earlier, in May (Fig. 6b).

Athanasios Loukas, Lampros Vasiliades and Nicolas Dalezios
224
CONTRIBUTIONS OF THE RUNOFF GENERATIONPROCESSES TO TOTAL RUNOFF
The above results show the changes in the amount and timedistribution of the runoff generation for the present climaticconditions and for the altered future climatic conditions.This analysis does not show the significance of the individualcontributions of the various runoff generation mechanismsto the total runoff, so the average monthly contribution ofeach runoff mechanism has been plotted as the percentageof the total (Figs. 7 and 8). Runoff in the Upper Campbellunder present climatic conditions is generated mainly bysurface and interflow rainfall runoff during the autumn andwinter and by the surface and interflow snowmelt runoffduring the spring and summer months (Figs. 7a and b).Furthermore, groundwater contributes more than 50% ofthe monthly total runoff except in the autumn when itscontribution decreases to 25% (Fig. 7c).
Under future climatic conditions, the rainfall runoffcontribution to total runoff would be unchanged over theyear (Fig. 7a) but the snowmelt contribution would decreaseto almost zero as the snowfall decreased (Fig. 7b). Thesignificance of groundwater runoff would increase in spring
and summer when groundwater would account for morethan 90% of the total runoff (Fig. 7c) and sustain low flowsin summer.
In the Illecillewaet catchment under present climaticconditions, runoff occurs mainly from snowmelt in springand early summer and from the glacier in late summer andearly autumn, whereas the surface and interflow rainfallrunoff contribution is marginal throughout the year (Figs.8a, 8b and 8c). Furthermore, groundwater is a significantcontributor to the total runoff, especially during the “dry”winter months when it is the only source of runoff. (Fig.8d).
For future climatic conditions, the rainfall runoffcontributions to total runoff would remain small throughoutthe year (Fig. 8a). Runoff from snowmelt would increase inwinter and decrease in spring due to earlier melting of the
Fig. 7. Contribution of the runoff generation processes to totalrunoff – Upper Campbell catchment
a) R ainfall R unoff
0
25
50
75
100
Jan Feb Mar Apr M ay Jun Jul Aug Sep Oct N ov Dec
Tot
al R
unof
f (%
)
Present Climate
Future C limate
b) Snowmelt R unoff
0
25
50
75
100
Jan Feb Mar Apr M ay Jun Jul Aug Sep O ct N ov Dec
Tot
al R
unof
f (%
)
Present C limate
Future Climate
c) Groundwate r R unoff
0
25
50
75
100
Jan Feb Mar Apr May Jun Jul Aug Sep Oct N ov Dec
Tot
al R
unof
f (%
)
Present Climate
Future Climate
a) R ainfall R unoff
0
25
50
75
100
Jan Feb Mar Apr May Jun Jul Aug Sep O ct N ov Dec
Tot
al R
unof
f (%
)Present C limate
Future Climate
b) Snowmelt R unoff
0
25
50
75
100
Jan F eb Mar Apr M ay Jun Jul Aug S ep Oct N ov Dec
Tot
al R
unof
f (%
)
P resent C limate
F uture C limate
c) Glacie r R unoff
0
25
50
75
100
Jan Feb Mar Apr May Jun Jul Aug Sep O ct N ov Dec
Tot
al R
unof
f (%
)
Present C limate
Future C limate
d) Groundwater R unoff
0
25
50
75
100
Jan Feb Mar Apr May Jun Jul Aug Sep O ct N ov Dec
Tot
al R
unof
f (%
)
Present Climate
Future Climate
Fig. 8. Contribution of the runoff generation processes to totalrunoff – Illecillewaet catchment

Climatic impacts on the runoff generation processes in British Columbia, Canada
225
snowpack (Fig. 8b). The total and monthly distribution ofrunoff from the glacier would be the same as at present andit would remain a significant contributor of the total runoffin summer and early autumn. (Fig. 8c).
Finally, the contribution of the groundwater to total runoffin future would increase during spring, summer and autumnand decrease in winter; overall, groundwater would supplyapproximately 80% of the total runoff. The monthlycontribution to total runoff would be more uniform than atpresent (Fig. 8d).
Concluding remarksThis study shows how the potential climate change in themaritime rain-fed Upper Campbell catchment wouldincrease the annual precipitation by 7.6% and the meanannual temperature by 3.5oC. The warmer climate and thehigher temperatures would change the form of theprecipitation so that the annual rainfall would increase by47% while the annual snowfall decreased by 71%. Thesnowpack would decrease dramatically and it would bedepleted by June. Overall, the annual runoff from rainfallwould increase by 30% while the annual snowmelt woulddecrease by 83%. Furthermore, under the climate changescenario, the Upper Campbell catchment would becomemore permeable as vegetation colonised higher elevationsin the catchment so that more runoff would be generated byoutflow of groundwater. In summer, runoff would decreaseand, in the late autumn and winter, it would increase so thatthe mean annual total runoff would increase by 13%.Groundwater would be the most significant contributor ofthe total runoff, especially during the “low flow” summermonths when its contribution would account for more than90% of the total. Runoff from rainfall would remain themost significant contributor to the total runoff in the autumn.
In contrast, in the interior snow-covered Illecillewaetbasin, the increased concentration of CO2 would cause awarmer and wetter climate which would affect the form ofprecipitation. The mean annual rainfall would increase by87% and the mean annual snowfall would decrease by 17%.Despite the large increase of the mean annual rainfall, themean annual runoff from rainfall would decrease by 21%because of the higher permeability of the catchment but itscontribution to the total runoff would remain small andunchanged. However, the contribution of the runoff fromsnowmelt would increase slightly in winter and significantlyin spring and summer. Higher summer temperatures wouldincrease the rate of melting of the glacier so that the meanannual glacier runoff would decrease by 26% from a glaciersome 33% reduced in area; however, its contribution to totalrunoff would remain rather unchanged. Finally, the mean
annual groundwater runoff would double due to higherinfiltration rates. This increase would be concentrated mainlyin winter and spring whereas runoff from groundwaterwould decrease in summer. All these changes in the runoffgeneration processes would increase the runoff in theautumn, winter, and early spring and reduce it in summer,so that the runoff hydrograph would peak earlier in theseason. The mean annual total runoff would increase by37%.
The coupling of a GCM output with the hydrologicalmodel used in this study is more realistic than othermodelling approaches, although inherent uncertaintiesremain, largely in the global circulation and hydrologicalmodelling. The global circulation modelling uncertainty isdue to the assumptions of future greenhouse gasconcentrations and aerosol emissions, to uncertainty in themodelling of the various atmospheric physical processesand feedback mechanisms, and uncertainty in therepresentation of the regional climate changes due to thecoarse spatial resolution of the GCM. Overall, the possibleerrors introduced to the hydrological simulation could belarge (IPCC, 1999; Kaleris et al., 2001). Also, the relativelysimple “delta” method of downscaling the CGCMa1 outputwas adopted. Given the large uncertainties in the effects ofglobal warming on temperature and precipitation at the basinscale, using a more complex methodology of downscalingwould have added little meaningful detail. However, thisrelatively simple downscaling approach has been shown toprovide an appropriate level of detail in the greater regionof Pacific Northwest in the vicinity of British Columbia(Hamlet and Lettenmaier, 1999).
On the other hand, an attempt was made to minimise theuncertainties of the hydrological modelling by performinga good calibration of the U.B.C. model with historical data.Overall, the statistics for the calibration period show thatthe simulation for the Illecillewaet catchment is better thanthat for the Upper Campbell basin. The mean absolutepercentage error of the U.B.C. model for the UpperCampbell is around 20%. Most of the relative changes inthe hydrological regime of this maritime basin are largerthan 20%. Hence, the U.B.C. model is able to detect changesin most of the hydrological variables and, especially, in therunoff components, for which the mean absolute changesare larger than 30%. However, the hydrological modellinguncertainty for the Upper Campbell is higher than that forthe Illecillewaet for the calibration period of which the meanabsolute error is 21%. This hydrological modelling error isless than the estimated changes of the hydrological variablesin the catchment. Moreover, earlier successful applicationsof the U.B.C. model to geographical regions with climatesdifferent from the climate of British Columbia suggest that

Athanasios Loukas, Lampros Vasiliades and Nicolas Dalezios
226
the model is able to simulate runoff in a variety of climates.Nevertheless, there remain uncertainties in the descriptionof the future vegetation and glacier coverage in thecatchments under study. It is hoped that these uncertaintieshave been minimised since the values of the geophysicalparameters adopted in the hydrological modelling have beenestimated by contemporary methods, models and the resultsof physical experiments. In conclusion, the hydrologicalmodelling approach can detect, with reasonable certainty,most of the changes for the future climate hydrologicalregime, always assuming the reliability of the averagechanges in the meteorological variables (precipitation,temperature, and cloud cover), estimated by CGCMa1.However, the output of the GCM is rather questionable,especially as regards precipitation and cloud cover (IPCC,2001). If the GCM uncertainty is accounted for in thehydrological simulation then the above results are subjectedto high uncertainty.
The findings of this study are important for future waterresources management practices and design in the twocatchments studied, since each contributes runoff to a majorBritish Columbia reservoir. Also, the results of this analysiscould be used, in a future study, to simulate climate changeimplications on the water quality of the total runoff.
AcknowledgementsThe authors thank the three anonymous reviewers and theeditor for their helpful comments, which improved thequality of the final manuscript. The authors alsoacknowledge the Guest Editor, Dr. A. Montanari, for therigorous and timely handling of the reviewing process ofthe paper.
ReferencesAssaf, H. and Quick, M.C., 1991a. Updating hydrological model
forecasts. Can. J. Civil Eng., 18, 663–674.Assaf, H. and Quick, M.C., 1991b. Updating snowpack forecasts.
Proc. 10th Canadian Hydrotechnical Conference, CanadianSociety for Civil Engineering, Vancouver, June 1991, 419–428.
Assaf, H., Loukas, A. and Quick, M.C., 1995. Updating seasonalsnowmelt estimates using snowcourse measurements. Proc. ofthe 1995 Western Snow Conference, Reno-Sparks, April 1995,21–28.
Boer, G.J., Flato, G., Reader, M.C. and Ramsden, D., 2000. Atransient climate change simulation with greenhouse gas andaerosol forcing: experimental design and comparison with theinstrumental record for the twentieth century. Climate Dynam.,16, 405–425.
Braithwaite, R.J. and Olesen, O.B., 1989. Calculation of glacierablation from air temperature, West Greenland. In: GlacierFluctuations and Climatic Change, J. Oerlemans (Ed.), Kluwer,
Dordrecht, The Netherlands, 219–233.Brandsma, T. and Buishand, T.A., 1997. Statistical linkage of daily
precipitation in Switzerland to atmospheric circulation andtemperature. J. Hydrol., 198, 98–123.
Cure, J.D. and Acock, B., 1986. Crop responses to carbon dioxidedoubling: a literature survey. Agric. Forest Meteorol., 38, 127–145.
Druce, D.J., 2001. Insights from a history of seasonal inflowforecasting with a conceptual hydrologic model. J. Hydrol., 249,102–112.
Fanta, J., 1992. Possible impact of climatic change on forestedlandscapes in central Europe: A review. In: Greenhouse-Impacton Cold Climate Ecosystems and Landscapes, CatenaSupplement, 22, 133–151.
Gellens, D. and Roulin, E., 1998. Streamflow response of Belgiancatchments to IPCC climate change scenarios, J. Hydrol., 210,242–258.
Hamlet, A.F. and Lettenmaier, D.P., 1999. Effects of climatechange on hydrology and water resources in the Columbia Riverbasin, J. Amer. Water Resour. Ass., 35, 1597–1623.
Hay, L.E., Wilby, R.L. and Leavesley, G.H., 2000. A Comparisonof delta change and downscaled GCM scenarios for threemountainous basins in the United States. J. Amer. Water Resour.Ass., 36, 387–397.
Hirst, A.C., O’Farrell, S.P. and Gordon, H.B., 2000. Comparisonof a coupled ocean-atmosphere model with and without oceaniceddy-induced advection. 1. Ocean spin-up and controlintegrations. J. Climate, 13, 139–163.
Hudson, R.O. and Quick, M.C., 1997. Component based waterchemistry simulator for small subalpine watersheds. Can. WaterRes. J., 22, 299–325.
IPCC, 1999. Guidelines on the use of scenario data for climateimpact and adaptation assessment.Version 1, by T.R. Carter,M. Hulme, and M. Lal, Intergovermental Panel on ClimateChange, Task Group on Scenarios for Climate ImpactAssessment. 69 pp.
IPCC, 2001. Climate change 2001-The scientific basis.Contribution of Working Group I to the Third AssessmentReport of the Intergovernmental Panel on Climate Change(IPCC), J.T. Houghton, Y. Ding, D.J.Griggs, M. Noguer, P.J.van der Linden and D. Xiaosu (Eds.), Cambridge UniversityPress, UK. 944 pp.
Johns, T.C., Carnell, R.E., Crossley, J.C., Gregory, J.M., Mitchell,F.B., Senier, C.A., Tett, S.F.B. and Woods, R.A., 1997. Thesecond Hadley Centre coupled ocean-atmosphere GCM: Modeldescription, spinup and validation. Clim. Dynam., 13, 103–134.
Kaleris, V., Papanastasopoulos, D. and Lagas, G., 2001. Case studyon impact of atmospheric circulation changes on river basinhydrology: uncertainty aspects. J. Hydrol., 245, 137–152.
Khan, M.I., 1995. The effects of snow avalanches on the hydrologicregime of the Kunhar river, Western Himalayan, Pakistan:analysis and application to river flow forecasting. M.A.Sc.Thesis, Department of Civil Engineering, University of BritishColumbia, Vancouver, 148 pp.
Kite, G.W., 1993. Application of a land class hydrological modelto climate change. Water Resour. Res., 29, 2377–2384.
Korner, C., 1992. Response of alpine vegetation to global climatechange, In: Greenhouse-Impact on Cold Climate Ecosystemsand Landscapes, Catena Supplement, 22, 85–96.
Laumann, T. and Reeh, N., 1993. Sensitivity to climate change ofthe mass balance of glaciers in southern Norway. J. Glaciol.,39, 656–-665.
Leung, R.L. and Wigmosta, M.S., 1999. Potential climate changeimpacts on mountain watersheds in the Pacific Northwest. J.

Climatic impacts on the runoff generation processes in British Columbia, Canada
227
Amer. Water Resour. Ass. 35, 1463–1471.Loukas, A. and Quick, M.C., 1996. Effect of climate change on
hydrologic regime of two climatically different watersheds. J.Hydrol. Eng., 1, 77–87.
Loukas, A. and Quick, M.C., 1999. The effect of climate changeon floods in British Columbia. Nordic Hydrol., 30, 231–256.
Manabe, S. and Stouffer, R.J., 1996. Low frequency variabilityof surface air temperature in a 1,000-Year integration of acoupled atmosphere-ocean-land surface model. J. Climate, 9,376–393.
McCabe, G.J. and Wolock, D.M., 1999. General-Circulation-Model simulations of future snowpack in the western UnitedStates. J. Amer. Water Resour. Ass., 35, 1473–1484.
Mehrotra, R. and Singh, R.D., 1998. Spatial disaggregation ofrainfall data. Hydrolog. Sci. J., 43, 91–102.
Micovic, Z. and Quick, M.C., 1999. A rainfall and snowmelt runoffmodelling approach to flow estimation at ungauged sites inBritish Columbia. J. Hydrol., 226, 101–-120.
Miller, N.L., Kim, J., Hartman, R.K. and Farrara, J., 1999.Downscaled climate and streamflow study of the southwesternUnited States. J. Amer. Water Resour. Ass., 35, 1525–1537.
Moore, R.D., 1992. The influence of glacial cover on the variabilityof annual runoff, Coast mountains, British Columbia, Canada.Can. Water Resour. J., 17, 101–109.
Nash, J.E. and Sutcliffe, J.V., 1970. River flow forecasting throughconceptual models. Part-1 A discussion of principles, J. Hydrol.10, 282–290.
Oerlemans, J. and Wegener, A., 1989. On the response of valleyglaciers to climatic change. In: Glacier Fluctuations andClimatic Change, J. Oerlemans (Ed.), Kluwer, Dordrecht, TheNetherlands, 353–371.
Ozenda, P. and Borel, J.J., 1990. The possible responses ofvegetation to a global climatic change. In: Scenarios for WesternEurope with Special Reference to the Alps. Proc. EuropeanConference on Landscape Ecological Impact of ClimaticChange, IOS Press, Amsterdam, Netherlands, 221–249.
Parry, M., 1992. The potential effect of climate changes on
agriculture and land use. Adv. Ecol. Res., 22, 63–91.Pelto, M.S., 1989. Time-series analysis of mass balance and local
climatic records from four northwestern North Americanglaciers. In: Snow Cover and Glacier Variations, IAHS Publ.no. 183, 95–102.
Post, W.M., Pastor, J., King, A.W. and Emanuel, W.R., 1992.Aspects of the interaction between vegetation and soil underglobal change. Water Air Soil Pollut., 64, 345–363.
Quick, M.C., 1995. U.B.C. Watershed Model Manual-Version 4.0.Dept. of Civil Engineering, University of British Columbia,Vancouver, B.C., Canada.
Quick, M.C. and Pipes, A., 1976. A combined snowmelt andrainfall-runoff model. Can. J. Civil Eng., 3, 449–460.
Schaefer, D.G. and Nikleva, S.N., 1973. Mean precipitation andsnowfall maps for a mountainous area of potential urbandevelopment. Proc. of the 1973 Western Snow Conference, 80–89.
Singh, P. and Kumar, N., 1997. Impact assessment of climatechange on the hydrological response of a snow and glacier meltrunoff dominated Himalayan river. J. Hydrol., 193, 316–350.
Smith, T.M., Shugart, H.H., Bonan, G.B. and Smith, J.B., 1992.Modeling the potential response of vegetation to global climatechange. Adv. Ecol. Res., 22, 93–116.
Storr, D. and Ferguson, H.L., 1972. The distribution ofprecipitation in some mountainous Canadian watersheds. In:Distribution of Precipitation in Mountainous Areas, WMO, Vol.II, 241–263.
Wigley, T.M.L. and Jones, P.D., 1985. Influences of precipitationchanges and direct CO2 effects on streamflow. Nature, 314, 149–152.
Wilby, R.L., Hay, L.E. and Leavesley, G.H., 1999. A comparisonof downscaled and raw GCM output: implications for climatechange scenarios in the San Juan River basin, Colorado. J.Hydrol., 225, 67–91.
Wilson, C.A. and Mitchell, J.F.B., 1987. A doubled CO2 climatesensitivity experiment with a global climate model including asimple ocean. J. Geophys. Res., 92, 13315–13343.
Zoltai, S.C., 1988. Ecoclimatic provinces of Canada and man-induced climatic change. Newslett. Can. Comm. Ecol. LandClass., 17, 12–15.

Athanasios Loukas, Lampros Vasiliades and Nicolas Dalezios
228