climate vulnerability assessment for the indian …
TRANSCRIPT
CLIMATE VULNERABILITY ASSESSMENT FOR THE INDIAN HIMALAYAN REGION USING A COMMON FRAMEWORK
Department of Science and TechnologyMinistry of Science & TechnologyGovernment of India
NaTioNal MiSSioN For SuSTaiNiNg The hiMalayaN ecoSySTeMNMShe

2

Climate Vulnerability Assessment for the Indian Himalayan RegionUsing a Common Framework
Submitted by Indian Institute of Technology Guwahati & Indian Institute of Technology Mandi
In collaboration with Indian Institute of Science, Bengaluru
Under the project Capacity Building on Climate Change Vulnerability Assessment in the States of Indian Himalayan Region
2018-19
Department of Science and TechnologyMinistry of Science & TechnologyGovernment of India
NaTioNal MiSSioN For SuSTaiNiNg The hiMalayaN ecoSySTeMNMShe

4

Climate Vulnerability Assessment for the Indian Himalayan Region Using a Common Framework
5
Table of ContentsMessage from the Hon’ ble Minister 7
Message from Secretary, DST 9
Foreword 11
Preface 13
Project Team 14
Acknowledgements 17
List of Acronyms 18
Abstract 19
PART I: INTRODUCTION AND METHODOLOGY 21
1. Introduction 23
2. Need for vulnerability assessment in the IHR 24
3. Approach to capacity building for vulnerability assessment in the IHR 25
3.1 Understanding vulnerability 25
3.2 Need for a common framework 26
4. Methodology: An indicator-based approach 26
4.1 Steps to vulnerability assessment 26
5. The process of developing vulnerability profiles of IHR states using the common framework 29
5.1 Inception Meeting 29
5.2 Need Assessment Workshops 30
5.3 Methodology Workshop 30
PART II: VULNERABILITY PROFILES OF THE STATES IN THE IHR 31
6. State-level vulnerability assessment in the IHR 33
6.1 Selection of indicators and rationale 33
6.2 Normalization and weights assigned 33
7. State-level vulnerability index 34
7.1 Sources of vulnerability 35
PART III: DISTRICT-LEVEL VULNERABILITY ASSESSMENT FOR IHR STATES 39
8. Need for district-level vulnerability assessment 41
9. The process of selection of indicators and assigning weights 41
10. District-level vulnerability profiles of 12 IHR states 43
PART IV: CONCLUSION AND WAY FORWARD 85
References 88
Appendix 92

6

Climate Vulnerability Assessment for the Indian Himalayan Region Using a Common Framework
7
MessageThe Himalayas are the largest and tallest mountain range in the world, bordering 8 countries and covering an area of about 43 lakh sq km. Nearly 1.5 billion people depend on Himalaya for Water, Food and Energy. The Himalayan ecosystem is considered as extremely fragile and diverse but vital for India through the provisioning of forest cover, perennial rivers that in turn provide drinking water, irrigation, and hydropower, conserving biodiversity, providing a rich base for high value agriculture, and elegant landscapes for sustainable tourism.
Any impact in the Himalayas would mean an effect on the life of millions of people not only of India but also of entire sub-continent. The Himalayan ecosystem is vulnerable to the impacts and consequences of various climatic and non-climatic factors. These include changes on account of natural causes, climate change resulting from anthropogenic emissions and developmental pathways.
In order to better understand the linkages between climate change and the Himalayan ecosystem for improved management of a fragile ecosystem, the Government of India has launched a National Mission for Sustaining the Himalayan Ecosystem (NMSHE) as part of National Action Plan on Climate Change (NAPCC). The Department of Science & Technology (DST) is coordinating and implementing the mission in collaboration with several other central ministries and the 12 Himalayan States.
I am pleased to learn that the DST in partnership with the 12 Himalayan States has been able to jointly produce a first of its kind vulnerability map and report for the entire Himalayan region. What is even more heartening is to see the concept of cooperative federalism in action wherein a common framework for assessing the climatic vulnerability was used by all the 12 States in partnership with the Central Government. Let me also take this opportunity to thank the Swiss Agency for Development and Cooperation for partnering with India for building resilience in the Himalayas.
I am confident that this document will be of immense value to researchers and policy makers for understanding the climate change vulnerabilities and devising and prioritizing adaptation strategies for the Himalayan region.
I take this opportunity to congratulate and thank all those who contributed to the preparation of the report.
Dr. Harsh Vardhan Hon’ble Union Minister of Science & Technology, Earth Sciences, Environment , Forest & Climate Change

8

Climate Vulnerability Assessment for the Indian Himalayan Region Using a Common Framework
9
MessageClimate change is a growing challenge to humanity and sustainable development through directly and indirectly impacts several socio-economic sectors like agriculture, water and human health. The Himalayan region is likely to be affected much more than plain areas as it is more fragile and sensitive to global and local anthropogenic changes. This puts on risk the livelihoods of the communities of the Himalayan region. In response to the serious threats posed by climate change to the development process and the limitations that Indian Himalayan Region is facing, the Government of India as part of its comprehensive National Action Plan on Climate Change has a dedicated mission for the Himalayan region, namely the National Mission for Sustaining the Himalayan Ecosystem (NMSHE), being coordinated by the Department of Science & Technology.
NMSHE emphasizes on creating knowledge on impacts of climate change and adaptation measures, supporting sub national actions for responding to climate change and strengthening multi-stakeholder platforms for science-policy-practice connect. NMSHE is in its progressive phase, and I am sure in the future, it will develop into a pool of knowledge on which future policy and programmes will rely.
This report presents the initiatives being undertaken under NMSHE to strengthen the capacities of Himalayan States on conducting a vulnerability and risk assessment which is a vital input towards adaptation planning. These initiatives were undertaken with the involvement of the State Climate Change Cells (SCCC) established at sub-national level in the IHR with support under NMSHE.
Bringing out knowledge products on the activities under NMSHE has been a constant effort by DST. In 2017, information booklets on the ‘State Climate Change Cells/Centres for Indian Himalayan Region’ and on the ‘Thematic Task Forces for the Indian Himalayan region’ were released during a side event hosted by DST on “Mountain Ecosystem” at 23rd conference of parties (COP-23), at Bonn, Germany.
I wish to compliment the efforts made by the Climate Change Programme, SPLICE Division, DST for bringing out this report on Capacity Building on Vulnerability and Risk Assessment in IHR.
Prof. Ashutosh SharmaSecretary, Department of Science and Technology

10

Climate Vulnerability Assessment for the Indian Himalayan Region Using a Common Framework
11
ForewordThe Himalayas are highly vulnerable to climate change impacts. This high vulnerability stems from the peculiar high mountain topography and from the higher than global average warming in the mountains including in the Himalayas. At the same time the Himalayas are the store house of the third highest amount of frozen water on earth and are therefore critical for the water security of the region.
For the purpose of enhanced understanding of the Himalayan ecosystem in context of climate change the NMSHE has taken up several initiates in partnership with various Himalayan States and institutions. Under NMSHE, State Climate Cells/Centers have been established in 11 out of the 12 Himalayan States for building institutional capacity of Himalayan States in the area of climate change adaptation. These centers are working on areas of climate vulnerability assessment, raising public awareness and training and capacity building for climate change adaptation planning.
Task Forces have been established for research on themes such as Natural and Geological Wealth, Water, Ice, Snow including Glaciers, Forest Resources and Plant Diversity, Micro Flora and Fauna and Wildlife and Animal Population, Traditional Knowledge System, Himalayan Agriculture. The Himalayas are important from the cryosphere perspective and in order to better understand this lesser understood component the Inter-University Consortium on Cryosphere and Climate Change was established.
In the past (2013-15), the Indo Swiss Capacity Building Programme on Himalayan Glaciology was also organized to help build capacities of young glaciologists in India. The programme contributed in training 51 researchers from across the country on theoretical and practical aspects of glaciology.
The present report is the result of coordinated efforts which began in 2017 with the development of a Common Framework for Climate Vulnerability and Risk Assessment by the Indian Institute of Science (IISc), Bengaluru. Over 2018 the Indian Indian Institute of Guwahati and Indian Institute of Mandi with technical backing from IISc, Bengaluru undertook a series of workshops with the Himalayan States to bring out the results which are captured in this report.
IHCAP a project of SDC has been a consistent partner with the DST providing technical and knowledge support for implementing the NMSHE, including the activities which have resulted in the present report.
I sincerely hope that the report will be useful to researchers and policy makers in developing better understanding of vulnerability in the Indian Himalayan Region.
Dr. Akhilesh Gupta, Head / Scientist-GClimate Change Programme (CCP)Strategic Programmes Large Initiatives and Coordinated Action Enabler- (SPLICE) DivisionDepartment of Science and Technology

12

Climate Vulnerability Assessment for the Indian Himalayan Region Using a Common Framework
13
PrefaceAdaptation to climate change has become imperative in the Indian Himalayan Region (IHR). Concerns about the growing impacts of climate change call for immediate response measures to reduce the vulnerabilities in the region. The Swiss Agency for Development and Cooperation (SDC), through its project, Indian Himalayas Climate Adaptation Programme (IHCAP), has been working towards strengthening the resilience of vulnerable communities in the Himalayas and towards enhancing the knowledge and capacities of research institutions, communities and decision-makers. IHCAP is a bilateral programme between the Government of Switzerland and Government of India to support the implementation of the National Mission for Sustaining the Himalayan Ecosystem (NMSHE). The Department of Science and Technology (DST) of the Government of India is the coordinating agency for implementing the NMSHE.
Climate change is resulting in new threats and uncertainties undermining the socio-economic development in IHR. A comprehensive understanding of the key risks and vulnerabilities based on robust research is a pre-requisite for planning for adaptation. While there have been some vulnerability assessments carried out within Himalayan States there has been a lack of consistency in terms of the framework used for these studies. The multiplicity of challenges in IHR at spatial level calls for the need of a coordinated and integrated approach for adaptation planning.
Under IHCAP, SDC supported the development of a common framework for vulnerability and risk assessment for IHR. This common framework has been applied to understand the vulnerability profile of the entire Himalayan region. Representatives of all 12 State Governments in IHR were brought together through a series of workshops to develop a uniform understanding about vulnerability and risk, availability and requirement of datasets and to map the vulnerability. This initiative contributes towards the objectives of NMSHE for capacity building of Himalayan States to carry out such assessments.
Through IHCAP, it has been our constant endeavor to transfer the knowledge and expertise from Switzerland on climate change adaptation in mountain regions. SDC looks forward to enhance the bilateral cooperation with the Government of India to achieve the common goal of facilitating climate change adaptation in the Himalaya Region.
Ms. Marylaure CrettazHead of CooperationSwiss Agency for Development and Cooperation (SDC)Swiss Cooperation Office India

14
Core Team
IIT Guwahati IIT Mandi IISc Bengaluru
Anamika Barua Shyamasree Dasgupta N.H. Ravindranath Associate Professor Assistant Professor Professor Deptt. of Humanities and School of Humanities and Centre for Sustainable Social Science Social Science Technologies (CST) Principal Investigator Co - Principal Investigator Key Resource Person
CONTRIBUTING TEAM (in alphabetic order)
Indu K Murthy, Consultant Scientist, Centre for Sustainable Technologies, IISc Bengaluru
Jagmohan Sharma, Additional PCCF (Forest Conservation) Government of Karnataka
Kritishnu Sanyal, Project Associate, IIT Mandi
Merlyn Maria Antony, Project Associate, IIT Guwahati
Mir Khursheed Alam, Research Scholar, IIT Mandi
Navya Sharma, Research Assisstant, IIT Guwahati
Rupam Bhaduri, Research Shcolar, IIT Guwahati
Tapasya Changkakati, Project Associate, IIT Guwahati
Tashina Esteves, Independent Consultant
Vishaka Gulati, Research Shcolar, IIT Guwahati
CONTRIBUTING TEAM FROM THE STATES ( in alphabetic order of the states)
Arunachal Pradesh
Mr. D. Dohu Robin, Dy. Director & Nodal Officer (Climate Change), Department of Environment and Forests
Mr. Bijoy Pradhan, DCF (Planning), Department of Environment and Forests
Dr. A.I Singh, OSD (RUSA), Directorate of Higher Education & Technical Education
Dr. B.B Bhatt, Scientist, Department of Environment & Forests
Dr. Bhupen Mili, Research Associate, State Climate Change Cell
Mr. Gokia Roman, Junior Research Fellow, State Climate Change Cell
Mr. Rinchin Tsering Gonpapa, Junior Research Fellow, State Climate Change Cell
Assam
Dr. Kripaljyoti Mazumdar, Project Officer, Assam State Disaster Management Authority
Mr. Dibakar Deb, Silviculturist, Dept. of Environment and Forests
Ms. Anamika Tamuli, Dept. of Soil Conservation
Mr. Pradipta Baruah, DFO, Wild Life, Dept. of Environment and Forests
Himachal Pradesh
Dr. S.C. Attri, PSO (Environment), Dept. of Environment, Science & Technology
Mr. Duni Chand Thakur, MIS Officer, Dept. of Environment, Science & Technology
Ms. Namrata Sharma, HH Officer, Dept. of Environment, Science & Technology
Dr. Prabal Chauhan, SMS, Dept. of Horticulture
Ms. Monika Sharma, CC Expert, HPKCCC, Dept. of Environment, Science & Technology
Ms. Meena Devi, GIS Expert, HPKCCC, Dept. of Environment, Science & Technology
Ms. Sangeeta Chauhan, GIS Expert, HPKCCC, Dept. of Environment, Science & Technology
Jammu and Kashmir (Dept. of Ecology, Environment & Remote Sensing)
Mr. Majid Farooq, Coordinator/Principal Investigator, State Climate Change Centre
Dr Shah Murtaza Mushtaq, Project Scientist-B, State Climate Change Centre
Dr Mohd Nayeem Shah, Junior Research Fellow, State Climate Change Centre
Mr. Ishfaq Ahmad Wani, Junior Research Fellow, State Climate Change Centre
Miss Mudabir Mushtaq, Project Assistant, State Climate Change Centre

Climate Vulnerability Assessment for the Indian Himalayan Region Using a Common Framework
15
Manipur
Dr. T. Brajakumar Singh, Deputy Director, Dept. of Environment and Forests
Mr. Yengkokpam Satyajit Singh, Project Scientist, State Climate Change Cell
Dr. Salam Rita Devi, Project Scientist, State Climate Change Cell
Dr. Bharati Brahmacharimayum, Project Scientist, State Climate Change Cell
Mr. Ashem Rahul Singh, Project Scientist, State Climate Change Cell
Meghalaya
Dr. Anuj K S Parihar, Project Scientist, Meghalaya Basin Development Authority
Dr. Marbakor Mary Lynrah, Project Scientist, Meghalaya Basin Development Authority
Dr. Thangjam Somendro Singh, Project Scientist, Meghalaya Basin Development Authority
Mr. Vivek Lyngdoh, JRF, Meghalaya Basin Development Authority
Ms. Devapriya De Munshi, JRF, Meghalaya Basin Development Authority
Mr. Batiplang Syiemlieh, Project Assistant, Meghalaya Basin Development Authority
Mr. Anthony Wilfred Kharkongor, Project Assistant, Meghalaya Basin Development Authority
Mr. Daphrang Janai Sakhar, GIS Program Associate, Meghalaya Basin Development Authority
Mizoram
Dr. R.K. Lallianthanga, Chief Scientific Officer, Mizoram Science, Technology & Innovation Council (MISTIC), Dept. of Science and Technology (DST)
Mr. Samuel Lalmalsawma, Senior Scientific Officer, MISTIC, DST
Mr. Lalthanpuia, Project Scientist, MISTIC, DST
Dr. James Lalnunzira Hrahsel, Project Scientist, MISTIC, DST
Dr. John Zothanzama, Assistant Professor, Mizoram University
Mr. F. Lalbiakmawia, Assistant Hydro-geologist, Public Health Engineering Dept.
Dr. Carmelita Lalchhanhimi Pachuau, Horticulture Extension Officer, Directorate of Horticulture
Dr. Lalnuntluangi, Medical Officer (Planning), Directorate of Health Services
Mr. C. Lalnithanga, Deputy Director, Plant Protection,
Mr. Lalchhanhima, Deputy Director, Land Resources, Soil & Water Conservation Department
Nagaland
Dr. Ditho Kathiry, Scientist ‘C’, Nagaland State Climate Change Cell
Mr. Kenilo Kessen, Junior Research Fellow, Nagaland State Climate Change Cell
Ms. Meziwalang Zeliang, Junior Research Fellow, Nagaland State Climate Change Cell
Mr. Mhabemo N Patton, Junior Research Fellow, Nagaland State Climate Change Cell
Mr. Thsope Medo, GIS Specialist, Nagaland State Climate Change Cell
Mr. Kethoneilhou Vimera, Jr. SMS, Dept. of Agriculture
Ms. Shetalu Vadeo, Jr. SMS, Dept. of Agriculture
Mr. Kitoho Michael Swu, Jr. SMS, Dept. of Agriculture
Ms. Amongla C, SMS, Dept. of Agriculture
Sikkim
Mr. D.G. Shrestha, Additional Director, Department of Science and Technology & Climate Change
Mr. Pranay Pradhan, Scientist ‘B’, Sikkim State Council of Science and Technology
Mr. Radha Krishna Sharma, Scientist ‘B’, Sikkim State Council of Science and Technology
Mr. Sundeep Chettri, Research Assistant, Sikkim State Council of Science and Technology
Tripura
Mr. Shivanand S. Talawar, IFS, Director, Department of Science, Technology & Environment
Mr. Susanta Banik, Scientific Officer, Dept. of Science and Technology
Mr. Jain Souh Reang, Scientific Assistant, Dept. of Science and Technology
Dr. Anjan Sengupta, Senior Scientific Officer, Dept. of Biotechnology
Dr. Sabyasachi Dasgupta, Associate Professor, Tripura University
Mr. Ezekiel Reang, Assistant Professor, College of Agriculture
Ms. Maria Debbarma, JRF, Tripura Climate Change Cell
Mr. Tapas Ch. Sukla Das, JRF, Tripura Climate Change Cell

16
Mr. Subrata Chakraborty, Scientist ‘B’, Tripura Climate Change Cell
Mr. Kharendra Reang, Scientist ‘B’, Tripura Climate Change Cell
Uttarakhand
Mr. R.N. Jha, Chief Conservator of Forests, Department of Environment and Forests
Dr. Tripti Jayal, Research Associate, State Climate Change Centre
Mr. Shaliendra Singh Rawat, Junior Research Fellow, State Climate Change Centre
Mr. Neeraj Singh, Junior Research Fellow, State Climate Change Centre
Mr. Mukesh Singh, Junior Research Fellow, State Climate Change Centre
Dr. Neelam Rawat, Scientist-C, Uttarakhand Space Application Centre
Dr. Piyush Joshi, Senior Scientist Officer, Uttarakhand Council of Science and Technology
Ms. Chitra Kanojiya, Dep. Director, Directorate of Economic and Statistics Department
Dr. Ajay Kumar Sharma, Joint Director Agriculture, Directorate of Agriculture
West Bengal
Dr. Subrata B. Dutta, Senior Scientist, Dept. of Science & Technology and Biotechnology
Dr. Bimalesh Samanta, Senior Scientist, Dept. of Science & Technology and Biotechnology
Ms. Lipika Khamaru, JRF, Dept. of Science & Technology and Biotechnology
Ms. Moutusi Panja, JRF, Dept. of Science & Technology and Biotechnology
Mr. Jyotibroto Chakraborty, JRF, Dept. of Science & Technology and Biotechnology
Mr. Santanu Samanta, JRF, Dept. of Science & Technology and Biotechnology
Mr. Deepalok Banerjee, JRF, Dept. of Science & Technology and Biotechnology

Climate Vulnerability Assessment for the Indian Himalayan Region Using a Common Framework
17
AcknowledgementsThis report on “Capacity Building on Climate Change Vulnerability Assessment in the States of Indian Himalayan Region (IHR)” is a part of the study and capacity building programme on vulnerability assessment in the IHR states. The work has been supported by the Indian Himalayas Climate Adaptation Programme (IHCAP), a project of the Swiss Agency for Development and Cooperation (SDC), which is being implemented as a bilateral cooperation programme with the Department of Science and Technology (DST), Government of India. IHCAP has been supporting the implementation of the National Mission for Sustaining the Himalayan Ecosystem (NMSHE) as a knowledge and technical partner.
We would like to express our gratitude to Dr. Akhilesh Gupta, Adviser/Scientist-G & Head, Strategic Programmes, Large Initiatives and Coordinated Action Enabler (SPLICE) and Climate Change Programme, Department of Science and Technology and Dr. Nisha Mendiratta, Scientist-G & Associate Head, Strategic Programmes, Large Initiatives and Coordinated Action Enabler (SPLICE) and Climate Change Programme, Department of Science and Technology for their continuous support and invaluable insights provided during the course of the study, especially during the Methodology Workshop. This project would have not been possible without thoughtful and timely contributions from the state governments of all 12 Himalayan states and their Climate Change Cells along with other relevant departments who have contributed extensively in preparation of the report. Their active participation in the Need Assessment Workshops and the Methodology Workshop has truly led the way.
We would like to thank Dr. Shirish Sinha, Ex- Deputy Head of Swiss Cooperation Office India for his invaluable guidance and support. We extend our thanks to Dr. Mustafa Ali Khan and Ms. Divya Mohan at IHCAP for their support and intellectual contribution at various stages of preparation of this report.
Finally, we would like the thank the colleagues and administration of Indian Institute of Technology Guwahati (IIT Guwahati), Indian Institute of Technology Mandi (IIT Mandi) and Indian Institute of Science, Bengaluru (IISc, Bengaluru) for providing both infrastructural as well as intellectual support in the process.

18
List of AcronymsBPL Below Poverty Line
DST Department of Science and Technology
IIT Guwahati Indian Institute of Technology Guwahati
IIT Mandi Indian Institute of Technology Mandi
IISc, Bengaluru Indian Institute of Science, Bengaluru (IISc, Bengaluru)
IHCAP Indian Himalayas Climate Adaptation Programme
IHR Indian Himalayan Region
IMR Infant Mortality Rate
INDC Intended Nationally Determined Contributions
IPCC Intergovernmental Panel on Climate Change
MGNREGA Mahatma Gandhi National Rural Employment Generation Act
NMSHE National Mission for Sustaining the Himalayan Ecosystem
SAPCC State Action Plan on Climate Change
SDC Swiss Agency for Development and Cooperation
VI Vulnerability Index

Climate Vulnerability Assessment for the Indian Himalayan Region Using a Common Framework
19
Abstract Realising the high vulnerability of the Indian Himalayan Region (IHR) with respect to climate change, Government of India launched the National Mission for Sustaining the Himalayan Ecosystem (NMSHE) as one of the missions under the National Action Plan on Climate Change. One of the key areas identified by NMSHE is to build capacities of the 12 IHR states for robust assessments of climate change vulnerability, adaptation planning and implementation. These states include Assam, Manipur, Meghalaya, Mizoram, Nagaland, Tripura, Arunachal Pradesh, Sikkim and the hilly districts of West Bengal in the eastern part and Himachal Pradesh, Uttarakhand and Jammu & Kashmir in the western part of IHR.
With this objective in mind, the support was extended by the Department of Science and Technology (DST) and the Swiss Development Corporation (SDC) to Indian Institute of Technology Guwahati (IIT Guwahati) and Indian Institute of Technology Mandi (IIT Mandi) to work towards the implementation of the project “Capacity Building on Climate Change Vulnerability Assessment in States of Indian Himalayan Region” during 2018-19 in collaboration with Indian Institute of Science, Bengaluru (IISc Bengaluru). The methodological framework considered under the project was according to the guidelines of the Fifth Assessment Report of Intergovernmental Panel on Climate Change (IPCC 2014) and based on a common set of indicators, making them readily comparable for different areas. The project aimed to develop state-level, and within states, district-level vulnerability maps and to identify potential drivers of vulnerability both at the state and district level in the 12 IHR states.
A series of consultations and workshops with the representatives from the 12 IHR states was organised during the course of the project. It included three Need Assessment Workshops, one Methodology Workshop and a Dissemination Workshop. Representatives from different state departments were present during these workshops. The purpose was not only to train them in the common methodological framework but also to brainstorm about the indicators of vulnerability, availability of data, challenges foreseen and ways to overcome these challenges. Such a coordinated approach and enhanced cooperation between states in the IHR and the departments within the state were assumed to improve resilience to climate change because several adaptation interventions will require coordinated efforts across administrative boundaries. The assessment exercise is unique because for the first time all the 12 Himalayan states have used a common framework, resulting in the production of comparable maps.
The final set of common indicators and their weights were selected through discussion and debates during the workshops. There are four broad categories of indicators used in the assessment based on those discussions: 1) socio-economic, demographic status and health; 2) sensitivity of agricultural production; 3) forest dependent livelihoods; and 4) access to information, services and infrastructure. Each of these broad indicators has two to six sub-indicators for the state level analysis. The weights to be assigned to each indicator were first discussed during the Methodology Workshop and were finally communicated by the states after they went back and had discussions with the relevant departments. The project team used the average of the weights communicated by the states for each indicator to carry out the state-level vulnerability assessment. The weighted average of normalised values of the indicators were used to derive a composite vulnerability index for each and a vulnerability ranking was developed based on that. Based on similar indicators district level vulnerability assessments were carried out by each of the states.
Based on the composite vulnerability index values, the states have been ranked from highest vulnerability to lowest vulnerability. The vulnerability index is highest for Assam (0.72) and Mizoram (0.71), followed by Jammu & Kashmir (0.62), Manipur (0.59), Meghalaya and West Bengal (both 0.58), Nagaland (0.57), Himachal Pradesh and Tripura (0.51 both), Arunachal Pradesh (0.47) and Uttarakhand (0.45). Sikkim is the least vulnerable state with the index being 0.42. However, it is important to note that all these states are vulnerable to climate risks and the fact that vulnerability is a relative measure implies that this assessment does not portray Sikkim, Uttarakhand or Arunachal Pradesh as having a low vulnerability in an absolute sense. Each state also constructed their district-level composite vulnerability indices and produced state-level vulnerability maps. From an array of above-mentioned drivers of vulnerability, the most important drivers identified by the states are low per capita income, lack of open forest area and less area of forest available per 1,000 households, lack of irrigation coverage, lack of availability of healthcare centres, high yield variability of food crops and higher proportion of marginal farmers.

20
The assessments carried out under this project can be conceptualised as the beginning of a process and not the end. The vulnerability assessments reported here are primarily based on Tier 1 approach. In the future, the states are encouraged to carry out assessments following Tier 2 and 3 approach involving greater consultation with the stakeholders. It will also be important to carry out sectoral vulnerability as appropriate for each of the states. It is envisaged to assist the state climate change cells to upgrade/revise their State Action Plan for Climate Changes as per the state-of-the-art methodology. However, vulnerability assessment is inherently a data intensive process. While the project also developed an understanding of requirement and availability of secondary data to carry out such assessments, the deficiency has also been marked in many of the states and sectors. Finally, successful implementation of this project puts forward the need for the next step – development of a similar toolkit for a good adaptation framework incorporating vulnerability assessment.

Climate Vulnerability Assessment for the Indian Himalayan Region Using a Common Framework
21
PART I: INTRODUCTION AND METHODOLOGY

22

Climate Vulnerability Assessment for the Indian Himalayan Region Using a Common Framework
23
1. Introduction
Studies across the world have brought forth substantial evidences that the climate is changing (IPCC, 2014; IPCC, 2018) and is adversely impacting both bio-physical systems (mountains, rivers, forests, wetlands etc.) and socio-economic systems (hill communities, coastal communities, agriculture, animal husbandry, etc.). The impact of climate change, however, is not uniform across space and time. It varies within the same region due to differences in the exposure and vulnerability of various ecosystems, economic sectors, and social groups (O’Brien and Leichenko, 2000). There is a need, therefore, to understand that assessment of vulnerability of a system is one of the critical steps to enhance adaptive capacity to combat climate change.
Himalayan region is sensitive to climate change and variability. Most parts of the region underwent significant long-term changes in frequencies of extreme temperature events over the last decades. Annual intense precipitation days (frequency) and annual intense precipitation intensity had increasing trends (Bhat and Nakamura, 2005; Wulf, et. al., 2010; Bookhagen, 2010; Joshi, et. al, 2014). Realising that the IHR is highly vulnerable and is a fragile ecosystem, the Government of India launched the NMSHE as one of the eight missions under the National Action Plan on Climate Change. The DST is coordinating the implementation of NMSHE with support from the SDC, under the IHCAP initiative1. One of the key areas identified by NMSHE, is to build capacities in the 12 IHR States2 to enable robust assessments of vulnerability, adaptation planning and subsequent implementation. IIT Guwahati, IIT Mandi and IISc, Bengaluru, with support from DST and SDC, are working towards building capacity of the state departments in these 12 IHR states, to assess vulnerability, through a project titled “Capacity Building on Climate Change Vulnerability Assessment in the States of Indian Himalayan Region”. The project focuses on
‘current’ climate vulnerability and defines vulnerability in terms of the capacity of individuals and social groups to respond to, or adapt to, any external stress placed on their livelihoods and well-being. The project has developed a uniform understanding of the ‘vulnerability’ concept, and comparable vulnerability maps have been prepared for all 12 IHR states using a common methodological framework of vulnerability assessment under ‘current’ climate condition. Such common framework to assess vulnerability generates comparable outcomes, and such coordinated approach between states in the region will facilitate promotion of resilience to climate change, as several adaptation interventions will require coordinated efforts across administrative boundaries. The assessment is unique, because for the first time, all the 12 IHR states have used a common framework and a set of common indicators to assess ‘current’ climate vulnerability, resulting in the production of comparable vulnerability maps.
This report provides a detailed account of the process adopted to arrive at a common methodology, indicators and comparable vulnerability maps for the 12 IHR states. The report is divided into four sections:• Thefirstsection‘Introduction and Methodology’ along
with the introduction, discusses the need to conduct vulnerability assessment for IHR states and describes the methodology used to assess vulnerability.
• The second section ‘Vulnerability Profiles of the Himalayan States’, provides an analysis of the state-level vulnerability assessments and the maps developed for 12 IHR states.
• Thethirdsection ‘District Level Vulnerability Assessment’ brings in the district-level vulnerability profiles of the 12 states, developed using a common vulnerability framework and methods.
• Thefourthsection ‘Conclusion and Way Forward’ puts forth the final concluding remarks and the road ahead from there.
1. IHCAP is designed as knowledge and technical support for helping in the implementation of NMSHE.2. See figure 1 for the names of the 12 states.

24
2. Need for vulnerability assessment in the IHR
Figure 1: Indian Himalayan Region (Source: National Mission on Himalayan Studies)
The Himalayan ecosystem is vital to the ecological security of the Indian landmass. It plays a crucial role in maintaining forest cover, feeding perennial rivers that are the source of drinking water, irrigation, and hydropower, conserving biodiversity, providing a rich base for high value agriculture, and spectacular landscapes for sustainable tourism. Under future climate change scenarios, impacts of climate change are projected to exacerbate, thereby increasing the vulnerability of bio-physical and socio-economic systems (IPCC, 2014). Mountains, being one of the most fragile environments on earth, are among the regions that are most sensitive to climate change (Neu, 2009). Although mountains differ considerably from one region to another, one common feature is the complexity of their topography (Beniston, 2003). Several observational studies show that the IHR will experience higher levels of climate change, and its associated impacts on both bio-physical and socio-economic systems will be severe (Karma et al., 2010).
IHR is the section of the Himalayas within India, spanning the states of Jammu & Kashmir, Himachal Pradesh, Uttarakhand, mountainous parts of West Bengal, as well as the North Eastern states of Sikkim, Arunachal Pradesh, Assam, Manipur, Meghalaya, Mizoram, Nagaland and
Tripura (Figure 1). The region is also experiencing high variability in monsoon rainfall, which in turn is affecting the flow and flood regimes of the mountain streams along with the agriculture system, which is the primary source of livelihood for the local communities (Karma et al., 2010). Poverty is widespread and the capacity of people to cope with climate change impacts is quite low (Barua et al., 2013). The mountain communities are highly dependent on climate sensitive biological or natural resources for their livelihood and survival (Kollmair et al., 2005). Thus, the impact of climate change can be extremely severe on these communities.
The main occupation of the IHR community is agriculture, largely based on rain-fed farming practices, and tourism (Saxena, et al., 2005; Dekens, 2005; Sharma, et al., 2007; NITI Ayog, 2018) - both highly climate sensitive and therefore vulnerable to climate change. Further, communities have limited livelihood options and experience higher marginalisation as infrastructure, such as road and transport, markets, power supply and communication, are limited and there is a higher dependence on natural resources. Under changing and variable climate, such constraints are likely to add to the current climate vulnerability of the Indian Himalayan communities (Barua et al., 2013). Adaptation cannot

Climate Vulnerability Assessment for the Indian Himalayan Region Using a Common Framework
25
be planned solely on the basis of climate projections; information on risk and vulnerabilities is also needed to determine how the climate interacts with socio-economic issues (European Environment Agency, 2016). Therefore, the first step is to understand ‘who is vulnerable, and why?’. Identifying the current drivers of vulnerability can assist in designing adaptation interventions specific to the area.
3. Conceptual framework of vulnerability
Assessing vulnerability is important for defining the risks posed by climate change and for identifying measures to adapt to climate change impacts (GIZ, 2004). It enables practitioners and decision makers to identify the most vulnerable areas, sectors and social groups, to develop targeted climate change adaptation options for specific contexts. But vulnerability is a complex subject that has many dimensions (economic, social, political and geographic), and to capture the diversity associated with vulnerability, several methods and conceptual frameworks have been developed. These frameworks have been applied to a wide range of development-associated sectors, ranging from natural hazards research, food security research and poverty analysis, to sustainable livelihoods research and related fields (Hinkel, 2011). These methods and frameworks, however, often have overlapping effects that makes it difficult to decide which one would have been the best for a specific analysis.
Consensus has been reached on the fact that vulnerability is bound to a specific location (Hinkel, 2011) and context (Cutter et al., 2008). It is therefore important to define and understand vulnerability in the context of IHR states.
3.1 Understanding vulnerability
Vulnerability, being a non-observable and non-measurable state of a system has been a theoretical concept (Hinkel, 2011). It has indicated predisposition of a natural ecosystem or a socio-economic system to be adversely affected. IPCC has developed a climate change risk-impact framework, which consists of three components namely, hazard, exposure and vulnerability (Figure 2). Further, vulnerability consists of sensitivity and adaptive capacity. IPCC conceptualised vulnerability as the propensity or predisposition of a system to be adversely affected (IPCC, 2014). It includes sensitivity or susceptibility to harm and lack of capacity to cope and adapt. Vulnerability has been conceptualised as an internal property of a system that is a function of its current endogenous lack of (adaptive) capacity to overcome the adverse impact (its sensitivity) of a stressor. In anticipation of a climatic hazard or a non-climatic stressor, therefore, vulnerability of a natural ecosystem or socio-economic system is assessed as a function of its sensitivity (that determines the first order impact of a hazard/stressor on the system) to such hazard/stressor and its lack of (adaptive) capacity to overcome such sensitivity.
Figure 2: IPCC (2014) climate change risk framework

26
Vulnerability could arise with respect to any system, be it bio-physical or social. It has significant implications when discussed in the context of susceptibility of fragile ecosystems, such as the Himalayan Region, to climate stimuli. The concept of vulnerability could be operationalised in two ways: 1) Starting point/contextual approach (Allen, 2003; O’Brien et al., 2007) - when vulnerability is considered as a pre-existing condition, for example, vulnerability under current climatic condition; and 2) End point/outcome approach (Kelly and Adger, 2000; O’Brien et al., 2007) - when vulnerability of a system is assessed before and after exposure to the hazard. In the current project, the first approach is adopted to assess vulnerability of the IHR.
Vulnerabilities could be of various types and broadly classified into bio-physical and socio–economic (including institutional). Bio-physical (natural) vulnerability considers the extent to which a natural system is susceptible to damage from climate change, for example forests, grasslands, etc. The socio-economic dimension is referred to as ‘‘a region’s capacity to recover from extreme events and adapt to change over the longer term” (Füssel, 2007). The project has mainly considered socio-economic vulnerability for assessment, with a few bio-physical indicators, as the economies in IHR states are highly dependent on natural resources.
Vulnerability assessment under current climate provides information about the current weaknesses of a natural or socio-economic system, along with the drivers of such weaknesses. This will enable development of strategies to address the identified system weaknesses and to deal with or adapt to the drivers. The IPCC (2014) concluded that reducing vulnerability to the risks from current climate variability is the first practical step to curtail losses and would be a reliable and ‘no-regret’ approach to reduce current vulnerability and build long-term resilience under climate change. Current vulnerability assessment helps us to: • Rank thebio-physical or socio-economicunitsusing
an Index.• Create demand among stakeholders for adaptation
action.• Assesstheextentofvulnerability.• Identifythedriversofvulnerability.
• Identify the areas/systems/communities that arevulnerable.
• Planadaptationstrategies.• Createawarenessamongthestakeholders.
3.2 Need for a common framework
While most of the IHR states have earlier developed vulnerability profiles of their states, these profiles are not comparable, as the methods used by the states vary. States have used the IPCC-2007 definition and framework of ‘vulnerability’ and the focus has been on assessing the future vulnerability to climate change rather than understanding the current climate vulnerability of IHR states. Further, as states have developed the profiles or maps in silos, the method used, the indicators chosen, and the outcome derived from the assessment is not comparable. In the present assessment, the definition and framework of vulnerability, according to the IPCC-2014 is used and a common set of indicators are used to arrive at comparable vulnerability profiles of 12 IHR states. Such comparable outcomes are useful for the government officials, implementers, decision makers, adaptation funding agencies and development experts, to have a common understanding on vulnerability, enabling them to assess which state in IHR is more vulnerable, what has made them vulnerable and how they might address these vulnerabilities?
4. Methodology
This section describes the common framework and methods (Sharma et al., 2018) used for vulnerability assessment and the process followed to operationalise it for the 12 IHR states.
4.1 Steps to vulnerability assessment
The study has adopted the framework, methods and guidelines developed under the IHCAP by Sharma et al. (2018). The vulnerability assessment includes 12 steps, as shown in Figure 3.
The study has adopted the framework, methods and guidelines developed under the IHCAP by Sharma et al. (2018). The vulnerability assessment includes 12 steps, as shown in Figure 3.

Climate Vulnerability Assessment for the Indian Himalayan Region Using a Common Framework
27
Figure 3; Steps in vulnerability assessment (Sharma et al., 2018)
Step 1: Scoping and objectives of vulnerability assessment
Step 2: Selection of type of vulnerability assessment – “Integrated Vulnerability Assessment”
Step 3: Selection of tier method – Tier I and 2
Step 4: Selection of scale, period of assessment; State-level and District-level – Current Vulnerability
Step 5: identification, selection and definition of indicators for vulnerability assessment
Step 6: Quantification and measurement of indicators; Largely Secondary Data based
Step 7: Normalisation of indicators – to make the indicators unitless
Step 8: Assigning weights to the indicators; Stakeholders – Government Departments and Experts
Step 9: Aggregation of indicators and development of vulnerabilty index
Step 10: Representation of vulnerability: spatial maps, charts and tables of vulnerability profiles and indices
Step 11: Vulnerability ranking of sectors, regions, communities, cropping systems, river basins, watersheds, forest types
Step 12: Identification of drivers of vulnerability for adaptation planning
Each of the steps mentioned above in Figure 3 is discussed in detail below.
Step 1: Scoping of vulnerability assessment
The scope and objective of the project is to identify and rank the vulnerable states and their respective districts/blocks in the IHR. The most vulnerable districts need to be identified for prioritisation at¬ the time of policy making and for formulating adaptation strategies and awareness generation. The stakeholders are the policy makers and their respective government departments from the states.
Step 2: Selection of type of vulnerability assessment
Vulnerability assessment could be of four types:1. Bio-physical vulnerability assessment.2. Socio-economic vulnerability assessment, which
includes institutional vulnerabilities.3. Integrated vulnerability assessment in which both
bio-physical and socio-economic/institutional vulnerabilities is considered.
4. Hazard-specific vulnerability assessment.
For the present assessment, the third type of vulnerability assessment (integrated vulnerability assessment
approach) is adopted.
Step 3: Selection of Tier methods
A vulnerability assessment could be carried out simply by utilising secondary and/or primary data sources, GIS techniques and climate model output. Based on the type of data used, three types of tiers are identified:a) Tier 1 would be a top-down approach, largely based
on secondary data.b) Tier 2 would be a combination of top-down and
bottom-up approaches and would require use of both secondary and primary data.
c) Tier 3 would involve bottom-up approach extensively, along with spatial remote sensing, GIS information/data, and model outputs.
Here, Tier 1 has been chosen for the assessment under the project, considering the availability of necessary secondary data and time limitation.
Step 4: Selection of spatial scale and period for vulnerability assessment
Vulnerability assessment could be carried out at different spatial scales, i.e., micro scale (village or household level)

28
or macro scale (district or state level). It could also be carried out for different time periods, i.e. current, short-term (2030s), mid-term (2050s), and long-term (2100).
The present assessment is carried out at the macro scale i.e., state / district level, and for the current climate period.
Step 5: Identification, definition and selection of indicators for vulnerability assessment
This is one of the most crucial steps in vulnerability assessment as the outcome is highly dependent on the choice of indicators. While choosing the indicators, several factors have been considered viz. type of indicator (i.e. whether it captures ‘sensitivity’ or ‘adaptive capacity’), and nature of indicator (‘Bio-physical’ or ‘Socio-economic’). Indicators have been selected through expert consultations.
For instance,a) Percentage of area with slope > 30% is a bio-physical
indicator and captures the sensitivity aspects of vulnerability.
b) Per capita income is a socio-economic indicator and reflects adaptive capacity.
Step 6: Quantification and measurement of indicators
Data, in quantifiable units are required for estimating the vulnerability index. As such, reliable sources of secondary data are used to quantify the indicators selected. For example, the indicator percentage of area with slope > 30% is quantified by using the data published by the National Remote Sensing Center.
Step 7: Normalisation of indicators
Different indicators are measured in different units (e.g. area under forest in terms of sq. km, Mahatma Gandhi National Rural Employment Generation Act (MGNREGA) in terms of person-days/household/year, per capita income in Rupees, etc.). In order to aggregate the indicators, they have to be normalised or made unit-free. The normalisation process would vary, depending on the nature of the relationship of a particular indicator with vulnerability (positive or negative relationship). The following two formulae are adopted depending on the relationship:
• Case I: Positive relationship with vulnerabilityActual Indicator Value – Minimum Indicator Value
Normalised Value = _____________________________________________
Maximum Indicator Value – Minimum Indicator Value
An example of an indicator, having a positive relationship with vulnerability would be percentage of area with slope > 30%. Here, if the percentage area with slope >30% increases, the vulnerability of a region would also increase.
• Case II: Negative relationship with vulnerabilityMaximum Indicator Value – Actual Indicator Value
Normalised Value = _____________________________________________
Maximum Indicator Value – Minimum Indicator Value
An example of an indicator, having a negative relationship with vulnerability would be per capita income. If the per capita income of a region increases, a decrease in vulnerability could be assumed.
Step 8: Assigning weights to indicators
Weights are assigned to each indicator according to their importance in determining vulnerability of a system. To get reliable results, appropriate weight to each indicator has to be assigned. Weights are assigned thorough discussion and consultation with the stakeholders namely, state government development department staff, based on the nature and importance of each indicator. While assigning the weight, it was ensured that the weight assigned to all the indicators, add up to 100.
In case of assessments with composite indicators, where each indicator may have two or more sub-indicators, weights are to be assigned in the following manner. Suppose, the weight assigned to the ith indicator is Wi and the weights assigned to the jth sub-indicators of this ith indicator is Wij. Therefore, it should be the case that ∑jWij = Wi and ∑ijWij = ∑iWi=100. This implies that if the weights of the sub indicators of indicator i are added then one should get the weight assigned to indicator i itself. For example, suppose, an indicator, say indicator 1 has three sub-indicators with assigned weights W11 ,W12 and W13, then it should be the case that W11 + W12 +W13 = W1 = weight assigned to indicator 1.
Step 9: Aggregation of indicators and development of vulnerability index
Aggregation of different indicators with weights is necessary to obtain a composite aggregated vulnerability index or value. For this, the weights are multiplied with the normalised indicator value and then aggregated to obtain the overall vulnerability index value for each state/district in the IHR.
Step 10: Representation of vulnerability; spatial maps, charts and tables of vulnerability profiles and index
The obtained vulnerability index value can be represented with the help of tables, charts and maps.

Climate Vulnerability Assessment for the Indian Himalayan Region Using a Common Framework
29
• AVulnerabilityIndex(VI)isa‘metricthatcharacterisesthe vulnerability of a system’.
• VulnerabilityIndexvaluesliebetween0and1,where0 indicates least vulnerable and 1 indicates most vulnerable.
• Arrangementof theassessedVIvalues indecreasingor increasing order allows ranking of units of study.
The Vulnerability Index value only provides a sense of quantified status of vulnerability and is largely conceptual in its utility. The value does not really have any stand-alone practical significance. But vulnerability is a relative concept, and VI indicates that a given state or district has a higher or lower vulnerability, compared to other states/districts.
Step 11: Vulnerability ranking of the spatial units
With respect to their level/degree of vulnerability, all spatial units can be categorised into three categories, for distinguishing the level of vulnerability - Low, Medium and High vulnerability.
Step 12: Identification of drivers of vulnerability for adaptation planning
Identifying the drivers of vulnerability is crucial for adaptation planning. It enables the development departments to develop targeted adaptation programmes to reduce vulnerability.
Once the assessment is carried out based on the above-mentioned methodology, different geographical regions under analysis would have different vulnerability scores. So, the final task is to represent the vulnerability ranking based on these scores. The main purpose of representation of vulnerability is to provide information regarding the relative vulnerability, and the associated risks to policy making bodies and other stakeholders. The most common way of representation is a spatial map with a gradient of colours, indicating the level of vulnerability across regions. Graphs, charts and tables are also adopted in the present assessment for representing level of vulnerability.
5. The process of developing vulnerability profiles of IHR states using the common framework
As climate change poses unprecedented challenges on multiple sectors, it is important to develop strategies that take into consideration the vulnerability of all the concerned sectors. Within the federal structure of India, one of the ways to do so would be through capacity building of various concerned state departments to assess vulnerability, so that there
could be a common understanding regarding ‘who is vulnerable, what makes them vulnerable and how to address these vulnerabilities’. This was achieved by bringing together representatives of different state departments, through a series of workshops, to develop a uniform understanding about vulnerability, then assess vulnerability based on a common methodological framework, and mapping the same subsequently. This allows the states to have better visual representation and understanding of the vulnerabilities, and the drivers of vulnerability, so that decision makers can analyse where resources (e.g. funds allocated for adaptation planning) would require to be allocated for protection of these vulnerable areas, and to adapt to any probable future climate-induced disaster (Edwards et al., 2007). Figure 4 presents the approach adopted by this project to bring together representatives of different state departments, and their capacity building for carrying out the vulnerability assessment.
Figure 4: The approach followed under the project towards state-level capacity building
Selection of IHR – Likely to be most vulnerable to climate variability and climate change
Part of NMHSE / IHCAP Mandate
Development of vulnerability framework, guidelines and manual – Based on IPCC 2014 Framework
By IISc, Bengaluru
State-level Vulnerability Need Assessment Workshop by identification of broad set of indicators
IIT Guwahati and IIT Mandi
Generation of data for the indicators by the states and development of weights
Training workshop and vulnerability profile development for representativeness from states
At IITs and IISc
Preparation of vulnerability profiles/Maps/Report District Level State Level
5.1 Inception Meeting
The following points were discussed during the inception meeting, organised on February 9, 2018 at IISc, Bengaluru. • Conceptualisingthemethodologymanual

30
o Common methodology and common framework o Approach – current vs. future vulnerability;
identifying the tier; combined assessment
• Issues tobe addressedduring theNeedAssessmentWorkshopso Selection of the indicators, use of vulnerability
assessment for strategising adaptation, who would be the stakeholders, and scale and objective of the vulnerability assessment
• Expectedoutcomeo Development of state and district-level
vulnerability mapso Sectoral and block-level assessments
5.2 Need Assessment Workshops
Three Need Assessment Workshops were carried out in IIT Guwahati (March 2018) and IIT Mandi (April 2018) to introduce the common methodological framework for vulnerability assessment to the different state representatives of the IHR. The aim of these workshops was to assess the needs of the states in terms of dealing with the changing climate, their current capacities and the kind of data available. During these workshops, participants were provided with an overview of the evolution of vulnerability concept and framework in the context of vulnerability assessment and adaptation to climate change in the IHR. An elaborate discussion took place regarding the goals for assessment of vulnerability, and the approach, methods and application to reduce vulnerability, citing important examples from the respective participating IHR states. The participating states also discussed the sources of data and methods of data collection. After completion of the Need Assessment Workshops, a list of twenty indicators was finalised. The participants were provided with a period of five months to identify the sources of data and compile data for the selected indicators. This data served as the basis for further proceedings during the Methodology Workshop.
5.3 Methodology Workshop
The Methodology Workshop was organised at IIT Guwahati from September 10-14, 2018. A total of 88 representatives, from the 12 states of IHR participated in the workshop. During the workshop, methodological steps were demonstrated to provide hands-on training to the participants with the data provided by the states. Through this workshop emphasis was laid on the process of analysis, using the common methodological framework and visual representation of the key results through maps and other forms that would aid in identification of
drivers of vulnerability in their states, along with the most vulnerable areas that would require to be prioritised.
The objectives of the Methodology Workshop could be enlisted as: • Applying a common methodology for vulnerability
assessment and vulnerability mapping for the states of IHR
• Hands-on training of the participantswhile carryingout the vulnerability assessment and developing the vulnerability maps
• Identifyingasetofcommonindicatorsforastate-levelvulnerability assessment and mapping pan IHR
• Identifying a set of common indicators for district-level vulnerability assessment and mapping
• Discussion on and finalisation of the weights to beprovided to each of the indicators
• States carrying out a preliminary district-levelvulnerability assessment and presentation of the initial results in a common format to receive feedback on the same
• Assisting the states to carry out further micro-levelvulnerability assessments for vulnerable sectors.
The methodology workshop witnessed the participation of representatives from state climate cells and the state departments of agriculture, horticulture, soil conservation, water, environment, forestry and biodiversity, public health engineering, biotechnology, rural management and development, disaster management, environmental information system (ENVIS), DST and higher education. It also included representatives from the academic institutions of Tripura and Arunachal Pradesh. The expected outcomes from this methodology workshop included creation of comparable vulnerability maps for all the 12 Himalayan states, based on common indicators and common methodological framework under current climate condition. The 12 IHR states presented their work based on the preliminary vulnerability assessment conducted during the workshop. The presentation included description of indicators, specific data sources, assigned weights, vulnerability scores of districts and maps based on the same, and identification of main drivers of vulnerability. Each of the state teams were asked to prepare a report on the outputs generated using a standard template shared through this workshop. While preparing the final reports, participants were requested to re-assign the weights for the indicators, after in-depth discussion with other departments of the states, so that the final report submitted would have better representation of the weights and drivers of vulnerability.

Climate Vulnerability Assessment for the Indian Himalayan Region Using a Common Framework
31
PART II: VULNERABILITY PROFILES OF THE
STATES IN THE IHR

32

Climate Vulnerability Assessment for the Indian Himalayan Region Using a Common Framework
33
6. State-level vulnerability assessment in the IHR
Mountain areas are especially susceptible to global warming and so is the IHR. Given the uncertainties of magnitude of projections and characteristics of climate change, understanding the vulnerability of these systems is crucial for planning and policy making for sustainable management of the IHR and building resilience to climate risks. The regional assessment of IPCC suggests that such impacts of climate change vary across mountain regions and communities (IPCC 2014). In general, the impacts are severe where the vulnerabilities are high. The communities in remote and marginalised mountain regions tend to be more seriously affected by climate change due to lack of assets and capacities to cope with and adapt to the impacts (Barua et al 2013). This section deals with assessing the vulnerability of the 12 IHR states in order to understand the current vulnerability of the state and to identify the potential factors that reduce their capacity to cope with and adapt to the impact of climate change.
Based on a Tier 1 methodology as stated in Section 4, a state-level vulnerability assessment has been carried out for the IHR. It followed an indicator-based approach and used secondary sources of information to quantify the indicators selected.
6.1 Selection of indicators and rationale
The indicators for the state-level vulnerability assessment of the IHR were selected through expert consultation. First, four broad categories of indicators were selected: 1) socio-economic, demographic status and health; 2) sensitivity of agricultural production; 3) forest dependent livelihoods; and 4) access to information, services and infrastructure. Each of these broad indicators have two to six sub-indicators. The expert consultation ensured that the indicators selected comprehensively represent the inherent socio-economic and bio-physical systems of the 12 IHR states. The list of indicators, sub-indicators, the rationale for their selection, their functional relationship with vulnerability and the source of data used to quantify them are provided in Table 1 in Appendix.
a. Socio-economic, demographic status and health indicator is composed of six sub-indicators that aim to comprehensively represent the socio-economic, demographic and health status of the 12 IHR states. The six indicators are: population density; percentage marginal farmers; livestock to human ratio; per capita income; number of primary healthcare centres per
100,000 households; and percentage of women in the overall workforce.
b. Sensitivity of agricultural production is captured by considering three sub-indicators - percentage area under irrigation; yield variability; and percentage area under horticulture crops.
c. Forest dependent livelihood is represented by percentage area under open forests and area under forests per 1,000 households. It tries to capture the extent of degradation of forest resources in each state and the competition for this resource.
d. Access to information, services and infrastructure is represented by five sub-indicators, namely: percentage crop area insured under all Insurance Schemes; percentage farmers taking loans; average person days per household under MGNREGA; average percentage area with >30% slope; and road density.
6.2 Normalisation, weights assigned and vulnerability index
This section presents a) normalisation of quantified indicators; b) weights assigned to selected indicators; and c) calculation of vulnerability index. These steps are essential to arrive at a vulnerability index value. a. Normalisation of indicator values: As the indicators
selected are quantified in different scale and units, they need to be normalised for aggregation. The actual sub-indicator values used and their normalised scores for all the 12 IHR states are presented in Table 2-5 in Appendix. Normalisation is done depending on the sub-indicator’s functional relationship with vulnerability (either positive or negative relationships) and based on step 7 of Section 4.
b. Assigning weights: As the objective of this assessment is to understand the relative ranking of the states in IHR with respect to their vulnerability and to understand the drivers of vulnerability to help the states prioritise adaptation interventions, a Tier 1 method of assigning of weights by stakeholders (staff of government departments and State Climate Change Cells) was adopted. The weights were assigned first to the four main indicators and then distributed to the sub-indicators such that weights of all sub-indicators of an indicator add up to the weight assigned to the indicator (refer to Step 8 in Section 4.1). Each state provided separate weights for the indicators and sub-indicators. For the state-level analysis, the average of the weights assigned by the 12 states are used. Weights assigned to the indicators and sub-indicators for the state-level analysis are presented in Table 6 in Appendix.
c. Calculating vulnerability index: Normalised values of the sub-indicators are multiplied by their respective

34
average weights to obtain the vulnerability score of the sub-indicator itself for each state. The vulnerability scores of all sub-indicators under one indicator is summed up to obtain the vulnerability score for the respective indicator. For example, the vulnerability scores of the three sub-indicators - percentage area under irrigation, yield variability and percentage area under horticulture crops are added to obtain the vulnerability score of the main indicator ‘sensitivity of agriculture’. Vulnerability scores of all four main indicators obtained in this manner are added up to arrive at the composite vulnerability index. This is basically same as taking the weighted sum of all 16 sub-indicators under consideration.
7. State-level vulnerability index
Based on the composite vulnerability index values, the states have been ranked from highest vulnerability to lowest vulnerability. Table 7 in Appendix provides the vulnerability index values for the four main indicators and the composite vulnerability indices for the IHR states and their corresponding vulnerability ranks. Based on this method of assessment, the vulnerability index is highest for Assam (0.72) and Mizoram (0.71), followed by Jammu
& Kashmir (0.62), Manipur (0.59), Meghalaya and West Bengal (both 0.58), Nagaland (0.57), Himachal Pradesh and Tripura (both 0.51), Arunachal Pradesh (0.47) and Uttarakhand (0.45). Sikkim is the least vulnerable state with the index being 0.42.
Further, it is important to note that all these states are vulnerable to climate risks and the fact that vulnerability is a relative measure implies that this assessment does not portray Sikkim, Uttarakhand or Arunachal Pradesh as having low vulnerability in an absolute sense. These states are least vulnerable relative to the other IHR states, but also have several inherent drivers of vulnerability that need to be addressed. These drivers are discussed in the Section 7.
The composite vulnerability index values may also be multiplied by 3, which would distribute the states on a vulnerability scale of low, moderate, and high vulnerability. When this was done, Sikkim and Uttarakhand were ranked 1 (low vulnerability); Arunachal Pradesh, Tripura, Himachal Pradesh, Nagaland, West Bengal, Meghalaya, Manipur and Jammu & Kashmir were ranked 2 (moderate vulnerability); and Mizoram and Assam were ranked 3 (high vulnerability) (Figure 4 and 5).
Figure 4: Vulnerability index of IHR States

Climate Vulnerability Assessment for the Indian Himalayan Region Using a Common Framework
35
Figure 5: Vulnerability index of IHR States
7.1 Sources of vulnerability
This section aims to identify the major drivers of vulnerability in all the 12 IHR states and the drivers are presented below in Table 1. It is important to note that the highest weights assigned to sub-indicators are per capita income; percentage area irrigated; area under forests per 1,000 households and percentage area under open forests. Thus, states having low per capita income, low
area under irrigation and low area under forests per 1,000 households and high area under open forests will receive a high vulnerability score. For example, Assam has the least area under irrigation, least forest area available per 1,000 rural households and the second lowest per capita income among the other IHR states, and thus scores the highest vulnerability score.

36
Table 1: Drivers of vulnerability in 12 IHR States
Rank State Drivers of Vulnerability
1 Assam The normalised values of all sub-indicators (Table 2-5 in Appendix) show that Assam, as a state falls in the higher side of vulnerability index. Other than three sub-indicators, namely, population density, yield variability of food grains and average % area with slope greater than 30 degree, the normalised values of all other indicators are above 0.5. Among them, six major drivers of vulnerability are: least area under irrigation; least forest area available per 1,000 rural households; and least number of farmers taking loans as compared to other states. It also has the second lowest per capita income; low percentage area covered under crop insurance and low MGNREGA participation. In fact, other than population density, this state has relatively high vulnerability with respect to all sub-indicators under socio-economic, demographic and health indicator. Similarly, since Assam has more flat lands relative to other states, which suggest lower sensitivity to natural disaster, lack of access to information and infrastructure puts this state into a situation where it would be extremely difficult to cope with any climate extremes.
2 Mizoram The state has very high sensitivity of agriculture sector along with poor connectively, access to information and infrastructure. The state has seven major drivers of vulnerability – highest yield variability, no area under crop insurance, largest area under open forests, and largest area under slope >30% as compared to other states. It also has the second lowest percentage area under irrigation and the third lowest road density among the 12 states. A glance at the normalised values to the sub-indicators show that agricultural sensitivity and lack of access are two major divers leading to lack of adaptive capacity of the state.
3 Jammu & Kashmir
Several drivers of vulnerability are evident for the state of J&K. These include, in the order of significance: least road density; no area under crop insurance; low area under forests per 1,000 rural households; high percentage of marginal farmers; low percentage area under horticulture crops; low livestock to human ratio; and low percentage of women in the overall workforce. This implies that four out of six sub-indicators under the socio-economic indicator, one out of three under the agricultural sensitivity indicator, one out of two forest-related sub-indicators and all access-related sub-indicators, barring the average slope, exhibit high degree of sensitivity and lack of adaptive capacity of the state. In fact, this state is in the most difficult situation with respect two important factors that increase the adaptive capacity – road density and crop insurance. Similar to Assam, Jammu & Kashmir also ranks high with respect to vulnerability, generally lagging in terms of most of the sub-indicators considered. So, similar to Assam, in this state also, the vulnerability is rather composite in nature and not explicitly sector-specific.
4 Manipur Manipur has three major drivers of vulnerability – lowest per capita income, low percentage of farmers taking loans and low area under forests per 1,000 households. Interestingly, other than income, and the availability of healthcare facilities to some extent, the performance of this state with respect to other socio-economic, demographic and health indicators are relatively better than other states. However, the vulnerability of the state arises from other indicators as well.
5 Meghalaya The vulnerability of this state arises from the socio-economic indicators and lack of access to information and infrastructure. The state has four major drivers of vulnerability: very low area under crop insurance; low per capita income; low area under forests per 1,000 households; and low percentage of farmers taking loans.
6 West Bengal
The mountain region of West Bengal stands almost at the middle of the ranking. This state has the highest population density, least number of primary healthcare centres per 100,000 households, least percentage of women in the overall workforce, second lowest area under forests, high percentage of marginal farmers and low MGNREGA participation as compared to other states. Given highest/close to highest normalised values of almost all socio-economic, demographic and health indicators, one would actually expect the state to have higher vulnerability ranking, however, extremely resilient agricultural sector with maximum irrigation facilities and horticulture, along with access to information, services and infrastructure helped the state to have relatively higher adaptive capacity.

Climate Vulnerability Assessment for the Indian Himalayan Region Using a Common Framework
37
7 Nagaland No coverage under crop insurance, low percentage of farmers taking loans and low area under forests per 1,000 rural households are the three major drivers of vulnerability in the state. However, this state has high per capita income, low population density, lowest prevalence of marginal farmers and highest women participation in the labour force that make the state relatively resilient.
8 H i m a c h a l Pradesh
Himachal Pradesh is an interesting case to observe. This is one of the rare states that is neither best, nor worst with respect to any of the sub-indicators under each category and the overall vulnerability is at the lower side. Relatively high vulnerability arising out of lack of irrigation and horticulture has been compensated by the fact that the yield variability of food grains is much lower in the state, leading to not so high sensitivity of agricultural production. Similarly, while per household availability of forest land is relatively lower in the state, there is no predominance of open forest. While the first lowers the adaptive capacity, the second leads to lower sensitivity, cancelling each other in a way. The state is not doing particularly well in terms of creation of its adaptive capacity through access to information and infrastructure, it needs to be observed that the weight assigned to this indicator is quite low (19%) to determine the magnitude of the VI alone. Coming to the sub-indicators under the category of socio-economic, demographic and health (weight = 34.5%), the performance of this state is consistently better with very low population density, availability of healthcare centres and very high participation of women in the labour force. Only low livestock to human ratio and presence of marginal farmers are the two major drivers of vulnerability in the socio-economic sector.
9 Tripura Although Tripura has the highest percentage under marginal farmers, low per capita income, low percentage area under forests and under crop insurance, it has the highest road density, lowest area under slope >30%, highest MGNREGA participation and lowest yield variability when compared to other states.
10 Arunachal Pradesh
One would expect Arunachal Pradesh to appear more vulnerable when compared to the other states in the IHR, owing to the fact that it has a large area under slope >30%, low road density, least livestock to human ratio, lowest percentage of area under horticulture crops, least participation in MGNREGA, no crop area under insurance and low percentage of farmers taking loans. However, similar to Himachal Pradesh, most of the high vulnerability sub-indicators in this state fall under the indicator – access to information services and infrastructure. This indicator, in itself carries only 19% of weights. On the other hand, socio-economic, demographic structure and health, as an indicator carries a much higher weight (34.5%). Arunachal Pradesh has been found to be doing relatively well with regard to the sub-indicators under this indicator. For example, this state has the least population density and the most densely available healthcare facility among all the 12 states. It also has a relatively low % of marginal farmers and high women participation in labour force that reduces the vulnerability of the state. However, the per capita income is not among the best. Besides, the state has the largest area under forests per 1,000 households and moderate area under open forests as compared to other states. Low vulnerability with respect to socio-economic, demographic and health sub-indicators, along with these other sub-indicators highlight the state’s adaptive capacity, which offset the many sensitivities and thus the state scores a lower vulnerability index value.
11 Uttara-khand
Only one major driver of vulnerability for the state of Uttarakhand – low area under forests per 1,000 households.
12 Sikkim Although Sikkim has three major drivers of vulnerability – low area under forests per 1,000 households, low percentage area covered by insurance and low percentage of farmers taking loans, it has the highest per capita income and the lowest area under open forests, which relatively lowers vulnerability of the state when compared to the other states in the IHR.

38
While using the results of such vulnerability assessment, one needs to take into consideration the fact that the vulnerability index value only provides a sense of quantified status of vulnerability and is largely conceptual in its utility. The value does not have any stand-alone practical significance, but helps in determining the ranking of one state with respect to another. In fact, this state-level vulnerability assessment reveals that the difference between highest index values in Assam (0.72) and the lowest in Sikkim (0.42) is rather low given
the fact that the coefficient of variation of vulnerability indices calculated in several states is only 17%. This, in a way implies that all the states in the IHR are more or less vulnerable given their current status with respect to selected indicators. However, one may also observe that the drivers of vulnerability of different states in the IHR are diverse in nature. Hence while formulating adaptation measures, there is no one panacea that can be applied to all the states.

Climate Vulnerability Assessment for the Indian Himalayan Region Using a Common Framework
39
PART III: DISTRICT-LEVEL VULNERABILITY
ASSESSMENT FOR IHR STATES

40

Climate Vulnerability Assessment for the Indian Himalayan Region Using a Common Framework
41
8. Need for district-level vulnerability assessment
Blocks, districts and states are administrative units for governance where the majority of the regulatory and developmental decision-making occurs. Vulnerability assessment carried out at block or district level can depict the profile of vulnerability at the state level showing blocks and districts under different vulnerability categories such as low, medium and high vulnerability. Such information helps in the identification of priority blocks/districts for resource allocation, prioritising the allocation of adaptation funds and adaptation interventions.
This section provides an analysis of the vulnerability assessment done by each of the 12 states at the district level.
9. The process of selection of indicators and assigning weights
During the Need Assessment Workshop a total of 20 indicators of vulnerability were selected by the resource persons for which data was to be brought by the participants to work during the Methodology Workshop.
In this workshop, an assessment of the twenty indicators was conducted and the number of indicators was narrowed down to eight. Selection of too many indicators was avoided, as the division of weights among many indicators would reduce the value of the weights assigned to each indicator. The most important criteria for selecting the indicators were the availability of data. The participants were also asked to select a state-specific indicator including the selected eight indicators. After finalising the indicators, the state representatives were asked to assign weights to the indicators. In-depth discussion among the team members of each state took place, based on which weights were assigned and presented. Feedback and comments were shared by resource persons, following which the teams re-worked and finalised the weights. This was followed by normalisation of indicators using functional relationships. The normalised indicators were aggregated and vulnerability index for each indicator was developed.
Table 2 below provides rationale (of choosing the particular indicator) and functional relationship of the indicators with vulnerability. Similar to the state-level exercise, a plus sign implies positive relation with vulnerability and negative implies the opposite.
Table 1: Drivers of vulnerability in 12 IHR States
Sl. No. Indicators Rationale and functional relationship of indicators with vulnerability
Data Sources
1 % area under slope>30 degree (+)
Steep topographical feature implies lack of availability of flat land and difficulty in access; likely to be adversely affected during floods, landslide, cloud burst etc. and increases sensitivity.
Manipur State Remote Sensing Data (2018), Survey of India, Mizoram Remote Sensing Application Centre (2011-2012), SRTM (NRC), SRTM DEM, Sikkim Land Use Land Cover Data (2011), Tripura Space Application Centre, ASTER GDEM 30m, CARTO DEM 10m NRSC, ASTER DEM (30m)
2 % area under forest cover (-)
Forests provide a safeguard of ecological processes, provide biophysical stability and alternate livelihood options through extraction of fodder, fuelwood, and NTFPs. It enhances adaptive capacity.
ISFR (2017), FSI Report (2017), FSI Report (2016), Government of Sikkim State Forest Report (2005), Department of Agriculture (Government of Tripura), LISS IV, CARTOSAT PAN 2.5m, Assam State Forest Report (2013)
3 Yield variability of food grains (+)
High variability in yield indicates fluctuations in agro-climatic conditions over time. Agriculture sector has high contribution to the State Domestic Products and employment for the states in IHR. High yield variability reflects lack of adaptive capacity.
Government of India (2015, 2018), Indian Stats Data, Department of Agriculture (Government of Nagaland), District Statistical Handbook (Government of West Bengal), Agriculture Statistics (2007-2017)
4 Population density (+)
Pressure on available natural resources, increases sensitivity.
Government of India (2011), Census 2011, Statistical Abstract of Mizoram (2017), Directorate of Economics and Statistics (Government of Tripura)

42
5 Female Literacy Rate (-)
Educated individuals and societies, especially with high female literacy, have better preparedness and response to the disasters, suffer lower negative impacts, and are able to recover faster and hence have higher adaptive capacity.
Government of India (2011), Census 2011, Statistical Abstract of Mizoram (2017), Directorate of Economics and Statistics (Government of Tripura), Primary Census Abstract (2011), Statistical Handbook of Assam (2016)
6 Infant Mortality Rate (IMR)3 (+)
IMR is an indicator of the overall state of the public health, access to improved water, sanitation and medical infrastructure. Higher value implies lack of adaptive capacity.
Census 2011, NHSRC 2011, NHM-HMIS (2015-16), NHM Department of Health and Family Welfare (Government of Nagaland, 2017-18), Jammu & Kashmir State NHM Report, 2014 DESME (2005), Directorate of Family Welfare and Primitive Medicine (Government of Tripura), Department of Health (Himachal Pradesh, 2011), Annual Health Survey (Uttarakhand, 2011-12)No. of child deaths (up to 5 years) – Government of West Bengal District Statistical Handbook (2010-2011)No. of doctors- NRHM (2017)
7 Below Poverty Line (BPL) Households (+)
Higher percentage of BPL households indicates lesser adaptive capacity
Government of India (2011), State Economic Survey Report (2017), Human Development Report (Meghalaya, 2008), Economics and Statistical Department (Government of Mizoram, 2015-16), Antyodaya Anna Yojana Scheme, Census 2011, Department of Food, Civil Supplies and Consumer Affairs (Government of Tripura)
Per capita Income
A direct indicator representing the inherent sensitivity of people in a region.
Digest of Statistics, Jammu & Kashmir 2014, Directorate of Economics and Statistics, Uttarakhand, Economics and Statistics (Himachal Pradesh)
8 Average man-days under MGNREGA (-)
Provides alternate sources of income and enhances adaptive capacity.
Government of India (2018), MGNREGA- Delivery Monitoring Unit (DMU )report, MGNREGA website, Ministry of Rural Development, Government of India, Rural Development (Uttarakhand, 2015-16)
3 In case of unavailability of infant mortality rate data, data of no. of child deaths (upto 5 years) (by West Bengal) and no. of doctors (by Arunachal Pradesh) has been considered.
Table 2: Weights assigned by states to the selected indicators
State % area under
slope>30°
% area under forest cover
Yield variability
of food grains
Popu-lation
density
Female literacy
rate
Health indicator@
Per capita income/
BPL
Average man-days
under MGNREGA
Arunachal Pradesh*
10 30 20 3 15 8 12 2
Assam 8 12 20 5 10 9 25 11
Himachal Pradesh#
16 4 13 14 4 9 4 3
Jammu & Kashmir
15 24 12 8 6 5 20 10
Manipur 6 20 28 7 10 8 18 3

Climate Vulnerability Assessment for the Indian Himalayan Region Using a Common Framework
43
4 District level vulnerability assessments has been done for 16 districts as many new districts were bifurcated out from these existing districts recently (2014-15).
Meghalaya 20 18 30 1 0.5 3.5 17 10
Mizoram 25 25 10 5 5 10 5 15
Nagaland 15 35 22 6 4 3 10 5
Sikkim 23 10 5 13 12 8 14 15
Tripura 7 20 28 16 6 5 14 4
Uttara-khand
24 8 22 5 8 5 20 8
West Bengal**
17 15 15 15 10 10 - 18
@ IMR/ No. of doctors (State marked with *)/ No. of child deaths (under 5 years of age) (states marked with **)
# Himachal Pradesh has considered 6 other indicators (weights are in parenthesis): % area without irrigation (19); % area under open forest cover (3); Overall literacy rate (41), % agricultural labour (2); Early warning system (2) and % are under fruit crop (3)
10. District-level vulnerability profiles of 12 IHR states
After calculating the vulnerability indexes, the values were used for vulnerability ranking of districts in the 12 Himalayan states, and develop tables, charts and spatial maps, to represent vulnerability profiles. This section provides a brief description of the states and the district- level vulnerability profiles developed by the states
10.2 Arunachal Pradesh
10.2.1 About the state
Arunachal Pradesh, the largest state in North East India, is situated in the eastern IHR between latitudes 260 30’N and 29o 30’N, longitudes 91o 30’E and 97o 30’E with varying elevations ranging from 50 metres in the foothills gradually ascending to above 7000 meters . The Climate in Arunachal Pradesh ranges from subtropical to temperate depending on the altitude of the land. The state is
administratively divided into 22 districts4 with Itanagar as its capital region (see figure 6 ). About 61.54% of the total geographical area in Arunachal Pradesh is under forest cover. The important forests types found in the state are tropical evergreen, semi evergreen, deciduous, pine, temperate, and alpine. The state possesses India’s second highest level of genetic resources, being one of the world’s 18 biodiversity hotspots (Government of Arunachal Pradesh 2017). The population of Arunachal Pradesh is 1.38 million with a population density of 17 person per sq. km (Government of India, 2011b). Agriculture and animal husbandry are the two predominant occupations among the rural communities. The sex ratio is 938 females per 1,000 males. Percentage of population living below poverty is 34.67% as per report of Government of India (2013). Number of doctors per 1,000 population is below 1 across 16 districts. District wise percentage of forest cover, area not available for cultivation, cultivable land, net area sown and cropping intensity are given in table 8 in Appendix.

44
Figure 6: Spatial representation of districts in Arunachal Pradesh.
Social profiles of the districts of Arunachal Pradesh is provided in table 9 in Appendix.
10.2.2 Weights assigned
Forest cover has been given highest weightage (30%) as forest resources are the basis of livelihood of local communities. Any impacts on the forest cover will have adverse effect on these communities. Forest clearance for cultivation of various cash crops such as cardamom, tea etc., is a concern as it is leading to huge deforestation, drying of perennial river bed and depletion of surface water. These watersheds are critical catchment areas for agricultural /horticultural lands. Any impact on the watershed catchment would have an adverse impact on the livelihood of the communities as 80% of the population is dependent on agriculture. As it will also impact the yield variability, the concerned indicator has been given a weightage of 20%. Female literacy is given a weightage of 15% as it is a major concern for the state. The female literacy rate in the state is 57.7%, which is
much lower than the national average of 65.46%. This indicates low empowerment, low access to information among female members, high level of fertility and greater chances of mortality, malnutrition, and other health issues leading to low adaptive capacity. The values given to the indicators and the normalised scores for the indicators are given in table 10 and the weights assigned based on the relative importance of each indicator is depicted in table 11 in Appendix.
10.2.3 Vulnerability profiles of districts
Results of vulnerability assessments across districts in Arunachal Pradesh are spatially represented in figure 7 below. Figure 8 represents the districts with vulnerability ranking from low to medium to high vulnerability. It can be seen from these figures that Tawang district has been ranked as the most vulnerable district in the state, followed by Tirap, Anjaw and Kurung Kamey. Vulnerability index values and corresponding ranks of districts in the state are presented in table 12 in Appendix.

Climate Vulnerability Assessment for the Indian Himalayan Region Using a Common Framework
45
Figure 7 : Distribution of districts on a vulnerability scale of low, medium and high vulnerability.
Figure 8: Map showing districts ranked based on vulnerability index.

46
10.2.4 Major drivers of vulnerability
Table 13 in Appendix XX provides a detailed explanation of the drivers of vulnerability across districts in Arunachal Pradesh. Some of the major concerns across districts in Arunachal Pradesh are low female literacy rate, higher percentage of area with slope greater than 30o, high percentage of BPL population, low availability of doctors, and less number of workdays under MGNREGA. For instance, districts such as Tawang, Tirap, Anjaw, Kurung Kumey, and Changlang districts, which fall under the high vulnerability profile, have low female literacy (below 50%); high percentage of BPL households at 60% across the 16 districts; more than 60% of the areas in majority of the districts have slope greater than 30o and poor medical facility (less than one doctor per 1,000 population). These socio-economic and biophysical factors are resulting in high sensitivity and low adaptive capacity. It is important to mention here that despite districts such as West Kameng, East Siang, West Siang, and Papum Pare showing low vulnerability, there is scope for improvements in these districts, for this ranking is a comparative analysis which would help in prioritising interventions in each district. High percentage of BPL households, high population density and poor health facility continue to be important concerns in these districts too.
10.2.5 Utilisation of the vulnerability assessment
The vulnerability assessments discussed above would help
in adaptation planning across the districts in Arunachal Pradesh. One of the advantages of this assessment is that it would help in prioritising the drivers that are leading to vulnerability in each district. For instance, policy makers can identify and make necessary interventions across each district based on the findings of this study.
10.2.6 Way forward
Apart from the need to integrate and utilise the vulnerability profiles developed in adaptation planning and adaptation funding project preparations, the next step of this research would be to focus on improving the State Action Plan on Climate Change (SAPCC) as per Intended Nationally Determined Contributions (INDCs). The findings of this study would be crucial for documentation of the SAPCC. Further, the next step would be to share and present the findings of the vulnerability assessments with the Chief Secretary, legislatures and line departments in the state. Attempts would be made to narrow down the scale of vulnerability analysis to block level.
10.3 Assam 10.3.1 About the state
Assam is a state in the eastern Himalayas along the Brahmaputra and Barak River valleys. The state lies within the geographical coordinates between 24°.07’ N to 28°00’ N latitude and 89°.42’ E to 96°.02’ E longitude.
Figure 9: Spatial representation of districts in Assam.

Climate Vulnerability Assessment for the Indian Himalayan Region Using a Common Framework
47
The total geographical area of Assam is 78,438 sq. kms. and is broadly divided into three physiographic domains viz. Brahmaputra Valley, Central Assam Hills and Barak Valley. Assam is divided into 27 administrative districts (see figure 9) out of which 19 are tribal districts and three are hill districts. While the forest cover comprises of 23.62%, 35.95% land is utilised by agriculture. Figure 1 in Appendix represents land use map of Assam.
According to Champion and Seth (1968) classification of forests, Assam has 18 forest types belonging to five forest type groups viz. Tropical Wet Evergreen, Tropical Semi-evergreen, Tropical Moist Deciduous, Tropical Dry Deciduous, and Sub-tropical Pine Forest. Due to favourable climate, topographic and edaphic factors the state is endowed with diverse species of endemic plant communities and fauna. According to 2011 Census of India report, Assam has a population of 31.21 million. The average population density of the state is 398 persons per sq. km. Assam has a sex ratio of 958 females to 1,000 males, literacy rate at 72.19 and urbanisation rate at 14.08. The per capita income of Assam at 2011-2012, according to the Economic Survey 2016-2017 by Government of Assam, was INR 56,747, which increased to INR 73,677 in the year 2016-2017. The economy of Assam is predominantly agrarian. About 61% of the total population is engaged in agricultural activities (Economic Survey, 2014-15) and agriculture supports more than 75% of the state. Assam has a sub-tropical climate. The climate is oppressive humid, tropical type in the plains and pleasant sub-alpine type in hills.
10.3.2 Weights assigned
A discussion was held among representatives from different line departments such as Agriculture, Forest, Soil
& Water Conservation and Disaster Management among others. Indicators were prioritised based on knowledge and perceptions shared by the representatives and weights were assigned. Poverty is a serious concern in the state and the percentage of population living BPL is much greater than the national average. As majority of districts in Assam have very low per capita income, highest priority was given to this indicator and assigned a weightage of 25%. A significant proportion of the population of Assam (more than 60%) relies on climate sensitive agriculture as a primary source of income. Any change or variability in climate may severely impact yield productions and increase yield variability, ultimately impacting those relying on agriculture. Hence yield variability has been assigned a weightage of 20%. Forest cover has been assigned a weightage of 12% as forest ecosystems provide various important ecosystem services such as provisional, regulatory, supporting and spiritual services, and are under serious threat due to encroachment and degradation. The values given to the indicators and the normalised scores for the indicators are given in table 14 and the weights assigned based on the relative importance of each indicator are depicted in table 15 in Appendix.
10.3.3 Vulnerability profiles of districts
Results of vulnerability assessments across districts in Assam are spatially represented in figure 10 below. Figure 11 represents the districts with vulnerability ranking from low to medium to high vulnerability. It can be seen from these figures that districts Dhubri, Lakhimpur, Sonitpur, Goalpara, Barpeta, Darrang, Morigaon, Udalguri and Nagaon, all lie under high vulnerability category. Vulnerability index values and corresponding ranks of districts in the state are presented in table 16 in Appendix.

48
Figure 10: Distribution of districts on vulnerability scale of low, medium and high vulnerability.
Figure 11: Map showing districts ranked based on vulnerability assessment.

Climate Vulnerability Assessment for the Indian Himalayan Region Using a Common Framework
49
10.3.4 Major drivers of vulnerability
The major drivers of vulnerability identified for the state of Assam are, deforestation, low per capita income, lack of alternative income such as low average days of employment under MGNREGA and low female literacy rate. Poverty is a serious concern in the state of Assam. High dependence on agriculture and lack of alternative source of livelihood increases vulnerability of the state. Further, loss of forest cover and low female literacy rate reduces adaptive capacity of the state.
10.3.5 Utilisation of the vulnerability assessmentVulnerability assessment will help in identification of drivers of vulnerability, which will help in the recognition of key issues for which adaptation strategies need to be prioritised and developed. Vulnerability ranking will also help in prioritisation of districts/blocks/community in need for investment in adaptation practices. Having an understanding of the adaptive capacity of the indicators will also help in the identification of maladaptation practices in place.
10.3.6 Way forward
The findings of the state vulnerability assessment should be shared with the Chief Secretary, legislatures and line departments of the state. Furthermore, following the district level vulnerability assessment, the next step would be to carry out such studies at the block level. Also, conducting sector-specific vulnerability assessment for sectors such as agriculture, forest, water etc., will help in understanding vulnerability of such systems and the actions needed to provide necessary resilience to the sector. There is also a need to integrate and utilise the vulnerability profiles developed in adaptation planning and adaptation funding project preparations.
10.4 Himachal Pradesh
10.4.1 About the state
Himachal Pradesh is an entirely mountainous state covering an area of 55,673 sq. kms with altitude ranging
from 350 metres to 6,975 metres above the mean sea level. The state lies between latitude 30°22’40’’ N to 33°12’40’’ N and longitude 75°45’55’’ E to 79°04’20’’ E. The state is divided in five physiographic zones (i)Wet Sub-temperate Zone (ii) Humid Sub-temperate Zone (iii) Dry Temperate-alpine Highlands (iv) Humid Sub-tropical Zone, and (v) Sub-humid Sub-tropical Zone. The state has 12 districts (see Figure 12) .
Table 17 depicts land use pattern in sq. km and Table 18 provides district-wise net area irrigated by sources (sq. km.) in Appendix.
Himachal Pradesh is bestowed with distinctive floral and faunal biodiversity having aesthetic, cultural, commercial and genetic values. Around 95% of the floral and faunal species available in the state are endemic and 5% of the other species existing are of exotic nature.
Based on the historical IMD Gridded data on daily temperature (maximum and minimum) and rainfall from 1951-2013 for the state of Himachal Pradesh, it has been observed that mean annual maximum temperature for Himachal Pradesh is 25.9° C. (range 24.5°C to 27.1°C). It has been observed that average annual rainfall of Himachal Pradesh is 1284.2 mm (range 704.7 - 2062.8 mm). Table 19 in Appendix depicts normal monsoon rainfall and percentage departure of rainfall in 2016 from the normal for the districts in Himachal Pradesh.
As per Census 2011, the population of the state is 6.86 million with population density of 123 per sq. km. Out of the total population, 25.19% belong to Schedule Caste communities and 5.71% belong to Schedule Tribe communities. Both the communities have high dependency on natural resources and are highly vulnerable to climate change. The overall literacy rate has increased from 76.48% in 2001 to 82.8% in 2011. Sex ratio of the state has increased from 968 per 1,000 males in 2001 to 972 per 1,000 males in 2011. Social profiles of the districts of Himachal Pradesh is provided in Table 20 in Appendix.

50
Figure 12: District map of Himachal Pradesh.
10.4.2 Weights assigned
Weights have been assigned in consultation with the sector-specific stakeholder departments viz. Forests, Agriculture, Horticulture, Energy, Tourism, Rural Development, Judiciary, Non Government Organisations, Panchayati Raj Institutions, among others. Highest weights are assigned to % area under irrigation (19%), % area under slope>30 degree (16%), population density (14%) and yield variability of food grains (13%). The analysis of annual rainfall in Himachal Pradesh reveals a statistically significant negative trend indicating decline of both total amount of rainfall received and the number of rainy days. This implies that irrigation will emerge as one of the most important adaptive capacities under climate change. Himachal Pradesh is an entirely mountainous state with steep slope in many parts of the state. States with steeper slopes are highly susceptible and prone to landslides adding to the climate change vulnerability given the topographical feature. During 2001-2011, the population density in the state has increased from 109 to 123 person/km2. In a hilly state, increase in population pressure significantly adds to the vulnerability profile as this requires development of more infrastructure within a geographically fragile ecosystem. While agriculture provides 43% of Net State Domestic Product in Himachal Pradesh, 93% of the population depends on
agriculture on their livelihood. Therefore, increased variability in the production of food grains will not only impose a threat to availability of the same, but at the same time will make a larger portion of population vulnerable. List of indicators for Tier 1 vulnerability assessment relevant to districts, rationale for selection, functional relationship with vulnerability and sources of data are provided in table 21 in Appendix.
The values given to the indicators and the normalised scores for the indicators are given in table 22 and the weights assigned based on the relative importance of each indicator is depicted in table 23 in Appendix.
10.4.3 Vulnerability profile and ranking of districts
Results of vulnerability assessments across districts in Himachal Pradesh are spatially represented in Figure 13 below. Figure 14 represents the districts with vulnerability ranking from low to medium to high vulnerability. It can be seen from the figures that Chamba district is ranked as the most vulnerable district followed by Bilaspur. Vulnerability index values and corresponding ranks of districts in the state are presented in table 24 in Appendix.

Climate Vulnerability Assessment for the Indian Himalayan Region Using a Common Framework
51
Figure 13: Distribution of districts on a vulnerability scale of low, medium and high vulnerability.
Figure 14: Map showing districts ranked based on vulnerability assessment

52
10.4.4 Major drivers of vulnerability
The major drivers of vulnerability vary across districts. The drivers in the highly vulnerable districts like Chamba and Bilaspur are both socio-economic and biophysical, such as steep slopes, low forest cover, high crop yield variability, low female literacy rate, high population density, low proportion of agricultural labour and high IMR. In the districts with medium vulnerability (Kinnaur, Mandi and Solan) the drivers are steep slopes and high crop variability. High per capita income, comparatively less slope and less crop yield variability has resulted in low vulnerability of districts like Lahaul & Spiti, Kangra, Kullu, Hamirpur, Una, Shimla and Sirmaur.
10.4.5 Utilisation of the vulnerability assessment
Vulnerability Assessment will be helpful in framing developmental activities and policies for the state. Districts having comparatively high vulnerability score and showing worsening of the situation as compared to the baseline period should be in the radar of policy makers to do more to improve the ability of those districts to reduce risk due to hazards, sensitivity and make all efforts for enhancing the adaptive capacity. While very little can be done in the short run to address exposure-related risk, long term measures should be planned for those areas. Similarly, in the medium-term, issues related to sensitivity can be addressed. Finally, immediate steps can be taken to improve the adaptive capacity. The adaptation and
mitigation strategy can unfold accordingly.
10.4.6 Way forward
There is a need to integrate and utilise the vulnerability profiles developed in adaptation planning and adaptation funding project preparations. The methodology can be used for the revision of SAPCC as well as revision and streamlining of local Climate Change Adaptation Plan. Uniform data sets can help in developing a framework that could fit in the ongoing endeavour. The modeled climate projections (considering RCP 4.5 and 8.5 scenario) along with the findings from this workshop will give a better analysis of the vulnerable sectors. The IPCC AR5 framework can also be adopted for assessing block, panchayat and village level vulnerability. Furthermore, it is also crucial to find ways through which this methodology can converge and compliment with the NDCs.
10.5 Jammu & Kashmir
10.5.1 About the state
The state of Jammu & Kashmir is located in the north-western extremity of India, occupying central position in the Asian continent. The state has 22 districts (see Figure 15). Geographical expanse of the state covers an area of 2,22,236 km², lies between 32º 15´ to 37º 45´ N latitude and 72º 30´ to 81º 15´ E longitude.
Figure 15 : District map of Jammu and Kashmir.

Climate Vulnerability Assessment for the Indian Himalayan Region Using a Common Framework
53
The State has a unique topography with precipitous hills, plateau lands, plains and valleys. Table 25 represents land use pattern in sq. kms and Table 26 represents district-wise net area irrigated by sources in sq. kms in Appendix.
Within the Indian region, Jammu & Kashmir is, phytogeographical - one amongst the most diverse. The flora has evolved through various stages during the geo-morphological evolution of this region. The population of the state is 12.54 million as per Census 2011. The state has three distinct regions, viz. the Kashmir, Jammu and Ladakh comprising of 22 districts. Each region has a specific resource base. The state is further divided among 82 tehsils, 86 towns and 6671 total villages as per Census 2011. Administratively, the districts are divided into blocks for development purposes. There are 318 community development blocks as on March 31, 2015 in the state. The demographic features of the state as per Census 2011 reveal 124 persons per sq. km of area. The low population densities in many districts of the state are attributable to the nature of the terrain. Further, sex ratio of 889 females per 1,000 males places Jammu & Kashmir at 29th rank in the country. Social profiles of the districts in Jammu & Kashmir are presented in Table 27 of Appendix.
The percentage of gross irrigated area to gross cropped area in the state is 44.75% for the year 2015-16. Livestock is an integral part of the agrarian economy. Broadly, the state comprises three distinct climatic regions: Cold Arid Desert areas of Ladakh, Temperate Kashmir Valley, and the Humid Sub-tropical Region of Jammu. Table 28 in Appendix represents normal monsoon rainfall and percentage departure of rainfall in 2016 from the normal for the districts in Jammu and Kashmir.
10.5.2 Weights assigned
Different indicators have different levels of impact on vulnerability especially with respect to different systems. Keeping in view the weights were assigned to three regions viz. Jammu, Kashmir and Ladakh separately, then averaged. Weight allocation mainly involved consultation with secondary stakeholders – district administrators,
researchers, NGOs with significant inputs coming from the experts from different departments of Jammu & Kashmir during the workshop on September 29, 2018. Previous experience of the department with primary stakeholders – village communities, farmers, mountain communities were also used to provide weights to indicators. Weights were assigned to the indicators on a scale of 0 to 100, such that the total of all the weights equal to 100. Forest is given the highest weights (24%) as it serves as an important buffer for watershed management, hence agriculture sustainability, soil and slope stability and livelihood in case of Jammu & Kashmir. Although one can see extremely rich vegetation in the beds and banks of the streams and canals, the forest cover of the Kashmir valley is reduced due to extensive cultivation of grain crops like paddy and maize. Also, per capita income in Jammu & Kashmir and its growth rate, both remained lower than the national average. Some of the areas such as Kargil and Leh have very low per capita income in the state and that is assumed to be one major driver of vulnerability. Since more than 30% of the state falls under the vulnerable category of mountains, with young mountains that are prone to landslides and the probability of the same increases with an increase in steeper areas, % area under slope>30 degree has given a weight of 15%. The values given to the indicators and the normalised scores for the indicators are given in table 29 and the weights assigned based on the relative importance of each indicator is depicted in table 30 in the Appendix.
10.5.3 Vulnerability profile and ranking of districts
Results of vulnerability assessments across districts in Jammu & Kashmir are spatially represented in Figure 16 below. Figure 17 represents the districts with vulnerability ranking from low to medium to high vulnerability. It can be seen from the figures that Kargil district ranks as the most vulnerable district. It is followed by Leh, Bandipura, Ganderbal, Kulgam, Kupwara, Kishtwar, Ramban, Budgam, Baramulla, Doda and Anantnag which rank high among the vulnerable districts. Vulnerability index values and corresponding ranks of districts in the state are presented in Table 31 of Appendix.

54
Figure 16: Distribution of districts on a vulnerability scale of Low, Medium and High Vulnerability.
Figure 17: Map showing districts ranked based on vulnerability assessment.

Climate Vulnerability Assessment for the Indian Himalayan Region Using a Common Framework
55
10.5.4 Drivers of vulnerability
This section looks at the major drivers of vulnerability in all the 22 districts of Jammu & Kashmir state which are presented in Table 32 of Appendix. Thus, districts having low area under forests per 1000 households and high area under open forests barring Kargil and Leh, low per capita income, greater slope and low yield variability will receive a high vulnerability score. Kargil and Leh have the lowest per capita income, greater slope among the other IHR states, and thus score the highest vulnerability score.
10.5.5 Utilisation of the vulnerability assessment
Being a part of the IHR, J&K is one of the most vulnerable areas and hence requires special attention in terms of planning, especially with respect to the changing climate. It is therefore crucial to focus on climate change adaptation practices and also to synchronise them with the ongoing flagship programmes like MGNREGA, Compensatory Afforestation Fund Management and Planning (CAMPA), Integrated Watershed Management Programme (IWMP) etc. The results of vulnerability assessment can assist in the revision of SAPCC. These results can also help in attaining the focus of central funding agencies, legislatures, bureaucrats, local administration and also generating public awareness.
10.5.6 Way forward
While a district-level assessment has been carried out,
there is a need for similar assessment in future for different eco-regions and sectors like Agriculture, Water, Forest, etc. of the state, and also preferably for blocks. Variable Reduction technique (PCA/Factor Analysis/Cluster Analysis) could be incorporated to this common framework in future to augment the analysis. This requires going for Tier – 2 and 3 approaches with more rigorous and ground-level data. The next step to vulnerability assessment is the risk analysis where exposure and hazard will also be considered. More importantly, there exists a need for integration and utilisation of the vulnerability profiles developed in adaptation planning and adaptation funding project preparation.
10.6 Manipur
10.6.1 About the state
Manipur covers an area of 22,327 sq. kms. and lies between 23°83’N, 93°03’E latitude and 25°68’N,94°45’E longitude. According to the FSI report, 2017, the state has 17,346 sq. km. of which 908 sq. km is under very dense forest, 6510 sq. km under moderately dense forest and 9928 sq. km under open forest. The average altitude of the valley is 760m above sea level while the maximum altitude reaches up to 3000m in the upper ranges. The state is blessed with diverse biological species being positioned in the Indo Malayan biological hotspot.
Figure 18: District map of Manipur.

56
Table 33 in Appendix provides the land use pattern at district level in Manipur.
Owing to its geographical and climatic diversity, the state of Manipur is endowed with a wide range of plants and trees. The huge variety of flora of Manipur also serves as the home to a number of fauna species.
Socio-economic condition of a region is an important determinant of measuring the real quality of life and welfare of the region. Socio-economic status (SES) often have profound effects on environment and climate change and its impacts due to the differences in ability to access everyday life choices that are associated with income, education, work participation and the social structure. Manipur is characterised with low socio-economic status which is a risk factor for climate change. As per Census 2011, the population of the state was 2.86 million with a density of 130 persons/sq. km. Average sex ratio is 976 females per 1,000 males with the range varying from 933 in Chandel to 1031 in Imphal West. On an average 8.4% households are BPL. Average IMR is 44 per 1,000 live births as per Economic Survey, 2017-18, Manipur. Table 34 in Appendix provides the social profiles of the districts in Manipur.
The climate of Manipur is classified as tropical. Its climate is largely influenced by the topography of this hilly region. January is the coldest month and July is the warmest month in the state. Snow sometimes falls in hilly regions due to the Western Disturbance. The average annual temperature in Manipur is 26.9 °C. The rainfall here averages 1517 mm. Table 35 in Appendix provides the data on normal Monsoon rainfall and percentage departure of rainfall in 2017 from the normal for the nine districts in Manipur.
10.6.2 Weights assigned
The weights are assigned as per the existing situation in
the state and considering the likely outcome according to the present condition of climate variability. Highest weight has been assigned to yield variability (28%), as agriculture is the main source of livelihood and variation in yield not only threatens the livelihood security but also food security. The second important indicator is the % of area under forest (20%). Forest is an important resource but is under threat due to unplanned urbanisation within forest settlement. Poverty is directly linked with vulnerability and hence higher the BPL households, higher will be the vulnerability and this has been chosen as the third important indicator of vulnerability (18%). The fourth important indicator is female literacy (10%), although Manipur has a high female literacy rate, giving high weight implies that it is a significant indicator and is important particularly for adaptation. While all the other indicators – infant mortality, population density, slope and MGNREGA are significant too but are relatively less important compared to the ones where higher weights are assigned.
The values given to the indicators and the normalised scores for the indicators are given in table 36 and the weights assigned based on the relative importance of each indicator are depicted in table 37 of Appendix.
10.6.3 Vulnerability profile and ranking of districts
Results of vulnerability assessments across districts in Manipur are spatially represented in Figure 19 below. Figure 20 represents the districts with vulnerability ranking from low to medium to high vulnerability. It can be understood from these figures that Thoubal ranks as the most vulnerable district followed by Chandel and Bishnupur districts, which rank in the high vulnerable category. Vulnerability index and corresponding ranks of districts in the state are presented in table 38 in of Appendix.

Climate Vulnerability Assessment for the Indian Himalayan Region Using a Common Framework
57
Figure 19: Distribution of districts on a vulnerability scale of Low, Medium and High Vulnerability.
Figure 20: Map showing districts ranked based on vulnerability assessment.

58
10.6.4 Major drivers of vulnerability
Among the selected indicators, the most important drivers that affect the vulnerability are yield variability of the region followed by number of BPL households. Since 77% of the land in under forest, it also played an important role in the livelihood aspect of the people. On the other hand, people engaged in MGNREGA are less for the state, so it has minimum effect on the livelihood of the people of the state.
10.6.5 Utilisation of the vulnerability assessment
The vulnerability assessment can serve as a web-based dynamic report, accessible by the general public, which can be updated any time with new data. The assessment also helped to identify the data gaps, the deficient data that can be compiled as per priority (for e.g. variability of yield, irrigation, production, climate events, etc.), to conduct interactive/consultative workshops with different stakeholders, to determine the weightage of the related indicators at the grassroot levels etc. The assessment would be utilised as a support document for framing the strategic actions under SAPCC Version 2. The assessment would be a vital input for prioritisation of State Climate Action by aligning the state plan activities towards effective climate action based on the drivers of vulnerability obtained from the exercise.
10.6.6 Way forward
The integration of climate vulnerability and risks into the current development policies of the state could be addressed based on the Tier 2 and 3 approach of vulnerability assessment. Further, the critical sectors such as water and agriculture which have significant bearing on people and their livelihoods due to the climate variability could be assessed. The main drivers of
vulnerability could be determined and adaptation policies could be formulated to sustain the ecosystems as well as livelihoods of the people in the wake of climate change. Furthermore, there is a need to integrate and utilise the vulnerability profiles developed in adaptation planning and adaptation funding project preparations.
10.7 Meghalaya
10.7.1 About the state
Meghalaya, with a geographical area of 22,429 sq. km. is situated in the North Eastern region of India, and lies between 24 0 58’ N to 26 0 07’ N latitude and 89 0 48’ E to 92 0
51’ E longitude. The terrain is predominantly covered with hills, varying in altitude ranging from 50 metres to 1966 meters. The state’s diverse topography has led to varying land use patterns with only 9.8% of the total geographical area available for cropping, which includes the area under traditional shifting or ‘jhum’(which is generally characterised with a much lower productivity compared to area under modern cultivation). Table 39 in Appendix depicts the land use pattern in ‘000 ha in Meghalaya.
About 81% of the total population of the state depends on agriculture for their livelihood. Though agriculture in the state is mostly rain-fed, irrigation facilities are being provided to a certain extent. The ultimate irrigation potential of the state is approximately 0.22 million hectares. Table 40 in Appendix provides the district-wise net area irrigated in the state.
The state possesses a notable forest cover, constituting 76.45% of state’s geographical area. Sacred groves in Meghalaya hold special significance as they are not only rich depositories of biodiversity but also important from the perspective of traditional knowledge, beliefs and faith of the communities.

Climate Vulnerability Assessment for the Indian Himalayan Region Using a Common Framework
59
Figure 21: Spatial representation of districts in Meghalaya.
The climatic conditions may vary from moist sub-humid to humid subtropical. The average annual rainfall in Meghalaya is between 2,000 to 5,000 mm. The southern slope receives high amount of rainfall compared to the central and northern part.
Figure 2 in Appendix provides the average precipitation and its trend for 1981-2012.
According to the Census 2011, Meghalaya has a total population of approximately 2.97 million. The population of Meghalaya is predominantly tribal. Meghalaya’s literacy rate is at 75.48 per cent (Census 2011) and the sex ratio of 986 females per 1,000 males is much higher than the national average. Table 41in Appendix provides the social profiles of the districts in the state.
10.7.2 Weights assigned
The weights are assigned to each of the eight indicators according to their importance in determining vulnerability. Yield variability of major food grains (rice, wheat and maize) is assigned the highest weight (30%) as it is felt to be an important indicator representing agricultural sector, which is the single major contributor to the state’s GDP (22%) and also on which majority of the state’s population depends, besides being directly a climate-sensitive sector. Second highest weight is assigned to percentage of area with slope greater than 30 degrees (20%). The topography of the state contributes to the sensitivity of the area to climate change impacts. Indicator with third highest weight is the percentage of area under forest (18%). Although the state currently
has a good percentage of area under forest, the inherent concerns continue to exist in the form of shifting agriculture, logging, mining and other human activities, which have been responsible for fragmentation, destruction and degradation of the forests in the state. The indicator of households living BPL is assigned the fourth highest weight (17%).
Meghalaya has around 12% of its population and over 0.2 million household living BPL. The lowest weight is attributed to female literacy rate and population density, as the female literacy rate is at 72.89%, which is above the national average (65.46%) and population density is only 132 persons per sq. km., which is less than one-third of the national average.
The values given to the indicators and the normalised scores for the indicators are given in table 42 and the weights assigned based on the relative importance of each indicator is depicted in table 43 of Appendix.
10.7.3 Vulnerability profile of the districts
Results of vulnerability assessments across districts in Meghalaya are spatially represented in Figure 22 below. Figure 23 represents the districts with vulnerability ranking from low to medium to high vulnerability. It can be seen from the figure that West Khasi Hills is ranked as the most vulnerable district in the state, followed by West Garo Hills, East Khasi Hills, Jaintia Hills and East Garo, Hills Ri-Bhoi and South Garo Hill respectively. Vulnerability index values and corresponding ranks of districts in the state are presented in table 44 of Appendix.

60
Figure 22: Distribution of districts on a vulnerability scale of Low, Medium and High Vulnerability.
Figure 23: Map showing districts ranked based on vulnerability assessment

Climate Vulnerability Assessment for the Indian Himalayan Region Using a Common Framework
61
10.7.4 Major drivers of vulnerability
For the state of Meghalaya, the three major drivers of vulnerability identified are: yield variability, households living under BPL and lack of area under forests. Yield variability is important as 80% of the livelihood depends entirely on agriculture and related activities, and variation in yield adds to people’s vulnerability, significantly reducing their ability to adapt to climate change impacts. Secondly, as poor people are more vulnerable to the impacts of climate change, and with approximately 49% of the communities in the state living in poverty, these marginalised individuals will be impacted more. In Meghalaya marginalised section of the society are heavily dependent on natural resources, thus making them vulnerable to any change. Thirdly, while the state has a good forest area of over 76% ranging between 63% - 89% across districts, the status of forests is in a dire condition due to forest disturbances, forest fragmentation, patchiness, biodiversity loss and precarious mountain slopes, and these drivers will only be enhanced under the impacts of climate change. The other drivers of some significance include steepness of slope and lack of MGNREGA coverage. In case of former, only the southern slopes have higher gradient of slope while the rest of the state has lower gradient slopes and plains and as for latter, as it is not uniformly implemented in the state, it cannot be taken as a significant driver.
10.7.5 Utilisation of the vulnerability assessment
Understanding the inherent vulnerability of the state to current climate variability through vulnerability assessment will help in identifying and prioritising adaptation actions, and in creating awareness among different stakeholders. The state can utilise the study in mainstreaming adaptation strategies in ongoing developmental programmes. The assessment will also help in highlighting and alleviating the drivers of vulnerability. Further, the state can provide short-term relief to those who are inherently most vulnerable and help build long-term resilience to current climate variability and future climate change, instead of adopting generic adaptation strategies, which would undoubtedly
require more investment both in terms of finances and human resources.
10.7.6 Way forward
There is a need to integrate and utilise the vulnerability profiles developed in adaptation planning and adaptation funding project preparations. Identification of climate change vulnerability drivers and district-level vulnerability assessment paves the way to scale down at block-level and sector-specific vulnerability assessment. The district-level climate vulnerability index will help to prioritise the district/area for priority interventions and will also encourage policy makers to incorporate climate concerns in the district level development planning. Sector-wise vulnerability assessment will help to understand the sector-specific vulnerability and the actions needed to provide necessary resilience to the sector/system. Also, the state-specific scientific studies on various sectors such as forests and water may also be used as significant inputs in the vulnerability assessment at block level.
10.8 Mizoram
10.8.1 About the state
Mizoram is the southernmost state in the North Eastern region with a total geographical area of 21,087 sq. kms, which is divided into eight administrative districts (Figure 24) and falls within the geographical coordinates 21o 58’ and 24o 35’ N latitude and 92o 15’ and 93o 29’ E longitude. The topography is hilly with rugged terrain, steep slopes and deep valleys. The altitude ranges from 50 m to slightly above 2000 m above sea level. The Indian State of Forest Report 2017 states that of the total geographical area of the state, forest covers 86.27%. More than 70% of the population in Mizoram depends on agriculture and allied professions, among which majority are still practicing the traditional shifting cultivation.
The forests of Mizoram according to Champion and Seth (1968) can be classified as Tropical Wet Evergreen, Tropical Semi-evergreen and Sub-tropical Hill Forests. The state is also endowed with dense forests and diverse species of the flora and fauna.

62
Figure 24: Spatial Representation of the State of Mizoram.
Mizoram enjoys moderate climate wherein, in the lower altitude at foothills and the valleys, typical tropical climate is obtained while in the mid region with large expanse, subtropical moist climate is experienced. Table 45 in Appendix provides the data on Normal Monsoon rainfall and percentage departure of rainfall in 2017 from the normal for the districts in Mizoram. Figure 3 in Appendix provides the bar graph representing rainfall variability in Mizoram from 1986 to 2017.
According to 2011 Census of India report, the total population of Mizoram is 10,91,014 with a population density of 52 persons per sq kms. Majority of the people in the state belong to a population of scheduled tribe consisting of 94.4% of the total population. The age-old practice of jhum cultivation is carried out annually by a large number of people living in the rural areas. It is estimated that only 5% of the total area is under cultivation and about 11.47% of the total cultivated
area is under irrigation. Total area of land having slope of 0 to 15 degrees where there is a possibility of wet rice cultivation (WRC) is 74,644 ha. which is merely 2.8% of Mizoram, and total area of land having slope of 10 to 30 degrees is only 5,09,365 ha. (RKVY State Extension Work Plan, 2016 - 2017). Table 46 in Appendix shows the land use pattern in ‘000 ha and table 47 in Appendix shows district-wise net area irrigated by sources in ‘000 ha.
10.8.2 Weights assigned
Steep slope (30% or above) and forest cover are the most vital indicators for the assessment of inherent vulnerability for the state of Mizoram with regard to climate change. By looking at data, more than 70% of the total geographical area was covered by steep slope and it is believed that all the economic and infrastructure development, each and every sector

Climate Vulnerability Assessment for the Indian Himalayan Region Using a Common Framework
63
including disasters, livelihood, society, culture and lifestyle are all influenced by it. Therefore, highest weight is assigned to the slope indicator (25%). Forest cover (25%) also plays a huge role in the survival of major portion of the population in Mizoram. Forests provide livelihood and alternate source of income for populations who are dependent on natural resources. MGNREGA (15%) is also an important component of livelihood sustenance in rural areas as a large number of rural households depend on the employment generated under this scheme. Yield variability (10%) and infant mortality (10%) come next to MGNREGA. It is estimated that more than 50% of state’s food grain consumption is imported from neighboring states and countries. Though yield of food grains is still important to certain extent, it has been considered not as important as MGNREGA. IMR is equally considered to be as important as yield variability, which by the opinion of health sector personnel, is by far the best indicator among the readily available data of the health status of a wider population. Therefore, both yield variability and IMR is assigned 10 out of 100. The remaining three indicators out of eight are the population density, female literacy rate and percentage of BPL families. Population density of Mizoram is 51.07 per sq. km. which is quite sparse compared to the national-level
data. Secondly, female literacy rate is quite satisfactory and females are informed well enough through smart phones and social media. Thirdly, the enrolment of BPL families does not reflect the poverty at ground reality, so the authenticity of data is in question. Therefore, due to the above said reasons, these three indicators are much less relevant than the preceding five indicators with regard to the state-specific situation; therefore, they are assigned five each out of 100. The values given to the indicators and the normalised scores for the indicators are given in table 48 and the weights assigned based on the relative importance of each indicator are depicted in table 49 of Appendix.
10.8.3 Vulnerability profile of the districts
Results of vulnerability assessments across districts of Mizoram are spatially represented in Figure 25 below. Figure 26 represents the districts with vulnerability ranking from low to medium to high vulnerability. It can be seen from the figures that Siah district is ranked as the most vulnerable district. It is followed by Aizawl and Serchhip, which lie under high vulnerable category. Vulnerability index values and corresponding ranks of districts in the state are presented in table 50 of Appendix.

64
Figure 25: Distribution of districts on a vulnerability scale of Very Low, Low, Medium, High and Very High Vulnerability.

Climate Vulnerability Assessment for the Indian Himalayan Region Using a Common Framework
65
Figure 26: Map showing districts ranked based on vulnerability assessment

66
10.8.4 Major drivers of vulnerability
Lack of forest cover appears to be the major driver of vulnerability in the districts of Mizoram, followed by steep slope coverage, and lack of person days under MGNREGA. Siaha district ranked first with highest vulnerability, has third largest steep slope coverage among all districts, is fourth in lack of forest cover and third in lack of person days generated under MGNREGA. Aizawl district (Rank 2) comparatively has highest steep slope coverage but it has better forest cover and better person days generated under MGNREGA district, therefore making its vulnerability index value comparatively lesser than Siaha district. Subsequently, Serchhip district (Rank 3) has lesser steep slopes than Siaha and Aizawl districts, and it also has one of the best person days generated under MGNREGA among all districts, but has the least forest cover among all the districts. Champhai district (Rank 4) has higher steep slope coverage but has better forest cover and better person days generated under MGNREGA.
10.8.5 Utilisation of the vulnerability assessment
Vulnerability ranking will help in prioritising adaptation investment along with identifying and alleviating the drivers of vulnerability. It will also help to highlight the ills of any maladaptation practices. Vulnerability information is useful for advocacy purpose, as it strengthens the case or demand for vulnerability reduction and resilience building measures at present and in anticipation of a challenging future.
10.8.6 Way forward
Following the district level vulnerability assessment, the next step would be to first conduct socio-economic vulnerability assessment for districts at the village or block level, and second, to carry out sector-wise inherent vulnerability assessments using a bottom-up approach with respect to agriculture and allied sectors, water resources, health, etc. Furthermore, the vulnerability profiles developed need to be integrated and utilised in adaptation planning and adaptation funding project preparations.
10.8 Nagaland
10.8.1 About the state
Nagaland, one of the eight North Eastern states of India, covers a total geographical area of 16,579 sq. km. and is located between 25°10’ N and 27°4’N latitude and 93°15’E and 95°20’E longitude. Nagaland has 11 districts, viz, Kohima, Dimapur, Kiphire, Longleng, Mokokchung, Mon, Peren, Phek, Tuensang, Wokha and Zunheboto (Figure
27). The state is almost entirely hilly with the altitude rising from the areas close to the Brahmaputra Valley to a highest elevation of 3,840 metres (Mount Saramati).
Figure 27: Spatial distribution of districts of Nagaland.
The population of Nagaland is 1.98 million (Census 2011). The population density of Nagaland is 119 per sq. km. Nagaland is inhabited by multi-ethnic groups. Officially, 16 tribes are recognised by the Government of Nagaland, which provides the state with its distinct social characters – cultures, traditions and dialects. Cumulatively, the people of Nagaland are collectively known as the Nagas. Social profile of the districts of Nagaland are presented in Table 51 of Appendix.
Nagaland, an agricultural economy has over 70% of its population dependent on agriculture. According to the latest ISFR 2017 report, Nagaland has experienced a loss of 450 sq. km. of forest cover, which can be attributed to jhum cultivation and developmental activities. Hence, the state faces a higher risk of the negative effect of climate change. Figure 4 in Appendix depicts land use and land cover and table 52 in Appendix represents land use pattern in Nagaland.
In spite of the tremendous impact of modernity and the changing conditions of the world, the Nagas have been

Climate Vulnerability Assessment for the Indian Himalayan Region Using a Common Framework
67
resilient and coping with these changes mainly through indigenous traditional knowledge. A shift in focus towards sustainability and proper management of the natural resources, adaptation strategies and improvement of the traditional knowledge systems holds the key to making it an exemplary climate resilient region.
10.8.2 Weights assigned
Weights were assigned to the indicators based on the discussions taking into account the current scenario of the state of Nagaland. Representatives from the Department of Agriculture, Government of Nagaland and the Nagaland State Climate Change Centre participated in the discussion to identify the major indicators of vulnerability of the state and assigned weights accordingly. Forest was given the highest weightage of 35 out of 100 as the state has a high forest cover of 75.33% of the total geographical area and the indigenous communities inhabiting the region are dependent on it for their bare-minimum survival needs. Nagaland is primarily an agrarian state with more than 70% of the population dependent on agriculture. Yield variability, therefore, plays a vital role in determining the vulnerability of the region. Basing on the above-mentioned facts, yield variability was assigned a high weightage (22%). Nagaland is almost entirely a hilly region except for the areas bordering Assam such as the district
of Dimapur. It is built upon a difficult terrain of undulating mountains, valleys and hills with 52.69% of the area having slope greater than 30%. Debating over if the areas under high slope are accessible for cultivation and after much deliberation, slope was assigned 15% weight. During the discussion, the need to include an economic indicator of the state was highlighted. Per capita income was thought to be the most suitable indicator and more relevant to the state’s context. However, due to non-availability of data at the district level, percentage of households BPL was used as a substitute with a weightage of 10%. The values given to the indicators and the normalised scores for the indicators are given in table 53 and the weights assigned based on the relative importance of each indicator is depicted in table 54 of Appendix.
10.8.3 Vulnerability profile and ranking of districts
Results of vulnerability assessments across districts of Nagaland are spatially represented in Figure 28 below. Figure 29 represents the districts with vulnerability ranking from low to medium to high vulnerability. It can be seen from the figures that Mon, Dimapur, Longleng, Zunheboto and Kiphire are some of the districts, which lie under high vulnerable category. Vulnerability index values and corresponding ranks of districts in the state are presented in table 55 of Appendix.

68
Figure 28: Distribution of districts on a vulnerability scale of Very Low, Low, Medium, High and Very High Vulnerability.

Climate Vulnerability Assessment for the Indian Himalayan Region Using a Common Framework
69
Figure 29: Map showing districts ranked based on vulnerability assessment

70
10.8.4 Major drivers of vulnerability
Three major drivers were identified for the state of Nagaland: loss of forest cover, high yield variability and steepness of slope. With a total geographical area of 16,579 sq. km, the state of Nagaland has total forest cover of 12,489 sq. km, which is 75.33% of the total geographical area. According to newspaper reports, a comparative analysis of the FSI’s biennial State of Forest Report stated that Nagaland has lost 352 sq. km. in forest cover since 2011. As per IFSR report, a net decrease of 450 sq. km in forest cover has been observed in the state, which can be attributed to shifting cultivation and developmental activities. Along these lines, the state forests are placed in a vulnerable state, with depleting forest cover.
Secondly, more than 70% of population of the state depends on agriculture. Nagaland is primarily an agrarian economy and a large contribution to the state economy is through agriculture and its allied sectors thus, considerably making the people more vulnerable to climate change impacts. The agricultural farmers still rely on traditional form of farming that is shifting cultivation or jhum cultivation, and mostly dependent on rainfed agriculture. Monsoon playing a vital role in the life of farmers, climatic changes highly affect the agricultural production. Agricultural production has been affected due to extensive farming and low soil fertility and extreme weather conditions. With a predominant existence of land tenure system and marginal farmers, the effects of climate change will have negative impacts on agricultural production. Thirdly, nearly 60% of the area of Nagaland has slope greater than 30 degree. Unsurprisingly, high slope area is a major driver of vulnerability in most districts of Nagaland except in the case of Dimapur district, which is close to the plains of Assam.
The other drivers of vulnerability include high percentage of households living BPL in many of the districts and low number of MGNREGA working days. Pertaining to population density, Nagaland is sparsely populated (119 per sq. km) when compared to the national average of 382 per sq. km, with only the district of Dimapur having a population density above the national average at 409 per sq. km. IMR and female literacy rate are least significant drivers of vulnerability.
10.8.5 Utilisation of the vulnerability assessment
The current contextual vulnerability assessment will help in highlighting the drivers of vulnerability and working towards alleviating these drivers. Simultaneously, the focus will be on adaptation investment along with climate compatible development. Vulnerability information will also be used for enabling the policymakers to include climate change as another intersecting factor along with social, historical, political and economic factors while planning intervention strategies.
10.8.6 Way forward
Nagaland is a data deficient state. Carrying out vulnerability assessment requires vast amount of data ranging from the state level to the block level. The first and foremost importance would be to improve data availability, storage and dissemination, and its accessibility. Being a state vastly dependent on forest resources and agriculture, research priority would focus on the mentioned sectors. Vulnerability assessment at the block level would be carried out as the pilot study and sector specific vulnerability assessment would be assessed initially at the district level. The vulnerability profiles developed through these projects need to be integrated and utilised in adaptation planning and adaptation funding project preparations. The results and findings from the Vulnerability Assessment need to be integrated into the State’s Policy Framework to create a sound course of action specifically meant for the State of Nagaland. Further, awareness camps, programmes and workshops need to be organised, aimed at different levels of the society to circulate the information obtained through the vulnerability assessment.
10.9 Sikkim
10.9.1 About the state
Sikkim is one of the hilly states located in the North Eastern part of India dominated by Lesser Himalaya, higher snowcapped Himalayas and a small portion covered by Tibetan Plateau in the Northern part of the state. The location of the state lies between 27o 04’46” N to 28o 07’48”N latitude and 88o00’55” E to 88o 55’25” E longitude. The elevations of the state range from 284 metres to 8,598 metres above mean sea level. Although the total geographical area is only 7,096 sq. km, the state is very diverse in terms of its flora and fauna. Administratively, the state of Sikkim has been divided into four districts, North, South, East and West (Figure 30).

Climate Vulnerability Assessment for the Indian Himalayan Region Using a Common Framework
71
Figure 30: District map of Sikkim. (insert map)
The altitudinal variation of the state extends from 300 metres to more than 8,000 metres, which makes the prevailing of tropical, temperate, sub-alpine to alpine climatic condition in the state. Sharp altitudinal variation from 300 metres to 8,600 metres plays an important role controlling weather and climatic conditions in Sikkim in terms of tropical hot climate, sub-tropical type of climatic condition and temperate to alpine type of climatic conditions.
As per the Census of India 2011, the total population of Sikkim is 0.61 million. The rural population is approximately 70% and most of them are dependent on agriculture for their basic activities. Culturally Sikkim is a multi-ethnic state dominated by Bhutia, Lepcha and Nepali communities.
Social profiles of the districts in the state are presented in table 56 of Appendix.
10.9.2 Weights
Maximum weight has been assigned to slope (23%) as Sikkim is a mountainous state where degree of slope forms an important part of development. MGNREGA forms an important alternative source of income for rural households, so it has been assigned next highest weightage (15%) after slope. BPL population generally forms the weaker section of people in a society so high weightage (14%) is assigned to this indicator as well. As per Census 2011, the population density of Sikkim is 76 persons/sq. km. However, approximately two-third of area in Sikkim is covered by high altitude area and forest, where human settlement are almost absent. So, if these areas are discarded, the population density of Sikkim is very high, and hence needs to be considered as an important indicator of vulnerability and thus, a high weightage (13%) had been assigned to it. The next indicator in terms of weightage is female literacy

72
(12%). Although female literacy is comparatively high in Sikkim, but as female literacy is an important indicator of development, a high weightage has been assigned to this indicator. Forest cover, though a very important indicator, has been assigned lower weightage because in Sikkim, laws strictly protect forests, which bans people from using forests for their livelihood. Even grazing is banned in forest areas, and timber production from forest are almost absent in Sikkim. Since infant mortality is not a major problem in Sikkim, less weightage is given. Similarly, although Sikkim is an agrarian state but at present people mostly cultivate for self-consumption, hence less weightage is assigned to yield variability.
The values given to the indicators and the normalised scores for the indicators are given in table 57 and the weights assigned based on the relative importance of each indicator is depicted in table 58 of Appendix.
10.9.3 Vulnerability profile and ranking of districts
Results of vulnerability assessments across districts in Sikkim are spatially represented in Figure 31 below. Figure 32 represents the districts with vulnerability ranking from low to medium to high vulnerability. Vulnerability index values, and corresponding ranks of districts in the state are presented in table 59 of Appendix.
Figure 31: Distribution of districts on a vulnerability scale of Medium, High and Very High Vulnerability.

Climate Vulnerability Assessment for the Indian Himalayan Region Using a Common Framework
73
Figure 32: Map showing districts ranked based on vulnerability assessment
10.9.4 Major drivers of vulnerability
The drivers of vulnerability vary across districts. For East district of Sikkim high population density and high slope are the main vulnerability factors. In the case of West district the important contributors, which enhance vulnerability are low female literacy and poverty (BPL) leading to low income. In the North district low forest cover and again low income (BPL) makes the region vulnerable, and in the South district high yield variability and low income contributes to the vulnerability of the region. However, for the state as a whole, steep slope is the main driver of vulnerability for Sikkim.
10.9.5 Utilisation of the vulnerability assessment
Through the results obtained from the vulnerability assessment, we are able to distinguish the districts that are more vulnerable and require immediate attention than its counterparts. The rankings of the districts according to vulnerability will also assist policy makers, departments, NGO’s and agencies to prioritise the areas that need urgent intervention. Developmental activities and infrastructure can also be planned according to the report. Furthermore, the report indicates the factors/drivers that control the vulnerability of the district. Actions and policies may be framed for effective adaptation planning keeping in

74
mind the drivers, which are accountable for increasing the vulnerability of the area.
10.9.6 Way forward
Findings of the assessment and the vulnerability profiles developed need to be integrated and utilised in adaptation planning and adaptation funding project preparations. Following the district-level assessment, assessments at the block level and sectoral assessments (Forests, Health, Agriculture, Water, etc.) need to be conducted, which would be utilised for revision of the SAPCC, and the vulnerability assessment reports are to be shared with the state and the central government.
10.10 Tripura
10.10.1 About the state
Tripura spreads over 10,491 sq. km, located precisely from 22°56’N to 24°32’N and 91°09’E to 92°20’E. The state is characterised by hill ranges, valleys, and plains and by tropical savanna climate. Lying within the Indomalaya ecozone, Tripura hosts three different types of ecosystems: mountains; forests; and freshwater.
Tripura is the second most populous state in the North Eastern region. According to Census 2011, the state’s population is 3.67 million, with a density of 350 persons per sq. km. and literacy rate at 87.8%.
District-wise social profiles of the state are presented in table 60 of Appendix.
The state is well endowed with surface water resources. Majority of the population is dependent on agricultural and allied activities. Land use pattern across the districts is presented in Table 61 of Appendix. As many as ten major rivers in the state are reported to generate an annual flow of 793 million cubic metres of water. All major rivers that originate from hill ranges are generally ephemeral in nature and their flow is directly related to the rainfall.
District-wise net area irrigated is presented in table 62 of Appendix.
Figure 33: Spatial distribution of districts in Tripura.
The state is located in the bio-geographic zone of 9B North East Hills and is extremely rich in biodiversity. The climate of Tripura exhibits a strong seasonal rhythm. The state is characterised by a warm and humid tropical climate with five distinct seasons namely spring, summer, monsoon, autumn and winter.
Normal monsoon rainfall and percentage departure of rainfall in 2016 from the normal for the districts in Tripura is presented in table 63 of Appendix.
10.10.2 Weights assigned
The weights are assigned based on consultation with representatives from State Climate Change Cell Tripura, Directorate of Biotechnology, Government of Tripura,

Climate Vulnerability Assessment for the Indian Himalayan Region Using a Common Framework
75
Tripura University, and College of Agriculture Tripura. Yield variability was assigned the highest weight (28%) as yield variability is directly correlated with climate variability and majority of the population is dependent on agriculture and allied activities. Second highest weight has been assigned to area under forest (20%) as significant portion of the population depends on forest for their livelihood. Population density has been assigned a weight of 16% as the state is one of the populous states followed by weight of 14% to percentage of BPL families. The state has high percentage of BPL households indicating poor coping capacity. Relatively lower weights are assigned to percentage of area with slope greater than 30 degree, female literacy rate, IMR and employment generation through MGNREGA.
The values given to the indicators and the
normalised scores for the indicators are given in table 64 and the weights assigned based on the relative importance of each indicator is depicted in table 65 of Appendix.
10.10.3 Vulnerability profile and ranking of districts
Results of vulnerability assessments across districts in Tripura are spatially represented in Figure 34 below. Figure 35 represents the districts with vulnerability ranking from low to medium to high vulnerability. It can be seen from the figures below that Sepahijala has been ranked as the most vulnerable district. This is followed by Unakoti, Dhalai, and West Tripura which rank among the high vulnerable districts. Vulnerability index values, drivers of vulnerability and corresponding ranks of districts in the state are presented in table 66 of Appendix.
Figure 34: Distribution of districts on a vulnerability scale of Low, Medium and High vulnerability.

76
Figure 35: Map showing districts ranked based on vulnerability assessment
10.10.4 Major drivers of vulnerability
Some of the major concerns identified among the high vulnerable districts in Tripura are high yield variability, IMR, population density, low forest cover and high percentage of families living in BPL. In Tripura, agriculture is the predominant source of livelihood, increase in yield variability would directly affect the population depending on agriculture and allied sectors, thereby increasing their vulnerability. IMR, identified as one of the drivers of vulnerability is a composite indicator, which represents the overall status of healthcare in the state including medical infrastructure, access to basic health facilities and nutrition. Population density is another major driver in
the state. Tripura is one of the most populous states in the eastern Himalayan region. A large population would signify greater pressure on natural resources and higher susceptibility to impacts of hazards. A significant section of the population of Tripura depend on forests for their livelihood. Destruction and degradation of forests will severely impact those who are directly dependent on it. Another major driver of vulnerability in the region is the high percentage of population living BPL, as poor people have reduced ability to cope.
10.10.5 Utilisation of the vulnerability assessment
Identification of drivers of vulnerability is the first step

Climate Vulnerability Assessment for the Indian Himalayan Region Using a Common Framework
77
in moving towards building resilience of a community. Identification will help in developing adaptive policies, practices and measures specific to the requirement of the state. Findings from the vulnerability assessment would be utilised by the Government policy makers and development agencies in their programme for adaptation planning. Identification of drivers of vulnerability is the first step in moving towards building resilience of any community. Identification will help in developing adaptive policies, practices and measures specific to the requirement of the state. Findings from the vulnerability assessment would be utilised by the Government policy makers and development agencies in their programme for adaptation planning.
10.10.6 Way forward
After conducting district-level vulnerability assessment, the next step would be to narrow down to block and village-level vulnerability assessment.
Sector-specific vulnerability assessment for sectors like forest, agriculture should also be taken up, which would aid in understanding vulnerability of such systems. Furthermore, there is a need to integrate and utilise the vulnerability profiles developed in adaptation planning and adaptation funding project preparations.
10.11 Uttarakhand
10.11.1 About the state
Uttarakhand state has a total geographic area of 53,483 sq. km (1.63% of India), of which 93% is mountainous and 64.81% forest. The state is situated between latitude 28o43’20”-31o28’00” N to longitude 77o34’06”-81o01’31” E and, geographically divided into two divisions 1) Garhwal (32450 sq. kms) i.e. the northwest part and 2) Kumaon (21035), the southeast part of the state.
Figure 36: District map of Uttarakhand.

78
Uttarakhand is temperate with seasonal variations in temperature and affected by tropical monsoons. The state is quite rich in water and forest resource with many glaciers, rivers, dense forests and snow-clad mountain peaks, with a rare biodiversity, inter-alia, 175 rare and threatened species of aromatic and medicinal plants, as well as animals. The forest cover in the state is 24,496 sq. km. (45.8%) of the state’s geographical area. It has almost all major climatic zones, amenable to a variety of commercial opportunities in horticulture, floriculture and agriculture.
As per Census 2011, the total population of the state is 10.09 million with the density of 189 persons per sq. km. Average sex ratio is 963 females per 1,000 males. 7.7% households, on an average are living BPL. The IMR is 35.7 per 1,000 live births. Uttarakhand is traditionally an agrarian state and 78% of the population depends on agriculture for livelihood. Horticulture is one of the critical sectors in the economy of Uttarakhand.
Table 67 of Appendix depicts land use patterns in the state of Uttarakhand. Social profiles of the districts are given in table 68 and Normal monsoon rainfall and percentage departure of rainfall in 2016 from the normal for the districts in the state is given in table 69 of Appendix.
10.11.2 Weights assigned
Weight assigned to various indicators are on the basis of their impact on physical and social environment. Highest weight (24%) is given to slope as Uttarakhand is a mountainous region and is fragile. Landslides are a major phenomena occurring in the state impacting the life of locals. The second highest weight is (22%) Yield
Variability, in Uttarakhand as two districts are in plains, two are partially hilly and plain, and nine are hilly, which affects the economy and the livestock of local people. The third highest weight is 20% for per capita income as Wealth enables communities to absorb and recover from losses more quickly, and the higher the percentage of total population with asset ownership, and access to these income sources the lesser the vulnerability. Area under forest, female literacy rate and MGNREGA have similar weight (8%) and IMR/doctors and population density has similar weight (5%). All of them are indirect drivers of the major three indicators. State Climate Change Centre, Uttarakhand Space Application Centre, Uttarakhand Council of Science and Technology, Directorate of Economics and Statistics Department and the Directorate of Agriculture played major roles in assignment of weights.
The values given to the indicators and the normalised scores for the indicators are given in table 70 and the weights assigned based on the relative importance of each indicator is depicted in table 71 of Appendix.
10.11.3 Vulnerability profile and ranking of districts
Results of vulnerability assessments across districts in Uttarakhand are spatially represented in Figure 37 below. Figure 38 represents the districts with vulnerability ranking from low to medium to high vulnerability. District Tehri Garhwal has been ranked as the most vulnerable district, followed by Pithoragarh, Bhageshwar, and Haridwar, which rank among the high vulnerable districts. Vulnerability index values and the ranks for each district in the state are presented in table 72 of Appendix.

Climate Vulnerability Assessment for the Indian Himalayan Region Using a Common Framework
79
Figure 37: Distribution of districts on a vulnerability scale of Low, Medium and High vulnerability

80
Figure 38: Map showing districts ranked based on vulnerability assessment
10.11.4 Major drivers of vulnerability
Steep slope and low per capita income are the dominant drivers of vulnerability in the high vulnerability districts i.e. Tehri Garhwal, Pithoragarh, Bhageshwar and Haridwar. Higher slope areas are more vulnerable in terms of accessibility to transportation, health facilities, drinking water availability, communication etc. and at the same
time are prone to have fragile ecosystem. While 85% of geographical area of the state is hilly with higher slope, these particular districts are almost fully characterised by steep terrain. While the per capita income in Uttarakhand is actually higher than the national average, the dispersion among the regions is quite high. Other than in Pithoragarh, high yield variability also contributes to the vulnerability, while in Pithoragarh low forest cover is one of the major

Climate Vulnerability Assessment for the Indian Himalayan Region Using a Common Framework
81
drivers. Therefore, in the state of Uttarakhand, it’s a mix of socio-economic and biophysical characteristics that make some of the districts more vulnerable. Among the low vulnerable districts, better performance with respect to female literacy rate in Dehradun, and less presence of steep slope in Udham Singh Nagar have acted to reduce vulnerability.
10.11.5 Utilisation of the vulnerability assessment
The present vulnerability assessment report will be useful to identify opportunities for adaptation intervention and investments in the state. This is applicable both in the context of government funding as well as funds from other development agencies. This assessment gives a sense of the districts (as the administrative units) that are most vulnerable and therefore require more specific fund allocation with respect to climate change adaptation planning. It also helps identify drivers of vulnerability for each of the districts and gives a sense of the sector/system where the intervention is most needed. This information will be useful for the state-level policy makers to decide over the distribution of funds across places and sectors with the aim to reduce climate change related vulnerability.
10.11.6 Way forward
This current climate vulnerability assessment sets the base for future climate change vulnerability assessment of the state. Vulnerability profiles generated should be utilised for adaptation planning and adaptation funding preparations. The Climate Research Unit (CRU)
is now engaged in the task of fine-tuning Vulnerability and Risk Assessment (VRA) in accordance with IPCC-AR5 framework. It is also engaged in revision of SAPCC, Uttarakhand in line with National Development Council (NDC), sustainable development goals (SDGs) and other priorities of the government. In future, vulnerability and risk assessment could be carried out at a higher resolution (block or village level). 10.12 West Bengal (Darjeeling Himalayan Region)
10.12.1 About the Darjeeling Himalayan Region
Darjeeling and Kalimpong districts, a part of the Greater Himalaya are the two northernmost districts of West Bengal and lie in the extremely complex Himalayan biosphere. As such the ecosystem of this region is highly sensitive to the threats of climate change. Located in 27° 13’ N to 26° 27’N latitude and 88° 53’E to 87° 59’E longitude, Darjeeling and Kalimpong comprise a total area of 3,149 sq. km of the state of West Bengal. As per Census 2011 Darjeeling and Kalimpong have a total population of 18,44,332 persons among them, of which 60.52% population resides in 684 villages and rest 39.48% lives within five municipalities and 24 census towns.
Table 73 in Appendix represents social profile of the two districts.
The overall literacy rates of these two districts are 70.86% and 73.6% respectively into which the female contribution is quite significant (Census of India, 2011).

82
Figure 39: Spatial distribution of blocks in Darjeeling and Kalimpong districts.
Geologically the entire region can be subdivided as: the Sub-Himalaya or the Siwalik Belt, Lower or lesser Himalayas and Higher Himalayas.
The economy of Darjeeling Hill area depends on tea production, horticulture, agriculture and forestry. Table 74 of Appendix represents land use pattern in the two districts of Darjeeling and Kalimpong. The forests in and around Darjeeling have delightful flora and fauna. Darjeeling has a subtropical highland climate with wet
summers caused by monsoon rains. Normal Monsoon rainfall and percentage departure of rainfall in 2016 from the normal in the two districts are presented in table 75 of Appendix.
10.12.2 Weights assigned
Weights were assigned to all indicators based on literature review and the perception of project associates. The region is highly dependent on

Climate Vulnerability Assessment for the Indian Himalayan Region Using a Common Framework
83
MGNREGA as it supports an alternate source of livelihood. So, this indicator has been given maximum weightage (18%). Darjeeling Himalayan region being highly susceptible to landslides, slope is also given a high weightage (17%). Population density is also very important as it indicates the quantum of people exposed to vulnerability; also, most of the areas of this region are inaccessible so there is more stress on limited natural resource. Population density can indicate this stress also. That is why population density is given a higher weightage (15%). Water scarcity is a major problem of this region. Biodiversity, genepool and livelihood depend on forests, which also acts as a water sanctuary. Yield variability being a climate sensitive indicator has been given a high weightage. Both forest cover and yield variability are, therefore, considered to be of similar importance as population density (15% weights to each). The others indicators are female literacy rate and no. of child deaths up to 5 years of age, which indicates the socio-economic status of the region. Indicators were given weights on a scale of 1 to 100 based on their significance in
vulnerability of the districts and their relevance to help the local community in coping with the vulnerability. All the weights sum up to 100. The values given to the indicators and the normalised scores for the indicators are given in table 76 and the weights assigned based on the relative importance of each indicator is depicted in table 77 of Appendix.
10.12.3 Vulnerability profile and ranking of districts
Results of vulnerability assessments across blocks of the two districts of West Bengal – Kalimpong and Darjeeling – are spatially represented in Figure 40 below. Figure 41 represents the blocks with vulnerability ranking from low to medium to high vulnerability. According to the assessment, Matigara ranks as the most vulnerable block followed by Rangli Rangliot, Phansidewa, Kharibari and Darjeeling Pulbazar, which rank among the high vulnerable blocks. Vulnerability index ranks and vulnerability index values for the blocks are presented in table 78 of Appendix.
Figure 40: Map showing blocks with level of vulnerability (Low – Medium – High Vulnerability)

84
Figure 41: Map showing blocks’ rank based on vulnerability assessment
10.12.4 Major drivers of vulnerability The major drivers of vulnerability in the two districts of West Bengal have been identified as lack of alternative source of livelihood such as MGNREGA, biophysical characteristics like high percentage of area with slope greater than 30°, and declining forest cover, in addition to high yield variability and female literacy.10.12.5 Utilisation of the vulnerability assessment
The outcome of the proposed Vulnerability and Risk Assessment study is to be used for preparation of an Adaptation Strategy for sustaining the ecosystem in Darjeeling-Kalimpong districts, and also for continuing key ecosystem services through sustainable development. Vulnerability assessment report may be utilised in multiple ways, by various stakeholders, engaged in different sectors. It will serve in the following ways:1. Vulnerability assessment at community level can
prompt simple adjustments in prevailing practices, the outcomes of which may potentially enhance resilience and sustainability.
2. Vulnerability assessment results may help policy
makers to prioritise the locations, regions, sectors and communities for adaptation, interventions, investment allocation and to formulate climate resilience policies.
3. Vulnerability assessment may assist development agencies to prioritise resource allocation to sectors and regions in building resilience to cope with climate change impacts.
4. It can also provide directives to the academia to identify the gap areas demanding research insight.
10.12.6 Way forward
A sectoral approach in vulnerability assessment for the major thrust areas of Darjeeling Himalayan Region may be adopted. Natural Resources: Water, Forest and Biodiversity, Socio-economic Sector: Demography, Health and Hygiene, Commercial Sector: Tea, Mandarin, Cardamom Hazard Specific: Landslide Stakeholders’ opinion may be taken into consideration for modifications and better assessment of vulnerable sectors. Furthermore, there is a need to integrate and utilise the vulnerability profiles developed in adaptation planning and adaptation funding project preparations.

Climate Vulnerability Assessment for the Indian Himalayan Region Using a Common Framework
85
PART IV: CONCLUSION AND WAY FORWARD

86

Climate Vulnerability Assessment for the Indian Himalayan Region Using a Common Framework
87
The project “Capacity Building on Climate Change Vulnerability Assessment in States of Indian Himalayan Region” was initiated with an aim to equip relevant state government departments of 12 states in the IHR with a common methodological framework to develop the vulnerability profiles of the Himalayan states. This includes nine states in the eastern Himalayan region (Arunachal Pradesh, Manipur, Meghalaya, Mizoram, Nagaland, Sikkim, Tripura, Assam and the hilly districts of West Bengal) and three states in the western Himalayan region (Jammu & Kashmir, Himachal Pradesh and Uttarakhand).
Prior to implementation of the project, states used diverse methodological frameworks to develop their own climate change vulnerability profiles and therefore, were not readily comparable. Also, the transition in the methodological framework from IPCC 2007 to IPCC 2014 was not clearly reflected in many of these assessments. The focus was therefore, to develop comparable vulnerability profiles of these states as well as the districts within the states where vulnerability is perceived as a system property composed of its sensitivity and adaptive capacity, and independent of the element of exposure as per IPCC 2014 guidelines. This was achieved through a series of Need Assessment Workshops followed by a common Methodological Workshop and a Dissemination Workshop. The process not only created an understanding of the methodological framework, but also initiated a dialogue between the states in the IHR. The common set of indicators to assess vulnerability was derived through prolonged debates and discussions during the workshops in the presence of participants from various state departments and academic institutes of the 12 states. It was quite revealing to observe that while the Himalayan states are often addressed as a homogeneous group, the factors that they perceive to be important contributors to their vulnerability are quite different from each other. The weights assigned to the indicators were also finalised based on the expert suggestions from several departments of each of the states. The process itself demonstrates the rigour that has to be put forward in order to achieve a meaningful and comprehensive vulnerability assessment.
The composite vulnerability indices derived for the states based on a common set of indicators reveal that the value is highest for Assam (0.72) and Mizoram (0.71), followed by Jammu & Kashmir (0.62), Manipur (0.59), Meghalaya, West
Bengal (both 0.58), Nagaland (0.57), Himachal Pradesh and Tripura (both 0.51), Arunachal Pradesh (0.47) and Uttarakhand (0.45). Sikkim is the least vulnerable state with the index being 0.42. A brief review of the drivers of vulnerability of the states reveals that high sensitivity of agriculture sector in Assam, Himachal Pradesh, Mizoram and Nagaland; lack of connectivity and access to information services and infrastructure in Mizoram, Jammu & Kashmir; high sensitivity of socio-economic indicators in Manipur, Meghalaya, Tripura and West Bengal, and lack of forest dependent livelihoods in states such as Assam, Uttarakhand and Sikkim are dominant among the drivers of vulnerability. It is important to note that vulnerability is a relative measure, which means that this assessment does not portray Sikkim, Uttarakhand or Arunachal Pradesh as having low vulnerability in an absolute sense. It also does not imply that the mentioned drivers are the only drivers of vulnerability of the mentioned states. These states are least vulnerable relative to the other IHR states, and also have several inherent drivers of vulnerability that need to be addressed. District-level vulnerability profiles developed by each of the states help in identifying most vulnerable districts in the state and their respective drivers. State and district-level vulnerability maps are also created for all 12 states.
The assessments carried out under this project can be conceptualised at the beginning of a process and not the end. The vulnerability assessments reported here are primarily based on Tier I approach. In future, the states are encouraged to carry out assessments following Tier II and II approach involving greater consultation with the stakeholders. It will also be important to carry out sectoral vulnerability as appropriate for each of the states. It is envisaged to assist the state climate change cells to upgrade/revise their SAPCC as per the state-of-the-art methodology. However, vulnerability assessment is inherently a data intensive process. While the project also developed an understanding of requirement and availability of secondary data at different resolution to carry out such assessments, the deficiency has also been marked in many of the states and sectors. Several states, in the process, have identified the need for improved data availability, storage and dissemination and its accessibility. Finally, a successful implementation of this project puts forward the need for the next step – development of a similar toolkit for a good adaptation framework incorporating vulnerability assessment.

88
References• Adger,W. N, and P.M. Kelly. 1999.“Social vulnerability to climate change and the architecture of entitlements.”
Mitigation and adaptation strategies for global change 4 (3):253-66.• Agrawal,A.andNPerrin.2008.“ClimateAdaptation,Local Institutions,andRuralLivelihoods.” IFRIWorkingPaper.
International Forestry Resources and Institutions Program, University of Michigan• Allen,K.,2003.“Vulnerabilityreductionandthecommunity-basedapproach:APhilippinesstudy.”In:NaturalDisasters
and Development in a Globalizing World, ed. M. Pelling, 170–184, New York: Routledge• Allen,S,DMohan,MStoffel,MAKhan,JKurigerandSSinha.2017.“AssessingClimateVulnerabilityandRiskinthe
Indian Himalayan Region”. IHCAP.• AmericanMeteorologicalSociety.2012.“ClimateChange.”• Barua,A,SKatyaini,BMili,andPGooch.2014.“Climatechangeandpoverty:buildingresilienceofruralmountain
communities in South Sikkim, Eastern Himalaya, India.” Regional Environmental Change 14:267-80. • Beniston,M.2003.“Climaticchange inmountain regions:a reviewofpossible impacts”. InClimatevariabilityand
change in high elevation regions: Past, present & future: 5-31. Springer, Dordrecht.• Bhatt,BhuwanChandra,andK.Nakamura.2005.“CharacteristicsofmonsoonrainfallaroundtheHimalayasrevealed
by TRMM precipitation radar”. Monthly Weather Review 133 (1):149-165.• Bookhagen, Bodo., 2010.“Appearance of extrememonsoonal rainfall events and their impact on erosion in the
Himalaya.” Geomatics, Natural Hazards and Risk 1 (1): 37-50.• Champion,S.H.andS.K.Seth.1968.“ArevisedsurveyoftheforesttypesofIndia”.• Chaudhuri,A.B.andD.D.Sarkar.2003.“MegadiversityConservation:Flora,FaunaandMedicinalPlantsofIndia’sHot
Spots”. Daya Books.• Choudhury,Maitreyee.2006.“Sikkim:GeographicalPerspectives.”NewDelhi:MittalPublications• Cutter,S.L.,LBarnes,MBerry,CBurton,EEvans,ETate,andJWebb.2008.“Aplace-basedmodelforunderstanding
community resilience to natural disasters.” Global Environmental Change, 18(4): 598-606.• Dekens, Julie., 2005.“Livelihoodchangeand resiliencebuilding: a village study from theDarjeelingHills, Eastern
Himalaya, India.” • DepartmentofAgriculture,Cooperation&FarmersWelfare.2016.“Landusestatistics2015-16.”NewDelhi:Government
of India. • DepartmentofPlanning&Statistics.2012.“DistrictStatisticalHandbook.”GovernmentofWestBengal.• DepartmentofScience,TechnologyandEnvironment.2011.“StateActionPlanonClimateChange”.Governmentof
Tripura. Available at: http://www.moef.nic.in/sites/default/files/sapcc/TRIPURA.pdf.• DirectorateofEconomicandStatistics.2014.“DigestofStatistics”.GovernmentofJammuandKashmir.• DirectorateofEconomicandStatistics.2016.“Statisticalabstract”.GovernmentofMeghalaya.• DirectorateofEconomicandStatistics.2017.“StatisticalHandbookofManipur.”GovernmentofManipur.• DirectorateofEconomicandStatistics.2018.“EconomicSurvey2017-18.”GovernmentofManipur.• Directorate of Economics and Statistics. 2016.“Land use Statistics.” New Delhi: Ministry of Agriculture &Farmers
Welfare, Government of India. Census 2011, Office of the Registrar General & Census Commissioner, Ministry of Home Affairs, Government of India, India
• DirectorateofEnvironment.2013.“StateActionPlanonClimateChange.”[online]GovernmentofManipur.Availableat: http://www.moef.nic.in/sites/default/files/sapcc/Manipur.pdf.
• Easterling,W.E.,P.K.Aggarwal,PBatima,K.M.Brander,LErda,S.M.Howden,AKirilenko, JMorton, J.F.Soussana, JSchmidhuber and F.N. Tubiello. 2007. “Food, fibre and forest products. Climate Change 2007: Impacts, Adaptation and Vulnerability”. Contribution of Working Group II to the Fourth Assessment Report of the Intergovernmental Panel on Climate Change, M.L. Parry, O.F. Canziani, J.P. Palutikof, P.J. van der Linden and C.E. Hanson, Eds., Cambridge University Press, Cambridge, UK: 273-313.
• Edenhofer,O.,R.Pichs-Madruga,Y.Sokona,E.Farahani,S.Kadner,K.Seyboth,A.Adler,I.Baum,S.Brunner,P.Eickemeier,B. Kriemann, J. Savolainen, S. Schlömer, C. Von Stechow, T. Zwickel and J.C. Minx (eds.). 2014. “Contribution of Working Group III to the Fifth Assessment Report of the Intergovernmental Panel on Climate Change.” Cambridge, United Kingdom and New York, NY, USA: Cambridge University Press.
• Editor-Director,ZoologicalSurveyofIndia.2009.“FaunaofMizoram.”StateFaunaSeries.Kolkata.

Climate Vulnerability Assessment for the Indian Himalayan Region Using a Common Framework
89
• Edwards,J.,MGustafsson,andBNaslund-Landenmark.2007.“Handbookforvulnerabilitymapping.”SwedishRescueServices Agency, Karlstad, Sweden
• Esteves,T.,K.VRao,B.Sinha.S.SRoy,B.Rao,S. Jha,A.BSingh,P.Vishal,S.Nitasha,S.RaoandR.Sharma.2013.“Agricultural and livelihood vulnerability reduction through the MGNREGA”. Economic and Political Weekly: 94-103.
• Esteves,T.,N.HRavindranath,S.Beddamatta,K.VRaju,J.Sharma,G.BalaandI.KMurthy.2016.“Multi-scalevulnerabilityassessment for adaptation planning.” Current Science. 110(07): 1225-1239.
• EuropeanEnvironmentAgency.2016.AdaptationSupportTool.• ForestSurveyofIndia.2006.“StateofForestReport.”MinistryofEnvironment&Forests.• ForestSurveyofIndia.2017.“StateofForestReport.”MinistryofEnvironment&Forests.• Füssel,H.M.,2007.“Vulnerability:Agenerallyapplicableconceptualframeworkforclimatechangeresearch”.Global
Environmental Change, 17(2): 155-167.• G.B.Schaller.1979.“MountainMonarchs--WildSheepandGoatsoftheHimalaya”:UniversityofChicagoPress• GIZ.2014.“AFrameworkforClimateChangeVulnerabilityAssessments.”• Government ofArunachal Pradesh. 2017.“Arunachal Pradesh StateAction PlanonClimateChange.” In. Itanagar:
Department of Environment & Forests.• Government of Arunachal Pradesh. 2018. “Biological Richness.” Department of Environment and Forests. http://
arunachalforests.gov.in/.• GovernmentofIndia.“CropProductionStatisticsforSelectedStates,CropsandRangeofYear.”DirectorateofEconomics
and Statistics, Ministry of Agriculture and Farmers Welfare. http://www.aps.dac.gov.in/APY/public_Report1.aspx.• GovernmentofIndia.“OpenGovernmentData.”Availableat:https://data.gov.in/• GovernmentofIndia.2011a.“AgricultureCensusofIndia.”In.NewDelhi:DepartmentofAgriculture&Co-Operation,
Ministry of Agriculture.• GovernmentofIndia.2011b.“CensusofIndia.”In.NewDelhi:GovernmentofIndia.• GovernmentofIndia.2013.“PressNoteonPovertyEstimates,2011-12.”In.NewDelhi:PlanningCommission.• GovernmentofIndia.2015.“MGNREGA.”In.NewDelhi:MinistryofRuralDevelopment,GovernmentofIndia.• GovernmentofIndia.2018b.“MGNREGA.”In.NewDelhi:MinistryofRuralDevelopment,GovernmentofIndia.• GovernmentofMizoram.“StateExtensionWorkPlan,2016-17.”RashtriyaKrishiVikarYojana,Mizoram• GovernmentofSikkim.“DirectorateofEconomics,Statistics,MonitoringandEvaluation.”Availableat:http://www.
desme.in/.• GovernmentofSikkim.2011.“SikkimActionPlanonClimateChange(2012-2030).”Sikkim:GovernmentofSikkim.• GovernmentofSikkim.“ENVISCentre:SikkimStatusofEnvironmentandRelatedIssues.”Availableat:http://sikenvis.
nic.in/ • GovernmentofTripura.“TripuraStatePortal”.Availableat:https://tripura.gov.in/• Hamilton,L.S.2002.“Whymountainmatters”.WorldConservation:TheIUCNBulletin,1:2002.• Hinkel, J. 2011. “Indicators of vulnerability and adaptive capacity: towards a clarification of the science–policy
interface.” Global Environmental Change, 21(1): 198-208.• Hooker,JosephDalton.1855.“NotesofanaturalistinBengal,theSikkimandNepalHimalayas,theKhasiaMountains,
&c.” London: Himalayan Journals.• Indian Space Research Organisation. “National Remote Sensing Centre.” Available at: https://www.nrsc.gov.
in/?q=Contact_Us• IPCC. 2001.“Climate Change 2001:The Scientific Basis. Contribution ofWorkingGroup I to theThirdAssessment
Report of the Intergovernmental Panel on Climate Change.” In, edited by J.T. Houghton, Y Ding, J Griggs D, Noguer, van der Linden M, P.J. ,, X Dai, K Maskell and C Johnson, A,. United Kingdom, New York: Intergovernmental Panel on Climate Change.
• IPCC. 2007. “Climate Change 2007: Synthesis Report. Contribution ofWorking Groups I, II and III to the FourthAssessment Report of the Intergovernmental Panel on Climate Change.” In, edited by R.K Pachauri and A Reisinger. Geneva, Switzerland
• IPCC.2007.“ClimateChange2007: Impacts,AdaptationandVulnerability.ContributionofWorkingGroupIItotheFourth Assessment Report of the Intergovernmental Panel on Climate Change.” Parry ML, Canziani OF, Palutikof JP, van der Linden PJ and Hanson CE, Eds. Cambridge University Press, Cambridge, UK, 976 pp.
• IPCC.2012.“ManagingtheRisksofExtremeEventsandDisasterstoAdvanceClimateChangeAdaptation.”InASpecialReport of Working Groups I and II of the Intergivernmental Panel on Climate Change, edited by C.B Field, B Barros, T.F Stocker, D Qin, D.J Dokken, K.L Ebi, M.D Mastrandrea, et al., 582. Cambridge, UK New York, NY, USA.

90
• IPCC.2014.SummaryforPolicymakers.In:Field,C.B.,Barros,V.R.,Dokken,D.J.,Mach,K.J.,Mastrandrea,M.D.,Bilir,T.E.,Chatterjee, M., Ebi, K.L., Estrada, Y.O., Genova, R.C., Girma, B., Kissel, E.S., Levy, A.N., MacCracken, S., Mastrandrea, P.R., White, L.L. (Eds.). Climate Change 2014: Impacts, Adaptation, and Vulnerability. Part A: Global and Sectoral Aspects. Contribution of Working Group II to the Fifth Assessment Report of the Intergovernmental Panel on Climate Change. Cambridge University Press, Cambridge, United Kingdom and New York, NY, USA, pp. 1–32.
• IPCC.2018.SummaryforPolicymakers.In:Globalwarmingof1.5°C.AnIPCCSpecialReportontheimpactsofglobalwarming of 1.5°C above pre-industrial levels and related global greenhouse gas emission pathways, in the context of strengthening the global response to the threat of climate change, sustainable development, and efforts to eradicate poverty [V.Masson-Delmotte,P.Zhai,H.O.Pörtner,D.Roberts, J.Skea,P.R.Shukla,A.Pirani,W.Moufouma-Okia,C. Péan, R. Pidcock, S. Connors, J. B. R. Matthews, Y. Chen, X. Zhou, M. I. Gomis, E. Lonnoy, T. Maycock, M. Tignor, T. Waterfield(eds.)].WorldMeteorologicalOrganization,Geneva,Switzerland,32pp.
• Isaac,R.K.andM.Isaac.2017.“VulnerabilityofIndianAgriculturetoClimateChange:AStudyoftheHimalayanRegionState.” World Academy of Science, Engineering and Technology, International Journal of Biological, Biomolecular, Agricultural, Food and Biotechnological Engineering, 11(3): 236-242.
• ISFR.2017.“StateForestReport.”In,editedbyStateForestResearchInsitute.Dehradun:MoEFC.• JammuandKashmirForestDepartment.2013.“DigestofForestStatistics”.GovernmentofJammuandKashmir.• Joshi,S,KKumar,VJoshi,andBPande.2014.“Rainfallvariabilityandindicesofextremerainfall-analysisandperception
study for two stations over Central Himalaya, India.” Natural hazards 72(2): 361-374.• Kelly,P.M.andW.N.Adger.2000.“Theoryandpracticeinassessingvulnerabilitytoclimatechangeandfacilitating
adaptation.” Climatic Change, 47(4): 325-352.• Kollmair,M., G. SGurung, K.Hurni andD.Maselli. 2005.“Mountains: special places to be protected?An analysis
of worldwide nature conservation efforts in mountains.” The International Journal of Biodiversity Science and Management, 1(4): 181-189.
• Kumar,K.R.,A.K.Sahai,KKrishnaKumar,S.K.Patwardhan,P.K.Mishra,J.V.Revadekar,KKamala,andG.B.Pant.2006.“High-resolution climate change scenarios for India for the 21st century.” Current Science 90 (3): 334-345.
• McDowell,G.,J.D.Ford,B.Lehner,L.Berrang-Ford,andA.Sherpa.2013.“Climate-relatedhydrologicalchangeandhuman vulnerability in remote mountain regions: a case study from Khumbu, Nepal.” Regional Environmental Change 13 (2):299-310. doi: 10.1007/s10113-012-0333-2.
• MeehlG.A,T.FStocker,W.DCollins,P.Friedlingstein,A.TGaye,J.MGregory,A.Kitoh,R.Knutti,J.MMurphy,A.Noda,S.C B Raper, I. G Watterson, A. J Weaver and Z. C Zhao. 2007. “Global Climate Projections.” In: Climate Change 2007: The Physical Science Basis. Contribution of Working Group I to the Fourth Assessment Report of the Intergovernmental PanelonClimateChange[S.Solomon,D.Qin,M.Manning,Z.Chen,M.Marquis,K.BAveryt,M.TignorandH.LMiller(eds)].CambridgeUniversityPress.Cambridge,UnitedKingdomandNewYork,NY,USA.
• Ministry of Earth Sciences.“IndiaMeteorological Department.” Available at: http://www.imd.gov.in/Welcome%20To%20IMD/Welcome.php.
• MinistryofHealth&FamilyWelfare.2018.“DeliveryMonitoringUnitReport.”NewDelhi:GovernmentofIndia• MinistryofHomeAffairs.2011.“Census2001.”GovernmentofIndia.• MinistryofHomeAffairs.2011.“Census2011.”GovernmentofIndia.• MinistryofHomeAffairs.2011.“Instructionmanualforhouselistingandhousingcensus.”GovernmentofIndia.• MinistryofHomeAffairs.2012.“AnnualHealthSurvey2011-2012.”NewDelhi:GovernmentofIndia• Mishra,V.,R.KumarandA.Garg.2017.“Identificationofclimatevulnerabilityhotspots inMeghalayausinghigh-
resolution climate projections”. 10.13140/RG.2.2.28365.74722.• MizoramClimateChangeCell.2018.“ClimateProfileofMizoram.”GovernmentofMizoram.• Mohan,D.andSSinha.2010.“VulnerabilityAssessmentofpeople,livelihoodsandecosystemsintheGangabasin.”• Neu,U.2009.“Climatechangeinmountains.”In:Mountainsandclimatechange:Fromunderstandingtoaction,pp.6-
9.• NITI Ayog, 2018. “Sustainable Tourism in the Indian Himalayan Region.” https://niti.gov.in/writereaddata/files/
document_publication/Doc2.pdf. Last accessed on 24.1.2019. • Norris,F.H.,S.P.Stevens,B.Pfefferbaum,K.F.Wyche,andL.Pfefferbaum.2008.“CommunityResilienceasaMetaphor,
Theory, Set of Capacities and Strategy for Disaster Readiness.” Am J Community Psychol:127-50.• NRHM.2017.“InfantMortalityRate.”In:Naharlagun:GovernmentofArunachalPradesh.• O’Brien,K.L.andR.M.Leichenko.2000.“Doubleexposure:assessingtheimpactsofclimatechangewithinthecontext
of economic globalization.” Global Environmental Change, 10(3):221-232.

Climate Vulnerability Assessment for the Indian Himalayan Region Using a Common Framework
91
• O’Brien,K.L.,R.M.Leichenko,UKelkar,HVenema,GAandahl,HTompkins,AJaved,etal.2004.“Mappingvulnerabilityto multiple stressors: climate change and globalization in India.” Global Environmental Change 14 (4):303-13.
• O’Brien,K.L.,SEriksen,L.P.Nygaard,andASchjolden.2007.“Whydifferentinterpretationsofvulnerabilitymatterinclimate change discourses.” Climate Policy 7 (1):73-88.
• Paavola,J.2008.“Livelihoods,vulnerabilityandadaptationtoclimatechangeinMorogoro,Tanzania.”EnvironmentalScience & Policy, 11(7):642-654.
• Pachauri,R.K.,M.R.Allen,V.R.Barros,JBroome,WCramer,RChrist,J.A.Church,LClarke,QDahe,PDasgupta,andN.K. Dubash. 2014. “Climate change 2014: synthesis report.” Contribution of Working Groups I, II and III to the fifth assessment report of the Intergovernmental Panel on Climate Change (p. 151). IPCC.
• Pandey,Rishikesh,andDouglasK.Bardsley.2015.“Social-ecologicalvulnerability toclimatechange in theNepaliHimalaya.” Applied Geography 64:74-86.
• Purohit,M.andSKaur.2016.“RainfallStatisticsofIndia.”IndiaMeteorologicalDepartment,MinistryofEarthSciences.• Ravindranath,N.H., SandhyaRao,NitashaSharma,MaliniNair, RanjithGopalakrishnan,AnanyaS. Rao, Sumedha
Malaviya, et al. 2011. “Climate change vulnerability profiles for North East India.” Current Science 101 (3):384-94.• RuralWork Department. 2015. “Annual Rainfall in the Districts Headquaters of Arunachal Pradesh.” In. Itanagar:
Directorate of Economics and Statistics, Government of Arunachal Pradesh.• Sapkota,Prativa,RodneyJ.Keenan,Jana-AxinjaPaschen,andHemantR.Ojha.2016.“Socialproductionofvulnerability
to climate change in the rural middle hills of Nepal.” Journal of Rural Studies 48 (Supplement C):53-64.• Saxena,K.G.,R.K.Maikhuri,andK.S.Rao.2005.“Changesinagriculturalbiodiversity: Implicationsforsustainable
livelihood in the Himalaya.” Journal of mountain science 2(1):23.• Sharma,E,NChettri,KTse-ring,A.B.Shrestha,FJing,PMool,andMEriksson.2009.“ClimateChangeImpactsand
Vulnerability in the Eastern Himalayas.” International Centre for Integrated Mountain Development (ICIMOD).• Sharma,J,I.K.Murthy,TEsteves,PNegi,SSushma,SDasgupta,ABarua,GBala,andN.HRavindranath.2018.“Climate
Vulnerability and Risk Assessment: Framework, Methods and Guidelines for the Indian Himalayan Region.” National Mission for Sustaining the Himalayan Ecosystem and Swiss Agency for Development and Cooperation.
• Sharma, Rita, Jianchu Xu, and G. Sharma., 2007.“Traditional agroforestry in the eastern Himalayan region: Landmanagement system supporting ecosystem services.” Tropical Ecology 48(2): 89.
• Shrestha,ArunB.,CameronP.Wake,PaulA.Mayewski,andJackE.Dibb.1999.“MaximumTemperatureTrendsintheHimalaya and Its Vicinity: An Analysis Based on Temperature Records from Nepal for the Period 1971–94.” Journal of Climate 12 (9):2775-86. doi: 10.1175/1520-0442(1999)012<2775:mttith>2.0.co;2.
• Singh,M,BSingh,andSDey.2002.“FloraofMizoram,Vol-I.”Dehradun:ShivaOffsetPress.• Singh,S.P.,MSanwal,V.P.Dimri,andS.K.Dubey.2018.“TheclimatechangeprogrammeoftheDepartmentofScience
and Technology”. Current Science, 115(1):22.• Sinha,G,DSingh,andKSingh.2012.“FloraofMizoram:Vol.II:Campanulaceae-Salicaceae.”BotanicalSurveyofIndia.• Smit,B,andJWandel.2006.“Adaptation,adaptivecapacityandvulnerability.”GlobalEnvironmentalChange16:282-
92. doi: 10.1016/j.gloenvcha.2006.03.008.• Socio-EconomicProfileofJammu&Kashmir,2008.DirectorateofEconomics&Statistics,GovernmentofJammu&
Kashmir• SpaceApplicationscentreIndianSpaceResearchOrganisation.2010.“NationalWetlandAtlas:Sikkim.”Government
of India• Tse-ring,K,ESharma,NChettri,andA.B.Shrestha.2010.“Climatechangevulnerabilityofmountainecosystemsinthe
Eastern Himalayas.” International centre for integrated mountain development (ICIMOD).• UNFCCC. 2007.“Impacts,Vulnerabilities, andAdaptation inDevelopingCountries.” In, 68. Bonn,Germany:United
Nations Framework Convention on Climate Change.• Verma,R.2013.“CommercializationofAgricultureinArunachalPradesh.”InYojanaNewDlehi:Yojana• Wulf, Hendrik, B Bookhagen, andD Scherler. 2010.“Seasonal precipitation gradients and their impact on fluvial
sediment flux in the Northwest Himalaya.” Geomorphology 118(1-2):13-21.

92
APPENDIXTable 1: List of indicators and sub-indicators for Tier 1 vulnerability assessment relevant to IHR states of India, rationale for selection, functional relationship with vulnerability and sources of data
Indicators Sub-indicators
Rationale for selection Functional relationwith Vulnerability
Source of data
Socio-economic, demographic status and health
Population density (Total population of a state divided by the total geographical area)
Population density determines the extent of dependency and per capita availability of finite resources. High density could lead to degradation of resources, further increasing sensitivity. Further, higher the population density, higher the exposure of community to climatic hazards.
Positive Calculated using Geographic Area and population data from Census of India (2011)
Percentage of marginal farmers
Marginal farmers (land holding <1 ha) are known to have low social and economic capital and thus are inherently more sensitive and have lower adaptive capacities.
Positive Agriculture Census - State Tables (2010-11) accessed at, http://agcensus.dacnet.nic.in/DatabaseHome.aspx
Livestock to human ratio (Total livestock population in a state divided by the total population of that state)
Livestock provides an alternate source of income and assists in crop production, also sale of livestock during distress provides households with a coping strategy in the context of climatic hazards.
Negative Estimated using Census of India (2011) and 19th Livestock Census (2012)
Per Capita Income (2014-15) at current prices as on 31.03.2017
A direct indicator representing the inherent sensitivity of people in a region. Higher per capita income provides higher capacity to cope with any damage or loss arising out of climatic hazard.
Negative Press Information Bureau, GoI, Ministry of Statistics &Programme Implementation1
Number of Primary Health Centres per 100,000 Households (2017)
Access to primary healthcare centres is pivotal for the wellbeing of households. An indication of adaptive capacity.
Negative NITI Aayog,http://niti.gov.in
Percentage of women in the overall workforce
Women are known to be more sensitive to climate risks. Regions with a greater number of women in gainful employment would signify gender equality, enhanced purchasing power and independency, thus lower vulnerability due to reduced sensitivity of women in these regions.
Negative Census of India (2011)
1 Estimates for the State of West Bengal are at base year 2004-05, the remaining states are for 2014-15 at current prices, as on 31.03.2017. Data for the same can be accessed at http://pib.nic.in/newsite/PrintRelease.aspx?relid=169546

Climate Vulnerability Assessment for the Indian Himalayan Region Using a Common Framework
93
Sensitivity of agricultural production
Percentage area irrigated (2010-11)
Crop production with irrigation is less sensitive to delayed rainfall or droughts.
Negative Table 6.7: Percentage of net irrigated area to net sown area of All Social Groups, 2005-06 and 2010-11, All India Report on Agriculture Census 2010-11
Yield variability of food grains (2005-2015) - Coefficient of variation calculated for 10 year food grain yield data
A stable food production system with little to no variation in yield is inherently resilient to climate shocks and. Thus, has high adaptive capacity.
Positive Calculated using Table 4.1.4: Total food grains - State-wise yield, Agricultural Statistics at a Glance 2016
Percentage area under Horticulture Crops (2016)
Fruit trees are hardier than field crops when sensitivity to climate shocks is considered. A larger area under horticulture tree crops providing an alternative source of farm-based income reduces sensitivity to climate variability and increases adaptive capacity.
Negative Computed using Horticultural Statistics at a Glance 2017 and geographical area of states.
Forest Dependent Livelihoods
Percentage area under open forest
Large tracts of open forests indicate a higher level of forest disturbance and degradation. Forest is a major source of livelihood in the Himalayan states. Forests provide vital environmental services and thus degradation of forests indicate higher sensitivity.
Positive State of Forest Report 2017 – Forest Cover
Percentage area under forests per thousand rural household (2017)
Availability of alternate livelihood options through extraction of fodder, fuelwood, and non-timber forest products (NTFPs) from forests.
Negative State of Forest Report 2017 – Forest Cover
Access to information services and infrastructure
Percentage crop area insured under all Insurance Schemes (2015-16)
Crop insurance helps farming households mitigate losses due to climate risks, thereby enhancing their adaptive capacity.
Negative Table 14.16(a): State-wise crop area insured under all Insurance Schemes, Agricultural Statistics at a Glance 2016
Percentage farmers taking crop loans (2015-16)
Farmers with access to crop loans can invest in essential agronomic practices to lower yield variability, thus enhancing resilience of cropping systems.
Negative Table 14.9(b): State-wise Agriculture Loan disbursed during 2015-16, Agricultural Statistics at a Glance 2016

94
Average person days per Household under MGNREGA (2006-2016)
Non-climate sensitive wage labour under MGNREGA provides households with income security, especially during the years of droughts and floods.
Negative Calculated using DMU report – MGNREGA Website
Percentage area with >30% slope
Areas with high slope can be inaccessible, highly unstable and be prone to landslides. This sub-indicator is a hazard-specific indicator that determines the sensitivity of a region, hampering access to information services and infrastructure.
Positive Computed using GIS tools and NRSC Data at a district level and averaged for states.
Road Density (surfaced roads in km divided by total geographic area in sq. km)
Direct indicator representing accessibility, which is essential in regions that are exposed to climate and disaster risks.
Negative Total and Surfaced Road Length - State-wise Table- 21.1(B), accessed at, http://www.mospi.gov.in/statistical-year-book-india/2017/190
Table 2: Sub-indicator values for the indicator socio-economic, demographic status and health
State Socio-economic, demographic status and health
Population density (2011)
person/sq. km
Percentage of marginal
farmers (2011-12)
Livestock to human ratio
(2017-18)
Per Capita Income (2014-
15)
Number of Primary
Health Centres per 100,000 households
(2017-18)
Percentage of women in the overall workforce
(2011)
AV NV AV NV AV NV AV NV AV NV AV NV
Arunachal Pradesh
17 0.00 18 0.175 1 1.000 103633 0.676 53 0.000 40 0.165
Assam 398 0.67 67 0.772 2 0.790 54618 0.986 16 0.765 29 0.734
Himachal Pradesh
123 0.19 70 0.801 1 0.860 124500 0.544 36 0.343 43 0.059
Jammu & Kashmir
56 0.07 83 0.964 1 0.877 62857 0.934 30 0.471 26 0.857
Manipur 128 0.19 51 0.573 4 0.000 52436 1.000 15 0.778 43 0.024
Meghalaya 132 0.20 49 0.549 2 0.828 68202 0.900 20 0.682 41 0.153
Mizoram 52 0.06 55 0.617 4 0.188 85659 0.790 26 0.564 40 0.172
Nagaland 119 0.18 4 0.000 2 0.619 78526 0.835 32 0.435 44 0.000
Sikkim 86 0.12 54 0.607 2 0.643 210394 0.000 19 0.708 37 0.333
Tripura 350 0.58 86 1.000 2 0.706 71666 0.878 11 0.868 29 0.723
Uttarakhand 189 0.30 74 0.847 2 0.640 134784 0.479 12 0.834 34 0.470
West Bengal*
589 1.00 82 0.950 3 0.351 78903 0.832 4 1.000 23 1.000
* The population density was considered only for Darjeeling and Kalimpong districts of West Bengal

Climate Vulnerability Assessment for the Indian Himalayan Region Using a Common Framework
95
Table 3: Sub-indicator values and normalised scores for the indicator sensitivity of agricultural production
Table 4: Sub-indicator values and normalised scores for the indicator forest dependent livelihoods
State Agri-based livelihoods
% Area Irrigated (2010-11)
Yield Variability of Food Grains (2005-2015)
% Area Under Horticulture Crops (2016)
AV NV AV NV AV NV
Arunachal Pradesh 26.8 0.65 18 0.37 1 1.00
Assam 5.5 1.00 15 0.29 9 0.60
Himachal Pradesh 19.9 0.77 11 0.14 6 0.76
Jammu & Kashmir 45.8 0.35 13 0.20 2 0.96
Manipur 18.8 0.79 14 0.26 5 0.81
Meghalaya 23.4 0.71 16 0.32 6 0.75
Mizoram 10.0 0.93 38 1.00 6 0.73
Nagaland 22.6 0.72 16 0.30 6 0.74
Sikkim 22.3 0.73 13 0.20 11 0.52
Tripura 24.0 0.70 6 0.00 14 0.36
Uttarakhand 47.5 0.32 8 0.06 5 0.79
West Bengal 67.1 0.00 11 0.15 21 0.00
AV = Actual value and NV = Normalised value
State Forest dependent livelihoods
Percentage area under open forest
Area under forest/1,000 rural households
AV NV AV NV
Arunachal Pradesh 23 0.049 334 0.000
Assam 54 0.715 5 1.000
Himachal Pradesh 35 0.310 12 0.981
Jammu & Kashmir 46 0.537 15 0.970
Manipur 57 0.789 45 0.879
Meghalaya 43 0.474 40 0.895
Mizoram 67 1.000 172 0.494
Nagaland 53 0.698 45 0.879
Sikkim 21 0.000 36 0.907
Tripura 24 0.065 13 0.978
Uttarakhand 27 0.128 17 0.964
West Bengal 58 0.797 7 0.995

96
Table 5: Sub-indicator values and normalised scores for the indicator – Access to Information Services and Infrastructure
Table 6: Weights assigned to the four main indicators and their respective sub-indicators and the final weights to be multiplied with the normalised scores
State Access to information services and infrastructure
Percentage crop area insured
under all Insurance Schemes (2013-15)
Percentage farmers taking loans (2015-16)
Average person days
per household under
MGNREGA (2006-2016)
Average Percentage area with >30%
slope
Road Density
AV NV AV NV AV NV AV NV AV NV
Arunachal Pradesh
0 1.00 1 0.98 25 1.00 70.5 0.99 0.18 0.95
Assam 1 0.97 0 1.00 30 0.87 3.7 0.02 0.76 0.61
Himachal Pradesh
6 0.77 6 0.77 43 0.57 26.4 0.35 0.72 0.64
Jammu & Kashmir
0 1.00 6 0.79 34 0.78 24.6 0.32 0.10 1.00
Manipur 4 0.83 1 0.96 45 0.53 3.9 0.02 0.60 0.71
Meghalaya 0 0.99 3 0.89 41 0.63 9.5 0.10 0.40 0.82
Mizoram 0 1.00 2 0.94 52 0.36 71.4 1.00 0.35 0.86
Nagaland 0 1.00 1 0.96 45 0.52 52.7 0.73 1.08 0.43
Sikkim 0 1.00 3 0.91 55 0.30 21.1 0.27 0.82 0.58
Tripura 0 0.99 14 0.47 68 0.00 2.5 0.00 1.82 0.00
Uttarakhand 26 0.00 18 0.34 35 0.76 23.3 0.30 0.63 0.69
West Bengal 9 0.64 27 0.00 29 0.89 17.9 0.22 1.24 0.33AV = Actual value and NV = Normalised value
Indicator Indicator Weights (WI)
Sub-indicators Sub- indicator Weights (Wi)
Weights to be multiplied with normalisedscores (WI*Wi)
Socio-economic, demographic status and health
0.345 Population density 0.17 (0.35*0.17) = 0.06
Percentage marginal farmers 0.15 (0.35*0.15) = 0.05
Livestock to human ratio 0.09 (0.35*0.09) = 0.03
Per Capita Income 0.26 (0.35*0.26) = 0.09
Number of Primary Health Centres per 100,000 HH
0.18 (0.35*0.18) = 0.06
Percentage of women in overall workforce
0.15 (0.35*0.15) = 0.05
Total 1.00
Sensitivity of agricultural production
0.271 Percentage area irrigated 0.38 (0.27*0.38) = 0.10
Yield variability of food grains
0.42 (0.27*0.42) = 0.11
Percentage area under horticulture crops
0.20 (0.27*0.20) = 0.05
Total 1.00

Climate Vulnerability Assessment for the Indian Himalayan Region Using a Common Framework
97
Forest dependent livelihoods
0.194 Percentage area under open forests
0.58 (0.19*0.58) = 0.11
Area under forests/1,000 rural households
0.42 (0.19*0.42) = 0.08
Total 1.00
Access to information services and infrastructure
0.19 Percentage crop area insured under all Insurance Schemes
0.20 (0.19*0.20) = 0.04
Percentage farmers taking loans
0.14 (0.19*0.14) = 0.03
Average person days per household under MGNREGA
0.24 (0.19*0.24) = 0.05
Average percentage area with >30% slope
0.34 (0.19*0.34) = 0.06
Road density 0.08 (0.19*0.08) = 0.02
Total 1.00 Total 1.00 1.00
Table 7: Vulnerability index values of the four indicators, composite vulnerability index valuesand corresponding ranks of IHR states

98
Arunachal Pradesh
Table 8: District-wise percentage of forest cover, area not available for cultivation, cultivable land, net area sown and cropping intensity
Table 9: Social profiles of the districts of Arunachal Pradesh
District Geographical area
Forests, 2017 Area not available for cultivation,
2010-11
Cultivable land,
2010-11
Net area sown, 2010-11
Cropping intensity
(%)Area % Area %
Tawang 217.2 117.7 54.19 214.02 3.19 3.19 1.47 60.27
West Kameng 742.2 1,027.8 88.94 736.14 6.06 6.06 0.82 72.99
East Kameng 413.4 407.51 5.89 5.89 1.43 81.63
Papum Pare 346.2 319.1 92.17 332.52 13.68 13.68 3.95 73.27
Lower Subansiri 350.8 838.2 87.97 340.35 10.45 10.45 2.98 61.69
KurungKumey 604.0 592.03 11.97 11.97 1.98 89.98
Upper Subansiri 703.2 557.1 79.22 687.63 15.57 15.57 2.21 61.53
West Siang 832.5 735.6 88.36 810.21 22.30 22.30 2.68 77.66
East Siang 360.3 288.0 79.93 338.76 21.54 21.54 5.98 78.56
Upper Siang 659.0 536.9 81.47 649.57 9.44 9.44 1.43 77.83
Dibang Valley 912.9 923.2 70.86 909.99 2.91 2.91 0.32 86.83
Lower Dibang Valley 390.0 386.57 3.43 3.43 0.88 76.83
Lohit 521.2 760.1 66.66 508.91 12.29 12.29 2.36 81.63
Anjaw 619.0 399.2 85.63 615.08 3.92 3.92 0.63 82.98
Changlang 466.2 438.83 27.37 27.37 5.87 86.72
Tirap 236.2 193.5 81.92 220.97 15.23 15.23 6.45 80.63
District Population (2011) Sex Ratio2(2011)
% Population BPL (2011)
Number of doctors per 1,000 population (2015)
Tawang 49,997 714 64 0.06
West Kameng 83,947 836 65 0.08
East Kameng 78,690 1029 66 0.06
Papum Pare 176,573 980 68 0.05
Lower Subansiri 83,030 984 66 0.07
KurungKumey 92,076 1031 71 0.09
Upper Subansiri 83,448 998 65 0.07
West Siang 112,274 930 67 0.09
East Siang 99,214 978 66 0.05
Upper Siang 35,320 889 68 0.06
Dibang Valley 8,004 813 64 0.12
Lower Dibang Valley 54,080 928 65 0.07
Lohit 54,080 912 63 0.04
Anjaw 21,167 839 63 0.19
Changlang 148,226 926 66 0.05
Tirap 111,975 944 65 0.05
2 Sex ratio: Females per ‘000 males

Climate Vulnerability Assessment for the Indian Himalayan Region Using a Common Framework
99
Tabl
e 10
: The
val
ues
give
n to
the
indi
cato
rs a
nd th
e no
rmal
ised
scor
es fo
r the
indi
cato
rs
Dis
tric
tFo
rest
cov
er (%
ar
ea) (
-ve)
Yiel
d va
riab
ility
(+
ve)
Fem
ale
liter
acy
rate
(-
ve)
Slop
e (+
ve)
% B
PL H
H
(+ve
)D
octo
rs/1
000
HH
Popu
lati
on
Den
sity
(+ve
)M
GN
REG
A(-
ve)
2015
-16
AVN
VAV
NV
AVN
VAV
NV
AVN
VAV
NV
AVN
VAV
NV
Taw
ang
54.1
91.
000
5.73
046
.23
0.88
80.6
30.
8464
0.
085
0.06
0.87
223
0.44
29.3
00.
55
Wes
t Kam
eng
88.9
40.
085
6.09
0.01
59.0
50.
4779
.42
0.81
65
0.26
20.
080.
714
110.
223
.84
0.68
East
Kam
eng
88.9
40.
085
16.5
20.
3951
.69
0.71
73.2
60.
7066
0.
395
0.06
0.84
919
0.36
12.2
40.
97
Papu
m P
are
92.1
70.
000
15.4
30.
3573
.72
0.00
60.6
0.45
68
0.66
00.
050.
972
511
16.6
30.
86
Low
er S
uban
siri
87.7
90.
115
33.4
91.
0068
.08
0.18
66.4
60.
5766
0.
364
0.07
0.79
024
0.46
17.0
10.
85
Kuru
ng K
umey
87.7
90.
115
11.7
40.
2242
.64
1.00
84.3
90.
9171
1.00
00.
090.
691
150.
2817
.51
0.84
Upp
er S
uban
siri
79.2
20.
341
20.7
30.
5457
.59
0.52
83.5
0.89
65
0.28
90.
070.
792
120.
2229
.15
0.55
Wes
t Sia
ng88
.36
0.10
07.
070.
0559
.63
0.45
76.4
50.
7667
0.
471
0.09
0.67
613
0.24
13.7
70.
93
East
Sia
ng79
.93
0.32
26.
050.
0166
.49
0.23
50.1
40.
2566
0.
394
0.05
0.93
828
0.54
10.8
81.
00
Upp
er S
iang
81.4
70.
282
6.83
0.04
52.6
30.
6887
.35
0.97
68
0.68
50.
060.
895
50.
0815
.92
0.88
Dib
ang
Valle
y70
.86
0.56
19.
770.
1559
.16
0.47
85.2
0.92
64
0.12
20.
120.
433
10
15.7
40.
88
Low
er D
iban
g Va
lley
70.8
60.
561
12.9
80.
2662
.19
0.37
63.4
30.
5165
0.
298
0.07
0.77
814
0.26
13.9
30.
93
Lohi
t66
.66
0.67
29.
180.
1260
.04
0.44
36.8
0.00
630.
021
0.04
1.00
028
0.54
51.9
40.
00
Anj
aw66
.66
0.67
214
.00
0.30
43.7
10.
9789
.18
1.00
630.
000
0.19
0.00
03
0.04
27.3
80.
60
Chan
glan
g85
.63
0.17
210
.51
0.17
49.8
30.
7752
.13
0.29
66
0.34
10.
050.
913
320.
6231
.58
0.50
Tira
p81
.92
0.27
022
.44
0.60
41.8
91.
0258
.74
0.42
65
0.32
20.
050.
916
470.
9214
.75
0.91

100
Table 11: The weights assigned based on the relative importance of each indicator
Table 12: Vulnerability index values and corresponding ranks of districts in the state
Sl. No. Indicator Weight assigned (WI) Normalisedscores Weights to be multiplied with normalised scores (WI*Wi)
1 Forests 30 0.33 10.04
2 Yield variability 20 0.26 5.27
3 Female literacy rate 15 0.57 8.60
4 Slope 10 0.64 6.43
5 BPL 12 0.36 4.28
6 Doctors 8 0.76 6.11
7 Population density 3 0.39 1.16
8 MGNREGA 2 0.75 1.49
Total 100
District Vulnerability index value Obtained vulnerability rank
Tawang 0.62 1
Tirap 0.55 2
Anjaw 0.52 3
KurungKumey 0.52 4
Upper Subansiri 0.49 5
Upper Siang 0.46 6
Lower Subansiri 0.46 7
Lower Dibang Valley 0.45 8
Dibang Valley 0.43 9
East Kameng 0.42 10
Lohit 0.39 11
Changlang 0.37 12
Papum Pare 0.32 13
West Siang 0.32 14
East Siang 0.32 15
West Kameng 0.29 16

Climate Vulnerability Assessment for the Indian Himalayan Region Using a Common Framework
101
Tabl
e 13
: M
ajor
driv
ers
of v
ulne
rabi
lity
Dis
tric
tVu
l-ne
ra-
bilit
y ra
nk-
ing
Fore
st(%
of
area
un
der
fore
st
cov-
er in
sq
.km
)
Yiel
d va
ri-
abili
ty(p
rodu
c-ti
on (m
t/ha
))
Fem
ale
liter
acy
rate
( %)
Slop
e(%
of a
rea
> 30
o Sl
ope
(sq.
km)
BPL
(%
)D
octo
rs(N
o. o
f D
oc-
tors
/100
0 H
H, 2
015)
Popu
lati
on
dens
ity
(no.
of p
er-
son
per s
q.
km)
MG
NRE
GA
(A
vera
geem
ploy
-m
ent p
erso
n/
day/
HH
, 200
8-09
to
201
5-16
)
Dri
vers
of v
ulne
rabi
lity
Taw
ang
154
.19
5.72
46.2
380
.63
640.
0623
29.3
0Lo
w fo
rest
cov
er, l
ow y
ield
var
iabi
lity,
lo
w fe
mal
e lit
erac
y, h
ighe
r per
cent
age
of a
reas
gre
ater
than
30%
slo
pe, h
igh
perc
enta
ge o
f BPL
HH
, low
doc
tors
per
1,
000
pers
ons
Tira
p2
81.9
222
.43
41.8
958
.74
650.
0547
14.7
5Lo
w fe
mal
e lit
erac
y ra
te, h
igh
% o
f BPL
H
H, l
ow d
octo
rs p
er 1
,000
per
sons
, low
w
orkd
ays
unde
r MG
NRE
GA
Anj
aw3
66.6
614
.00
43.7
189
.18
630.
193
27.3
8Lo
w fo
rest
cov
er, l
ow fe
mal
e lit
erac
y,
high
er p
erce
ntag
e of
are
as g
reat
er th
an
30%
slo
pe, h
igh
perc
enta
ge o
f BPL
HH
Kuru
ng
Kum
ey4
87.7
911
.73
42.6
484
.39
710.
0915
17.5
1Lo
w fe
mal
e lit
erac
y, h
igh
perc
enta
ge
of a
reas
gre
ater
than
30%
slo
pe, h
igh
perc
enta
ge o
f BPL
HH
, low
doc
tors
per
1,
000
pers
ons,
low
wor
kday
s un
der
MG
NRE
GA
Upp
er
Suba
nsiri
579
.22
20.7
357
.59
83.5
650.
0712
29.1
5H
igh
perc
enta
ge o
f are
as g
reat
er th
an
30%
slo
pe, h
igh
perc
enta
ge o
f BPL
HH
, lo
w d
octo
rs p
er 1
,000
per
sons
Upp
er
Sian
g6
81.4
76.
8252
.63
87.3
568
0.06
515
.92
Low
yie
ld v
aria
bilit
y, h
igh
perc
enta
ge
of a
reas
gre
ater
than
30%
slo
pe, h
igh
perc
enta
ge o
f BPL
HH
, low
doc
tors
per
1,
000
pers
ons,
low
wor
kday
s un
der
MG
NRE
GA

102
Low
er
Suba
nsiri
787
.79
33.4
868
.08
66.4
666
0.07
2417
.01
Hig
h pe
rcen
tage
of B
PL H
H, l
ow
doct
ors
per 1
,000
per
sons
, low
w
orkd
ays
unde
r MG
NRE
GA
Low
er
Dib
ang
Valle
y
870
.86
12.9
862
.19
63.4
365
0.07
1413
.93
Hig
h pe
rcen
tage
of B
PL H
H, l
ow
doct
ors
per 1
,000
per
sons
, low
w
orkd
ays
unde
r MG
NRE
GA
Dib
ang
Va
lley
970
.86
9.77
59.1
685
.264
0.12
115
.74
Low
yie
ld v
aria
bilit
y, h
igh
perc
enta
ge
of a
reas
gre
ater
than
30%
slo
pe, h
igh
perc
enta
ge o
f BPL
HH
, low
wor
kday
s un
der M
GN
REG
A
East
Ka
men
g10
88.9
416
.51
51.6
973
.26
660.
0619
12.2
4H
igh
perc
enta
ge o
f are
as g
reat
er th
an
30%
slo
pe, h
igh
perc
enta
ge o
f BPL
HH
, lo
w d
octo
rs p
er 1
,000
per
sons
, low
w
orkd
ays
unde
r MG
NRE
GA
Lohi
t11
66.6
69.
1760
.04
36.8
630.
0428
51.9
4Lo
w fo
rest
cov
er, l
ow y
ield
var
iabi
lity,
hi
gh p
erce
ntag
e of
BPL
HH
, low
doc
tors
pe
r 1,0
00 p
erso
ns
Chan
glan
g12
85.6
310
.51
49.8
352
.13
660.
0532
31.5
8Lo
w fe
mal
e lit
erac
y, h
igh
perc
enta
ge o
f BP
L H
H, l
ow d
octo
rs p
er 1
,000
per
sons
Papu
m
Pare
1392
.17
15.4
273
.72
60.6
680.
0551
16.6
3H
igh
perc
enta
ge o
f BPL
HH
, low
do
ctor
s pe
r 1,0
00 p
erso
ns, l
ow
wor
kday
s un
der M
GN
REG
A
Wes
t Sia
ng14
88.3
67.
0759
.63
76.4
567
0.09
1313
.77
Low
yie
ld v
aria
bilit
y, h
igh
perc
enta
ge
of a
reas
gre
ater
than
30%
slo
pe, h
igh
perc
enta
ge o
f BPL
HH
, low
doc
tors
per
1,
000
pers
ons,
low
wor
kday
s un
der
MG
NRE
GA
East
Sia
ng15
79.9
36.
8266
.49
50.1
466
0.05
2810
.88
Low
yie
ld v
aria
bilit
y,hi
gh p
erce
ntag
e of
BP
L H
H, l
ow d
octo
rs p
er 1
,000
per
sons
, lo
w w
orkd
ays
unde
r MG
NRE
GA
Wes
t Ka
men
g16
88.9
46.
0959
.05
79.4
265
0.08
1123
.84
Low
yie
ld v
aria
bilit
y, h
igh
perc
enta
ge o
f BP
L H
H, l
ow d
octo
rs p
er 1
,000
per
sons

Climate Vulnerability Assessment for the Indian Himalayan Region Using a Common Framework
103
Assam
Figure 1: Land use map of Assam

104
Tabl
e 14
: The
val
ues
give
n to
the
indi
cato
rs a
nd th
e no
rmal
ised
scor
es fo
r the
indi
cato
rs.
Indi
cato
r%
are
a un
der f
ores
t (S
tate
of F
ores
t Re
port
201
3)
% a
rea
wit
h >
30° s
lope
PCI (
2014
-15
)Yi
eld
vari
abili
ty
(foo
d cr
op)
Fem
ale
liter
acy
rate
(201
1)IM
R (a
s pe
r ce
nsus
201
1)Po
pula
tion
de
nsit
y (2
011)
(p
opul
atio
n/ k
m2)
Ave
rage
day
s of
em
ploy
men
t pe
r HH
und
er
MG
NRE
GA
AVN
VAV
NV
AVN
VAV
NV
AVN
VAV
NV
AVN
VAV
NV
Karb
iAng
long
76.2
90.
1412
.68
0.51
0.23
00.
6412
.08
0.01
620.
7359
0.56
920.
038
26.7
690.
60
Dim
a H
aso
87.3
60.
0025
.03
1.00
0.39
50.
1819
.12
0.24
71.3
30.
4356
0.47
440.
000
21.8
030.
77
Cach
ar59
.19
0.35
15.0
60.
600.
195
0.74
19.5
60.
2673
.68
0.36
540.
4145
90.
327
23.2
390.
72
Kokr
ajha
r35
.34
0.65
0.13
0.00
0.25
60.
5722
.01
0.34
58.2
70.
8474
1.00
269
0.17
744
.10.
00
Dhu
bri
14.7
20.
910.
560.
020.
102
1.00
22.9
00.
3653
.33
1.00
680.
8289
60.
671
25.2
50.
65
Goa
lpar
a18
.48
0.87
1.8
0.07
0.16
30.
8326
.28
0.47
63.1
30.
6956
0.47
553
0.40
121
.34
0.79
Barp
eta
12.1
70.
950.
010.
000.
137
0.90
27.1
90.
5058
.06
0.85
460.
1874
20.
550
28.3
730.
54
Mor
igao
n7.
811.
001.
440.
060.
164
0.83
24.8
90.
4364
.04
0.66
660.
7661
70.
452
30.8
560.
46
Nag
aon
20.7
30.
842.
220.
090.
130
0.92
13.2
70.
0568
.07
0.54
640.
7171
10.
526
25.5
230.
64
Soni
tpur
17.9
60.
870.
110.
000.
165
0.82
24.3
80.
4160
.73
0.77
650.
7437
00.
257
15.2
21.
00
Lakh
impu
r12
.87
0.94
0.08
0.00
0.17
70.
7942
.46
1.00
70.6
70.
4563
0.68
458
0.32
632
.153
0.41
Dhe
maj
i9.
020.
982
0.08
0.14
90.
8714
.75
0.10
65.2
10.
6340
0.00
212
0.13
232
.522
0.40
Tins
ukia
40.4
70.
590.
690.
030.
353
0.30
15.0
60.
1161
.73
0.74
510.
3235
00.
241
20.6
90.
81
Dib
ruga
rh22
.33
0.82
0.18
0.01
0.37
90.
2214
.86
0.10
68.9
90.
5152
0.35
392
0.27
418
.837
0.87
Sivs
agar
25.9
40.
770.
270.
010.
459
0.00
15.8
90.
1474
.71
0.33
560.
4743
10.
305
22.4
670.
75
Jorh
at21
.36
0.83
0.11
0.00
0.32
20.
3818
.59
0.23
76.4
50.
2755
0.44
383
0.26
718
.96
0.87
Gol
agha
t14
.99
0.91
0.13
0.00
0.23
30.
6311
.66
0.00
71.0
70.
4459
0.56
305
0.20
618
.379
0.89
Karim
ganj
47.7
60.
500.
960.
040.
195
0.74
17.1
90.
1872
.09
0.41
680.
8267
90.
500
19.5
120.
85
Hai
laka
ndi
59.4
60.
353.
490.
140.
189
0.76
11.9
90.
0167
.60.
5554
0.41
497
0.35
716
.283
0.96
Bong
aiga
on20
.76
0.84
3.35
0.13
0.26
40.
5530
.34
0.61
64.4
30.
6549
0.26
676
0.49
829
.635
0.50
Chira
ng35
.34
0.65
0.13
0.00
0.16
60.
8218
.51
0.22
56.6
50.
9061
0.62
251
0.16
334
.28
0.34
Kam
rup
32.8
90.
686.
740.
270.
273
0.52
13.5
40.
0669
.47
0.49
420.
0648
90.
351
26.4
340.
61
Kam
rup
(Met
ro)
32.8
90.
686.
740.
270.
412
0.13
14.0
70.
0885
.07
0.00
420.
0613
131.
000
16.0
50.
97
Nal
bari
12.4
90.
940.
090.
000.
216
0.68
19.9
50.
2772
.57
0.39
590.
5673
30.
543
24.5
670.
68
Baks
a12
.49
0.94
0.09
0.00
0.15
60.
8518
.42
0.22
61.2
70.
7552
0.35
387
0.27
032
.57
0.40
Dar
rang
13.4
40.
930.
120.
000.
193
0.75
21.5
40.
3258
.04
0.85
730.
9758
60.
427
25.5
50.
64
Uda
lgur
i13
.44
0.93
0.12
0.00
0.18
60.
7621
.63
0.32
58.0
50.
8573
0.97
413
0.29
126
.604
0.61

Climate Vulnerability Assessment for the Indian Himalayan Region Using a Common Framework
105
Table 15: The weights assigned based on the relative importance of each indicator
Table 16: Vulnerability index values and corresponding ranks of districts in the state
Indicator Weights (WI)
Per capita income 25
Crop yield variability 20
% of Area under forest 12
Average days of employment per HH under MGNREGA 11
Female literacy rate 10
IMR 9
% area with > 30° slope 8
Population density 5
Total 100
East Kameng 0.42
Lohit 0.39
Changlang 0.37
Papum Pare 0.32
West Siang 0.32
East Siang 0.32
West Kameng 0.29
District Vulnerability index Ranking
Dhubri 0.714 1
Lakhimpur 0.678 2
Sonitpur 0.659 3
Goalpara 0.630 4
Barpeta 0.628 5
Darrang 0.627 6
Morigaon 0.625 7
Udalguri 0.621 8
Nagaon 0.563 9
Bongaigaon 0.538 10
Baksa 0.533 11
Nalbari 0.528 12
Chirang 0.519 13
Karimganj 0.517 14
Cachar 0.496 15
Dhemaji 0.475 16
Kokrajhar 0.472 17
Golaghat 0.470 18
Hailakandi 0.460 19
Jorhat 0.417 20
KarbiAnglong 0.411 21
Kamrup 0.385 22
Tinsukia 0.373 23

106
Table 17: Land use pattern in sq. km
Table 18: District-wise net area irrigated by sources (sq. km)
District Geographical area
Forests Area not available for cultivation/ uncultivable land area
Cultivable wastelandarea
Net sown area
Cropping intensity
Area %
Bilaspur 1,167 375 32.13 56.9214 80.6327 291.87 51.29
Chamba 6,522 2443 37.46 645.9282 66.6708 416.43 61.44
Hamirpur 1,118 313 28.00 128.1537 152.3283 352.95 52.13
Kangra 5,739 2197 38.28 437.9897 268.939 1157.48 54.27
Kinnaur 6,401 623 9.73 432.612 43.228 83.10 78.06
Kullu 5,503 1987 36.11 33.2126 30.8177 384.85 64.58
Lahul&Spiti 13,841 193 1.39 242.7582 20.5631 33.96 96.56
Mandi 3,950 1761 44.58 144.105 72.4815 887.75 55.27
Shimla 5,131 2399 46.76 290.8342 141.6524 659.44 76.26
Sirmaur 2,825 1387 49.10 108.232 148.0995 403.07 53.29
Solan 1,936 866 44.73 230.4188 146.7594 377.46 60.44
Una 1,540 556 36.10 238.4956 247.6634 385.29 52.05
District Canals TanksArea
Wells Other sources Area Net area irrigated
Area Area
Bilaspur 1.5829 .0186 1.1304 29.2628 32.5228
Chamba 8.1252 0 0 35.2393 44.3003
Hamirpur .0671 .006 .0093 18.735 19.1306
Kangra 25.4382 .6558 42.2755 288.8091 357.2227
Kinnaur 5.7181 .1275 0 49.0896 54.9352
Kullu 2.5212 0 .20 18.0676 20.8588
Lahul&Spiti 0 2.2711 0 28.4853 30.8384
Mandi 10.8131 1.0608 2.9079 121.0139 135.8189
Shimla 2.8551 0 .1173 33.3136 37.4159
Sirmaur 3.8149 .002 6.5734 125.2685 135.7828
Solan 6.7124 1.9827 50.6381 66.9277 127.6238
Una 4.4141 2.226 68.003 37.4541 112.2718
Dibrugarh 0.368 24
Dima Haso 0.343 25
Kamrup (Metro) 0.314 26
Sivsagar 0.294 27
Himachal Pradesh

Climate Vulnerability Assessment for the Indian Himalayan Region Using a Common Framework
107
Table 19: Normal monsoon rainfall and percentage departure of rainfall in 2016 from the normal rainfall for the districts in Himachal Pradesh.
Table 20: Social profiles of the districts in the state
District Normal monsoon rainfall (in mm3) % Departures of monsoon rainfall in 2016
Bilaspur 877 38
Chamba 1406.4 -38
Hamirpur 1078.9 29
Kangra 1582.1 34
Kinnaur 264.2 -32
Kullu 519.7 49
Lahul&Spiti 458.2 -32
Mandi 1093.4 24
Shimla 633.9 27
Sirmaur 1324.6 0
Solan 1000.1 11
Una 862.7 59
District Population (2011) Sex Ratio (2011) IMR per 1,000(2011)
Bilaspur 381,956 981 56
Chamba 519,080 989 46
Hamirpur 454,768 1096 46
Kangra 1,510,075 1013 57
Kinnaur 84,121 950 47
Kullu 437,903 916 46
Lahul&Spiti 31,564 1012 43
Mandi 999,777 884 38
Shimla 814,010 977 45
Sirmaur 529,855 981 58
Solan 580,320 989 46
Una 521,173 1096 59
3 Normal rainfall is based on the rainfall recorded during the period from 1951 to 2000.

108
Table 21: List of indicators for Tier 1 vulnerability assessment relevant to districts, rationale for selection, functional relationship with vulnerability and sources of data
Sr. No. Indicator Rationale forselection
Adaptive capacity
or sensitivity
Functional relationship
with vulnerability
Source of data
1 % of area without
irrigation
More area without irrigation will make that area vulnerable to CC
Adaptive capacity
- 2011 Census
2 % of area under forests
Reduce CC vulnerability by decreasing CO2
Adaptive capacity
- FSI report
3 % of area under open forest
cover
Adaptive capacity
- FSI report
4 % of area with > 30degree
slope
More area having 30degree slope will increase CC vulnerability and need
special attention for any developmental plan under such areas
Sensitivity + SRTM DEM
5 % of area under fruit crops
Increased % of area under fruit crops reduce CC vulnerability.
Adaptive capacity
- Horticulture Dpt.
6 PCI (2014-15) @ Constant prices 2011-12[1-PCI]
It represents the economic status of society. Enhance adaptive capacity of
people to cope with CC.
Adaptive capacity
- Economics & Statistics
7 Overall literacy rate (2011)
Literacy rate enhances capacity to understand impacts of climate change
and its promptness to respond to its impacts.
Adaptive capacity
- 2011 Census
8 Population density (2011)
Put extra pressure on existing natural resources.
Sensitivity + 2011 Census
9 Female literacy rate (2011)
Literacy rate enhances capacity to understand impacts of climate change
and its promptness to respond to its impacts.
Adaptive capacity
- 2011 Census
10 Yield Variability of food grains
Climate change impacts crop yield trends.
Sensitivity + www.aps.dac.gov.in (2012-
2017) Ministry of Agriculture& Farmer Welfare
11 % of agricultural
labour
Indicator of livelihood dependency of communities.
Adaptive capacity
- 2011 Census
12 IMR Social health impacts Sensitivity + Department of Health 2011,
nhrscindia.org
13 Early warning system
Response to disaster and minimisingdisaster risks
Adaptive capacity
- SDM Report
14 Average days of employment
under MGNREGA
Livelihood dependency of community as social indicator.
Adaptive capacity
- Ministry of Rural Development,
GoI

Climate Vulnerability Assessment for the Indian Himalayan Region Using a Common Framework
109
Table 22: The values given to the indicators and the normalised scores for the indicators
District Indicators
% of area without irrigation
% of area under forests
% of area under open forest cover
% of area with > 30° slope
AV NV AV NV AV NV AV NV
Bilaspur 1.36 0.15 32.13 0.01 16.37 0.01 5.62 0.02
Chamba 0.59 0.06 37.46 0.01 10.46 0.02 53.57 0.16
Hamirpur 0.47 0.05 28.00 0.02 16.82 0.01 1.17 0.00
Kangra 0.06 0.00 38.28 0.01 10.89 0.02 16.82 0.05
Kinnaur 0.52 0.05 9.73 0.03 4.34 0.03 51.36 0.15
Kullu 0.31 0.03 36.11 0.01 10.21 0.02 48.17 0.14
Lahul&Spiti 0.06 0.00 1.39 0.04 1.06 0.03 42.68 0.13
Mandi 0.27 0.02 44.58 0.00 16.99 0.01 27.23 0.08
Shimla 0.50 0.05 46.76 0.00 12.16 0.02 38.27 0.11
Sirmaur 0.35 0.03 49.10 0.00 24.35 0.00 21.18 0.06
Solan 1.67 0.19 44.73 0.00 20.35 0.01 9.84 0.03
Una 0.43 0.04 36.10 0.01 15.19 0.01 0.50 0.00
District Indicators
% of area under fruit crops
PCI (2014-15) @ constant prices 2011-
12 [1-PCI]
Overall literacy rate (2011)
Population density (2011)
AV NV AV NV AV NV AV NV
Bilaspur 3.17 0.03 125,958 0.03 75.30 0.01 327.30 0.11
Chamba 7.95 0.02 98,006 0.04 62.39 0.04 79.59 0.03
Hamirpur 3.12 0.03 102,217 0.04 78.74 0.00 406.77 0.14
Kangra 17.50 0.00 86,637 0.04 76.33 0.01 263.13 0.09
Kinnaur 5.56 0.02 217,993 0.02 72.16 0.02 13.14 0.00
Kullu 13.56 0.01 119,231 0.04 70.26 0.02 79.58 0.03
Lahul&Spiti 0.74 0.03 192,292 0.03 69.21 0.02 2.28 0.00
Mandi 16.22 0.01 96,052 0.04 72.39 0.02 253.11 0.09
Shimla 20.08 0.00 152,230 0.03 75.26 0.01 158.65 0.05
Sirmaur 6.65 0.02 145,597 0.03 68.44 0.03 187.56 0.06
Solan 2.91 0.03 394,102 0.00 73.85 0.01 299.75 0.10
Una 2.54 0.03 100,295 0.04 76.70 0.01 338.42 0.12
District Indicators
Female literacy rate (2011)
Yield variability of food grains
% of agricultural labour
IMR
AV NV AV NV AV NV AV NV
Bilaspur 69.78 0.01 12.04 0.02 2.36 0.02 56.00 0.08
Chamba 53.45 0.04 18.57 0.07 5.25 0.02 46.00 0.03
Hamirpur 74.69 0.00 11.37 0.01 5.04 0.02 46.00 0.03
Kangra 71.92 0.01 16.02 0.05 31.34 0.00 57.00 0.08
Kinnaur 63.38 0.02 9.69 0.00 1.45 0.02 47.00 0.04

110
Table 23: Weights assigned based on the relative importance of each indicator
Table 24: Vulnerability index values and corresponding ranks of districts in the state
Indicator Weights (WI)
% of area without irrigation 19
% of area under forests 4
% of area under open forest cover 3
% of area with > 30°slope 16
% of area under fruit crops 3
PCI(2014-15)@constantprices2011-12[1-PCI] 4
Overall literacy rate (2011) 4
Population density (2011) 14
Female literacy rate (2011) 4
Yield Variability of food grains 13
% of agricultural labour 2
IMR 9
Early warning system 2
Average days of employment under MGNREGA 3
Total 100
District Vulnerability index Rank
Chamba 0.54 1
Bilaspur 0.50 2
Solan 0.45 3
Mandi 0.43 4
Kinnaur 0.41 5
Kullu 0.40 6
Lahul&Spiti 0.39 7
Sirmaur 0.39 8
Shimla 0.39 9
Una 0.37 10
Kangra 0.35 11
Hamirpur 0.35 12
Kullu 62.66 0.02 13.66 0.03 7.07 0.02 46.00 0.03
Lahul&Spiti 59.75 0.03 15.33 0.05 0.33 0.02 43.00 0.02
Mandi 65.79 0.02 25.79 0.13 9.04 0.01 38.00 0.00
Shimla 69.36 0.01 17.20 0.06 14.92 0.01 45.00 0.03
Sirmaur 61.93 0.02 13.00 0.03 6.13 0.02 58.00 0.09
Solan 67.83 0.01 12.04 0.02 5.87 0.02 46.00 0.03
Una 72.41 0.00 10.79 0.01 11.20 0.01 59.00 0.09

Climate Vulnerability Assessment for the Indian Himalayan Region Using a Common Framework
111
Jammu & KashmirTable 25: Land use pattern in sq.km
Table 26: District-wise net area irrigated by sources in sq. km
District Geographical area
Forests Area not available for cultivation
Cultivable land
Net area sown Cropping intensityArea % Area %
Anantnag 3,574 1387 34.81 2871 703 466.1 13.04 150.83
Kulgam 410 3.05 406.95 292.5 71.34 139.13
Pulwama 1,086 498 35.62 505.63 580.37 346.58 31.91 167.46
Shopian 312 154.02 157.98 142.51 45.68 110.86
Srinagar 1,979 586 26.3 1896.7 82.3 59.41 3 138.53
Ganderbal 259 55.05 203.95 152.28 58.8 133.93
Budgam 1,361 312 22.76 819.61 541.39 418.16 30.72 129.47
Baramulla 4,243 1157 25.22 3586.95 656.05 645.43 15.21 101.65
Bandipora 345 66.79 278.21 242.17 70.19 114.88
Kupwara 2,379 1150 48.34 1922.62 456.38 456.38 19.18 100
Leh 45,110 92 0.2 45004.6 105.4 99.63 0.22 105.79
Kargil 14,036 46 0.33 13924.22 111.78 100.28 0.71 111.47
Jammu 2,342 896 28.93 379.59 1962.41 1067.98 45.6 183.75
Samba 904 256.82 647.18 326.45 36.11 198.25
Udhampur 2,637 2736 60.13 1709.35 927.65 488.85 18.54 189.76
Reasi 1,719 1354.36 364.64 209.37 12.18 174.16
Kathua 2,502 1374 51.83 1331.92 1170.08 587.97 23.5 199
Doda 8,912 3819 32.67 8413.83 498.17 298.48 3.35 166.9
Kishtwar 1,644 1443.73 200.27 160.44 9.76 124.83
Ramban 1,329 1075.04 253.96 199.61 15.02 127.23
Rajouri 2,630 1244 47.3 1614.57 1015.43 536.32 20.39 189.33
Poonch 1,674 715 42.71 1226.72 447.28 273.36 16.33 163.62
District Canals Tanks Wells Other sources
Net area irrigated
Tube-wells Other wells Area %
Anantnag 19,048 1206 2010 15101 2564 293.48 8.21
Kulgam 11,749 217 640 5804 1937 190.36 46.43
Pulwama 8,108 430 3413 11612 929 240.71 22.16
Shopian 5,395 146 778 3693 967 81.56 26.14
Srinagar 669 64 692 1280 317 43.88 2.22
Ganderbal 3,097 540 569 3028 497 1187.66 458.56
Budgam 13,064 136 2321 9343 1052 292.98 21.53
Baramulla 14,344 1167 1556 12411 2618 298.06 7.02
Bandipora 11,725 1244 839 6013 3000 141.6 41.04
Kupwara 24,776 1607 2066 21392 6597 219.51 9.23
Leh 6,115 55 135 6653 1565 99.63 0.22
Kargil 2,641 197 19 3679 907 100.28 0.71
Jammu 671 1681 8076 119215 3680 107.02 4.57
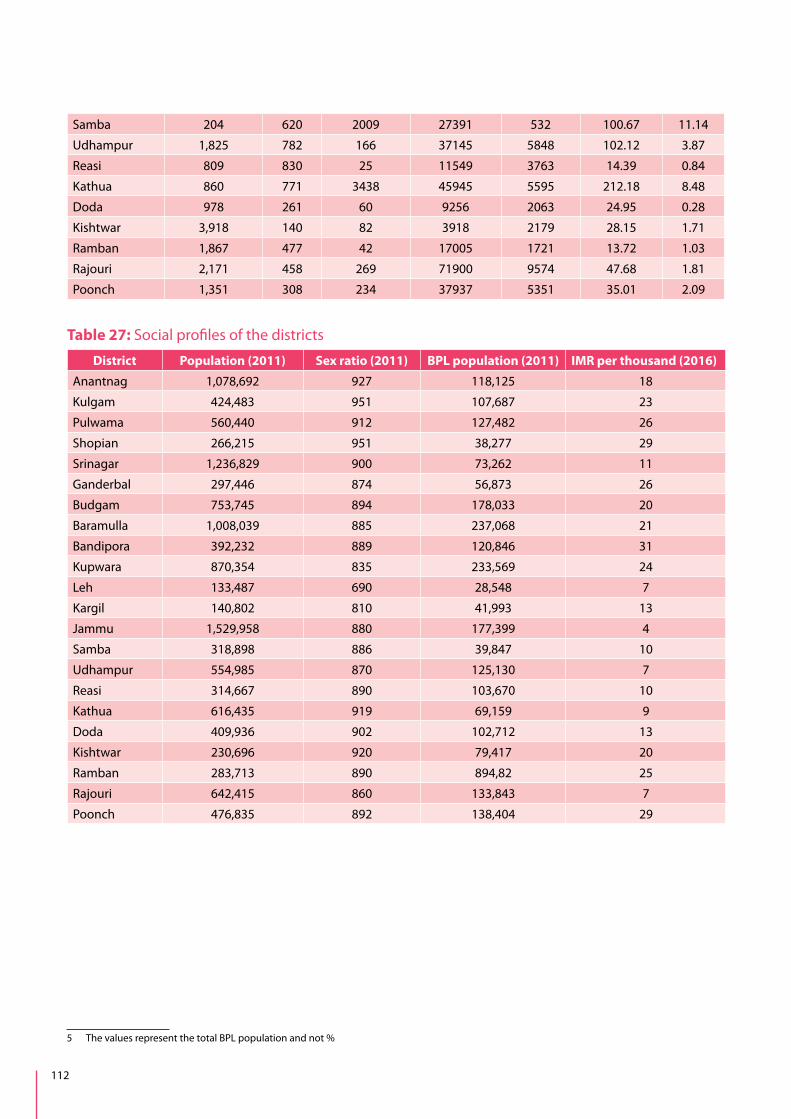
112
Samba 204 620 2009 27391 532 100.67 11.14
Udhampur 1,825 782 166 37145 5848 102.12 3.87
Reasi 809 830 25 11549 3763 14.39 0.84
Kathua 860 771 3438 45945 5595 212.18 8.48
Doda 978 261 60 9256 2063 24.95 0.28
Kishtwar 3,918 140 82 3918 2179 28.15 1.71
Ramban 1,867 477 42 17005 1721 13.72 1.03
Rajouri 2,171 458 269 71900 9574 47.68 1.81
Poonch 1,351 308 234 37937 5351 35.01 2.09
Table 27: Social profiles of the districts
District Population (2011) Sex ratio (2011) BPL population (2011) IMR per thousand (2016)
Anantnag 1,078,692 927 118,125 18
Kulgam 424,483 951 107,687 23
Pulwama 560,440 912 127,482 26
Shopian 266,215 951 38,277 29
Srinagar 1,236,829 900 73,262 11
Ganderbal 297,446 874 56,873 26
Budgam 753,745 894 178,033 20
Baramulla 1,008,039 885 237,068 21
Bandipora 392,232 889 120,846 31
Kupwara 870,354 835 233,569 24
Leh 133,487 690 28,548 7
Kargil 140,802 810 41,993 13
Jammu 1,529,958 880 177,399 4
Samba 318,898 886 39,847 10
Udhampur 554,985 870 125,130 7
Reasi 314,667 890 103,670 10
Kathua 616,435 919 69,159 9
Doda 409,936 902 102,712 13
Kishtwar 230,696 920 79,417 20
Ramban 283,713 890 894,82 25
Rajouri 642,415 860 133,843 7
Poonch 476,835 892 138,404 29
5 The values represent the total BPL population and not %

Climate Vulnerability Assessment for the Indian Himalayan Region Using a Common Framework
113
Table 28: Normal monsoon rainfall and percentage departure of rainfall in 2016 from normal for the districts in Jammu &Kashmir (Source of Data: IMD, Srinagar)
District Station name Normal monsoon rainfall (in mm)
% Departures of monsoon rainfall in 2016
Normal period
Anantnag Kokarnag 1,125.99 -0.38 1980-1995
Kulgam Qazigund 605.67 -0.03
Pulwama Qazigund 605.67 -0.03
Shopian Qazigund 605.67 -0.03
Srinagar Srinagar 768.08 -0.39
Ganderbal Srinagar 768.08 -0.39
Budgam Srinagar 768.08 -0.39
Baramulla Gulmarg 1,740.37 -0.38
Bandipora Kupwara 466.18 0.81
Kupwara Kupwara 466.18 0.81
Leh Leh 53.68 -0.61 2011-2015
Kargil Kargil 24.54 -1
Jammu Jammu 1,540.9 -0.33
Samba Jammu 1,540.9 -0.33
Udhampur Jammu 1,540.9 -0.33
Reasi Katra 2,191.12 -0.26
Kathua Jammu 1,540.9 -0.33
Doda Bhaderwah 1,265.422 -0.36
Kishtwar Bhaderwah 1,265.422 -0.36
Ramban Banihal 1,463.188 -0.41
Rajouri Batote 1,637.3 -0.29
Poonch Batote 1,637.3 -0.29

114
Tabl
e 29
: The
val
ues
give
n to
the
indi
cato
rs a
nd th
e no
rmal
ised
scor
es fo
r the
indi
cato
rs
>30°
Slo
pe%
age
of to
tal f
ores
t to
geo
grap
hica
l ar
ea
MG
NRE
GA
Fem
ale
liter
acy
rate
@
201
1Po
pula
tion
den
sity
@
201
1Pe
r cap
ita
inco
me
2011
-12
@ 2
004-
05Yi
eld
vari
abili
ty
AVN
VAV
NV
AVN
VAV
NV
AVN
VAV
NV
Ana
ntna
g0.
3165
80.
6135
.17
0.42
636
3847
.809
0.4
302
0.26
15,9
010.
490.
3852
7
Kulg
am0.
1303
927
0.25
35.1
70.
426
3440
51.5
076
0.31
1035
0.9
15,9
010.
490.
6429
4
Pulw
ama
0.15
4183
70.
2934
.12
0.44
427
3448
.201
90.
3951
60.
4518
,027
0.27
0.42
472
Shop
ian
0.01
3760
30.
0234
.12
0.44
446
4149
.102
10.
3785
30.
7418
,027
0.27
0.42
472
Srin
agar
0.21
1732
20.
428
.14
0.54
242
2038
.154
10.
6362
50.
5420
,666
00.
3381
6
Gan
derb
al0.
4140
476
0.8
28.1
40.
542
3239
54.2
939
0.24
1148
120
,666
00.
5332
5
Budg
am0.
0431
901
0.08
18.3
10.
703
3238
55.1
549
0.22
554
0.48
14,9
210.
590.
3789
4
Bara
mul
la0.
2336
013
0.45
24.4
80.
602
3030
47.6
184
0.41
238
0.21
16,1
960.
460.
3624
5
Band
ipur
a0.
3720
087
0.71
24.4
80.
602
4652
55.6
604
0.21
1137
0.99
16,1
960.
460.
4678
7
Kupw
ara
0.33
9328
0.65
48.3
40.
2137
3849
.051
90.
3736
60.
3211
,148
0.98
0.39
097
Leh
0.30
6851
50.
590.
211
3623
36.4
425
0.67
30
12,2
860.
860.
0432
7
Karg
il0.
4145
864
0.8
0.28
0.99
949
3943
.696
30.
510
0.01
10,9
281
0.01
862
Jam
mu
0.00
6264
30.
0128
.90.
529
4116
22.8
651
653
0.57
19,2
250.
150.
1826
8
Sam
ba0.
0033
893
028
.90.
529
3121
26.3
584
0.92
353
0.31
19,2
250.
150.
3316
7
Udh
ampu
r0.
1638
783
0.31
61.1
60
2918
42.8
971
0.52
210
0.18
16,1
400.
470.
1535
9
Reas
i0.
3570
033
0.69
61.1
60
3422
53.4
062
0.27
183
0.16
16,1
400.
470.
3234
3
Kath
ua0.
1389
240.
2652
.73
0.13
838
1436
.284
60.
6824
60.
2119
,176
0.15
0.16
863
Dod
a0.
4132
962
0.79
32.4
80.
471
4226
50.3
060.
3446
0.04
13,2
730.
760.
2726
2
Kish
twar
0.51
9394
31
32.4
80.
471
4939
53.8
376
0.26
140
0.12
13,2
730.
760.
3851
1
Ram
ban
0.43
7144
40.
8432
.48
0.47
139
2864
.442
70
213
0.18
13,2
730.
760.
3488
3
Rajo
uri
0.10
4156
20.
247
.15
0.23
3532
43.4
299
0.51
244
0.21
16,0
760.
470.
1859
1
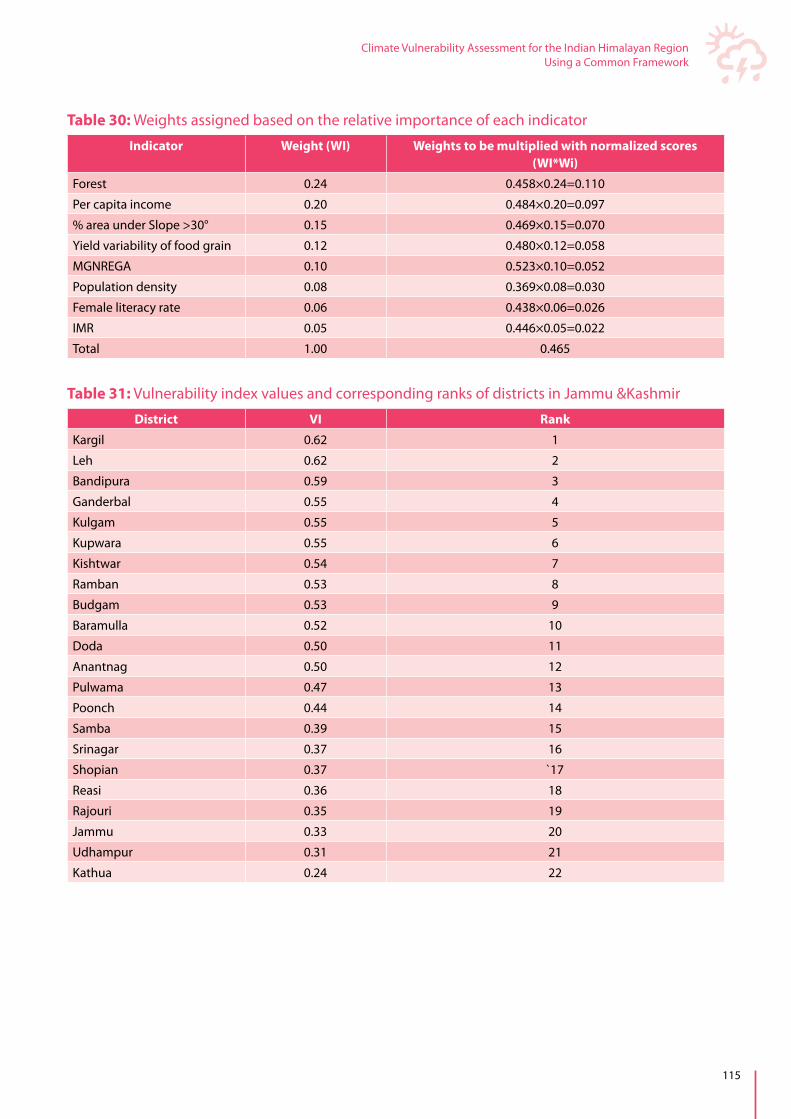
Climate Vulnerability Assessment for the Indian Himalayan Region Using a Common Framework
115
Table 30: Weights assigned based on the relative importance of each indicator
Table 31: Vulnerability index values and corresponding ranks of districts in Jammu &Kashmir
Indicator Weight (WI) Weights to be multiplied with normalized scores (WI*Wi)
Forest 0.24 0.458×0.24=0.110
Per capita income 0.20 0.484×0.20=0.097
% area under Slope >30° 0.15 0.469×0.15=0.070
Yield variability of food grain 0.12 0.480×0.12=0.058
MGNREGA 0.10 0.523×0.10=0.052
Population density 0.08 0.369×0.08=0.030
Female literacy rate 0.06 0.438×0.06=0.026
IMR 0.05 0.446×0.05=0.022
Total 1.00 0.465
District VI Rank
Kargil 0.62 1
Leh 0.62 2
Bandipura 0.59 3
Ganderbal 0.55 4
Kulgam 0.55 5
Kupwara 0.55 6
Kishtwar 0.54 7
Ramban 0.53 8
Budgam 0.53 9
Baramulla 0.52 10
Doda 0.50 11
Anantnag 0.50 12
Pulwama 0.47 13
Poonch 0.44 14
Samba 0.39 15
Srinagar 0.37 16
Shopian 0.37 `17
Reasi 0.36 18
Rajouri 0.35 19
Jammu 0.33 20
Udhampur 0.31 21
Kathua 0.24 22

116
Table 32: District-wise drivers of vulnerability in Jammu &Kashmir
Ranking District Drivers of Vulnerability
1 Kargil Kargil has three major drivers of vulnerability - lowest per capita income, largest area under slope >30% than other districts and high IMR. Interestingly, low area under forest, of the district, has no role invulnerability because low forest area is geographically an important feature of the Ladakh division of the state. Other than income, the availability of healthcare facilities, female literacy rates, the performance of this district with respect to other indicators is relatively better than the other districts. However, the high vulnerability of the district arises from other indicators as well.
2 Leh This district has four major drivers of vulnerability - lowest per capita income, low female literacy rate and largest area under slope >30% andlower MGNREGA participation, significantly at par. Similar to Kargil, it can be attributed that Leh ranks secondhighest with respect to vulnerability, pertinently, low area under forest of the district as well has no role onvulnerability because low forest area is geographically an important feature of the Ladakh division.
3 Bandipura The vulnerability of this district arises from IMR, high population density, highest yield variability and larger area under slope >30% indicators.
4 Ganderbal Several drivers of vulnerability are evident for Ganderbal. These include, in the order of significance, highest population density, high yield variability, greater slope and lower MGNREGA participation.
5 Kulgam The district has high sensitivity of agriculture sector along with greater population density and poor health sector. The district has three major drivers of vulnerability - highest yield variability, highest population density, lower MGNREGA participation.
6 Kupwara It has the second lowest per capita income among other districts of the state. The district has four major drivers of vulnerability – more area under slope >30⁰, less healthcare facilities (IMR), higher yield variability and larger area with > 30-⁰ slope.
7 Kishtwar Having highest area under slope >30⁰ than all other districts, the district has four major drivers of vulnerability, besides per capita income, less healthcare facilities (IMR) followed by higher yield variability.
8 Ramban It also has the second highest area under slope >30% than all other districts. The district has four major drivers of vulnerability – more area under slope >30⁰, lower per capita income, higher yield variability and lack of participation in MGNREGA
9 Budgam The vulnerability of this district arises from the lack of participation in MGNREGA and lower forest area. The districthas two major drivers of vulnerability – low participation in MGNREGA and less forest area. Other indicators have less role for vulnerability in this district.
10 Baramulla The vulnerability of this district also arises from the lack of participation in MGNREGA. The districthas three major drivers of vulnerability – low participation in MGNREGA, less forest area and higher yield variability
11 Doda Only two drivers of vulnerability are evident for the Doda district. These include, high area under slope >30⁰ and per capita income. However, the vulnerability of the district arising from other indicators have negligible role.
12 Anantnag Several drivers of vulnerability are evident for district Anantnag of J&K. These include, in the order of significance, more IMR, high area under slope >30⁰, higher yield variability, lower MNGREGA participation and lesser per capita income.
13 Pulwama Pulwama stands almost at the middle of the ranking. This district has lowest participation in MGNREGA among all the districts. However, higher per capita income, along with less slope and good forest area enhance relatively higher adaptive capacity.

Climate Vulnerability Assessment for the Indian Himalayan Region Using a Common Framework
117
14 Poonch Vulnerability in this district was driven by low per capita income and high area under slope >30⁰. However, the vulnerability of the district arising from other indicators have negligible role. Besides, the district has the relative larger area under forests and reasonable population density as compared to other states.
15 Samba This district’s position is almost at the lower middle of the ranking. This district has higher female literacy rate and lesser participation in MGNREGA as compared to other districts. Though, least area under slope >30⁰ improves comparatively its adaptive capacity.
16 Srinagar Three major drivers of vulnerability for Srinagar are lower female literacy rate, higher population density and lower forest cover. Even so, the district has highest per capita income, which progresses its adaptive capacity.
17 Shopian Although Shopian has the highest population density, high IMR and high yield variability, it has the lowest area under slope >30⁰ and higher MGNREGA participation, in comparison to other districts.
18 Reasi Two major drivers are higher area under slope >30⁰ and lower MGNREGA participation. But highest forest cover among all districts enhances its adaptive capacity. Hence revealed less vulnerable.
19 Rajouri Three major drivers are lower MGNREGA participation, lesser per capita income and high IMR, which exposes its healthcare facility. It has the lesser area under slope >30⁰ and lowest population density, which relatively lowers vulnerability ofthe district when compared to other districts in the state.
20 Jammu One would expect Jammu to appear more vulnerable when compared to other districts in J&K owing to the fact that it has least female literacy rate among all districts, highest population density and lowest area under forests. Low vulnerability with respect to lower area under slope >30⁰ along with less IMR indicators, highlight Jammu’s adaptive capacity, and offset many sensitivities giving it a lower vulnerability index value.
21 Udhampur Three major drivers of vulnerability for Udhampur are less involvement in MGNREGA, lesser female literacy rate and lower per capita income. It has the highest forest area, reduced IMR and lesser population density in comparison to other districts, which lowers its vulnerability index.
22 Kathua Two major drivers are low female literacy rate and minor MGNREGA participation. However,IMR index is lowest amongst districts and second highest forest area and higher per capita Income lowers its vulnerability index.
ManipurTable 33: Land use pattern at district level
District Geographical area Forests Net area sown Cropping intensityArea % Area %
Senapati 327.1 218.4 66.77 17.50 5.35 142.7
Tamenglong 439.1 395.3 90.03 30.94 7.05 125.7
Churachandpur 457 416.9 91.23 36.40 7.96 120.8
Chandel 331.3 290.7 87.75 14.87 4.49 146.3
Ukhrul 454.4 370.6 81.56 13.63 3.00 161.4
Imphal East 70.9 27.8 39.21 35.68 50.32 147.3
Imphal West 51.9 5.4 10.40 32.50 62.62 174.3
Bishnupur 49.6 2.2 4.44 26.23 52.88 194.4
Thoubal 51.4 7.3 14.20 26.39 51.34 192.2
Poonch 1,674 715 42.71 273.36 16.33 163.62

118
Table 34: Social profile of the districts in Manipur
Table 35: Normal monsoon rainfall and percentage departure of rainfall in 2017 from the normal for the nine districts in Manipur
District Population (2011) in lakhs
Sex Ratio6 (2011)
% BPL HH(2011) IMR per 1,000(2016)
Senapati 4.79 937 7.517 43
Tamenglong 1.41 943 8.013 42
Churachandpur 2.74 975 8.430 43
Chandel 1.44 933 8.232 51
Ukhrul 1.84 943 7.752 49
Imphal East 4.56 1,017 8.839 42
Poonch 715 42.71 273.36
Imphal West 5.18 1,031 8.688 42
Bishnupur 2.37 999 8.909 40
Thoubal 4.22 1,002 8.905 43
District Normal monsoon rainfall (in mm)7 % Departures of monssonrainfall in 2017
Senapati 570.76 1.02
Tamenglong 272.35 -94.50
Churachandpur 477.85 -97.82
Chandel 854.84 63.91
Ukhrul 198.83 891.83
Imphal East 472.86 51.51
Imphal West 306.76 115.40
Bishnupur 162.92 -97.91
Thoubal 124.07 32.19
6 Sex ratio: Females per ‘000 males7 Normal rainfall is based on the rainfall recorded during the period from 1951 to 2000.

Climate Vulnerability Assessment for the Indian Himalayan Region Using a Common Framework
119
Tabl
e 36
: The
val
ues
of in
dica
tors
and
the
norm
alis
edsc
ores
for t
he in
dica
tors
Dis
tric
tPo
pula
tion
de
nsit
y%
of a
re >
30°
Sl
ope
IMR
Yiel
d va
riab
ility
BPL
hous
ehol
dsFe
mal
e lit
erac
y ra
teFo
rest
sM
GN
REG
A
AVN
VAV
NV
AVN
VAV
NV
AVN
VAV
NV
AVN
VAV
NV
Sena
pati
146
0.12
8.30
0.67
430.
270.
160.
387.
520.
0057
.67
1.00
66.7
70.
2833
.70
0.27
Tam
engl
ong
320.
0012
.39
1.00
420.
180.
200.
638.
010.
3663
.69
0.73
90.0
30.
0125
.60
0.51
Chur
acha
ndpu
r60
0.03
5.89
0.48
430.
270.
180.
508.
430.
6678
.57
0.07
91.2
30.
0042
.35
0.00
Chan
del
440.
012.
220.
1851
1.00
0.26
1.00
8.23
0.51
63.9
60.
7287
.75
0.04
31.5
90.
33
Ukh
rul
400.
015.
280.
4349
0.82
0.14
0.25
7.75
0.17
76.9
80.
1481
.56
0.11
31.6
60.
33
Imph
al E
ast
643
0.63
0.52
0.04
420.
180.
130.
198.
840.
9575
.30
0.22
39.2
10.
6018
.21
0.74
Imph
al W
est
998
1.00
0.04
0.00
420.
180.
100.
008.
690.
8480
.17
0.00
10.4
00.
9325
.00
0.53
Bish
nupu
r47
90.
460.
010.
0040
0.00
0.12
0.13
8.91
1.00
66.7
00.
604.
441.
009.
771.
00
Thou
bal
821
0.82
0.00
0.00
430.
270.
190.
568.
911.
0064
.09
0.71
14.2
00.
8930
.85
0.35

120
Table 37: Weights assigned based on the relative importance of each indicator
Table 38: Vulnerability index values and corresponding ranks of districts in Manipur
Meghalaya
Table 39: Land use pattern in ‘000 ha in Meghalaya
Indicators Weights (WI) Weights to be multiplied with normalisedscores (WI*Wi)
Yield variability 28 11.28
% area under forest (FSI, 2017) 20 8.59
BPL households 18 10.97
Female literacy (%)Census 2011 10 4.66
IMR (Census 2011) 8 2.83
Human population density (No. of people per km) Census 2011
7 2.40
Slope (>30 0) 6 1.86
Average person days per household, MGNREGA % 3 1.35
Total 100
District VI Rank
Thoubal 0.68 1
Chandel 0.55 2
Bishnupur 0.54 3
Imphal East 0.45 4
Imphal West 0.44 5
Tamenglong 0.41 6
Senapati 0.34 7
Churachandpur 0.32 8
Ukhrul 0.24 9
District Geographical area
(sq km)*
Forests* Area not available for cultivation
(ha)(2012-13)**
Cultivable land(ha)
(2012-13)**
Net area sown(ha)
(2012-13) **
Cropping intensity
***Area
(sq. km)%
West Garo Hills
3,677 2,837 77.16 14,872 120,743 95,644 126.51
East Garo Hills
2,603 2,266 87.05 6,650 42,311 37,020 114.29
South Garo Hills
1,887 1,688 89.45 7,363 30,910 25,438 120.72
West Khasi Hills
5,247 3,958 75.43 26,364 36,689 31,212 121.94
East Khasi Hills
2,748 1,751 63.72 19,691 45,626 37,834 129.34
Ri-Bhoi 2,448 2,143 87.54 14,092 25,169 22,286 113.12
Jaintia Hills 3,819 2,503 65.54 18,582 36,405 36,065 101.15

Climate Vulnerability Assessment for the Indian Himalayan Region Using a Common Framework
121
Table 40: District-wise net area irrigated by sources in ‘000 ha
Table 40: District-wise net area irrigated by sources in ‘000 ha
Figure 2: Average precipitation and its trend for 1981-2012. Slope of the mean monsoon precipitation for the period of 1981-2012 is shown in red
District Net area irrigated (Hectares) (2012-13)**
Area %
West Garo Hills 11,841.40 12.38
East Garo Hills 9,711.23 26.23
South Garo Hills 4,749.00 18.67
West Khasi Hills 8,848.55 28.35
East Khasi Hills 8,165.99 21.58
Ri-Bhoi 12,171.37 54.61
Jaintia Hills 9,982.45 27.68
District Population (2011)*
Sex ratio8(2011)* % Population BPL (2008)**
IMR per 1,000 (2011)***
West Garo Hills 568,433 984 53.71 92
East Garo Hills 273,725 972 55.94 75
South Garo Hills 129,203 945 45.33 83
West Khasi Hills 340,356 980 47.66 70
East Khasi Hills 670,763 1,011 46.74 67
RiBhoi 241,785 953 49.94 77
Jaintia Hills 366,694 1,013 39.51 81
8 Sex ratio: Females per ‘000 males

122
Tabl
e 42
: The
val
ues
give
n to
the
indi
cato
rs a
nd th
e no
rmal
ised
sco
res
for t
he in
dica
tors
Dis
tric
t (r
elat
ions
hip)
Indi
cato
rs
Slop
e(p
osit
ive)
Fore
st
(neg
ativ
e)M
GN
REG
A
(neg
ativ
e)IM
R (p
osit
ive)
FLR
(neg
ativ
e)PD
(pos
itiv
e)BP
L (p
osit
ive)
Food
gra
in
Yiel
d (p
osit
ive)
AVN
VAV
NV
AVN
VAV
NV
AVN
VAV
NV
AVN
VAV
NV
Wes
t Gar
o H
ills
2.8
0.00
77.1
60.
4878
.81
0.03
921.
0062
.70
1.00
175
0.45
53.7
10.
862.
270.
99
East
Gar
o H
ills
6.7
0.21
87.0
50.
0980
.13
0.00
750.
3270
.05
0.65
122
0.22
55.9
41.
002.
220.
97
Sout
h G
aro
Hill
s8.
80.
3389
.45
0.00
49.9
30.
7083
0.64
66.9
00.
8076
0.01
45.3
30.
350.
260.
05
Wes
t Kha
si H
ills
11.0
0.44
75.4
30.
5462
.29
0.41
700.
1277
.19
0.31
730.
0047
.66
0.50
2.29
1.00
East
Kha
si H
ills
21.2
1.00
63.7
21.
0037
.00
1.00
670.
0083
.81
0.00
300
1.00
46.7
40.
440.
190.
01
RiBh
oi8.
60.
3187
.54
0.07
46.2
30.
7977
0.40
74.4
90.
4410
60.
1549
.94
0.63
0.16
0.00
Jain
tia H
ills
7.4
0.25
65.5
40.
9365
.66
0.34
810.
5665
.06
0.89
103
0.13
39.5
10.
002.
060.
89

Climate Vulnerability Assessment for the Indian Himalayan Region Using a Common Framework
123
Table 43: Weights assigned based on the relative importance of each indicator
Table 44: Vulnerability index values and corresponding ranks of districts in the state
Table 45: Normal monsoon rainfall and percentage departure of rainfall in 2017 from the normal for the districts in the state
Indicator Weights (WI) Weights to be multiplied with normalisedscores (WI*Wi)
% area with > 30% Slope 20 0.20
% area under Forest 18 0.18
MGNREGA 10 0.10
Infant Mortality Rate 3.5 0.04
Female Literacy Rate 0.5 0.01
Population Density 1 0.01
BPL 17 0.17
Yield Variability 30 0.30
Total 100 1.00
Vulnerability Index (VI) District
Vulnerability Index values
District Rank
West Khasi Hills 0.62 1
West Garo Hills 0.58 2
East Khasi Hills 0.57 3
Jaintia Hills 0.54 4
East Garo Hills 0.54 5
RiBhoi 0.28 6
South Garo Hills 0.24 7
District Normal monsoon rainfall in mm
% Departures of monsoon rainfall in 2017
Aizawl 2,394.96 21.31
Champhai 2,161.66 56.97
Kolasib 2,787.00 -4.59
Lawngtlai 2,361.12 -10.81
Lunglei 3,204.73 -5.17
Mamit 2,649.38 64.63
Serchhip 2,369.48 -3.24
Siaha 2,486.55 5.98
Mizoram

124
Figure 3: Bar graph representing rainfall variability in Mizoram from 1986 to 2017
Table 46: Landuse pattern in ‘000 ha
Table 47: District-wise net area irrigated by sources in ‘000 ha
District Geographical area
Forests Area not available for cultivation
Net area sown Cropping intensity
Area %
Aizawl 357.6 309.4 86.52 392.574 130.821 110%
Champhai 318.5 260.3 81.73
Kolasib 138.2 118.2 85.53
Lawngtlai 255.7 222.2 86.90
Lunglei 453.6 402.2 88.67
Mamit 302.5 270.0 89.26
Serchhip 142.1 115.8 81.49
Siaha 139.9 120.5 86.13
Districts Total crop land Gross command area under Irrigation project Net area irrigated
Area
Aizawl 15.23 2.56 2.70
Champhai 22.27 3.92 3.93
Kolasib 11.58 4.10 3.83
Lawngtlai 9.67 1.41 1.39
Lunglei 15.77 2.64 2.16
Mamit 17.40 1.76 1.64
Serchhip 8.94 2.68 2.55
Siaha 3.91 0.70 0.62

Climate Vulnerability Assessment for the Indian Himalayan Region Using a Common Framework
125
Tabl
e 48
: The
val
ues
give
n to
the
indi
cato
rs a
nd th
e no
rmal
ised
scor
es fo
r the
indi
cato
rs
Dis
tric
t>3
0°sl
ope
cove
rFo
rest
cov
erYi
eld
vari
abili
tyPo
pula
tion
dens
ity
Fem
ale
liter
acy
rate
IMR
BPL
HH
MG
NRE
GA
Pers
onda
ys
AVN
VAV
NV
AVN
VAV
NV
AVN
VAV
NV
AVN
VAV
NV
Aiz
awl
86.2
1.00
86.5
0.35
27.5
00.
3611
1.9
1.00
89.7
0.00
15.5
0.29
8.8
0.00
61.1
0.59
Cham
phai
78.1
0.68
81.7
0.97
13.5
00.
0139
.50.
1377
.80.
2312
.00.
009.
40.
0265
.20.
03
Kola
sib
61.5
0.04
85.5
0.48
13.2
40.
0060
.60.
3971
.70.
3520
.00.
6717
.50.
3358
.21.
00
Law
ngtla
i64
.60.
1686
.90.
3052
.51
1.00
46.1
0.21
38.8
1.00
24.0
1.00
21.4
0.47
65.4
0.00
Lung
lei
70.6
0.39
88.7
0.08
20.4
10.
1835
.60.
0862
.20.
5415
.00.
2530
.10.
7962
.00.
46
Mam
it60
.50.
0089
.30.
0035
.78
0.57
28.6
0.00
62.5
0.54
17.0
0.42
35.6
1.00
58.9
0.89
Serc
hhip
72.6
0.47
81.5
1.00
40.7
80.
7045
.70.
2182
.00.
1515
.00.
2512
.80.
1565
.10.
03
Siah
a77
.30.
6586
.10.
4042
.95
0.76
40.4
0.14
66.8
0.45
24.0
1.00
31.6
0.85
60.2
0.72

126
Table 49: Weights assigned to indicators and sub-indicators and the weights to be multiplied with normalisedscores
Table 50: Vulnerability index values and corresponding ranks of districts in the state
Indicator Weights (WI) Weights to be multiplied with normalizes scores (WI*Wi)
% area coverage of 35% slope and above 25 10.62
% total forest cover 25 11.20
Person days employment generated under MGNREGA 15 6.96
Yield variability 10 4.48
Infant Mortality Rate 10 4.84
Female literacy 5 2.04
Population density 5 1.35
% BPL family 5 2.26
Total 100
District Vulnerability index value
Vulnerability ranking
Siaha 0.62 1
Aizawl 0.54 2
Serchhip 0.49 3
Champhai 0.44 4
Kolasib 0.40 5
Lawngtlai 0.40 5
Mamit 0.31 6
Lunglei 0.30 7
Table 51: Social profile of districts in the state.
District Population (2011)
Sex Ratio (2011)
% Population BPL(2011)
Infant Mortality Rate per
thousand(2017)
Kohima 267,988 928 7.41 11.56
Dimapur 378,811 919 7.99 14.40
Kiphire 74,004 956 18.71 19.42
Longleng 50,593 903 18.55 3.18
Mokokchung 194,622 925 10.79 26.76
Mon 250,260 899 9.57 7.25
Peren 95,219 915 13.18 10.65
Phek 163,418 951 10.25 1.18
Tuensang 196,596 929 10.23 10.68
Wokha 166,343 968 13.10 10.67
Zunheboto 140,757 976 14.33 1.61
Nagaland

Climate Vulnerability Assessment for the Indian Himalayan Region Using a Common Framework
127
Figure 4: Land use land cover map of Nagaland.

128
Table 52: Land use pattern in districts of Nagaland
District Geographical Area (Km2)
Forest Net area sown Cropping intensity (Ha)
Area % Area
Kohima 1,463 1,186 81.07 27090 132
Dimapur 927 589 63.54 54000 140
Kiphire 1,130 835 73.89 22620 124
Longleng 562 375 66.73 13560 136
Mokokchung 1,615 1,322 81.86 28700 124
Mon 1,786 1,207 67.58 38350 119
Peren 1,651 1,438 87.1 22130 135
Phek 2,026 1,624 80.16 31760 132
Tuensang 2,536 1,673 65.97 37010 125
Wokha 1,628 1,306 80.22 28700 136
Zunheboto 1,255 934 74.42 34140 121
Grand Total 16,579 12,489 75.33 338060 1,424
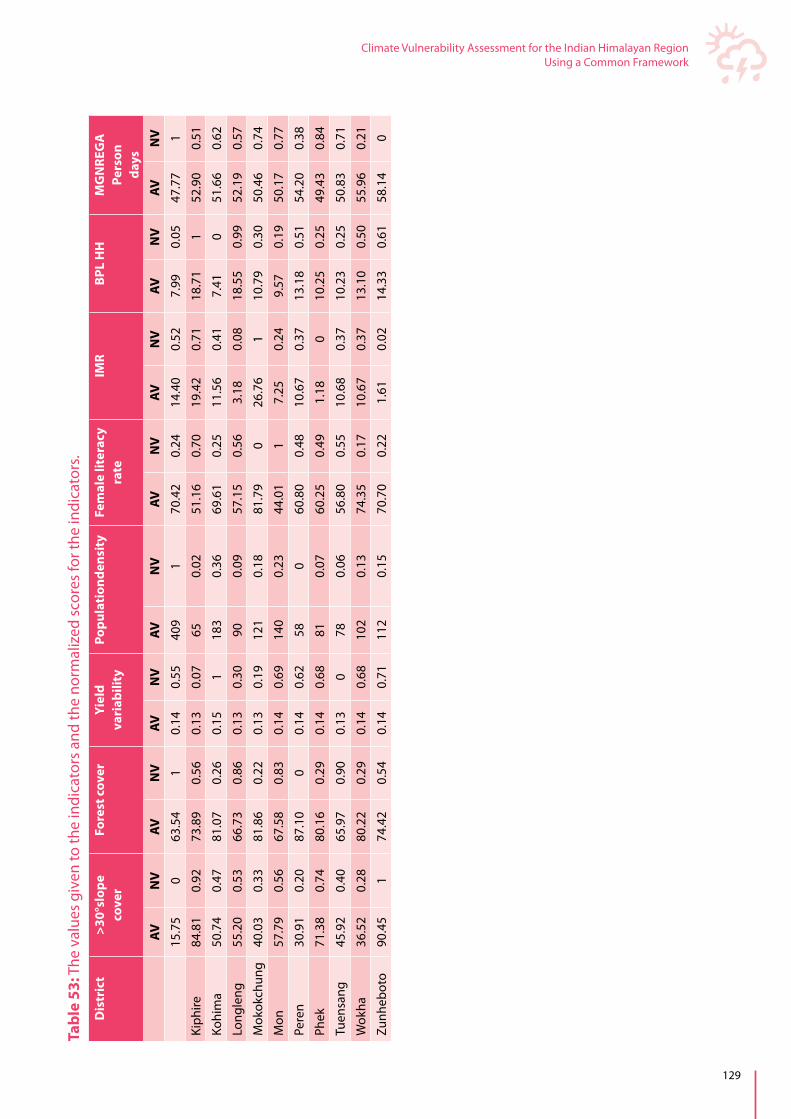
Climate Vulnerability Assessment for the Indian Himalayan Region Using a Common Framework
129
Tabl
e 53
: The
val
ues
give
n to
the
indi
cato
rs a
nd th
e no
rmal
ized
sco
res
for t
he in
dica
tors
.
Dis
tric
t>3
0°sl
ope
cove
rFo
rest
cov
erYi
eld
vari
abili
tyPo
pula
tion
dens
ity
Fem
ale
liter
acy
rate
IMR
BPL
HH
MG
NRE
GA
Pers
onda
ys
AVN
VAV
NV
AVN
VAV
NV
AVN
VAV
NV
AVN
VAV
NV
15.7
50
63.5
41
0.14
0.55
409
170
.42
0.24
14.4
00.
527.
990.
0547
.77
1
Kiph
ire84
.81
0.92
73.8
90.
560.
130.
0765
0.02
51.1
60.
7019
.42
0.71
18.7
11
52.9
00.
51
Kohi
ma
50.7
40.
4781
.07
0.26
0.15
118
30.
3669
.61
0.25
11.5
60.
417.
410
51.6
60.
62
Long
leng
55.2
00.
5366
.73
0.86
0.13
0.30
900.
0957
.15
0.56
3.18
0.08
18.5
50.
9952
.19
0.57
Mok
okch
ung
40.0
30.
3381
.86
0.22
0.13
0.19
121
0.18
81.7
90
26.7
61
10.7
90.
3050
.46
0.74
Mon
57.7
90.
5667
.58
0.83
0.14
0.69
140
0.23
44.0
11
7.25
0.24
9.57
0.19
50.1
70.
77
Pere
n30
.91
0.20
87.1
00
0.14
0.62
580
60.8
00.
4810
.67
0.37
13.1
80.
5154
.20
0.38
Phek
71.3
80.
7480
.16
0.29
0.14
0.68
810.
0760
.25
0.49
1.18
010
.25
0.25
49.4
30.
84
Tuen
sang
45.9
20.
4065
.97
0.90
0.13
078
0.06
56.8
00.
5510
.68
0.37
10.2
30.
2550
.83
0.71
Wok
ha36
.52
0.28
80.2
20.
290.
140.
6810
20.
1374
.35
0.17
10.6
70.
3713
.10
0.50
55.9
60.
21
Zunh
ebot
o90
.45
174
.42
0.54
0.14
0.71
112
0.15
70.7
00.
221.
610.
0214
.33
0.61
58.1
40

130
Table 54: Weights assigned to indicators and the weights to be multiplied with normalisedscores
Table 55: Vulnerability index values and corresponding ranks of districts in the state
Table 56: Social profile of districts in Sikkim
Indicator Weights Assigned (WI) Weights to be multiplied with normalisedscores (WI*Wi)
Forests 35 0.35
Yield variability 22 0.22
Slope 15 0.15
BPL 10 0.10
Population density 6 0.60
MGNREGA 5 0.50
Female literacy rate 4 0.40
IMR 3 0.30
Total 100 1.00
Districts Vulnerability Index Value Vulnerability Ranking
Mon 0.64 1
Dimapur 0.62 2
Longleng 0.6 3
Zunheboto 0.57 4
Kiphire 0.54 5
Tuensang 0.47 6
Phek 0.453 7
Kohima 0.45 8
Wokha 0.37 9
Mokokchung 0.28 10
Peren 0.27 11
District Population (2011) Sex ratio9(2011) % Population BPL (2011)
East 283,583 873 19.79
West 136,435 915 26.94
North 43,709 767 19.84
South 146,850 942 27.02
9 Sex ratio: Females per ‘000 males
Sikkim
Table 57: The values given to the indicators and the normalised scores for the indicators
District (relati onship)
Indicators
Slope >30° Forest cover
Crop yield variability
Population Density
Female literacy
rate
IMR BPL MGNREGA
AV NV AV NV AV NV AV NV AV NV AV NV AV NV AV NV
East 22.62 1.00 71.17 0.00 0.50 0.59 297.26 1.00 78.5 0.00 62.62 1.00 19.79 0.00 47.47 1.00
West 21.83 0.83 62.44 0.22 0.60 0.00 117.01 0.37 70.9 1.00 13.66 0.00 26.94 0.99 51.87 0.45
North 21.97 0.86 31.38 1.00 0.59 0.06 10.34 0.00 71 0.99 25.25 0.24 19.84 0.01 52.69 0.34
South 17.93 0.00 70.53 0.02 0.43 1.00 195.8 0.65 75.8 0.36 16.61 0.06 27.02 1.00 55.43 0.00

Climate Vulnerability Assessment for the Indian Himalayan Region Using a Common Framework
131
Table 58: Weights assigned based on the relative importance of each indicator with justification
Indicator Weights Justification
Slope >30⁰ 23 Sikkim is a mountainous state where degree of slope forms an important part of development, thus this indicator has been assigned highest scores
Forest area 10 Though a very important indicator,it has been assigned less weightage because, in Sikkim, forest is strictly protected by laws which ban people from using forests for their livelihood. Even grazing isbanned in forest areas, timber production from forest isalmost absent in Sikkim. People are dependent only on private forests for fulfilment of their needs. Thus, the given weightage has been assigned to this indicator.
Yield variability 5 Though Sikkim is an agrarian state, at present people mostly depend on imported food. The cultivation ismostly done for self-consumption, so very less weightage is assigned to this indicator.
Population density 13 As per 2011 census, the population density of Sikkim is 76 persons per sq. km. However, approximately two-thirds of the area in Sikkim is covered by high altitude area and forests, where human settlement isalmost absent. Keeping aside such areas, the population density of Sikkim is very high. So high weightage has been assigned to this indicator.
Female literacy rate 12 Female literacy is comparatively high in Sikkim. Despite that it is an important factor in development of society. So,the given weightage has been assigned to this indicator.
IMR 8 Infant mortality is not a major problem in Sikkim, so very less weightage is given.
BPL 14 BPL population generally forms the weaker section of people in a society.So high weightage is assigned to this indicator.
Employment generation through MGNREGA
15 MGNREGA forms an important alternative source of income for rural households. So, high weightage has been assigned, only next to slope.
Total 100
Table 59: Vulnerability index values and corresponding ranks of districts in Sikkim.
Districts Vulnerability index value Obtained vulnerability rank
East 0.68 1
West 0.52 2
North 0.47 3
South 0.3 4
Table 60: Social profiles of the districts in the State.
District Population (2011)* Sex Ratio 10 (2011)* % Population BPL (2018)** IMR per thousand (2018)***
Khowai 327,564 957 62.51 8.1
Dhalai 378,230 944 70.86 21.6
Unakoti 276,506 972 64.95 21.6
North Tripura 417,441 963 66.52 15
West Tripura 918,200 970 59.78 14.4
Sepahijala 483,687 952 66.33 5.6
Gomati 441,538 959 67.64 8.1
South Tripura 430,751 957 64.39 9.9
Tripura
10 Sex ratio: Females per ‘000 males

132
Table 61: Land use pattern in ‘000 ha.
Table 62: District-wise net area irrigated by sources in ‘000 ha.
Table 63: Normal monsoon rainfall and percentage departure of rainfall in 2016 from the normal for the districts in Tripura
District Geographical area
Forests Area not available
for cultivation
Cultivable land
Net area sown Cropping intensityArea % Area %
Khowai 92.005 54.319 59.03 4.959 32.727 32.369 30.93 176
Dhalai 231.394 185.940 80.35 22.589 22.865 20.216 8.95 177
Unakoti 68.779 33.039 48.03 13.378 22.362 17.722 24.90 179
North Tripura
141.837 89.292 62.95 23.212 29.333 21.988 16.20 168
West Tripura
104.596 29.265 27.97 40.861 34.470 33.433 40.10 182
Sepahijala 103.080 30.996 30.06 24.292 47.792 46.259 40.05 219
Gomati 148.911 100.704 67.62 7.664 40.543 40.291 23.74 194
South Tripura
158.567 105.871 66.76 9.200 43.495 43.082 29.40 191
District Canals Tanks Wells Other sources
Net area irrigated
Govt. Pvt. Tube-wells Other wells
Area %
Khowai 80 0 75 555 2145 7,455 10,310 31.85
Dhalai 250 0 85 80 0 7,085 7,500 37.09
Unakoti 0 0 28 105 0 5,038 5,171 29.17
North Tripura
0 0 33 297 0 6,005 6,335 28.81
West Tripura
521 0 233 2160 6 7,054 9,974 29.83
Sepahijala 216 0 154 1861 1 9,790 12,022 25.98
Gomati 3340 0 30 664 345 10,794 15,173 37.65
South Tripura
1822 0 78 767 60 10,864 13,591 31.54
District Normal monsoon rainfall in mm % Departures of monsoon rainfall in 2016
Khowai 1,366.2 -37%
Dhalai 1,353.2 -07%
Unakoti 1,420.5 -07%
North Tripura 1,560.5 -18%
West Tripura 1,262 -37%
Sepahijala 1,397.1 -24%
Gomati 1,186.6 4%
South Tripura 1,605.2 -11%

Climate Vulnerability Assessment for the Indian Himalayan Region Using a Common Framework
133
Tabl
e 64
: Th
e va
lues
giv
en to
the
indi
cato
rs a
nd th
e no
rmal
ised
sco
res
for t
he in
dica
tors
.
Dis
tric
tIn
dica
tors
Are
a w
ith
>30°
sl
ope
Are
a un
der
fore
st (%
)Yi
eld
vari
abili
tyPo
pula
tion
de
nsit
y (2
011)
BPL
HH
(%)
(201
8)Fe
mal
e lit
erac
y ra
te (%
) (20
11)
Infa
nt
mor
talit
yEm
ploy
men
t ge
nera
tion
th
roug
h M
NRE
GA
20
15-1
6 (A
vg
days
)
AVN
VAV
NV
AVN
VAV
NV
AVN
VAV
NV
AVN
VAV
NV
Khow
ai0.
20.
059
.03
0.4
6.31
60.
232
60.
262
.51
0.2
83.1
70.
58.
10.
288
.69
0.4
Dha
lai
4.83
0.4
80.3
50.
09.
108
0.9
158
0.0
70.8
61.
079
.79
0.9
21.6
1.0
93.5
40.
2
Una
koti
1.26
0.1
48.0
30.
68.
891
0.9
467
0.4
64.9
50.
582
.79
0.6
21.6
1.0
79.2
60.
8
Nor
th T
ripur
a11
.22
1.0
62.9
50.
35.
545
0.1
289
0.2
66.5
20.
684
.39
0.4
150.
674
.92
1.0
Wes
t Trip
ura
0.2
0.0
27.9
71.
07.
181
0.5
974
1.0
59.7
80.
088
.01
0.0
14.4
0.6
86.1
90.
5
Sepa
hija
la0.
120.
030
.06
1.0
9.45
71.
046
30.
466
.33
0.6
79.4
90.
95.
60.
084
.98
0.6
Gom
ati
2.04
0.2
67.6
20.
25.
308
0.0
290
0.2
67.6
40.
779
1.0
8.1
0.2
93.5
40.
2
Sout
h Tr
ipur
a0.
210.
066
.76
0.3
5.30
80.
028
10.
264
.39
0.4
79.5
40.
99.
90.
398
.56
0.0

134
Table 65: Weights assigned to indicators
Table 66: Vulnerability index values and corresponding ranks of districts in the state.
Indicator Weights (WI) Normalised scores (Wi) Weights to be multiplied with normalisedscores (WI*Wi)
Area with >30% slope (%) 7 0.2 01.40
Area under forest (%) 20 0.5 10.00
Yield variability 28 0.4 11.20
Population density (2011) 16 0.3 04.80
BPL families (%) (2018) 14 0.5 07.00
Female literacy rate (%) (2011) 6 0.7 04.20
Infant mortality 5 0.5 02.50
Employment generation through MGNREGA 2015-16 (Avg. days)
4 0.5 02.00
Total 100
District VA Index Value Obtained Vulnerability Ranking
Drivers of Vulnerability
Sepahijala 0.69 1 High yield variability and low forest cover
Unakoti 0.62 2 High yield variability and high population density and infant mortality rate
Dhalai 0.54 (0.5393) 3 High yield variability, high BPL, and high infant mortality rate
West Tripura 0.54 (0.5353) 4 Extremely high population density and low forest cover
North Tripura 0.36 5 High slope and moderate Infant mortality rate
Khowai 0.27 6
Gomati 0.26 7
South Tripura 0.20 8
Total 100

Climate Vulnerability Assessment for the Indian Himalayan Region Using a Common Framework
135
Table 67: Land use pattern in districts of Uttarakhand in‘000 ha (Source: India State of Forest Report (ISFR) 20171 and landuse statistics 2015-162)
Table 68: Social profile of the districts in Uttarakhand
District Geographical area (sq. km)
Forests Area not available for cultivation
Cultivable land
Net area sown Cropping intensityArea % Area %
Almora 3,144 1,718 54.64 384,628 80,314 78,278 11.21 147.93
Bhageshwar 2,241 1,261 56.26 183,403 24,499 24,295 3.48 163.45
Chamoli 8,030 2,709 33.73 818,180 33,584 33,433 4.79 141.80
Champawat 1,766 1,224 69.30 210,510 22,715 16,921 2.42 154.73
Dehradun 3,088 1,332 43.13 317,742 45,629 39,443 5.65 144.85
PauriGarhwal 5,329 3,394 63.68 591,984 77,071 62,087 8.89 132.66
Haridwar 2,360 588 24.91 112,990 119,808 114,059 16.33 142.57
Nainital 4,251 3,048 71.70 360,756 47,249 44,005 6.30 163.27
Pithoragarh 7,090 2,078 29.30 701,928 44,806 41,891 6.00 170.37
Rudraprayag 1,984 1,141 57.51 213,963 20,833 20,821 2.98 150.86
Tehri Garhwal 3,642 2,065 56.69 421,964 63,553 53,809 7.70 150.71
Udham Singh Nagar
2,542 436 17.15 137,187 144,619 139,120 19.92 182.28
Uttarkashi 8,016 3,028 37.77 781,865 30,824 30,251 4.33 139.44
District Population (2011) Sex ratio 11(2011) % of BPL HH (2014-15)
IMR per thousand (2016)
Almora 622,506 87.83 9.73 20
2,241 183,403 24,499 163.45
Bhageshwar 259,898 91.70 4.21 31
Chamoli 391,605 98.17 5.19 27
Champawat 259,648 102.02 3.24 35
Dehradun 1,696,694 110.90 9.00 37
PauriGarhwal 687,271 90.67 9.77 67
Haridwar 1,890,422 113.58 14.75 30
Nainital 954,605 107.10 7.03 41
Pithoragarh 483,439 98.02 7.08 20
Rudraprayag 242,285 89.74 4.06 20
Tehri Garhwal 618,931 92.85 9.99 58
Udham Singh Nagar 1,648,902 108.69 11.38 36
Uttarkashi 330,086 104.40 4.57 42
Uttarakhand
11 Sex ratio: Females per ‘000 males

136
Table 69: Normal monsoon rainfall and percentage departure of rainfall in 2016 from the normal for the districts in the state
District Normal monsoon rainfall in mm)12 [1] % Departures of monssonrainfall in 2016
Almora 861.3 0%
Bhageshwar 1,096.5 28%
Chamoli 1,197.5 39%
Champawat 1,158.5 -12%
Dehradun 1,194.9 -34%
PauriGarhwal 901.9 -26%
Haridwar 1,000.1 4%
Nainital 1,544.5 7%
Pithoragarh 1,262.7 -25%
Rudraprayag 1,660.5 1%
Tehri Garhwal 752.4 -28%
Udham Singh Nagar 643.3 -43%
Uttarkashi 1,006.0 -12%
12 Normal Rainfall is based on the rainfall recorded during the period from 1951 to 2000

Climate Vulnerability Assessment for the Indian Himalayan Region Using a Common Framework
137
Tabl
e 70
: Th
e va
lues
giv
en to
the
indi
cato
rs a
nd th
e no
rmal
ised
sco
res
for t
he in
dica
tors
.
Dis
tric
tIn
dica
tors
Slop
eFo
rest
Yiel
d va
riab
ility
Popu
lati
on
dens
ity
Fem
ale
liter
acy
rate
IMR/
doct
ors
Per C
apit
a In
com
eM
GN
REG
A
AVN
VAV
NV
AVN
VAV
NV
AVN
VAV
NV
AVN
VAV
NV
Alm
ora
22.2
20.
4254
.64
0.31
8.93
0.61
198.
310.
269
.93
0.53
200
9678
60.
9226
.44
0.79
Bhag
eshw
ar41
.78
0.8
56.2
70.
289.
440.
6811
5.72
0.09
69.0
30.
5831
0.23
1001
170.
994
.44
0
Cham
oli
33.9
40.
6533
.74
0.69
4.29
048
.77
0.01
72.3
20.
3827
0.14
1184
480.
7923
.13
0.82
Cham
paw
at0.
290
69.3
10.
0411
.87
114
7.03
0.13
68.0
50.
6435
0.31
9059
60.
9536
.09
0.67
Deh
radu
n0.
270
43.1
30.
528.
850.
654
9.45
0.66
78.5
40
370.
3619
5925
0.34
9.38
0.98
Paur
iGar
hwal
0.16
063
.69
0.14
7.84
0.46
128.
970.
1172
.60.
3641
0.44
1099
730.
8417
.59
0.89
Har
idw
ar27
.05
0.52
24.9
20.
859.
490.
6880
1.03
164
.79
0.85
671
2540
500
8.36
1
Nai
nita
l20
.12
0.38
71.7
08.
430.
5422
4.56
0.24
77.2
90.
0730
0.21
1151
170.
8111
.53
0.96
Pith
orag
arh
51.7
61
29.3
10.
776.
230.
2568
.19
0.03
72.2
90.
3820
010
1734
0.89
32.7
40.
71
Rudr
apra
yag
29.4
30.
5657
.51
0.26
5.14
0.11
122.
120.
170
.35
0.5
200
8352
11
45.1
20.
57
Tehr
i Gar
hwal
46.8
0.9
56.7
0.27
6.81
0.33
169.
940.
1664
.28
0.88
580.
883
662
0.99
69.4
20.
29
Udh
am S
ingh
N
agar
0.01
017
.15
16.
20.
2564
8.66
0.79
64.4
50.
8736
0.34
1873
130.
399.
210.
99
Utt
arka
shi
29.3
30.
5637
.77
0.62
7.02
0.36
41.1
80
62.3
51
420.
4689
190
0.96
83.8
80.
12

138
Table 71: Weights assigned based on relative importance of each indicator
Table 72: Vulnerability index values and ranks corresponding to each district in the state.
Table 73: Social profile of Darjeeling and Kalimpong districts.
Indicator Weights (WI) Weights to be multiplied with normalisedscores (WI*Wi)
Slope 24 138.96
Area under forest 8 46
Yield variability 22 129.14
IMR/doctors 5 17.6
Population density 5 35.2
Female literacy rate 8 34.32
Per capita income 20 195.6
MGNREGA 8 70.32
Total 100
District VI VI Rank
Almora 0.54719 6
Bhageshwar 0.59942 3
Chamoli 0.46998 9
Champawat 0.53562 7
Dehradun 0.38503 13
Haridwar 0.59748 4
Nainital 0.48629 8
Pauri Garhwal 0.41565 11
Pithoragarh 0.6155 2
Rudraprayag 0.45842 10
Tehri Garhwal 0.65256 1
Udham Singh Nagar 0.40377 12
Uttarkashi 0.5557 5
District Block Total population Sex ratio(females/1,000 males)
Darjeeling Pulbazar 245740 998
JorebunglowSukiapokhri 231644 1018
RangliRangliot 70125 1002
Kurseong 135535 998
Mirik 57887 990
Matigara 1081583 947
Naxalbari 165523 946
Phansidewa 204811 971
Kharibari 109594 962
Kalimpong Kalimpong 1 124149 975
Kalimpong 2 66830 934
Gorubathan 60663 953
West Bengal (Darjeeling Himalayan Region)

Climate Vulnerability Assessment for the Indian Himalayan Region Using a Common Framework
139
Table74: LandUsePattern in Darjeeling and Kalimpong districts.
Table75: Normalmonsoonrainfallandpercentagedepartureofrainfallin2016fromthenormalin
District Block Total geographical
area (ha)
Forest (ha) Net area sown Gross cropped area (ha)
Cropping intensity
(%)
Area (ha) % Area (ha) %
Darjeeling Darjeeling Pulbazar
41,960 27,260 65.82 17,023.8 40.57 3,013.63 564.89
Jorebunglow Sukiapokhri
20,962 7,098.5 33.86 11,060.8 52.77 872.57 1,267.61
Kharibari 14,431 608.38 4.22 9,190.01 63.68 13,284.76 69.18
Kurseong 33,417 18,508 55.39 20,482.7 61.29 4,044.93 506.38
Matigara 16,619 4,131.9 24.86 7,946.66 47.82 8,494.24 93.55
Mirik 11,958 5,019.1 41.97 7,510.55 62.81 1,441.47 521.03
Naxalbari 17,824 3,817 21.42 10,108.3 56.71 16,422.33 61.55
Phansidewa 30,885 152.41 0.49 22,760.3 73.69 27,220.34 83.62
RangliRangliot 17,485 7,446.6 42.59 9,597.3 54.89 6,991.00 137.28
Kalimpong Gorubathan 44,455 36,381 81.84 15,313.5 34.45 3,629.47 421.92
Kalimpong 1 37,138 29,449 79.30 11,337.5 30.53 9,894.10 114.59
Kalimpong 2 27,630 20,019 72.45 6,834.11 24.73 5,444.59 125.52
Month Normal rainfall in mm % Departure of rainfall
January 6.5 -87
February 3.0 -91
March 46.3 -20
April 34.0 -74
May 191.4 -27
June 727.9 36
July 1,168.3 54
August 310.9 -52
September 535.0 6
October 306.2 157
November 0 -100
December 0 -100

140
Tabl
e76:
The
val
ues
give
n to
the
indi
cato
rs a
nd th
e no
rmal
ised
sco
res
for t
he in
dica
tors
.
Dis
tric
t>3
0° S
lope
co
ver
Fore
st c
over
Popu
lati
onde
nsit
yFe
mal
e lit
erac
y ra
teM
GN
REG
A
(201
4-15
)IM
RCr
op y
ield
va
riab
ility
AVN
VAV
NV
AVN
VAV
NV
AVN
VAV
NV
AVN
V
Dar
jeel
ing
Pulb
azar
34.1
61.
000
65.8
20.
197
586
0.15
9 47
.37
0.00
0 40
0.65
556
0.10
118
.568
0.32
6
Jore
bung
low
24.9
60.
731
33.8
60.
590
538
0.14
246
.14
0.24
941
0.63
82
0.01
550
558
0.02
8
Suki
apok
hri
0.01
04.
220.
954
757
0.22
042
.45
1.00
024
0.93
13
0.03
313
.480
0.21
0
Kurs
eong
21.5
70.
632
55.3
90.
325
406
0.09
546
.70
0.13
557
0.36
26
0.12
119
.378
0.34
5
Mat
igar
a5.
250.
154
24.8
60.
700
2959
1.00
045
.62
0.35
627
0.87
943
1.00
021
.158
0.38
5
Miri
k17
.42
0.51
041
.91
0.49
047
90.
121
45.6
00.
359
470.
534
40.
071
8.78
30.
102
Nax
alba
ri0.
040.
001
21.4
20.
743
929
0.28
143
.73
0.74
030
0.82
81
08.
304
0.09
1
Phan
side
wa
0.05
0.00
10.
491.
000
662
0.18
242
.86
0.91
620
1.00
02
0.00
812
.809
0.19
4
Rang
liRan
glio
t25
.99
0.76
142
.59
0.48
340
10.
094
45.7
20.
335
460.
552
60.
112
48.0
141.
000
Gor
ubat
han
24.2
30.
709
81.8
40
136
044
.05
0.67
556
0.37
93
0.04
64.
323
0
Kalim
pong
- I
28.6
60.
839
79.3
00.
0131
334
0.07
046
.75
0.12
664
0.24
113
0.27
912
.639
0.19
0
Kalim
pong
– II
32
.34
0.94
772
.45
0.11
524
20.
037
44.4
90.
586
780
20.
012
12.8
690.
196

Climate Vulnerability Assessment for the Indian Himalayan Region Using a Common Framework
141
Table 77: Weights assigned to indicators based on relative importance
Table 78: Vulnerability index values and corresponding ranks of blocks in the districts
Indicator Weights (WI)
Slope (%area) 17
Forests (%area) 15
Yield variability 15
Population density 15
% of female literacy rate 10
No. of child death (up to 5 years) 10
MGNREGA 18
100
Block VI mean
VI rank
Matigara 0.078 1
RangliRangliot 0.073 2
Phansidewa 0.069 3
Kharibari 0.068 4
Darjeeling-Pulbazar 0.057 5
Naxalbari 0.056 6
Jorebunglow – Sukiapokhri 0.054 7
Mirik 0.048 8
Kurseong 0.045 9
Kalimpong - II 0.039 10
Kalimpong – I 0.039 11
Gorubathan 0.037 12

142

Climate Vulnerability Assessment for the Indian Himalayan Region Using a Common Framework
143

144
About DST NMSHE
The Department of Science and Technology (DST) was established in May 1971, with the objective of promoting new areas of Science & Technology and to play the role of a nodal department for organising, coordinating and promoting S&T activities in the country.
The National Mission for Sustaining the Himalayan Ecosystem (NMSHE) coordinated by the Department of Science and Technology, is one of the eight missions under India’s National Action Plan on Climate Change. The broad objectives of NMSHE include - understanding of the complex processes affecting the Himalayan Ecosystem and evolve suitable management and policy measures for sustaining and safeguarding the Himalayan ecosystem, creating and building capacities in different domains, networking of knowledge institutions engaged in research and development of a coherent data base on Himalayan ecosystem, detecting and decoupling natural and anthropogenic induced signals of global environmental changes in mountain ecosystems, studying traditional knowledge systems for community participation in adaptation, mitigation and coping mechanisms inclusive of farming and traditional health care systems and developing regional cooperation with neighbouring countries, to generate a strong data base through monitoring and analysis, to eventually create a knowledge base for policy interventions.
About SDC IHCAP
The Swiss Agency for Development and Cooperation (SDC) has been a partner of India for more than sixty years. Since 2011, SDC’s programme focuses speciffically on the issue of climate change and environment.
The Indian Himalayas Climate Adaptation Programme (IHCAP) is a project under the Global Programme Climate Change and Environment (GPCCE) of SDC, and is being implemented in partnership with the Department of Science and Technology (DST), Government of India. IHCAP is supporting the implementation of the National Mission for Sustaining the Himalayan Ecosystem (NMSHE) as a knowledge and technical partner. The overall goal of IHCAP is to strengthen the resilience of vulnerable communities in the Himalayas and to enhance and connect the knowledge and capacities of research institutions, communities and decision-makers.
All Rights Reserved. Published in India
This report is available in the electronic form at:
http://www.dst.gov.in/
http://www.ihcap.in/resources.html