climate transition in a portfolio context: what matters
TRANSCRIPT

JULY 2020
Introduction
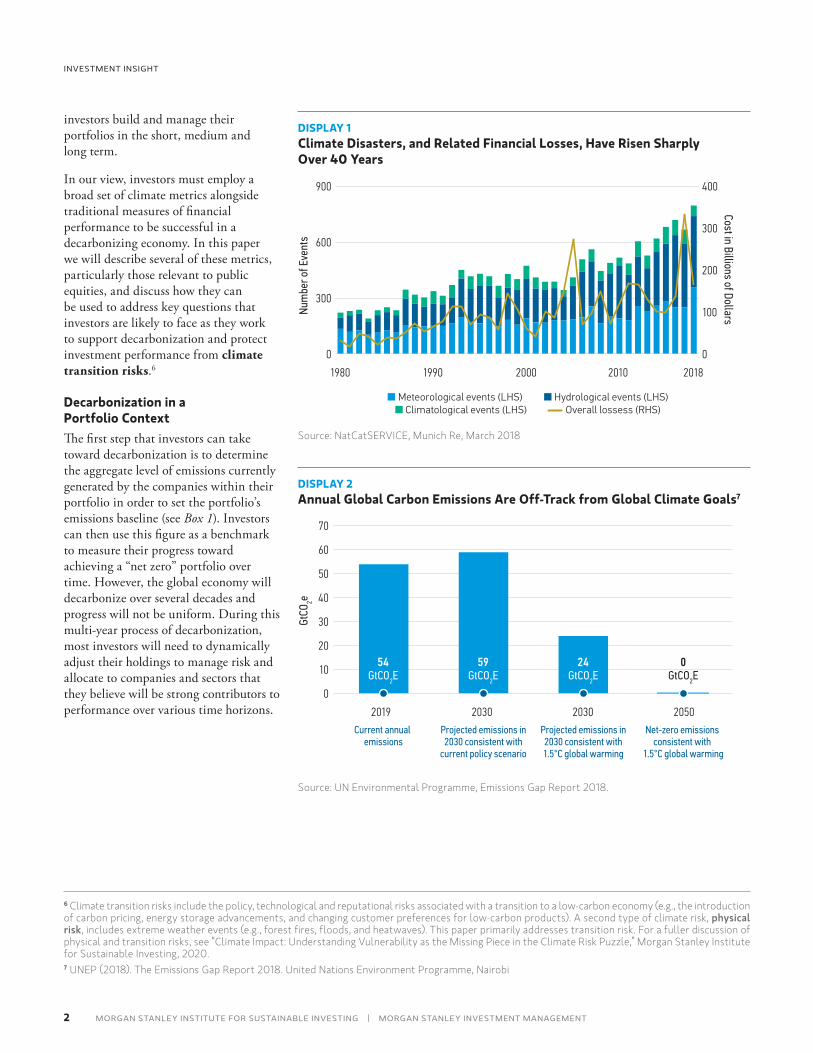
Climate change is an economic reality and a growing risk that investors, businesses and governments are learning to address. As the impacts of climate change mount, as shown in Display 1, it has become well understood that greenhouse gas emissions resulting from human activity are the primary cause of climate change, and must decrease dramatically in order to avoid the worst projected economic and environmental impacts.1
Please see end of paper for important disclaimers.1 A failure to contain carbon emissions and global average temperature rise will result in more intense and frequent extreme weather events and severe negative impacts on resources, ecosystems, biodiversity, food security, cities and tourism. See: Intergovernmental Panel on Climate Change (IPCC). https://www.ipcc.ch/site/assets/uploads/2018/02/AR5_SYR_FINAL_SPM.pdf2 IPCC https://www.ipcc.ch/site/assets/uploads/2018/02/AR5_SYR_FINAL_SPM.pdf3 While these projections were made prior to the COVID-19 pandemic, there is not yet sufficient evidence to suggest that the economic impacts of the pandemic have fundamentally altered the underlying emissions profile of the economy. This will depend on how economic recovery efforts are pursued.4 See “Investment Portfolios in a Carbon Constrained World,” UNEP FI and CDP, 2016. https://www.unepfi.org/wordpress/wp-content/uploads/2016/11/PDCreport2016.pdf5 Throughout the remainder of this piece, “carbon” and “carbon emissions” should be interpreted as the carbon dioxide equivalent (CO2e) of the six major greenhouse gases. Refer to Key Terms section for details.
Climate Transition in a Portfolio Context: What Matters and What to Measure
Specifically, the global economy must limit average global temperature rise to 1.5˚C above pre-industrial levels. By 2050, this will require reaching a “net zero” emissions state in which any emissions produced would be offset by removing others from the atmosphere.2 However, the global economy is off-track. As shown in Display 2, global emissions are currently anticipated to increase over the next 10 years, instead of falling by half.3
Decarbonization, or the systematic effort of governments and companies to align themselves with a low-carbon economy through the reduction in carbon emissions, has moved to the forefront of business and investment conversations.4,5 We believe that this trend will continue to gain momentum and will impact corporate performance for decades to come. This, in turn, will give rise to compelling investment opportunities and affect the way that
This material was developed by the Morgan Stanley Investment Management Portfolio Solutions Group (PSG) and the Morgan Stanley Institute for Sustainable Investing. The statements above reflect the opinions and views of PSG and Morgan Stanley Institute for Sustainable Investing as of the date hereof and not as of any future date and will not be updated or supplemented. All forecasts are speculative, subject to change at any time and may not come to pass due to economic and market conditions.
2
INVESTMENT INSIGHT
MORGAN STANLEY INSTITUTE FOR SUSTAINABLE INVESTING | MORGAN STANLEY INVESTMENT MANAGEMENT
investors build and manage their portfolios in the short, medium and long term.
In our view, investors must employ a broad set of climate metrics alongside traditional measures of financial performance to be successful in a decarbonizing economy. In this paper we will describe several of these metrics, particularly those relevant to public equities, and discuss how they can be used to address key questions that investors are likely to face as they work to support decarbonization and protect investment performance from climate transition risks.6
Decarbonization in a Portfolio ContextThe first step that investors can take toward decarbonization is to determine the aggregate level of emissions currently generated by the companies within their portfolio in order to set the portfolio’s emissions baseline (see Box 1). Investors can then use this figure as a benchmark to measure their progress toward achieving a “net zero” portfolio over time. However, the global economy will decarbonize over several decades and progress will not be uniform. During this multi-year process of decarbonization, most investors will need to dynamically adjust their holdings to manage risk and allocate to companies and sectors that they believe will be strong contributors to performance over various time horizons.
6 Climate transition risks include the policy, technological and reputational risks associated with a transition to a low-carbon economy (e.g., the introduction of carbon pricing, energy storage advancements, and changing customer preferences for low-carbon products). A second type of climate risk, physical risk, includes extreme weather events (e.g., forest fires, floods, and heatwaves). This paper primarily addresses transition risk. For a fuller discussion of physical and transition risks, see “Climate Impact: Understanding Vulnerability as the Missing Piece in the Climate Risk Puzzle,” Morgan Stanley Institute for Sustainable Investing, 2020.7 UNEP (2018). The Emissions Gap Report 2018. United Nations Environment Programme, Nairobi
DISPLAY 1Climate Disasters, and Related Financial Losses, Have Risen Sharply Over 40 Years
900
0
1980 2018
300
■ Meteorological events (LHS) ■ Hydrological events (LHS)■ Climatological events (LHS) Overall lossess (RHS)
600
Num
ber o
f Eve
nts
400
0
100
200
Cost in Billions of Dollars
300
1990 2000 2010
Source: NatCatSERVICE, Munich Re, March 2018
DISPLAY 2Annual Global Carbon Emissions Are Off-Track from Global Climate Goals7
70
20
10
0
2019 2030 20502030
30
40
50
60
GtCO
2e
54GtCO2E
59GtCO2E
24GtCO2E
0GtCO2E
Current annual emissions
Projected emissions in2030 consistent with
current policy scenario
Projected emissions in2030 consistent with1.5°C global warming
Net-zero emissions consistent with
1.5°C global warming
Source: UN Environmental Programme, Emissions Gap Report 2018.

3
CLIMATE TRANSITION IN A PORTFOLIO CONTEXT: WHAT MATTERS AND WHAT TO MEASURE
MORGAN STANLEY INVESTMENT MANAGEMENT | MORGAN STANLEY INSTITUTE FOR SUSTAINABLE INVESTING
8 See ‘Key Terms’ section for a complete definition of carbon emissions used in this paper. Source: Greenhouse Gas Protocol, “Technical Guidance for Calculating Scope 3 Emissions (Version 1.0),” https://ghgprotocol.org/sites/default/files/standards/Scope3_Calculation_Guidance_0.pdf and “FAQ,” https://ghgprotocol.org/sites/default/files/standards_supporting/FAQ.pdf.
Box 1: Breaking Down Emissions
SCOPE 1DIRECT
SCOPE 3INDIRECT
investmentsprocessing ofsold products
franchisesuse of soldproducts
end-of-lifetreatment of sold
products
transportationand distribution
companyvehicles
Upstream activities Reporting company Downstream activities
companyfacilities
leased assets
SCOPE 3INDIRECT
purchased electricity, steam, heating & cooling for own use
leased assets
businesstravel
employeecommuting
capital goods
purchasedgoods and services
fuel and energyrelated activities
transportationand distribution waste
generated inoperations
CO2 CH4 N2O HFCs PFCs SF6
SCOPE 2INDIRECT
Source: Greenhouse Gas Protocol
Every company is responsible for three types of carbon emissions:8
• Scope 1 Emissions: Direct emissions from owned or controlled sources
• Scope 2 Emissions: Indirect emissions from the generation of purchased energy
• Scope 3 Emissions: Indirect emissions (not included in Scope 2) that occur in the value chain of the reporting company, including both upstream and downstream emissions.

4
INVESTMENT INSIGHT
MORGAN STANLEY INSTITUTE FOR SUSTAINABLE INVESTING | MORGAN STANLEY INVESTMENT MANAGEMENT
In our view, a broader set of climate metrics can enable a more holistic understanding of the risks and opportunities that the decarbonization pathway presents and potentially help avoid unintended biases or tilts in equity portfolios. We describe five key climate metrics in Display 3.
Much as they would for alpha, sector, style and geography, equity investors should consider and articulate a clear set
of decarbonization preferences to inform appropriate portfolio construction. Once these are established, certain combinations of climate metrics may warrant greater emphasis than others.
For example, some investors may prioritize limiting exposure to high-emitting companies or sectors as a means to mitigate future downside risk. Here, carbon emissions, carbon intensity or industry sector may be the most salient
metrics. Other investors may prioritize investments proactively contributing to decarbonizing the real economy. In this case, closer attention may be placed on climate change revenues and strong emissions reduction targets.9 For investors taking a holistic approach to ESG integration, emissions reduction targets or carbon earnings at risk may factor into analysis where most material to certain industry sectors.
DISPLAY 3Key Climate Metrics for Investors
METRIC UNITS DESCRIPTION KEY INSIGHTS
Carbon Emissions Tons CO2e A measure of carbon emissions from a company’s activities, also referred to as absolute emissions. (See Box 1 above for more detail).Note: this paper relies on analysis of Scope 1 and Scope 2 emissions, due to limited availability and quality of Scope 3 data.
• Backward-looking, point-in-time snapshot due to tracking and reporting methods
• Inclusion of appropriate Scope 3 emissions (still only disclosed by a minority of companies) would give a true indication of the total carbon impact of a company’s business
Carbon Intensity Tons CO2e/ Revenue
A normalized measure of carbon emissions, using revenue to account for differences in company size. It can be interpreted as a measure of efficiency with respect to emissions.Note: this paper relies on analysis of Scope 1 and Scope 2 emissions, due to limited availability and quality of Scope 3 data.
• Backward-looking, point-in-time snapshot due to tracking and reporting methods
• Normalization by revenue allows for comparison across holdings and portfolios of different sizes, distinct from absolute emissions
• Avoids double-counting associated with absolute carbon emissions (e.g., one company’s direct emissions counting toward another’s indirect emissions) at the portfolio level
Emissions Reduction Target
Yes/No(may be further scored or qualitatively assessed)
A baseline indicator for whether a company has made a public commitment to reduce its emissions. Methodologies are evolving to further assess the strength of targets based on breadth, quality and associated plans to achieve them.
• Forward-looking indicator of a company’s approach to emissions reduction, akin to earnings guidance
• More meaningful for high-emitting companies and sectors
• Quality, specificity and time horizon of targets currently vary
Carbon Earnings at Risk (“CEaR”)
% of EBITDA The estimated present value of future earnings loss based on a company’s current Scope 1 & 2 emissions and the projected price path of carbon emissions, determined based on the required energy mix to achieve a given global warming scenario.
• Forward-looking scenario analysis, akin to Value at Risk (VaR), blending climate and financial information
• Accounts for level, sector and geography of Scope 1 & 2 emissions, while holding current earnings and emissions constant
• Most relevant at this stage to pricing of climate transition risk rather than physical risk
Climate Change Revenues
1-10 Score, based on type and % of Revenue
A score based on the percent of current revenue tied to products and services mapped to activities addressing (or aggravating) the root causes of climate change. Score is also influenced by the strength of the link between underlying products and services and climate change impacts.
• Point-in-time revenue tied to positive climate impacts may indicate future upside potential
• Point-in-time revenue tied to negative climate impacts may serve as a proxy for Scope 3 (downstream) emissions, among other risks
9 Thematic private markets investments and labeled green or sustainable bonds can also be considered beyond the public equities context.

5
CLIMATE TRANSITION IN A PORTFOLIO CONTEXT: WHAT MATTERS AND WHAT TO MEASURE
MORGAN STANLEY INVESTMENT MANAGEMENT | MORGAN STANLEY INSTITUTE FOR SUSTAINABLE INVESTING
SECTOR CARBON INTENSITY DISTRIBUTION11WEIGHTED AVERAGE
CARBON INTENSITYMAXIMUM CARBON
INTENSITY
8 3,38126 21125 53237 81453 2,307
115 1,79063 2,471
135 6,467467 36,468852 12,519
2,278 33,754
In Display 4, we seek to demonstrate how investors can use these metrics in support of their specific decarbonization objectives.
While not an exhaustive list, we believe these climate metrics can equip
investors to address four important and interconnected questions that are likely to arise as they seek to align their portfolios with a decarbonizing economy in accordance with their overall performance goals.
QUESTION 1: How Do Sector and Security Selection Decisions Impact Carbon Intensity at the Portfolio Level?Much like traditional performance attribution, carbon intensity can be driven by a combination of sector and
DISPLAY 4Aligning Key Climate Metrics with Decarbonization Objectives
Primary Climate Objective
DECARBONIZING A PORTFOLIOMinimizing exposure to carbon-intense sectors through a risk-focused lens
DECARBONIZING THE REAL ECONOMYContributing to positive climate impacts through
a risk and opportunity lens
Approach to Sustainable Investing
Restriction Screening ESG Integration Thematic & Impact Investing
Company Engagement
Key Climate Metrics • Carbon emissions• Carbon intensity• Industry sector
• Carbon earnings at risk• Emissions reduction targets
• Climate change revenues• Industry sector
• Carbon emissions• Carbon intensity• Emissions reduction targets
Illustrative Strategy Intentionally avoiding investments in issuers or sectors at high risk of negative impact from climate transition risks, as assessed by carbon emissions, carbon intensity or industry sector
Considering climate related criteria, such as carbon earnings at risk and emissions reduction targets, alongside financial analysis to identify risks and opportunities throughout the investment process
Tilting investments toward issuers or sectors positioned to deliver solutions for a low-carbon economy, as assessed by climate change revenues or industry sector
Seeking to drive improvement on climate change activities and outcomes—such as carbon emissions, carbon intensity or emissions reduction targets—through proxy voting and/or active dialogue with invested companies
10 Sources: S&P Trucost, MSCI Index, Morgan Stanley analysis.11 For each sector, shaded boxes represent the interquartile range (25th to 75th percentile) of carbon intensity, while the whiskers extend to 1.5 times the interquartile range.
DISPLAY 5Scope 1 & 2 Carbon Emissions Vary Significantly by Sector10
MSCI ACWI Universe as of 12/31/2019
FinancialsCommunications Services
Health CareInformation Technology
Consumer DiscretionaryReal Estate
Consumer StaplesIndustrials
EnergyMaterials
Utilities
0K
Average Carbon Intensity (Scope 1 & 2 tons CO2e/Revenue USD mm)
12K10K8K6K4K2K
6
INVESTMENT INSIGHT
MORGAN STANLEY INSTITUTE FOR SUSTAINABLE INVESTING | MORGAN STANLEY INVESTMENT MANAGEMENT
security selection. In a portfolio context, relative allocations to high-emitting sectors, such as energy and utilities, or low-emitting sectors, such as financials and communication services, can have an outsized impact. By the same token, sectors with a wide range of emissions intensities, such as industrials or consumer discretionary, present a significant opportunity to optimize the carbon profile through individual security selection.
Display 5 shows the weighted average and range of carbon intensity for sectors of the MSCI ACWI universe as an example. This type of analysis can complement other efforts to manage sector exposures across a portfolio in relation to a given benchmark.
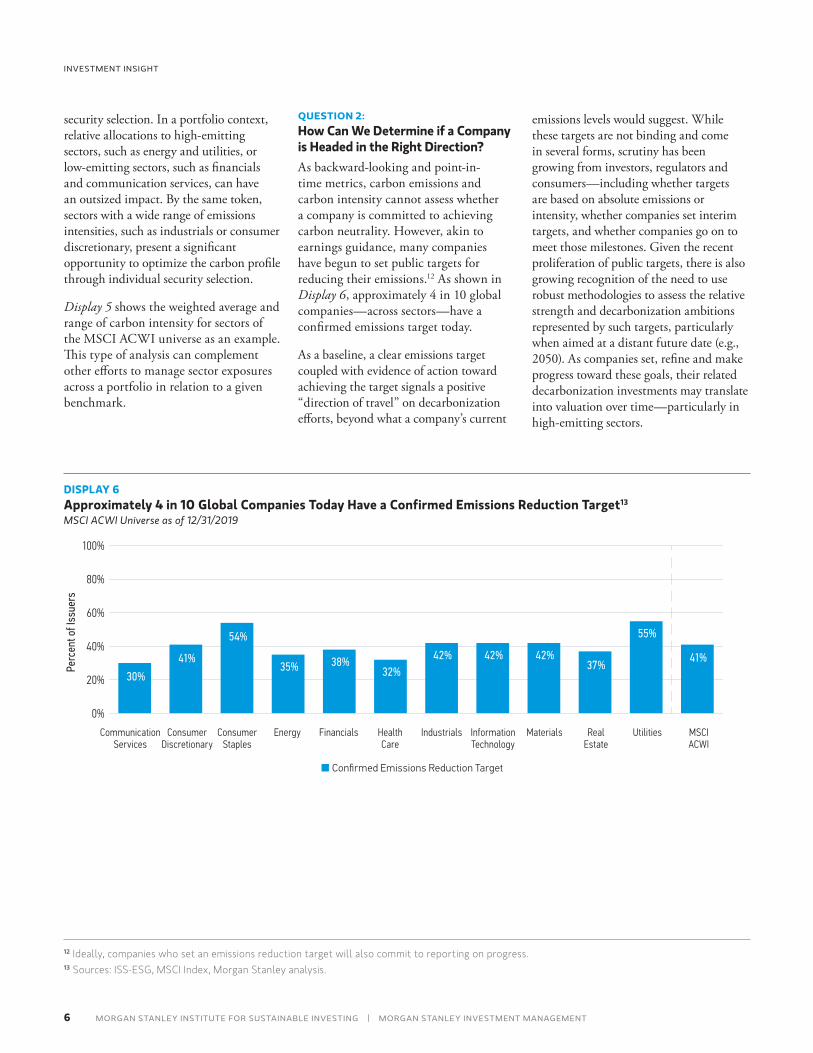
QUESTION 2: How Can We Determine if a Company is Headed in the Right Direction?As backward-looking and point-in-time metrics, carbon emissions and carbon intensity cannot assess whether a company is committed to achieving carbon neutrality. However, akin to earnings guidance, many companies have begun to set public targets for reducing their emissions.12 As shown in Display 6, approximately 4 in 10 global companies—across sectors—have a confirmed emissions target today.
As a baseline, a clear emissions target coupled with evidence of action toward achieving the target signals a positive “direction of travel” on decarbonization efforts, beyond what a company’s current
emissions levels would suggest. While these targets are not binding and come in several forms, scrutiny has been growing from investors, regulators and consumers—including whether targets are based on absolute emissions or intensity, whether companies set interim targets, and whether companies go on to meet those milestones. Given the recent proliferation of public targets, there is also growing recognition of the need to use robust methodologies to assess the relative strength and decarbonization ambitions represented by such targets, particularly when aimed at a distant future date (e.g., 2050). As companies set, refine and make progress toward these goals, their related decarbonization investments may translate into valuation over time—particularly in high-emitting sectors.
DISPLAY 6Approximately 4 in 10 Global Companies Today Have a Confirmed Emissions Reduction Target13
MSCI ACWI Universe as of 12/31/2019
100%
40%
20%
0%
CommunicationServices
ConsumerDiscretionary
FinancialsEnergy HealthCare
ConsumerStaples
60%
30%
41%
InformationTechnology
Industrials Materials
Perc
ent o
f Iss
uers
35%
54%
RealEstate
Utilities
80%
38%32%
42% 42% 42%37%
55%
41%
MSCIACWI
■ Confirmed Emissions Reduction Target
12 Ideally, companies who set an emissions reduction target will also commit to reporting on progress.13 Sources: ISS-ESG, MSCI Index, Morgan Stanley analysis.
7
CLIMATE TRANSITION IN A PORTFOLIO CONTEXT: WHAT MATTERS AND WHAT TO MEASURE
MORGAN STANLEY INVESTMENT MANAGEMENT | MORGAN STANLEY INSTITUTE FOR SUSTAINABLE INVESTING
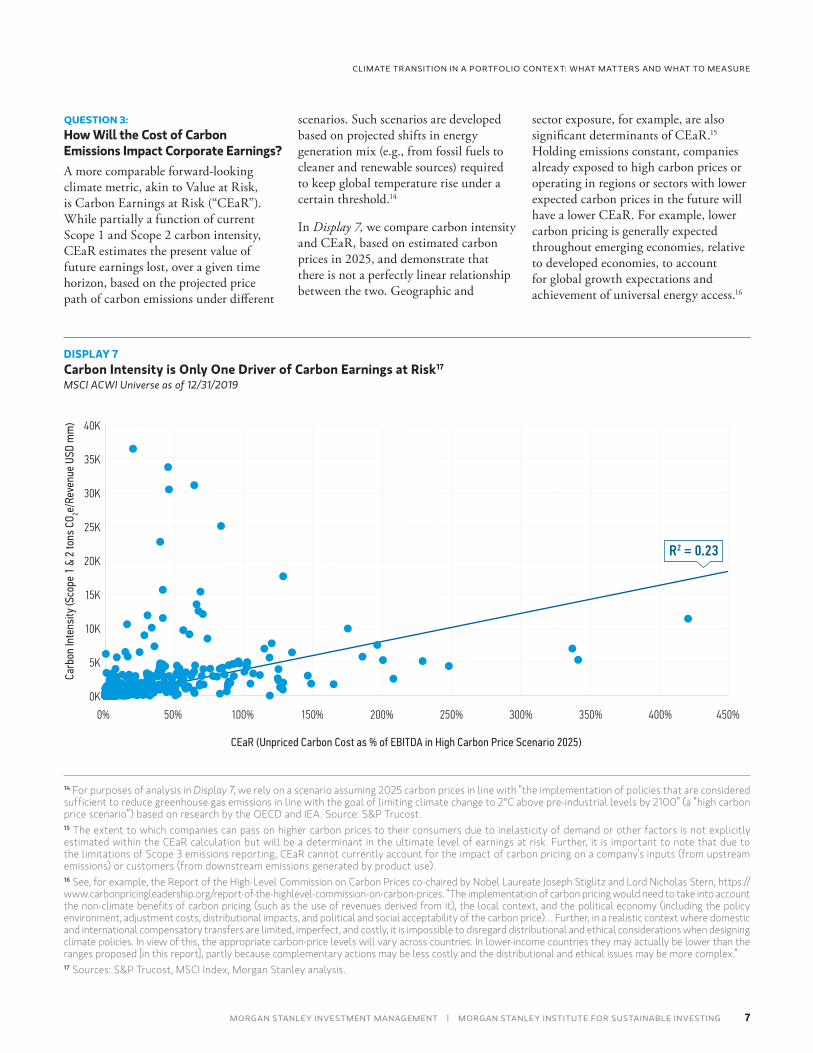
QUESTION 3: How Will the Cost of Carbon Emissions Impact Corporate Earnings?A more comparable forward-looking climate metric, akin to Value at Risk, is Carbon Earnings at Risk (“CEaR”). While partially a function of current Scope 1 and Scope 2 carbon intensity, CEaR estimates the present value of future earnings lost, over a given time horizon, based on the projected price path of carbon emissions under different
scenarios. Such scenarios are developed based on projected shifts in energy generation mix (e.g., from fossil fuels to cleaner and renewable sources) required to keep global temperature rise under a certain threshold.14
In Display 7, we compare carbon intensity and CEaR, based on estimated carbon prices in 2025, and demonstrate that there is not a perfectly linear relationship between the two. Geographic and
sector exposure, for example, are also significant determinants of CEaR.15 Holding emissions constant, companies already exposed to high carbon prices or operating in regions or sectors with lower expected carbon prices in the future will have a lower CEaR. For example, lower carbon pricing is generally expected throughout emerging economies, relative to developed economies, to account for global growth expectations and achievement of universal energy access.16
DISPLAY 7Carbon Intensity is Only One Driver of Carbon Earnings at Risk17
MSCI ACWI Universe as of 12/31/2019
5K
0K
25K
Carb
on In
tens
ity (S
cope
1 &
2 to
ns C
O 2e/Re
venu
e US
D m
m)
30K
0% 400%300%200%100%
CEaR (Unpriced Carbon Cost as % of EBITDA in High Carbon Price Scenario 2025)
R2 = 0.23
35K
20K
15K
10K
50% 150% 250% 350% 450%
40K
14 For purposes of analysis in Display 7, we rely on a scenario assuming 2025 carbon prices in line with “the implementation of policies that are considered sufficient to reduce greenhouse gas emissions in line with the goal of limiting climate change to 2°C above pre-industrial levels by 2100” (a “high carbon price scenario”) based on research by the OECD and IEA. Source: S&P Trucost.15 The extent to which companies can pass on higher carbon prices to their consumers due to inelasticity of demand or other factors is not explicitly estimated within the CEaR calculation but will be a determinant in the ultimate level of earnings at risk. Further, it is important to note that due to the limitations of Scope 3 emissions reporting, CEaR cannot currently account for the impact of carbon pricing on a company’s inputs (from upstream emissions) or customers (from downstream emissions generated by product use).16 See, for example, the Report of the High-Level Commission on Carbon Prices co-chaired by Nobel Laureate Joseph Stiglitz and Lord Nicholas Stern, https://www.carbonpricingleadership.org/report-of-the-highlevel-commission-on-carbon-prices. “The implementation of carbon pricing would need to take into account the non-climate benefits of carbon pricing (such as the use of revenues derived from it), the local context, and the political economy (including the policy environment, adjustment costs, distributional impacts, and political and social acceptability of the carbon price)… Further, in a realistic context where domestic and international compensatory transfers are limited, imperfect, and costly, it is impossible to disregard distributional and ethical considerations when designing climate policies. In view of this, the appropriate carbon-price levels will vary across countries. In lower-income countries they may actually be lower than the ranges proposed [in this report], partly because complementary actions may be less costly and the distributional and ethical issues may be more complex.”17 Sources: S&P Trucost, MSCI Index, Morgan Stanley analysis.
8
INVESTMENT INSIGHT
MORGAN STANLEY INSTITUTE FOR SUSTAINABLE INVESTING | MORGAN STANLEY INVESTMENT MANAGEMENT
Based on an investor’s time horizon and outlook on carbon pricing, CEaR should be considered dynamically, in addition to carbon intensity, for a more comprehensive evaluation of climate risk—especially in high-emitting sectors.
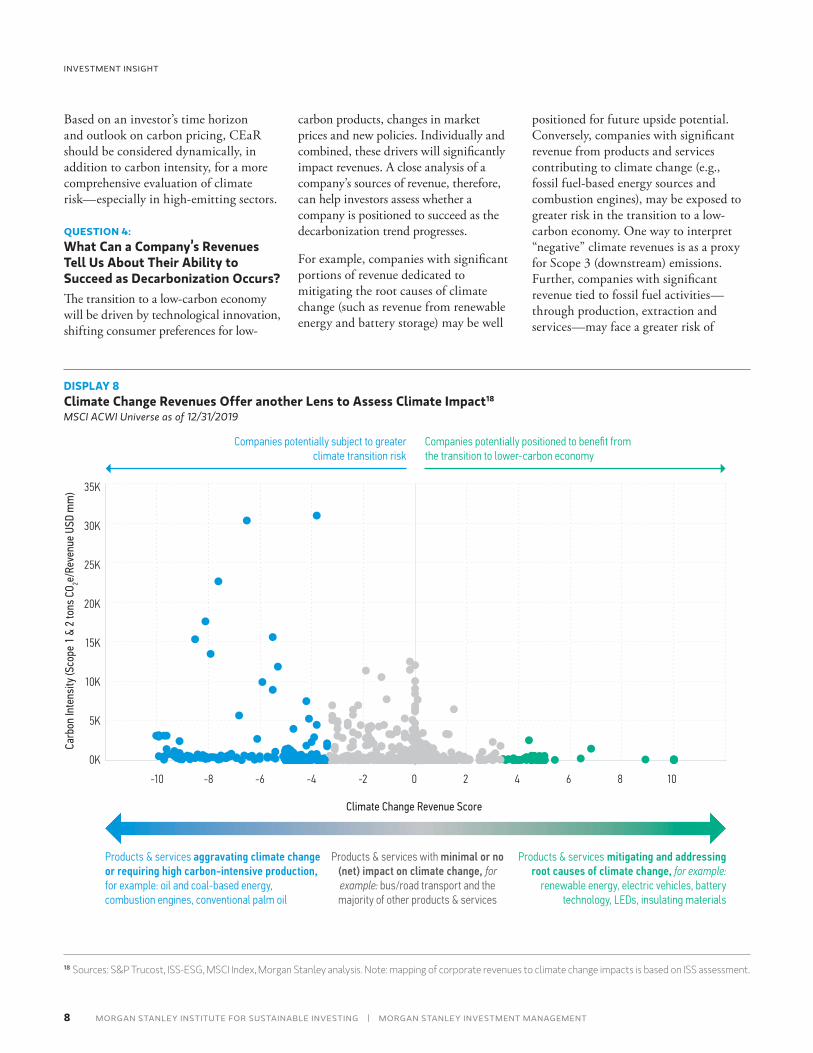
QUESTION 4: What Can a Company’s Revenues Tell Us About Their Ability to Succeed as Decarbonization Occurs?The transition to a low-carbon economy will be driven by technological innovation, shifting consumer preferences for low-
carbon products, changes in market prices and new policies. Individually and combined, these drivers will significantly impact revenues. A close analysis of a company’s sources of revenue, therefore, can help investors assess whether a company is positioned to succeed as the decarbonization trend progresses.
For example, companies with significant portions of revenue dedicated to mitigating the root causes of climate change (such as revenue from renewable energy and battery storage) may be well
positioned for future upside potential. Conversely, companies with significant revenue from products and services contributing to climate change (e.g., fossil fuel-based energy sources and combustion engines), may be exposed to greater risk in the transition to a low-carbon economy. One way to interpret “negative” climate revenues is as a proxy for Scope 3 (downstream) emissions. Further, companies with significant revenue tied to fossil fuel activities—through production, extraction and services—may face a greater risk of
DISPLAY 8Climate Change Revenues Offer another Lens to Assess Climate Impact18
MSCI ACWI Universe as of 12/31/2019
25K
10K
0K
20K
Carb
on In
tens
ity (S
cope
1 &
2 to
ns C
O 2e/Re
venu
e US
D m
m)
30K
10-10 20-2
Climate Change Revenue Score
-4-6-8 864
15K
5K
Products & services aggravating climate changeor requiring high carbon-intensive production,for example: oil and coal-based energy, combustion engines, conventional palm oil
Products & services with minimal or no(net) impact on climate change, forexample: bus/road transport and themajority of other products & services
Products & services mitigating and addressingroot causes of climate change, for example:
renewable energy, electric vehicles, batterytechnology, LEDs, insulating materials
Companies potentially subject to greaterclimate transition risk
Companies potentially positioned to benefit from the transition to lower-carbon economy
35K
18 Sources: S&P Trucost, ISS-ESG, MSCI Index, Morgan Stanley analysis. Note: mapping of corporate revenues to climate change impacts is based on ISS assessment.

9
CLIMATE TRANSITION IN A PORTFOLIO CONTEXT: WHAT MATTERS AND WHAT TO MEASURE
MORGAN STANLEY INVESTMENT MANAGEMENT | MORGAN STANLEY INSTITUTE FOR SUSTAINABLE INVESTING
stranded assets or write-downs, over time, as the global energy mix transitions away from fossil fuels to renewable sources.19
As illustrated in Display 8, climate change revenues are not perfectly correlated with emissions, and can provide another lens through which to select and evaluate companies, particularly in a thematic investment context where an investor seeks to ‘align’ a portfolio with certain real economy decarbonization outcomes.
A Fifth Question …An important question that we allude to, but do not fully address in this paper, is that of timing. At what point is the market likely to reward or penalize
companies for their decarbonization efforts? A framework for addressing this question would equip investors to make more thoughtful strategic and tactical asset allocation decisions. We hope to explore this topic in future papers.
Over time, we also expect an evolution in climate data itself, bringing with it new methods and precision with which investors can position portfolios with respect to decarbonization. Much like the global economy’s transition to a low-carbon future, advancements in climate data may not be uniform and will require calibration alongside traditional financial performance indicators for investors.
Further Reading• Morgan Stanley Institute for
Sustainable Investing, Climate Impact: Understanding Vulnerability as the Missing Piece in the Climate Risk Puzzle (2020)
• Morgan Stanley Investment Management, Five Sectors That Cannot Escape Climate Change (2020)
• Morgan Stanley Investment Management, Six Climate Investing Myths Debunked (2019)
• Morgan Stanley Institute for Sustainable Investing and Morgan Stanley Investment Management, Weathering the Storm: Integrating Climate Resilience Into Real Assets Investing (2018)
Key Terms• CARBON EMISSIONS: For purposes of this piece, carbon
emissions refer to the carbon dioxide equivalent (CO2e) of the six major greenhouse gases (see below).
• DECARBONIZATION: A systematic effort of companies and governments to align themselves with a low-carbon economy through the reduction in carbon emissions.
• GREENHOUSE GASES: As defined by the 1997 Kyoto Protocol, the six greenhouse gases contributing most to climate change are Carbon dioxide (CO2), Methane (CH4), Nitrous oxide (N2O), Hydrofluorocarbons (HFCs), Perfluorocarbons (PFCs), and Sulphur hexafluoride (SF6).
• NET ZERO (EMISSIONS): A state in which any carbon emissions produced are offset by removing carbon from the atmosphere. Reaching net zero emissions by the year 2050 is critical to limiting average global temperature rise to 1.5˚C above pre-industrial levels.
• SCOPE 1 EMISSIONS: Direct emissions from owned or controlled sources.
• SCOPE 2 EMISSIONS: Indirect emissions from the generation of purchased energy.
• SCOPE 3 EMISSIONS: Indirect emissions (not included in Scope 2) that occur in the value chain of the reporting company, including both upstream and downstream emissions. Note: Scope 3 data is not reflected in analyses above, due to limited data quality and coverage.
• PHYSICAL RISK: Acute physical risk refers to the harms created by single events such as extreme weather events like cyclones, wildfires and floods, while chronic physical risk refers to the changes in natural cycles and climate patterns over longer time periods.
• TRANSITION RISK: Risks encompassing the policy and legal, technology, market and reputational changes to organizations stemming from the transition to a low-carbon economy.
19 S&P Trucost
10
INVESTMENT INSIGHT
MORGAN STANLEY INSTITUTE FOR SUSTAINABLE INVESTING | MORGAN STANLEY INVESTMENT MANAGEMENT
About Morgan Stanley Institute for Sustainable InvestingThe Morgan Stanley Institute for Sustainable Investing is housed within the Global Sustainable Finance group and chaired by Morgan Stanley’s Chairman and CEO, James Gorman. The Institute works to accelerate the global adoption of sustainable investing and finance strategies. Its Advisory Board, comprised of corporate, sustainability, academic and philanthropic leaders, helps ensure that our approach to sustainability and sustainable investing is comprehensive, rigorous and innovative.
Morgan Stanley Investment Management leverages and benefits from Morgan Stanley’s decade-plus commitment to sustainable finance. Positioned at the nexus of the firm’s business units and the broader sustainable finance market, the Morgan Stanley Institute for Sustainable Investing serves as a unique resource and partner on innovation, knowledge sharing and thought leadership.
About Morgan Stanley Investment ManagementGlobally, Morgan Stanley Investment Management (MSIM) actively invests more than $550 billion across public and private markets. MSIM’s mission is to serve clients by achieving their investment objectives, and providing a comprehensive array of investment solutions, competitive results and enduring relationships. The global suite of products and services offered span the risk/return spectrum across geographies, investment styles and asset classes, including equity, fixed income, alternatives and private markets.
Across MSIM’s diverse range of investment strategies, the investment philosophy is to generate alpha through active management grounded in sound fundamental research and analytics. The portfolio managers’ demonstrated expertise is built on innovative research, rigorous analysis and high-conviction investment decisions.
MSIM believes that ESG factors influence risk, return and opportunity, and our portfolio managers integrate them in a variety of ways in building client portfolios and making investment decisions. MSIM investment teams, and the Global Stewardship team, engage directly with companies to drive change and promote responsible investing practices. Working with the Institute for Sustainable Investing and Morgan Stanley’s Global Sustainable Finance team, MSIM provides portfolio solutions that help clients meet their environmental, social and governance goals.

11
CLIMATE TRANSITION IN A PORTFOLIO CONTEXT: WHAT MATTERS AND WHAT TO MEASURE
MORGAN STANLEY INVESTMENT MANAGEMENT | MORGAN STANLEY INSTITUTE FOR SUSTAINABLE INVESTING
DISTRIBUTIONThis communication is only intended for and will only be distributed to persons resident in jurisdictions where such distribution or availability would not be contrary to local laws or regulations.Ireland: Morgan Stanley Investment Management (Ireland) Limited. Registered Office: The Observatory, 7-11 Sir John Rogerson’s, Quay, Dublin 2, Ireland. Registered in Ireland under company number 616662. Regulated by the Central Bank of Ireland. United Kingdom: Morgan Stanley Investment Management Limited is authorised and regulated by the Financial Conduct Authority. Registered in England. Registered No. 1981121. Registered Office: 25 Cabot Square, Canary Wharf, London E14 4QA, authorised and regulated by the Financial Conduct Authority. Dubai: Morgan Stanley Investment Management Limited (Representative Office, Unit Precinct 3-7th Floor-Unit 701 and 702, Level 7, Gate Precinct Building 3, Dubai International Financial Centre, Dubai, 506501, United Arab Emirates. Telephone: +97 (0)14 709 7158). Germany: Morgan Stanley Investment Management Limited Niederlassung Deutschland, Grosse Gallusstrasse 18, 60312 Frankfurt am Main, Germany (Gattung: Zweigniederlassung (FDI) gem. § 53b KWG). Italy: Morgan Stanley Investment Management Limited, Milan Branch (Sede Secondaria di Milano) is a branch of Morgan Stanley Investment Management Limited, a company registered in the UK, authorised and regulated by the Financial Conduct Authority (FCA), and whose registered office is at 25 Cabot Square, Canary Wharf, London, E14 4QA. Morgan Stanley Investment Management Limited Milan Branch (Sede Secondaria di Milano) with seat in Palazzo Serbelloni Corso Venezia, 16 20121 Milano, Italy, is registered in Italy with company number and VAT number 08829360968. The Netherlands: Morgan Stanley Investment Management, Rembrandt Tower, 11th Floor Amstelplein 1 1096HA, Netherlands. Telephone: 31 2-0462-1300. Morgan Stanley Investment Management is a branch office of Morgan Stanley Investment Management Limited. Morgan Stanley Investment Management Limited is authorised and regulated by the Financial Conduct Authority in the United Kingdom. Switzerland: Morgan Stanley & Co. International plc, London, Zurich Branch Authorised and regulated by the Eidgenössische Finanzmarktaufsicht (“FINMA”). Registered with the Register of Commerce Zurich CHE-115.415.770. Registered Office: Beethovenstrasse 33, 8002 Zurich, Switzerland, Telephone +41 (0) 44 588 1000. Facsimile Fax: +41 (0) 44 588 1074.U.S.: A separately managed account may not be suitable for all investors. Separate accounts managed according to the Strategy include a number of securities and will not necessarily track the performance of any index. Please consider the investment objectives, risks and fees of the Strategy carefully before investing. A minimum asset level is required. For important information about the investment manager, please refer to Form ADV Part 2.Please consider the investment objectives, risks, charges and expenses of the funds carefully before investing. The prospectuses
contain this and other information about the funds. To obtain a prospectus please download one at morganstanley.com/im or call 1-800-548-7786. Please read the prospectus carefully before investing.Morgan Stanley Distr ibution, Inc . serves as the distr ibutor for Morgan Stanley funds.
NOT FDIC INSURED | OFFER NO BANK GUARANTEE | MAY LOSE VALUE NOT INSURED BY ANY FEDERAL GOVERNMENT AGENCY | NOT A DEPOSIT
Hong Kong: This document has been issued by Morgan Stanley Asia Limited for use in Hong Kong and shall only be made available to “professional investors” as defined under the Securities and Futures Ordinance of Hong Kong (Cap 571). The contents of this document have not been reviewed nor approved by any regulatory authority including the Securities and Futures Commission in Hong Kong. Accordingly, save where an exemption is available under the relevant law, this document shall not be issued, circulated, distributed, directed at, or made available to, the public in Hong Kong. Singapore: This document should not be considered to be the subject of an invitation for subscription or purchase, whether directly or indirectly, to the public or any member of the public in Singapore other than (i) to an institutional investor under section 304 of the Securities and Futures Act, Chapter 289 of Singapore (“SFA”); (ii) to a “relevant person” (which includes an accredited investor) pursuant to section 305 of the SFA, and such distribution is in accordance with the conditions specified in section 305 of the SFA; or (iii) otherwise pursuant to, and in accordance with the conditions of, any other applicable provision of the SFA. This publication has not been reviewed by the Monetary Authority of Singapore. Australia: This publication is disseminated in Australia by Morgan Stanley Investment Management (Australia) Pty Limited ACN: 122040037, AFSL No. 314182, which accept responsibility for its contents. This publication, and any access to it, is intended only for “wholesale clients” within the meaning of the Australian Corporations Act.Japan: For professional investors, this document is circulated or distributed for informational purposes only. For those who are not professional investors, this document is provided in relation to Morgan Stanley Investment Management (Japan) Co., Ltd. (“MSIMJ”)’s business with respect to discretionary investment management agreements (“IMA”) and investment advisory agreements (“IAA”). This is not for the purpose of a recommendation or solicitation of transactions or offers any particular financial instruments. Under an IMA, with respect to management of assets of a client, the client prescribes basic management policies in advance and commissions MSIMJ to make all investment decisions based on an analysis of the value, etc. of the securities, and MSIMJ accepts such commission. The client shall delegate to MSIMJ the authorities necessary for making investment. MSIMJ exercises the delegated
RISK CONSIDERATIONSESG strategies that incorporate impact investing and/or environmental, social and governance (ESG) factors could result in relative investment performance deviating from other strategies or broad market benchmarks, depending on whether such sectors or investments are in or out of favor in the market. As a result, there is no assurance ESG strategies could result in more favorable investment performance.There is no assurance that a portfolio will achieve its investment objective. Portfolios are subject to market risk, which is the possibility that the market values of securities owned by the portfolio will decline and that the value of portfolio shares may therefore be less than what you paid for them. Market values can change daily due to economic and other events (e.g. natural disasters, health crises, terrorism, conflicts and social unrest) that affect markets, countries, companies or governments. It is difficult to predict the timing, duration, and potential adverse effects (e.g. portfolio liquidity) of events. Accordingly, you can lose money investing in a portfolio.In general, equity securities’ values also fluctuate in response to activities specific to a company. Investments in foreign markets entail special risks such as currency, political, economic, and market risks. The risks of investing in emerging market countries are greater than risks associated with investments in foreign developed countries. Fixed income securities are subject to the ability of an issuer to make timely principal and interest payments (credit risk), changes in interest rates (interest-rate risk), the creditworthiness of the issuer and general market liquidity (market risk). In a rising interest-rate environment, bond prices may fall and may result in periods of volatility and increased portfolio redemptions. In a declining interest-rate environment, the portfolio may generate less income. Longer-term securities may be more sensitive to interest rate changes. Real estate investments, including real estate investment trusts, are subject to risks similar to those associated with the direct ownership of real estate.Alternative investments are speculative, involve a high degree of risk, are highly illiquid, typically have higher fees than other investments, and may engage in the use of leverage, short sales, and derivatives, which may increase the risk of investment loss. These investments are designed for investors who understand and are willing to accept these risks. Performance may be volatile, and an investor could lose all or a substantial portion of its investment.

INVESTMENT INSIGHT
© 2020 Morgan Stanley. Morgan Stanley Distribution, Inc. CRC 3136705 Exp. 06/30/2021 9852467_KC_0620US
authorities based on investment decisions of MSIMJ, and the client shall not make individual instructions. All investment profits and losses belong to the clients; principal is not guaranteed. Please consider the investment objectives and nature of risks before investing. As an investment advisory fee for an IAA or an IMA, the amount of assets subject to the contract multiplied by a certain rate (the upper limit is 2.20% per annum (including tax)) shall be incurred in proportion to the contract period. For some strategies, a contingency fee may be incurred in addition to the fee mentioned above.Indirect charges also may be incurred, such as brokerage commissions for incorporated securities. Since these charges and expenses are different depending on a contract and other factors, MSIMJ cannot present the rates, upper limits, etc. in advance. All clients should read the Documents Provided Prior to the Conclusion of a Contract carefully before executing an agreement. This document is disseminated in Japan by MSIMJ, Registered No. 410 (Director of Kanto Local Finance Bureau (Financial Instruments Firms)), Membership: the Japan Securities Dealers Association, The Investment Trusts Association, Japan, the Japan Investment Advisers Association and the Type II Financial Instruments Firms Association.
IMPORTANT INFORMATIONEMEA: This communication has been issued by Morgan Stanley Investment Management Limited (“MSIM”). Authorised and regulated by the Financial Conduct Authority. Registered in England No. 1981121. Registered Office: 25 Cabot Square, Canary Wharf, London E14 4QA.There is no guarantee that any investment strategy will work under all market conditions, and each investor should evaluate their ability to invest for the long-term, especially during periods of downturn in the market. Prior to investing, investors should carefully review the strategy’s/product’s relevant offering document. There are important differences in how the strategy is carried out in each of the investment vehicles.A separately managed account may not be appropriate for all investors. Separate accounts managed according to the Strategy include a number of securities and will not necessarily track the performance of any index. Please consider the investment objectives, risks and fees of the Strategy carefully before investing.The views and opinions are those of the author or the investment team as of the date of preparation of this material and are subject to change at any time due to market or economic conditions and may not necessarily come to pass. Furthermore, the views will not be updated or otherwise revised to reflect information that subsequently becomes available or circumstances existing, or changes occurring, after the date of publication. The views expressed do not reflect the opinions of all investment teams at Morgan Stanley Investment Management (MSIM) or the views of Morgan Stanley as a whole, and may not be reflected in all the strategies and products that Morgan Stanley or its affiliates offer.Forecasts and/or estimates provided herein are subject to change and may not actually come to pass. Information regarding expected market returns and market outlooks is based on the research, analysis and opinions of the authors or the investment team. These conclusions are speculative in nature, may not come to pass and are not intended to predict the future performance of any specific Morgan Stanley Investment Management product.
The description of ESG integration in MSIM’s portfolio management teams represent how the portfolio management teams generally implement their investment process under normal market conditions.Certain information herein is based on data obtained from third party sources believed to be reliable. However, we have not verified this information, and we make no representations whatsoever as to its accuracy or completeness.This material is a general communication, which is not impartial and all information provided has been prepared solely for informational and educational purposes and does not constitute an offer or a recommendation to buy or sell any particular security or to adopt any specific investment strategy. The information herein has not been based on a consideration of any individual investor circumstances and is not investment advice, nor should it be construed in any way as tax, accounting, legal or regulatory advice. To that end, investors should seek independent legal and financial advice, including advice as to tax consequences, before making any investment decision. Morgan Stanley Investment Management Inc., its affiliates and its and their respective directors, officers, employees, members, stockholders, general and limited partners, sponsors, managers, trustees, agents, advisors, successors, representatives and heirs shall not, to the fullest extent permitted by law, incur liability of any nature for any loss or damage incurred or alleged to be incurred directly or indirectly by any person or entity in connection with (i) the use or receipt of any information contained in this material or (ii) any aspect of such information’s purported or actual accuracy, completeness, fairness, reliability or suitability.This communication is not a product of Morgan Stanley’s Research Department and should not be regarded as a research recommendation. The information contained herein has not been prepared in accordance with legal requirements designed to promote the independence of investment research and is not subject to any prohibition on dealing ahead of the dissemination of investment research.MSIM has not authorised financial intermediaries to use and to distribute this document, unless such use and distribution is made in accordance with applicable law and regulation. Additionally, financial intermediaries are required to satisfy themselves that the information in this document is suitable for any person to whom they provide this document in view of that person’s circumstances and purpose. MSIM shall not be liable for, and accepts no liability for, the use or misuse of this document by any such financial intermediary.This document may be translated into other languages. Where such a translation is made this English version remains definitive. If there are any discrepancies between the English version and any version of this document in another language, the English version shall prevail.The whole or any part of this work may not be reproduced, copied or transmitted or any of its contents disclosed to third parties without MSIM’s express written consent. All information contained herein is proprietary and is protected under copyright and other applicable law.Morgan Stanley Investment Management is the asset management division of Morgan Stanley.
For more information about the Morgan Stanley Institute for Sustainable Investing, visit www.morganstanley.com/sustainableinvesting
For more information on Morgan Stanley Investment Management, visit www.morganstanley.com/im