climate smart agriculture ensuring food security …
TRANSCRIPT

CLIMATE SMART AGRICULTURE ENSURING FOOD SECURITY
AND FACING CLIMATE CHANGE
NGUYEN VAN BO – VIETNAM
G7 International Symposium on Food Security and NutritionOctober 25-26 2016
United Nations University, Tokyo

REASONS FOR CSA
Vietnam is an Agriculture-based economy, contributing 17.4% of GDPAgriculture employs 44.3% country’s workforce Labor working in rural area: 68,8% Trained labor in rural area: 13,9%

REASONS FOR CSA (2)
Vietnam ranking globally:• 14th by population (95.7mil. By Oct.2016); • 65th by natural area; • 42th by GDP and • 129th by GDP per capita (2,109USD)
Agricultural land/capita: 0.104ha, 8.7% of world average

REASONS FOR CSA (3)
Poverty rate: 10% and pro-poor: 5%Poor households in rural: 92.3%Poor households of ethnic minority: 46.7% of total poverty householdsLabor productivity: 9,138.6 USD (PPP) -6.41% of Singapore, 13,56% of S.Koreaand 55,58% of the Philippines
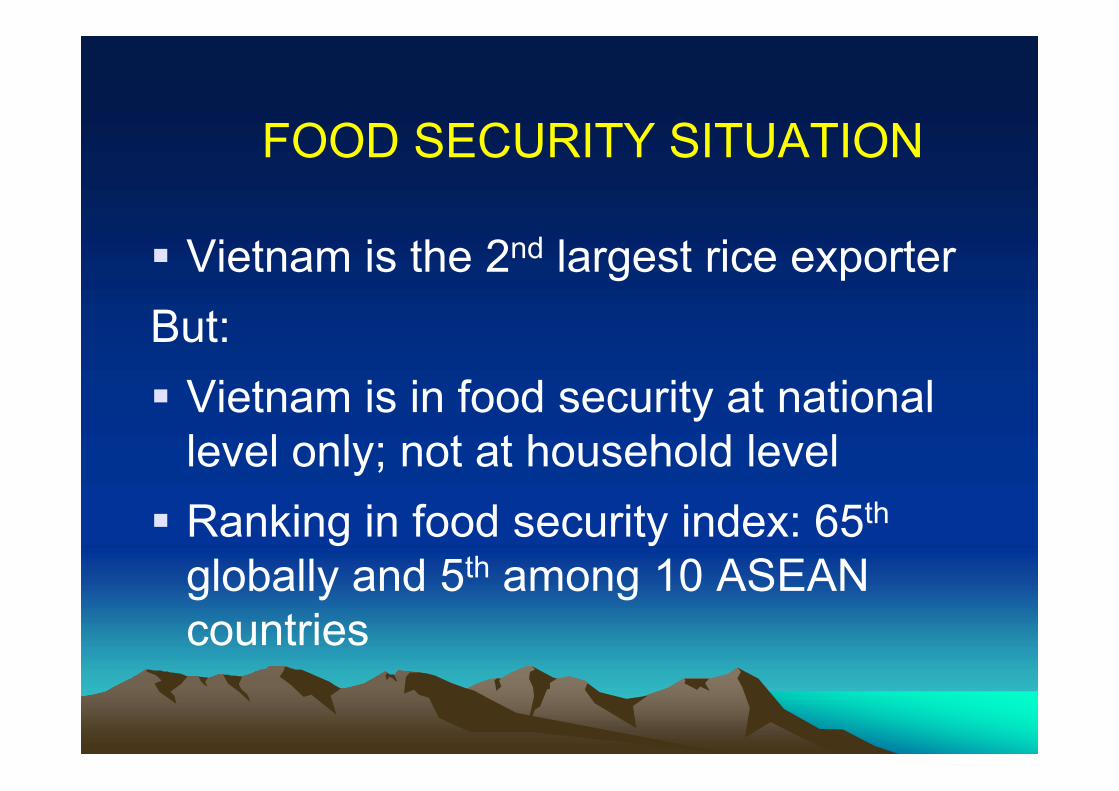
FOOD SECURITY SITUATION
Vietnam is the 2nd largest rice exporterBut:
Vietnam is in food security at national level only; not at household levelRanking in food security index: 65th
globally and 5th among 10 ASEAN countries

Global Food Security Index 2015
Country Score/100 RankUnited States 89.0 1Singapore 88.2 2Japan 77.4 21South Korea 74.8 26Malaysia 69.0 34China 64.2 42Thailand 60.0 52Vietnam 53.4 65
Global Food Security Index 2015

Security index score/5Country Food Water Energy
Singapore 4.0 3.4 4.5Brunei 3.5 3.0 4.0Malaysia 3.2 3.4 4.0Thailand 3.0 2.2 4.0Vietnam 2.4 1.8 1.5Indonesia 2.3 2.6 2.5Phillipines 2.3 2.2 1.5Myanmar 2.0 2.2 3.0Laos 1.8 2.6 2.0Cambodia 1.6 1.6 3.0Source: Richard Silberglitt. Symposium on Integrated Foresight for Sustainable EconomicDevelopment and Eco-Resilience in ASEAN Countries. Thailand, 1– 2 October 2013

NUTRITION SECURITY SITUATION
Great improvement in daily calorie intake per capita, reaches the world’s average (2,780 kcal/day)
But: Imbalance in nutrition ratio: Too big share of carbohydrate and less of protein and fat compare to that of developed countries

Daily Calorie Intake per CapitaCountry 1990-92 2000-02 2005-07
kcal/dayUSA 3,510 3,720 3,770Japan 2,920 2,860 2,810S.Korea 2,970 3,050 3,070China 2,580 2,920 2,970Thailand 2,250 2,450 2,530Vietnam 2,090 2,310 2,770World 2,780
FAO Statistics 2010

Dietary Energy Consumption per Capita, 2010
Coun-try
DEC,kcal/day
Unit Carbohydrate
Protein Fats
USA 3,770 % 49 12 38
Ratio 1 0.24 0.78
Japan 2,810 % 58 13 29
Ratio 1 0.22 0.50
Vietnam 2,770 % 70 10 19
Ratio 1 0.14 0.27
FAO Statistics 2010

CLIMATE CHANGE
Temperature increase 0.26oC since 1971, twice the global average (WB-VN 2035)
Sea level raise 1993 – 2014: 3,34 mm/year.
GHG emission (2010) from agriculture accounting for 88.3 mil.ton CO2 eq. (35.78% of total); out of that 55.5% from rice prod.
GHG emission from enteric fermentationand manure management: 20.2% of total in agriculture

Vietnam Emission by Sectors in 2010Sectors CO2 eq, mil.tons %
Energy 141.1 57.21
Industry 21.2 8.59
Agriculture 88.3 35.78
Forestry & changes in Land using
-19.2 -7.78
Waste 15.3 6.20
Total 246.8 100.00
Source: The initial biennial updated report of Vietnam to the United Nations framework convention on climate change (BUR1), 2014

VN: 2010 GHG emissions in agriculture Unit: thousand tons of CO2e
Sub-Sectors CH4 N2O CO2 -e %
Enteric Fermentation 9,467.51 00 9,467.51 10.72
Manure Management 2,319.51 6,240.49 8,560.00 9.69
Rice Cultivation 44,614.22 00 44,614.22 50.49
Agricultural soils 00 23,812.02 23,812.02 26.95
Burning of Residues 1,506.29 393.04 1,899.33 2.15
Total Agriculture 57,908.95 30,445.82 88,354.77 100.0
Source: The initial biennial updated report of Vietnam to the UNFCCC (BUR1), 2014

CLIMATE CHANGE AND ITS IMPACT TO AGRICULTURE
2015-2016: Agr. GDP growth rate is negative for the first time during last 30 years (-0.18%) due to severe drought and salinity.
Damaged 249,620 ha of rice; 37,369 ha of fruits trees,163,768 ha of perennial industrial crops; 6,942 ha of aquaculture... With total value of 7 billion USD (3% GDP)

VN: CLIMATE CHANGE SCENARIO 2016
Average T increase by 2050: 1,3 ÷1,7°Cwith RCP4.5 and 1,8÷2,3°C with RCP8.5.
With 100cm SLR: Area to be flooded: Mekong Delta: 38.9%, Red river Delta: 16.8%, some provinces up to 70-80%
Food may reduce: 30-35%.
Saline water instruction: up to 60 km.
IHEM, 2016

CSA MEASURES
Measures promoting production systems that sustainably increase:
A. Productivity/Farmers income (Food Security)
B. Resilience (Adaptation),
C. Reduces GHGs (mitigation),
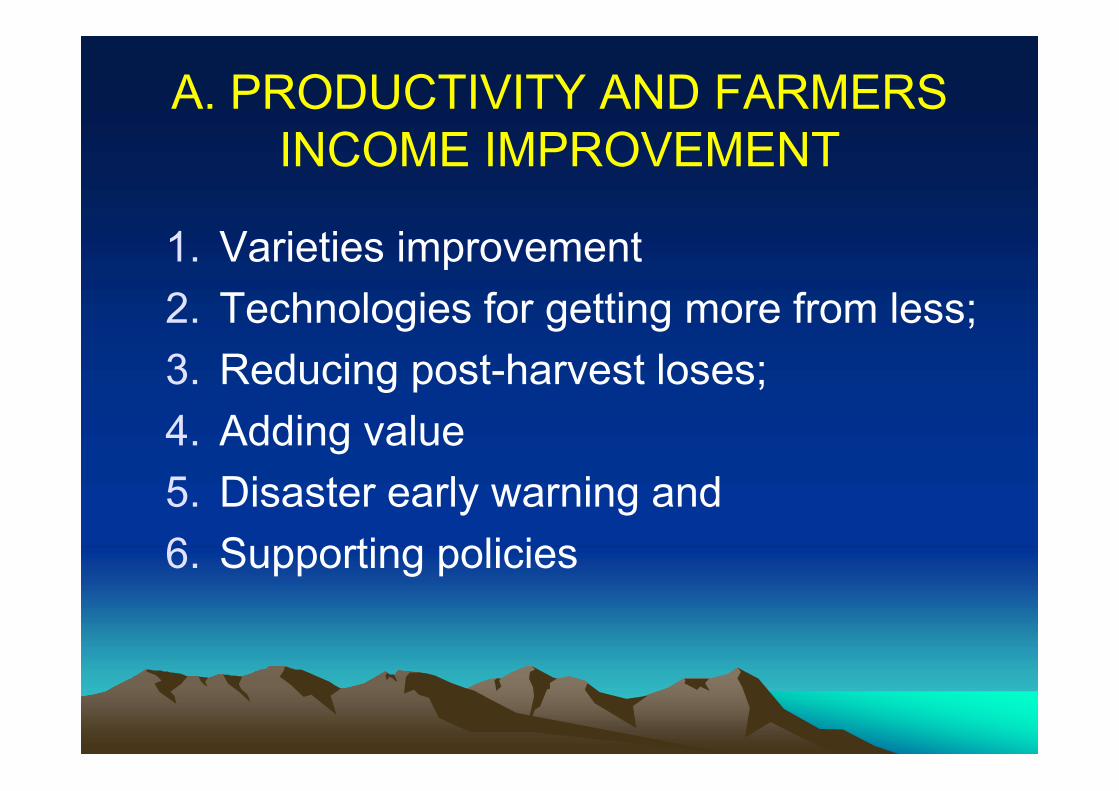
A. PRODUCTIVITY AND FARMERS INCOME IMPROVEMENT
1. Varieties improvement 2. Technologies for getting more from less; 3. Reducing post-harvest loses; 4. Adding value 5. Disaster early warning and 6. Supporting policies
A. PRODUCTIVITY AND FARMERS INCOME IMPROVEMENT
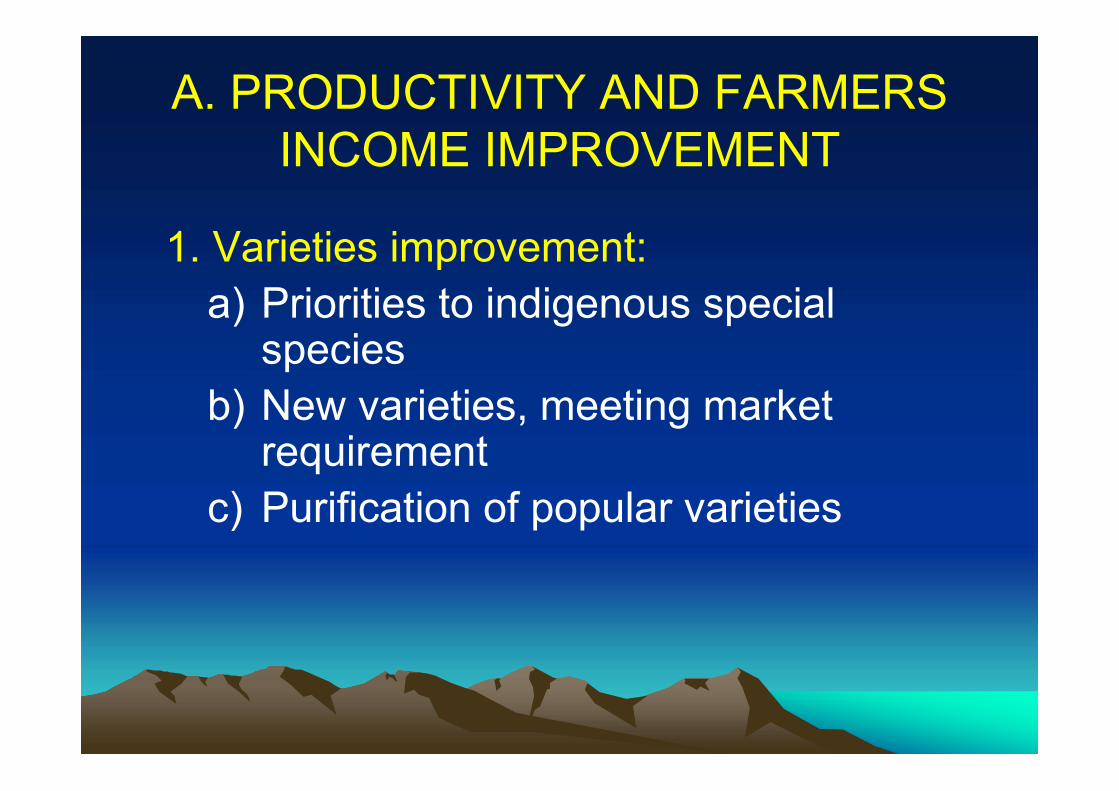
1. Varieties improvement: a) Priorities to indigenous special
speciesb) New varieties, meeting market
requirementc) Purification of popular varieties

A. PRODUCTIVITY IMPROVEMENT (2)
2. Technologies for getting more from less:a) Less: Labor, water, fertilizers,
pesticides and fuel b) More: Productivity, quality/nutrition,
food safety, economic efficiency and farmers’ income

A. PRODUCTIVITY IMPROVEMENT (3)
3. Technology for reducing post-harvest loses a) Improving mechanization in planting,
cultivation, harvesting b) Increasing % of dryingc) Advance storage technology for
preventing physical and quality lossesd) Processing with conserving nutrition and
flavors

A. PRODUCTIVITY IMPROVEMENT (4)
4. Technology for adding valuea) Higher quality varieties, functional foods
b) Diversifying products and deep processing
c) Branding for agricultural commodities
d) Maximizing recycling waste (crops residues, manure/bio-slurry…)

A. PRODUCTIVITY IMPROVEMENT (5)
5. Technology for disaster early warning: a) Natural disaster: Typhoon, flash floods,
drought, salinity instruction, extreme climatic phenomenon (too cold, too hot, heavy rain, severe drought)
b) Disease: Appearance of existing and new biotypes; cross border transmigration..
A. PRODUCTIVITY IMPROVEMENT (6)
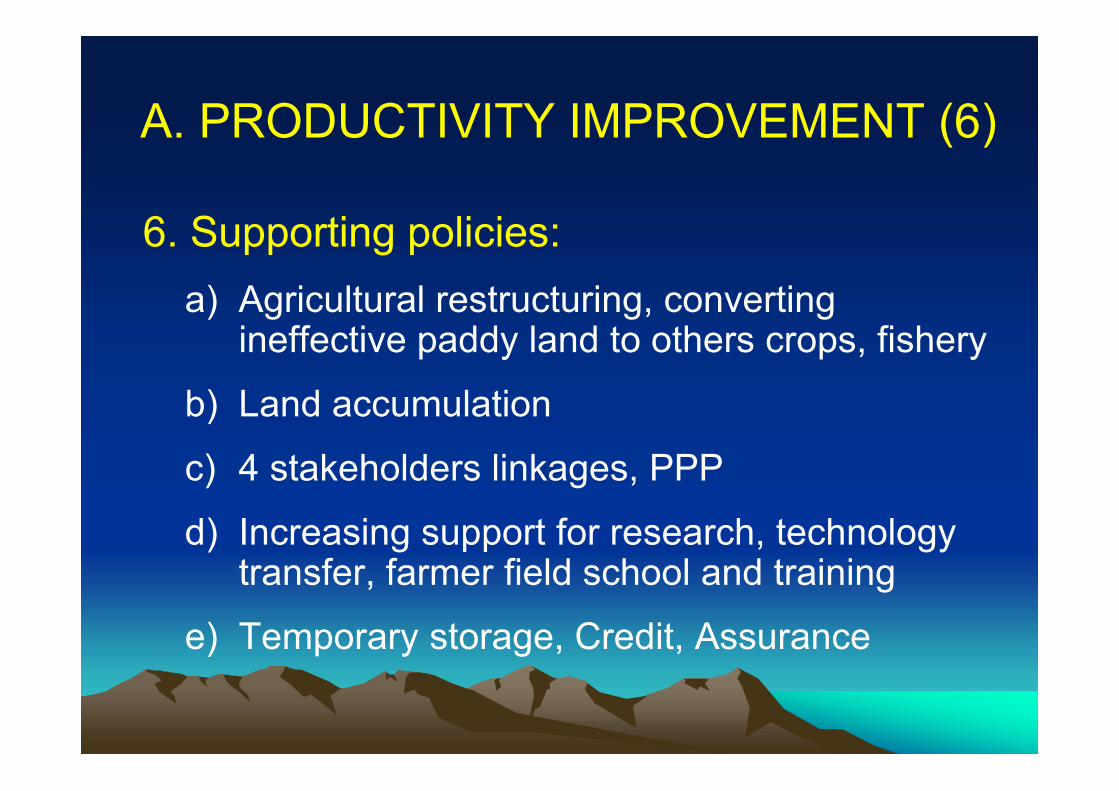
6. Supporting policies: a) Agricultural restructuring, converting
ineffective paddy land to others crops, fishery
b) Land accumulation
c) 4 stakeholders linkages, PPP
d) Increasing support for research, technology transfer, farmer field school and training
e) Temporary storage, Credit, Assurance

B. RESILIENCE (Adaptation)
1) Varieties resistant to biotic and abiotic stresses
2) Cropping pattern changes 3) Eco-villages4) Training, raising public awareness in:
Response capacity, Adaptive capacity and Agricultural production reorganization
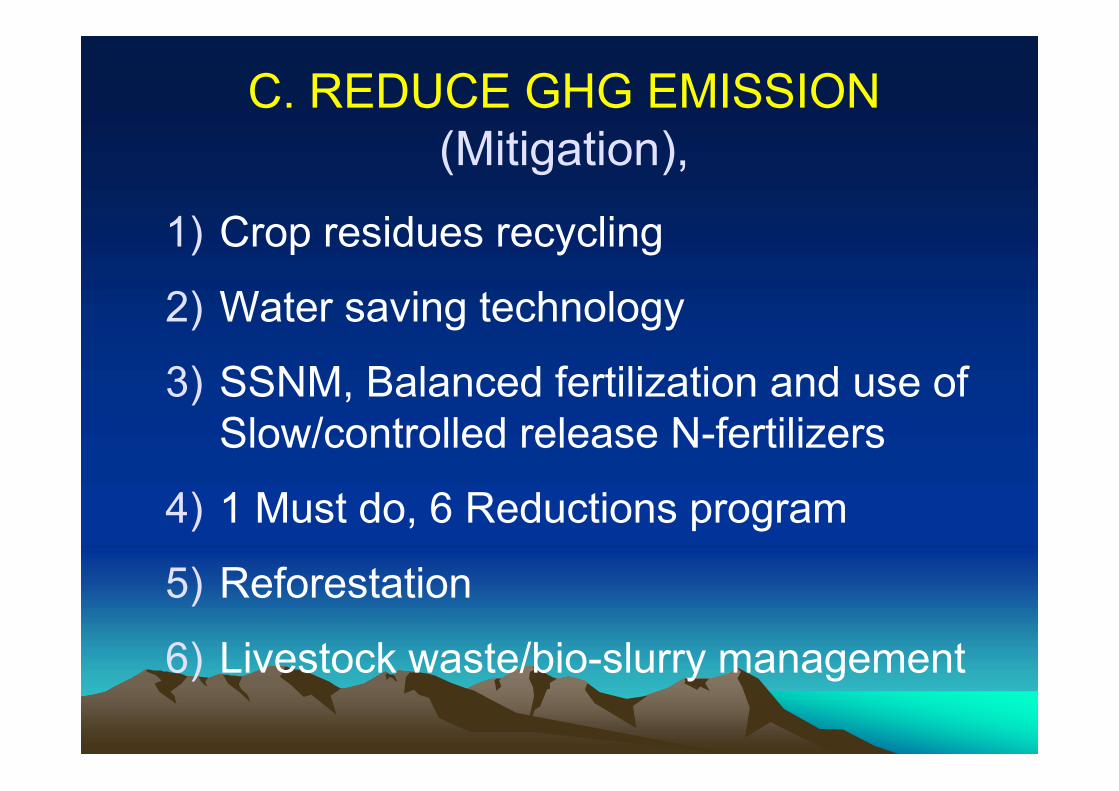
C. REDUCE GHG EMISSION (Mitigation),
1) Crop residues recycling
2) Water saving technology
3) SSNM, Balanced fertilization and use of Slow/controlled release N-fertilizers
4) 1 Must do, 6 Reductions program
5) Reforestation
6) Livestock waste/bio-slurry management
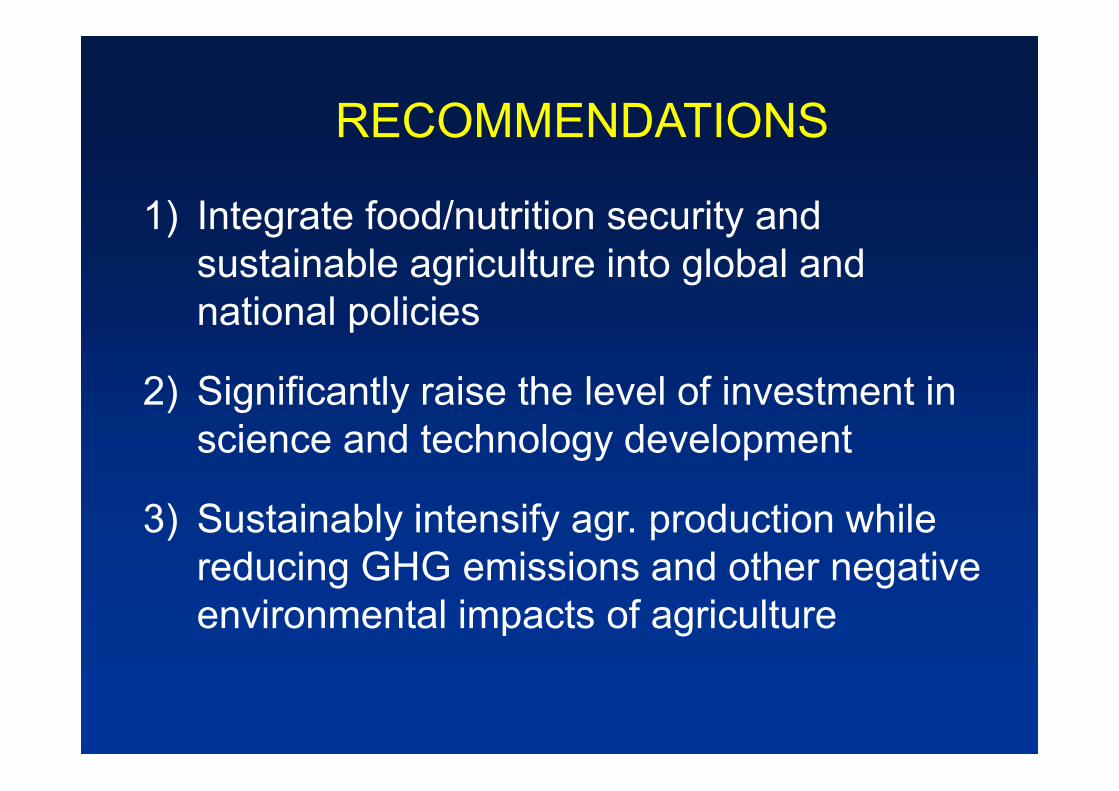
1) Integrate food/nutrition security and sustainable agriculture into global and national policies
2) Significantly raise the level of investment in science and technology development
3) Sustainably intensify agr. production while reducing GHG emissions and other negative environmental impacts of agriculture
RECOMMENDATIONS

4) GACSA to develop specific programmes to assist rice exporting countries, contributing to global food security but are most vulnerable to Climate change
5) Reduce food loss and waste
6) Create comprehensive informationsharing systems
RECOMMENDATIONS (2)
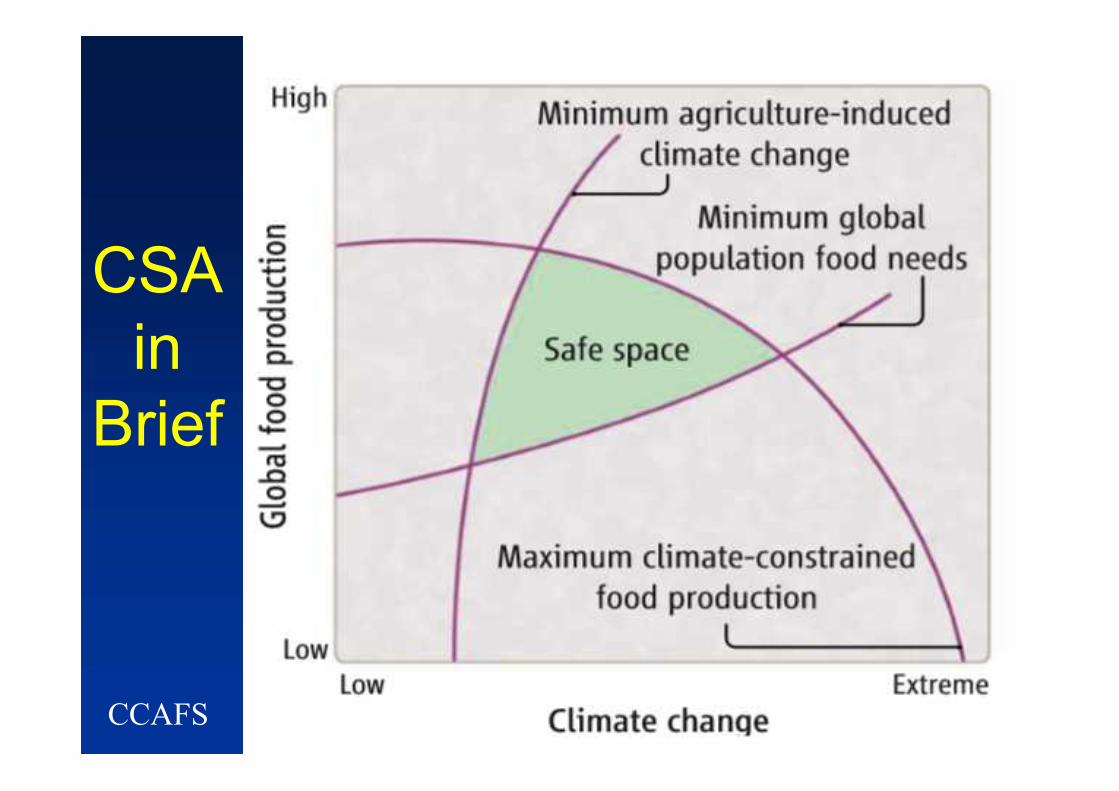
CSAin
Brief
CCAFS
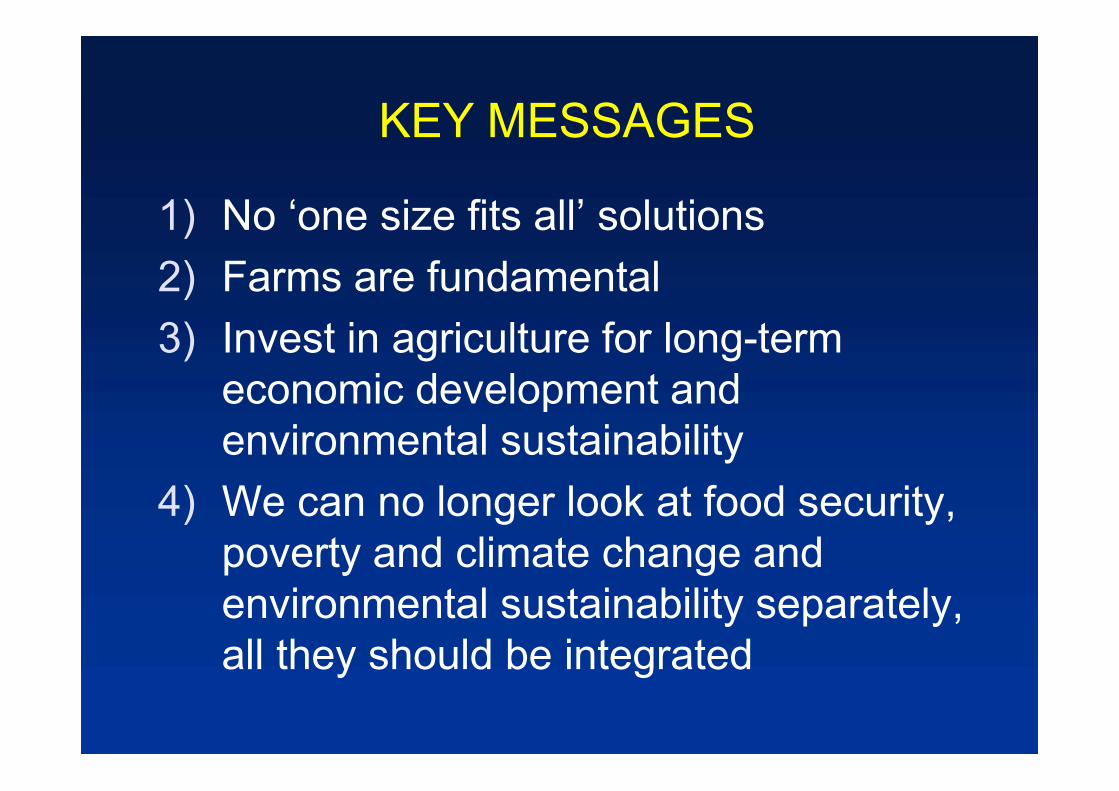
1) No ‘one size fits all’ solutions2) Farms are fundamental3) Invest in agriculture for long-term
economic development and environmental sustainability
4) We can no longer look at food security, poverty and climate change and environmental sustainability separately, all they should be integrated
KEY MESSAGES

Arigatou gozaimasu有難う御座います