climate change walter mendonza
TRANSCRIPT
Climate Change
the politics of scienceClimate Change
the politics of science
Walter Mendoza
FABC-South AsiaMumbai, March 2015

Key issues for Policy Makers
2°C
350 ppm

Modern Environment Movement
Silent Springby Rachel Carson
1962

What is Climate? What is weather?
• Climate (from Ancient Greek klima, meaning inclination) is commonly defined as the weather averaged over a long period of time
• Weather is a set of all the phenomena occurring in a given atmosphere at a given time.
Modern Environment Movement
(UNCED)
1992 United Nations Conference
on
Environment and Development
Rio Earth Summit
The basis in Science
Intergovernmental Panel on Climate Change
(IPCC)1988

The basis in Science
IPCC reports
The main activity of the IPCC isto provideAssessment Reportsin regular intervalson the state of knowledgeon climate change.

The basis in Science
Assessment Report
1990Second Assessment Report
1995
Third Assessment Report TAR 2001
Fourth Assessment Report AR4
2007

The basis in Science
Working Group I (WGI) assesses the physical scientific aspects
details of recent changes: temperatures, rainfall, glaciers and ice sheets
greenhouse gases and aerosols;
extent to which they affect climate

The basis in Science
Working Group II (WGII)
assesses the vulnerability of socio-economic and natural systems to climate change
outlines options for adaptation

The basis in Science
Task Force on National Greenhouse Gas Inventories (TFI)

The basis in Science
Data and Scenario Support for Impacts and Climate Analysis (TGICA)

The basis in Science
The IPCC also produces
Special ReportsMethodology ReportsTechnical PapersSupporting Material

The basis in Science
Nobel Peace Prize 2007
Al Gore and IPCC
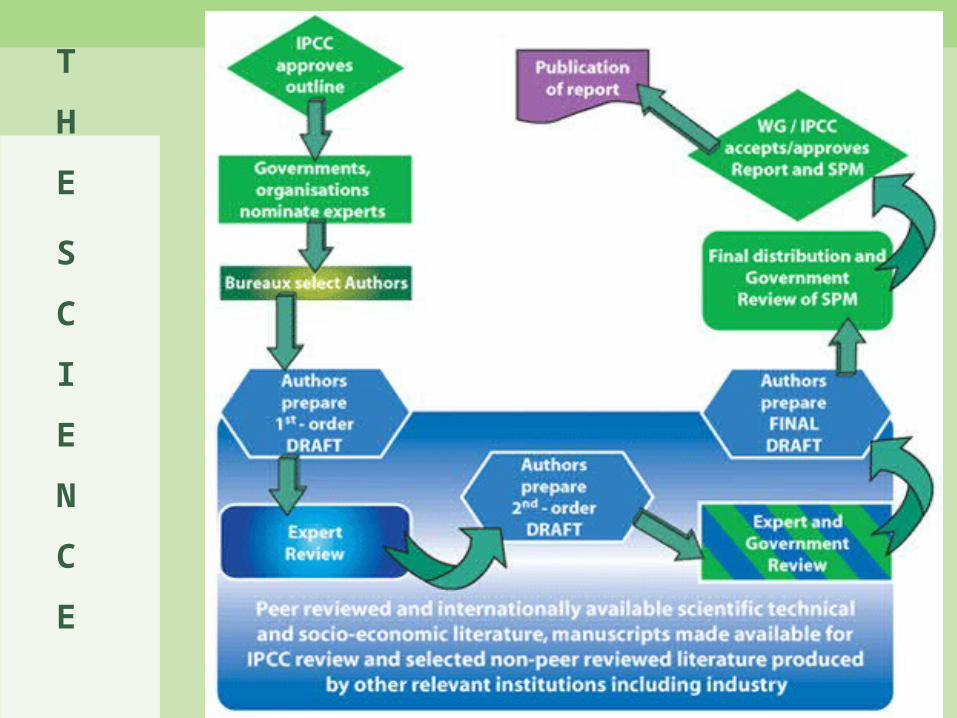
T
H
E
S
C
I
E
N
C
E

THE SCIENCE DIRECT OBSERVATIONS OF RECENT
CLIMATE CHANGE
Global average air temperature
• Updated 100-year linear trend of 0.74 [0.56 to 0.92] oC for 1906-2005
• Larger than corresponding trend of 0.6 [0.4 to 0.8] oC for 1901-2000 given in TAR
• Average ocean temperature increased to depths of at least 3000 m – ocean has absorbed 80% of heat added
• seawater expansion and SLR

THE SCIENCE DIRECT OBSERVATIONS OF RECENT CLIMATE CHANGE
At continental, regional, and ocean basin scales, numerous long-term changes in climate have been observed. These include:– Changes in Arctic temperatures and ice– Widespread changes in precipitation
amounts, ocean salinity, wind patterns – Aspects of extreme weather including
droughts, heavy precipitation, heat waves and the intensity of tropical cyclones
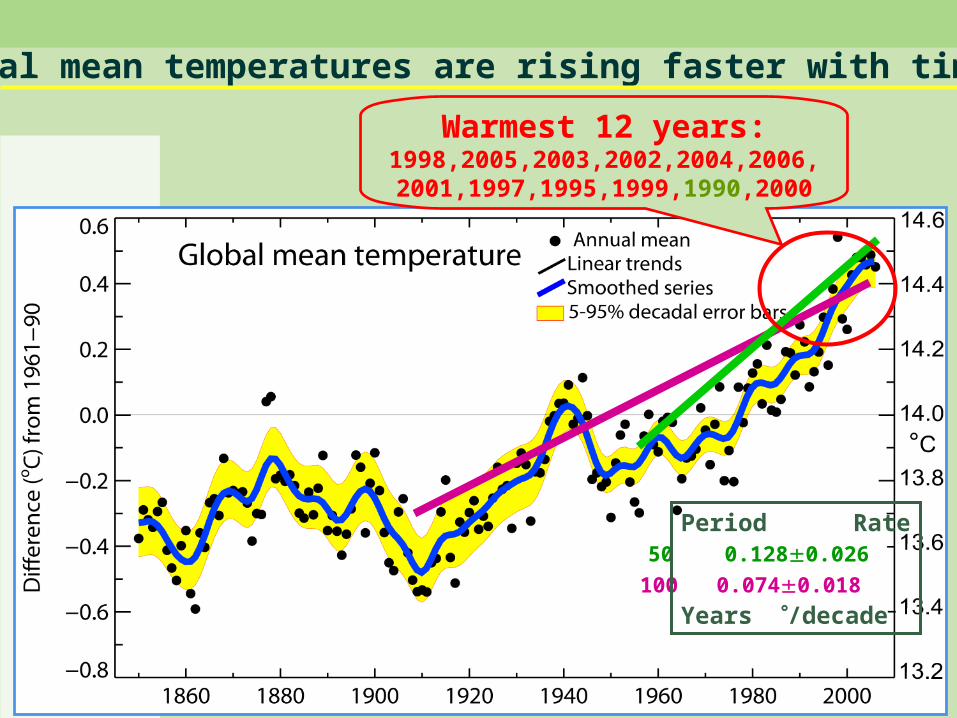
Global mean temperatures are rising faster with time
100 0.0740.018
50 0.1280.026
Warmest 12 years:1998,2005,2003,2002,2004,200
6, 2001,1997,1995,1999,1990,200
0
Period Rate
Years /decade

Land surface temperatures are rising faster than SSTs
SSTLAND

Changes in Precipitation Increased Drought
• Significantly increased precipitation in eastern parts of North and South America, northern Europe and northern and central Asia.
• The frequency of heavy precipitation events has increased over most land areas - consistent with warming and increases of atmospheric water vapour
• Drying in the Sahel, the Mediterranean, southern Africa and parts of southern Asia.
• More intense and longer droughts observed since the 1970s, particularly in the tropics and subtropics.

Other changes - Extreme Events
• Widespread changes in extreme temperatures
observed
• Cold days, cold nights and frost less frequent
• Hot days, hot nights, and heat waves more
frequent
• Observational evidence for an increase of
intense tropical cyclone activity in the North
Atlantic since about 1970, correlated with
increases of tropical sea surface temperatures

The most important spatial pattern (top) of the monthly Palmer Drought Severity Index (PDSI) for 1900 to 2002.
The time series (below) accounts for most of the trend in PDSI.
Mainly decrease in rain over land in tropics and
subtropics, but enhanced by increased atmospheric demand
with warming
Drought is increasing in most places

Warm nights are increasing; cold nights decreasing
Frequency of occurrence of cold or warm temperatures for 202 global stations for 3 time periods: 1901 to 1950 (black), 1951 to 1978 (blue) and 1979 to 2003 (red)
fewer more fewer more
1979- 2003
1951- 1978
1901- 1950
1979- 2003
1951- 1978
1901- 1950

Smoothed annual anomalies for precipitation (%) over land from 1900 to 2005; other regions are dominated by variability.
Land precipitation is changing significantly over broad areas
Increases
Decreases

T
H
E
S
C
I
E
N
C
E

THE SCIENCE
Greenhouse Gas
Gases that trap heat in the atmosphere are often called greenhouse gases.
• Carbon Dioxide (CO2) • Methane (CH4)• Nitrous Oxide (N2O)• Fluorinated Gases

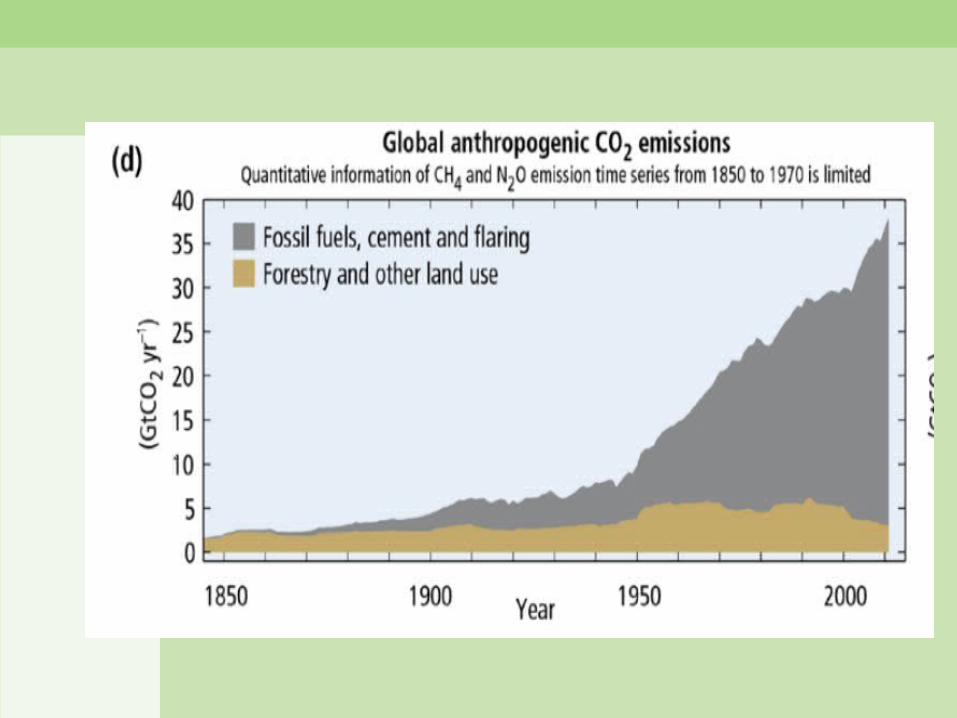
The atmospheric concentration of CO2 and CH4 in 2005 exceeds by far the natural range of the last 650,000 years
CO2
CH4


• Net CO2 emissions = 7.9 GtC/yr
• Net CO2 intake capacity = 3.1 GtC/yr
• Excess CO2 emissions = 4.8 GtC/yr, 55% more than intake capacity


Disaster? Or Catastrophe?
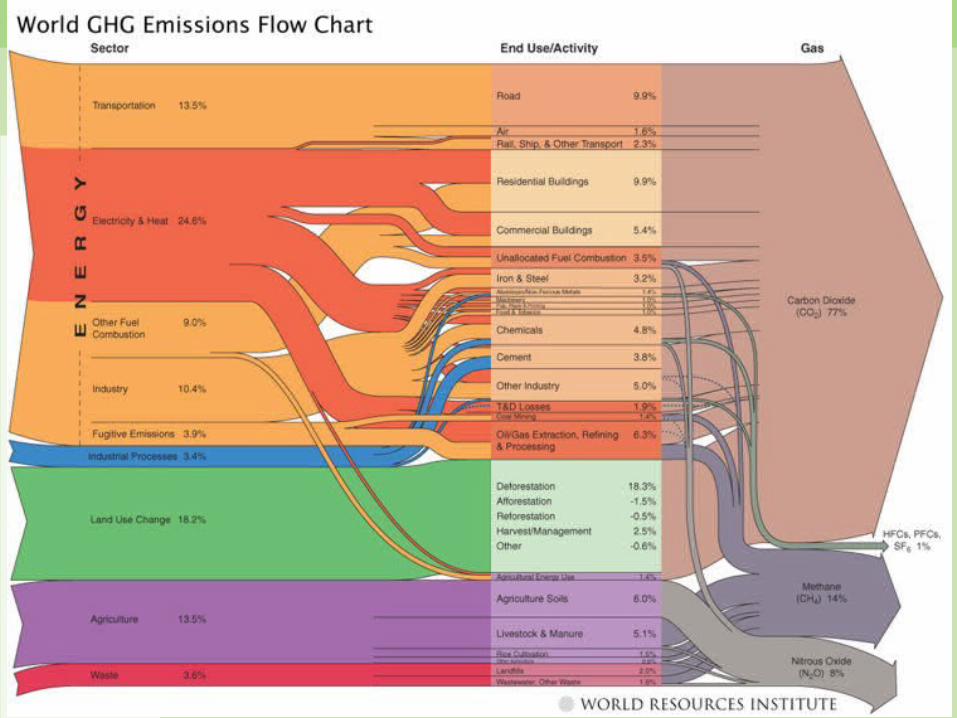
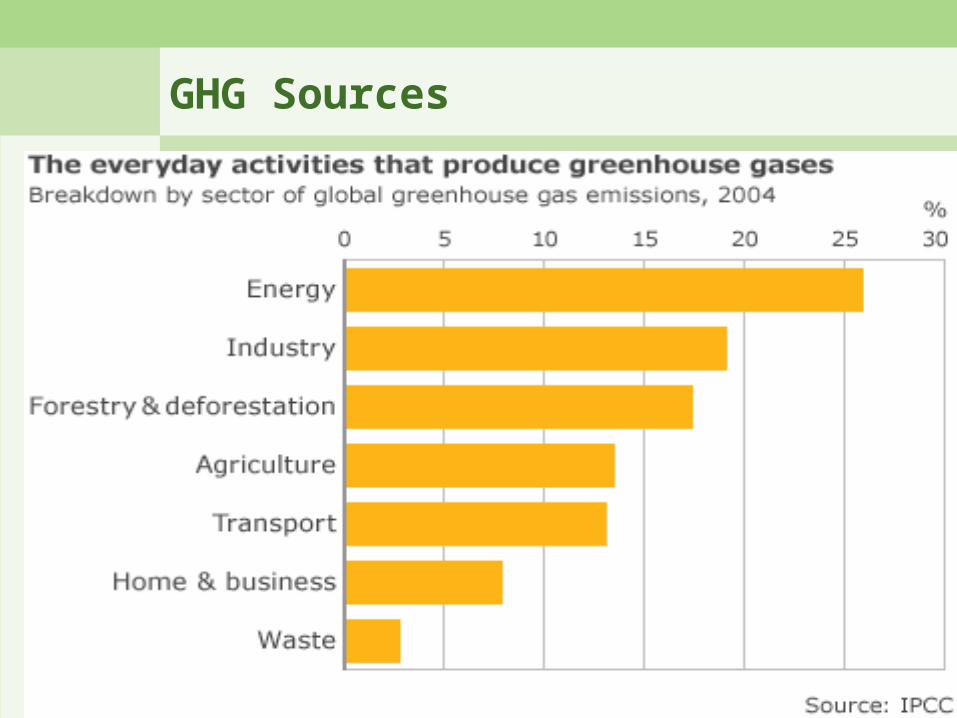
GHG Sources

Total and per capita emissions
36

Ca
na
da
Un
ite
d S
tate
s
Bra
zil
Gu
ya
na
Ge
rma
ny
Ne
the
rla
nd
s
Un
ite
d K
ing
do
m
Ru
ss
ia
Ke
ny
a
So
uth
Afr
ica
Ta
nza
nia
Au
str
ali
a
Ba
ng
lad
es
h
Ch
ina
Ind
ia
Ja
pa
n
Ne
pa
l
Ne
w Z
ea
lan
d
Va
nu
atu
0.1
1
0.1
1
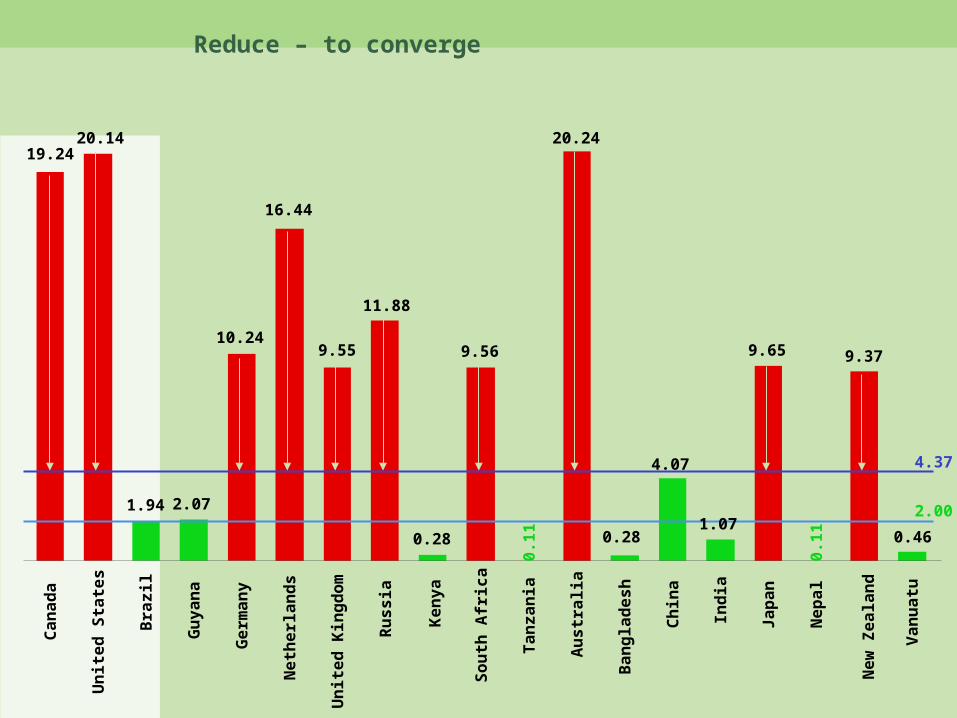
19.2420.14
1.94 2.07
10.24
16.44
9.55
11.88
0.28
9.56
20.24
0.28
4.07
1.07
9.65 9.37
0.46
4.37
2.00
World average 4 tonnes per person per yearCan sustain 2 tonnes per person per year

Ca
na
da
Un
ite
d S
tate
s
Bra
zil
Gu
ya
na
Ge
rma
ny
Ne
the
rla
nd
s
Un
ite
d K
ing
do
m
Ru
ss
ia
Ke
ny
a
So
uth
Afr
ica
Ta
nza
nia
Au
str
ali
a
Ba
ng
lad
es
h
Ch
ina
Ind
ia
Ja
pa
n
Ne
pa
l
Ne
w Z
ea
lan
d
Va
nu
atu
0.1
1
0.1
1
19.2420.14
1.94 2.07
10.24
16.44
9.55
11.88
0.28
9.56
20.24
0.28
4.07
1.07
9.65 9.37
0.46
4.37
2.00
Who?
Ca
na
da
Un
ite
d S
tate
s
Bra
zil
Gu
ya
na
Ge
rma
ny
Ne
the
rla
nd
s
Un
ite
d K
ing
do
m
Ru
ss
ia
Ke
ny
a
So
uth
Afr
ica
Ta
nza
nia
Au
str
ali
a
Ba
ng
lad
es
h
Ch
ina
Ind
ia
Ja
pa
n
Ne
pa
l
Ne
w Z
ea
lan
d
Va
nu
atu
0.1
1
0.1
1
19.2420.14
1.94 2.07
10.24
16.44
9.55
11.88
0.28
9.56
20.24
0.28
4.07
1.07
9.65 9.37
0.46
4.37
2.00
Reduce – to converge

Ca
na
da
Un
ite
d S
tate
s
Bra
zil
Gu
ya
na
Ge
rma
ny
Ne
the
rla
nd
s
Un
ite
d K
ing
do
m
Ru
ss
ia
Ke
ny
a
So
uth
Afr
ica
Ta
nza
nia
Au
str
ali
a
Ba
ng
lad
es
h
Ch
ina
Ind
ia
Ja
pa
n
Ne
pa
l
Ne
w Z
ea
lan
d
Va
nu
atu
0.1
1
0.1
1
19.2420.14
1.94 2.07
10.24
16.44
9.55
11.88
0.28
9.56
20.24
0.28
4.07
1.07
9.65 9.37
0.46
4.37
2.00
Increase to convergeClimate justice

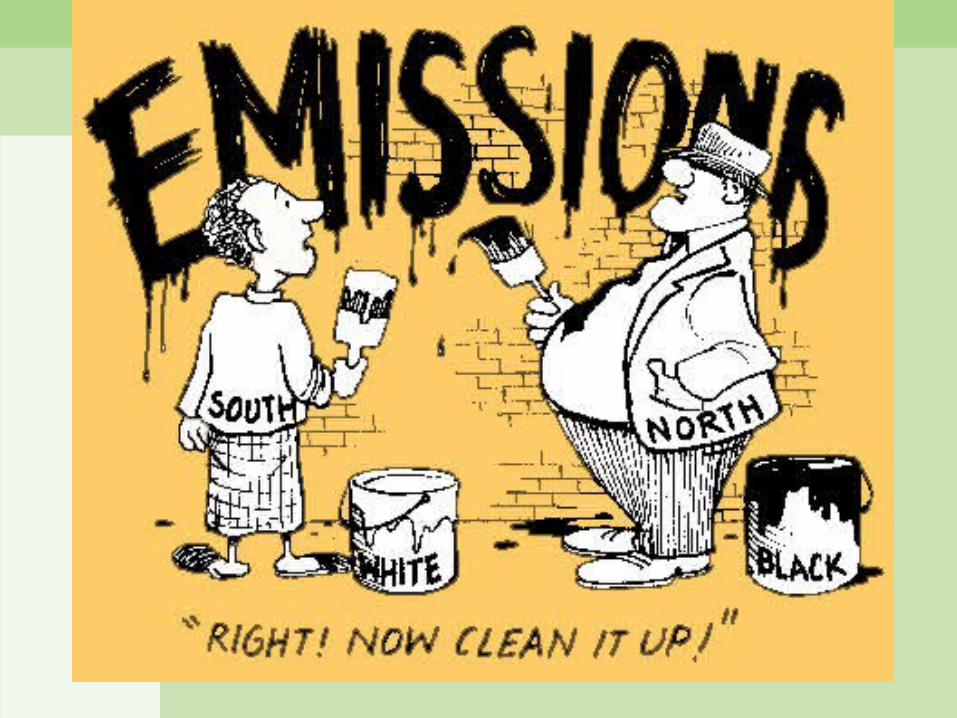
Which / Whose Point of View?

As is GHG dumping

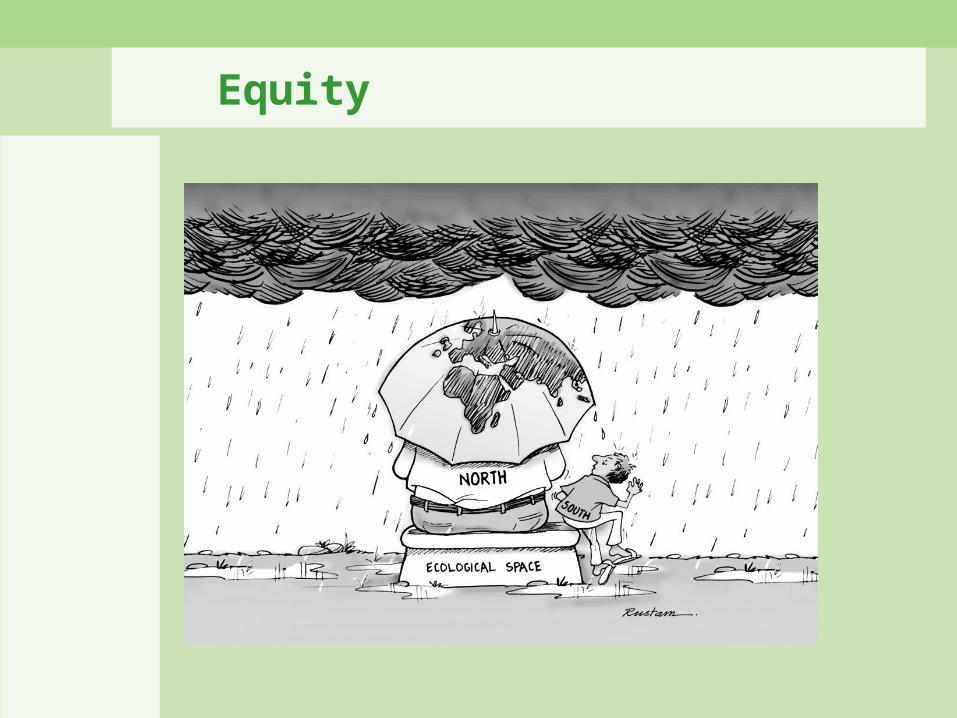
Equity

THE POLITICS

THE POLITICS

THE POLITICS

THE POLITICS

Key issues
350 ppm
2°C


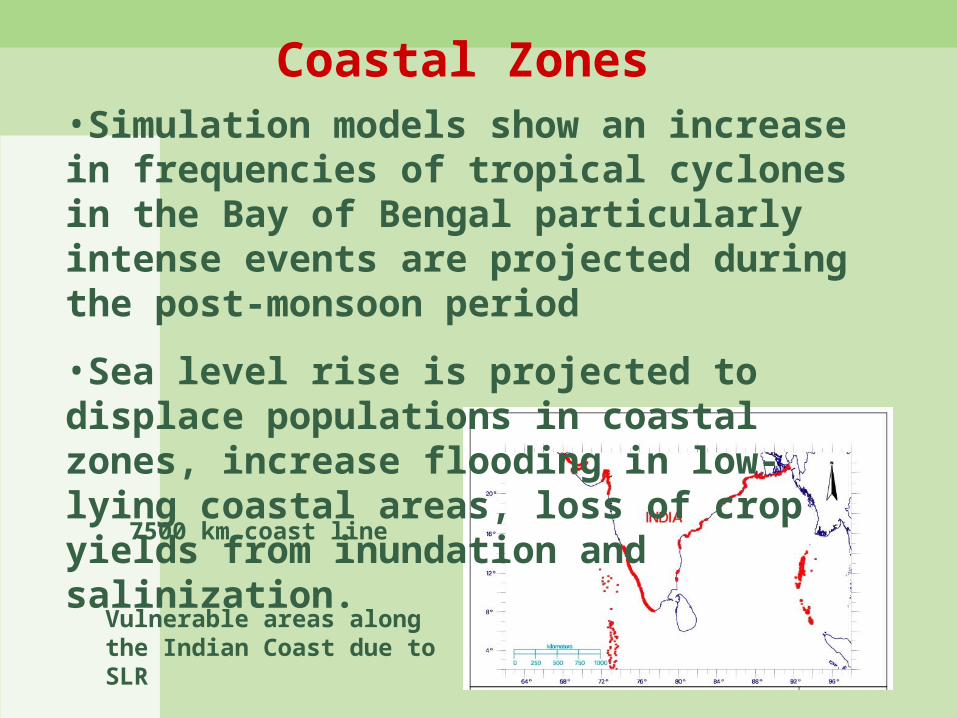
Coastal Zones
Vulnerable areas along the Indian Coast due to SLR
•Simulation models show an increase in frequencies of tropical cyclones in the Bay of Bengal particularly intense events are projected during the post-monsoon period
•Sea level rise is projected to displace populations in coastal zones, increase flooding in low-lying coastal areas, loss of crop yields from inundation and salinization.
7500 km coast line

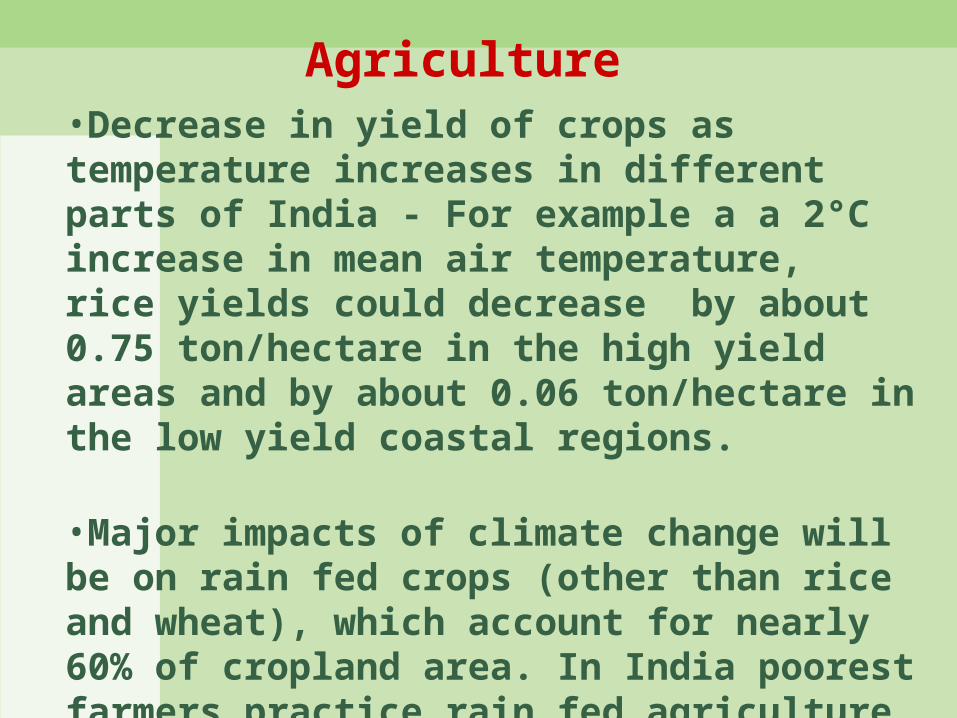
•Decrease in yield of crops as temperature increases in different parts of India - For example a a 2°C increase in mean air temperature, rice yields could decrease by about 0.75 ton/hectare in the high yield areas and by about 0.06 ton/hectare in the low yield coastal regions.
•Major impacts of climate change will be on rain fed crops (other than rice and wheat), which account for nearly 60% of cropland area. In India poorest farmers practice rain fed agriculture.
•The loss in farm-level net revenue will range between 9 and 25% for a temperature rise of 2-3.5°C.
Agriculture

Health
Malaria is likely to persist in many states and new regions at hogher latitudes may become malaria-prone
The duration of the malaria transmission windows is likely to widen in northern and western states and shorten in southern states.
Endemic regions of malaria
Regions likely to be affected by malaria in 2050s
Modern Environment Movement
United Nations Conference on the Human Environment Stockholm, Sweden, 1972
Modern Environment Movement
World Commission on
Environment and
Development (WCED)
1983
Modern Environment Movement
Our Common Future
1987
sustainable development
United Nations Conference on the Human Environment in Stockholm, Sweden, in 1972 United Nations Conference on the Human Environment in Stockholm, Sweden, in 1972 United Nations Conference on the Human Environment in Stockholm, Sweden, in 1972

Modern Environment Movement
"Development that meets the needs of the present without compromising the ability of future generations to meet their own needs."