climate change vulnerability mapping in the philippines a
TRANSCRIPT

Climate Change Vulnerability Mapping in the Philippines: A Pilot Study1
1. Background a. Climate Change manifestations and climate hazards
Climate change has become a global concern in recent decades. One of the 1st major international meetings on climate change was held in 1979 by the World Meteorological Organization (WMO), a specialized agency of the United Nations. This paved the way for the organization of the Intergovernmental Panel on Climate Change (IPCC) in 1988. In accordance with its mandate and as reaffirmed in various decisions by the Panel, the IPCC prepares at regular intervals comprehensive Assessment Reports of scientific, technical and socio-economic information relevant for the understanding of human induced climate change, potential impacts of climate change and options for mitigation and adaptation (IPCC.ch). Climate change in IPCC usage refers to a change in the state of the climate that can be identified (e.g. using statistical tests) by changes in the mean and/or the variability of its properties and that persists for an extended period, typically decades or longer. It refers to any change in climate over time, whether due to natural variability or as a result of human activity. This usage differs from that in the United Nations Framework Convention in Climate Change (UNFCCC), where climate change refers to a change of climate that is attributed directly or indirectly to human activity that alters the composition of the global atmosphere and that is in addition to natural climate variability observed over comparable time periods. According to the synthesis report of the IPCC in 2007, warming of the climate system is unequivocal, as in now evident from observations of increases in global average air and ocean temperatures; widespread melting of snow and ice and rising global average see level. The radiative forcing of the climate system is dominated by the long-lived greenhouse gas (GHG) emission. The largest growth in GHG emissions between 1970 and 2004 has come from energy supply, transport and industry, while residential and commercial buildings, forestry and agriculture sectors have been growing at a lower rate. Changes in the atmospheric concentrations of GHGs and aerosols, land cover and solar radiation alter the energy balance of the climate system and are drivers of climate change. The US Environment Protection Agency identifies several climate change manifestations such as higher temperatures, changing rain and snow patterns, more droughts, warmer oceans, rising sea level, melting glaciers and ice sheets, less snowpack and thawing permafrost. Extreme weather and climate events are also felt all around the world.
1 This work was carried out by the PEP‐Asia CBMS Network Office of the Angelo King Institute for Economic and
Business Studies (AKI) of De La Salle University, Manila with financial support of the Government of Canada
through the International Development Research Centre (IDRC) and the Canadian International Development
Agency (CIDA) in collaboration with the Economy and Environment Program for Southeast Asia

b. Importance of Climate Change Vulnerability Mapping Climatic hazards, as a result of changing climate, occur more often and predicted to increase frequency in the future. However, weather hazards become weather disasters when it is coupled with unpreparedness. Gauging unpreparedness can be seen as human and societal inability to cope with hazards is also known to be "vulnerability". According to the IPCC, Vulnerability is the degree to which a system is susceptible to, or unable to cope with the adverse effects of climate change, including climate variability and extremes. It is a function of the character, magnitude, and rate of climate change and variation to which a system is exposed, the sensitivity and adaptive capacity of that system. Mapping climate change vulnerabilities can help governments, societies and communities know their present condition and adapt strategies to strengthen areas where they are found to be most vulnerable in order to prepare better for the future. c. EEPSEA work
The Economy and Environment Program for Southeast Asia (EEPSEA) was established in 1993 to support training and research in environmental and resource economics. Its goal is to strengthen local capacity for the economic analysis of environmental problems so that researchers can provide sound advice to policymakers (EEPSEA.org).
In 2009, EEPSEA published work on Climate Change Vulnerability Mapping for Southeast Asia by Dr. Herminia Francisco and Dr. Arief Yusuf. The research paper provides information which sub-national areas (regions/districts/provinces) are most vulnerable to climate change impacts in Southeast Asia. The assessment was carried out by overlaying climate hazard maps, sensitivity maps, and adaptive capacity maps following the vulnerability assessment framework of the United Nations’ IPCC. Using available information from secondary sources, the study used data on the spatial distribution of various climate-related hazards in 530 sub-national areas of Indonesia, Thailand, Vietnam, Lao PDR, Cambodia, Malaysia, and the Philippines. Based on their mapping assessment, all the regions of the Philippines; the Mekong River Delta in Vietnam; almost all the regions of Cambodia; North and East Lao PDR; the Bangkok region of Thailand; and West Sumatra, South Sumatra, West Java, and East Java of Indonesia are among the most vulnerable regions in Southeast Asia.
2. Objectives of the initiative
This initiative generally aims to assist local government units in developing countries in preparing appropriate plans and programs to address evolving pressures on the environment particularly that of climate change. In particular, the study shall: 2.1. Pilot test the application of the EEPSEA framework on climate change vulnerability
assessment and mapping using data generated by community-based monitoring systems (CBMS) and other available sub-national level-data from selected sites in 3 developing countries

2.2. Generate climate change vulnerability index (CCVI) and maps at the village level showing empirical evidence and analysis on the impacts of climate change
2.3. Recommend adaptation strategies based on the results of vulnerability assessment and mapping that can be integrated in disaster and other environment management plans of LGUs in the pilot areas
3. Framework and Methodology a. Climate Change Vulnerability Index
The framework for this study is based on the EEPSEA framework authored by Dr.
Herminia Francisco and Dr. Arief Anshory Yusuf2, based on the IPCC3 framework, was adapted for this study:
The climate change vulnerability index is comprised by 3 general sub-indices:
1. Exposure to climatic hazards 2. Sensitivity indicators 3. Adaptive capacity indicators
Definitions:
Vulnerability is the degree to which a system is susceptible to, or unable to cope with the adverse effects of climate change, including climate variability and extremes. Vulnerability is a function of the character, magnitude, and rate of climate change and variation to which a system is exposed, the sensitivity and adaptive capacity of that system. Exposure refers to the exposure of a system of interest to stimuli that act on that system. This can be readily conceptualized as climate variability and/or the various changes in the climate 2 Dr. Herminia Francisco is Director of the Economy and Environment Program for Southeast Asia (EEPSEA) while
Dr. Yusuf is Director of Center for Economics and Development Studies (CEDS) at Padjadjaran University in
Indonesia
3Intergovernmental Panel on Climate Change (IPCC). Third Assessment Report. Working Group II: Impacts, Adaptation and Vulnerability. 2001.

system that are often of concern to stakeholders: temperature increases, rainfall variability and change (including extremes), or changes in the frequency or intensity of tropical cyclones. Sensitivity refers to the responsiveness of a system to climate hazards. This is often represented conceptually as a dose-response model – the more sensitive a system, the larger the rate or magnitude of an adverse response to a given hazard. Sensitivity may vary considerably from one system, sector or population to another. Adaptive capacity is the ability of a system to adjust to climate change (including climate variability and extremes), to moderate the potential damage from it, to take advantage of its opportunities, or to cope with its consequences
The original EEPSEA framework uses the following formula:
Overall = (weight) (normalized Exposure index) vulnerability + (weight) (normalized Sensitivity index) index + (weight) (normalized Adaptive capacity index)
However, based on the consultation meetings and taking into consideration that vulnerability should be a function of inadequacy in adaptive capacity, a major change was implemented in the formula used as shown below:
Overall = (weight) (normalized Exposure index) vulnerability + (weight) (normalized Sensitivity index) index + (weight) (1 - normalized Adaptive capacity index)
The categories and indicators identified in localizing the EEPSEA framework on vulnerability mapping were results of consultation meetings from relevant experts in the field of climate change. It entails incorporating available and applicable local-level data and use of proxy indicators. The resulting list is shown in Table 1.
Table 1. Sub-indices, categories and indicators of the CCVI Sub-index Category Indicator
Sensitivity
Ecological Sensitivity
Proportion of Protected areas Number of Local Heritage sites
Livelihood at Risk
Percentage of agricultural lands Percentage of industrial lands and commercial lands Proportion HHs engaged in fishing
Population at Risk
Population density (Land area/population) Proportion of elders (60 and above) Proportion of children (below 15) Proportion of persons with disability
Adaptive Capacity
Economic Resource and
Average Income per capita Average number of Assets per HH
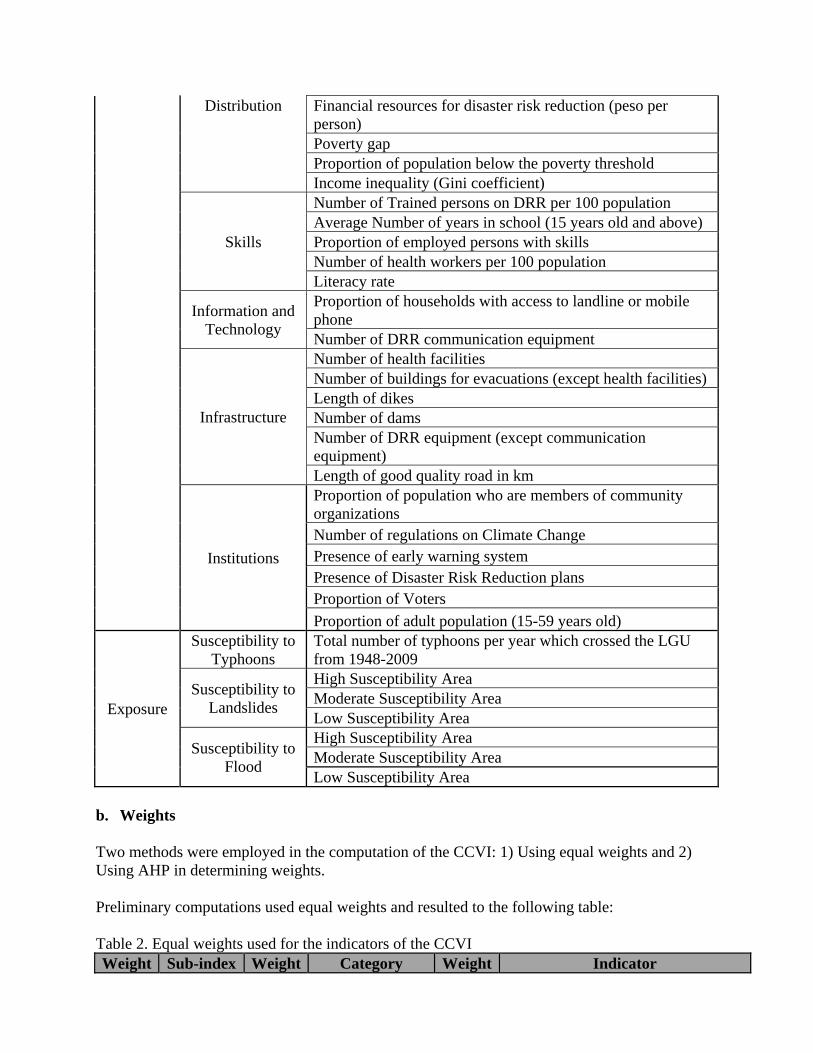
Distribution Financial resources for disaster risk reduction (peso per person) Poverty gap Proportion of population below the poverty threshold Income inequality (Gini coefficient)
Skills
Number of Trained persons on DRR per 100 population Average Number of years in school (15 years old and above) Proportion of employed persons with skills Number of health workers per 100 population Literacy rate
Information and Technology
Proportion of households with access to landline or mobile phone Number of DRR communication equipment
Infrastructure
Number of health facilities Number of buildings for evacuations (except health facilities) Length of dikes Number of dams Number of DRR equipment (except communication equipment) Length of good quality road in km
Institutions
Proportion of population who are members of community organizations Number of regulations on Climate Change Presence of early warning system Presence of Disaster Risk Reduction plans Proportion of Voters
Proportion of adult population (15-59 years old)
Exposure
Susceptibility to Typhoons
Total number of typhoons per year which crossed the LGU from 1948-2009
Susceptibility to Landslides
High Susceptibility Area Moderate Susceptibility Area Low Susceptibility Area
Susceptibility to Flood
High Susceptibility Area Moderate Susceptibility Area Low Susceptibility Area
b. Weights Two methods were employed in the computation of the CCVI: 1) Using equal weights and 2) Using AHP in determining weights. Preliminary computations used equal weights and resulted to the following table: Table 2. Equal weights used for the indicators of the CCVI Weight Sub-index Weight Category Weight Indicator
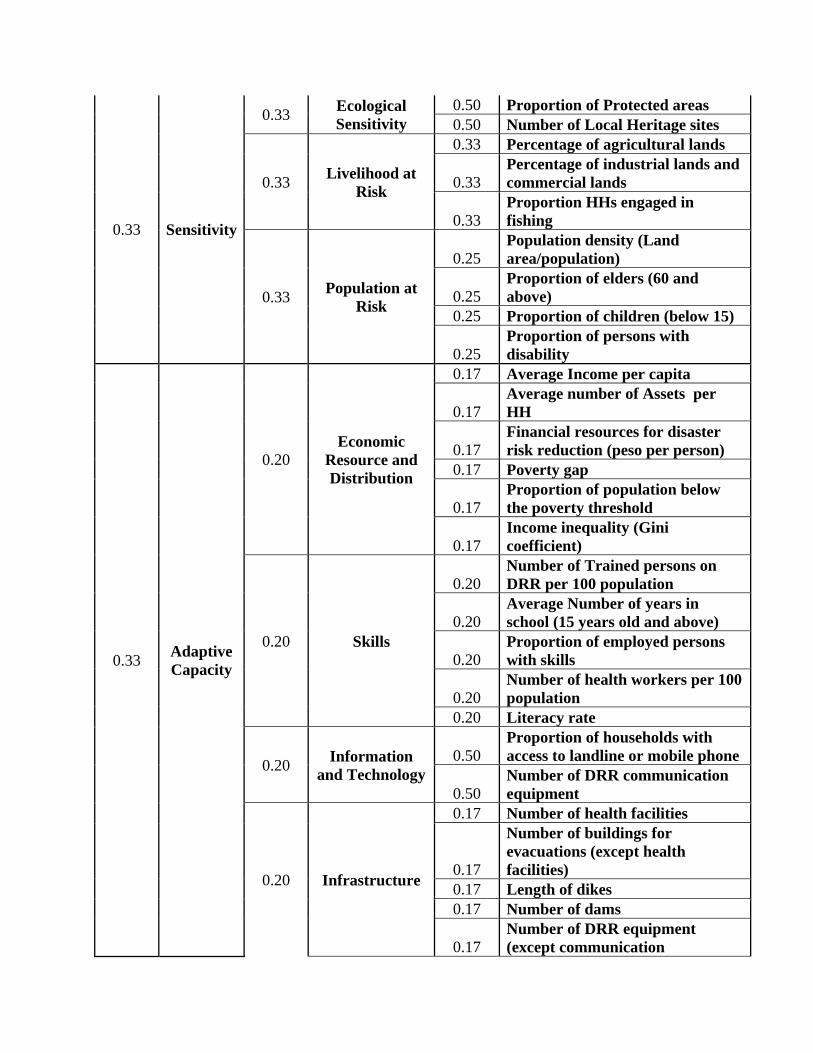
0.33 Sensitivity
0.33 Ecological Sensitivity
0.50 Proportion of Protected areas 0.50 Number of Local Heritage sites
0.33 Livelihood at
Risk
0.33 Percentage of agricultural lands
0.33 Percentage of industrial lands and commercial lands
0.33 Proportion HHs engaged in fishing
0.33 Population at
Risk
0.25 Population density (Land area/population)
0.25 Proportion of elders (60 and above)
0.25 Proportion of children (below 15)
0.25 Proportion of persons with disability
0.33 Adaptive Capacity
0.20 Economic
Resource and Distribution
0.17 Average Income per capita
0.17 Average number of Assets per HH
0.17 Financial resources for disaster risk reduction (peso per person)
0.17 Poverty gap
0.17 Proportion of population below the poverty threshold
0.17 Income inequality (Gini coefficient)
0.20 Skills
0.20 Number of Trained persons on DRR per 100 population
0.20 Average Number of years in school (15 years old and above)
0.20 Proportion of employed persons with skills
0.20 Number of health workers per 100 population
0.20 Literacy rate
0.20 Information
and Technology 0.50
Proportion of households with access to landline or mobile phone
0.50 Number of DRR communication equipment
0.20 Infrastructure
0.17 Number of health facilities
0.17
Number of buildings for evacuations (except health facilities)
0.17 Length of dikes 0.17 Number of dams
0.17 Number of DRR equipment (except communication

equipment) 0.17 Length of good quality road in km
0.20 Institutions
0.17
Proportion of population who are members of community organizations
0.17 Number of regulations on Climate Change
0.17 Presence of early warning system
0.17 Presence of Disaster Risk Reduction plans
0.17 Proportion of Voters
0.17 Proportion of adult population (15-59 years old)
0.33 Exposure
0.33 Susceptibility to
Typhoons 1.00
Total number of typhoons per year which crossed the LGU from 1948-2009
0.33 Susceptibility to
Landslides
0.50 High Susceptibility Area 0.33 Moderate Susceptibility Area 0.17 Low Susceptibility Area
0.33 Susceptibility to
Flood
0.50 High Susceptibility Area 0.33 Moderate Susceptibility Area 0.17 Low Susceptibility Area
However, importance of indicators varies and should be given appropriate weights in the index. To come up with varied weights, the Analytic Hierarchy Process (AHP) was used. AHP is a structured technique for organizing and analyzing complex decisions. Based on mathematics and psychology, it was developed by Thomas L. Saaty in the 1970s and has been extensively studied and refined since then. It has been used to assist numerous corporate and government and government decision makers. Information is decomposed into a hierarchy of criteria and alternatives. The information is then synthesized to determine relative rankings of alternatives. Prioritization is concerned with measuring importance, preference, and likelihood of influences. Using the fundamental scale of absolute numbers shown below, pair wise comparisons are used to judge how much one category/sub-category/indicator dominates another with respect to a certain property; that is, how much more important or more preferred or more likely it is. We derive priorities from judgments about the intensity of how we feel about the importance, preference, or likelihood of all the factors. Table 3. Saaty’s Fundamental Scale of Absolute Numbers corresponding to Verbal Comparisons
* Definition Explanation
1 Equal Importance Two activities contribute equally to the objective
2 Weak ----between Equal and Moderate

3 Moderate importance Experience and Judgment slightly favor one activity over another
4 Moderate plus ----between Moderate and Strong
5 Strong Importance Experience and judgment strongly favor one activity over another
6 Strong plus ----between Strong and Very Strong
7 Very strong or demonstrated importance
An activity is favored very strongly over another; its dominance demonstrated in practice
8 Very, very strong ----between Very Strong and Extreme
9 Extreme importance The evidence favoring one activity over another is one of the highest possible order of affirmation
Note: The fundamental scale has been derived mathematically from stimulus-response theory in psychology.
Selected experts from different government and non-government agencies working on climate-change related initiatives were invited to the AHP workshop. After providing a brief discussion on the indicators of CCVI and how their judgments will be processed, the experts were provided with a questionnaire wherein they recorded their judgments. One pair wise comparison at a time, each expert decided which is more important between X and Y sub-indices/ sub-categories/ indicators and by how much using the Fundamental Scale of Absolute Numbers shown in Table 3. The questionnaire consisted of 85 pair wise comparisons at 3 levels. The first level consists of pair wise comparisons among the 3 sub-index of exposure, adaptive capacity and sensitivity. The second level consisted of 16 pair wise comparisons among the sub-indices of adaptive capacity, sensitivity and exposure. Lastly, the 3rd level is devoted to the 66 pair wise comparisons among the indicators under adaptive capacity and sensitivity. Note that there were no pair wise comparisons made among the indicators used under the exposure sub-index as they are already expert’s opinion from the Mines and Geosciences Bureau, the office who prepares the geo-hazards maps. Table 4 shows sample encoded judgement/scores of experts. Table 4. Resulting weights for the CCVI based on expert’s judgement using the AHP Weight Sub-index Weight Sub-Category Weight Indicators
0.30 Sensitivity
0.15 Ecological Sensitivity
0.73 Proportion of Protected areas 0.27 Number of Local Heritage sites
0.31 Livelihood at Risk
0.47 Percentage of agricultural lands
0.19 Percentage of industrial lands and commercial lands
0.34 Proportion HHs engaged in fishing
0.53 Population at 0.23 Population density (Land

Risk area/population)
0.22 Proportion of elders (60 and above)
0.25 Proportion of children (below 15)
0.29 Proportion of persons with disability
0.37 Adaptive Capacity
0.21 Economic Resource and Distribution
0.21 Average Income per capita
0.11 Average number of Assets per HH
0.17 Financial resources for disaster risk reduction (peso per person)
0.18 Poverty gap
0.21 Proportion of population below the poverty threshold
0.12 Income inequality (Gini coefficient)
0.19 Skills
0.32 Number of Trained persons on DRR per 100 population
0.12 Average Number of years in school (15 years old and above)
0.19 Proportion of employed persons with skills
0.22 Number of health workers per 100 population
0.15 Literacy rate
0.14 Information and Technology
0.37 Proportion of households with access to landline or mobile phone
0.63 Number of DRR communication equipment
0.26 Infrastructure and Service Facilities
0.18 Number of health facilities
0.20
Number of buildings for evacuations (except health facilities)
0.13 Length of dikes 0.09 Number of dams
0.27
Number of DRR equipment (except communication equipment)
0.13 Length of good quality road in km
0.20 Institutions 0.14
Proportion of population who are members of community organizations
0.15 Number of regulations on Climate Change
0.34 Presence of early warning system

0.19 Presence of Disaster Risk Reduction plans
0.08 Proportion of Voters
0.10 Proportion of adult population (15-59 years old)
0.34 Exposure
0.39 Number of typhoons
1.00
Total number of typhoons per year which crossed the LGU from 1948-2009
0.31 Susceptibility to Landslides
High Susceptibility Area Moderate Susceptibility Area Low Susceptibility Area
0.30 Susceptibility to Flood
High Susceptibility Area Moderate Susceptibility Area Low Susceptibility Area
Table 5 shows the comparison of the weights using a) equal and b) based on expert’s judgment. Among the sub-indices, the results of the AHP workshop show that experts deem adaptive capacity to be more important than sensitivity and exposure as it accounts for 0.37. Sensitivity is least important among the three though the weights are not really that far from each other. In terms of sensitivity, population at risks was given more value than livelihood and ecological sensitivity which makes perfect sense as the priority in disaster management to save lives first, property second and ecology last. Among the sub-categories of adaptive capacity, infrastructure and service facilities were said to be more important the other 5 sub-categories. Typhoon was also considered more important than landslides and floods. Table 5. Comparison of weights using equal and revised method based on expert’s judgment
Weights
Sub-index
Weights
Sub-Category
Weights
Indicators Equal Re-
vised Equal Re-
vised Equal Re-
vised
0.33 0.30 Sensi-tivity
0.33 0.15 Ecological Sensitivity
0.50 0.73 Proportion of Protected areas 0.50 0.27 Number of Local Heritage sites
0.33 0.31 Livelihood at
Risk
0.33 0.47 Percentage of agricultural lands
0.33 0.19 Percentage of industrial lands and commercial lands
0.33 0.34 Proportion HHs engaged in fishing
0.33 0.53 Population at
Risk
0.25 0.23 Population density (Land area/population) 0.25 0.22 Proportion of elders (60 and above) 0.25 0.25 Proportion of children (below 15)
0.25 0.29 Proportion of persons with disability
0.33 0.37
Adaptive
Capacity
0.20 0.21 Economic
Resource and Distribution
0.17 0.21 Average Income per capita 0.17 0.11 Average number of Assets per HH
0.17 0.17 Financial resources for disaster risk reduction (peso per person)
0.17 0.18 Poverty gap

0.17 0.21 Proportion of population below the poverty threshold
0.17 0.12 Income inequality (Gini coefficient)
0.20 0.19 Skills
0.20 0.32 Number of Trained persons on DRR per 100 population
0.20 0.12 Average Number of years in school (15 years old and above)
0.20 0.19 Proportion of employed persons with skills 0.20 0.22 Number of health workers per 100 population 0.20 0.15 Literacy rate
0.20 0.14 Information
and Technology
0.50 0.37 Proportion of households with access to landline or mobile phone
0.50 0.63 Number of DRR communication equipment 0.20
0.26 Infrastruc-
ture
0.17 0.18 Number of health facilities
0.17 0.20
Number of buildings for evacuations (except health facilities)
0.17 0.13 Length of dikes 0.17 0.09 Number of dams
0.17 0.27
Number of DRR equipment (except communication equipment)
0.17 0.13 Length of good quality road in km
0.20 0.20 Institutions
0.17 0.14 Proportion of population who are members of community organizations
0.17 0.15 Number of regulations on Climate Change
0.17 0.34 Presence of early warning system
0.17 0.19 Presence of Disaster Risk Reduction plans
0.17 0.08 Proportion of Voters
0.17 0.10 Proportion of adult population (15-59 years old)
0.33 0.34 Expos
ure
0.33 0.39 Susceptibility to Typhoons 1.00
Total number of typhoons per year which crossed the LGU from 1948-2009
0.33 0.31 Susceptibility to Landslides
0.50 High Susceptibility Area 0.33 Moderate Susceptibility Area 0.17 Low Susceptibility Area
0.33 0.30 Susceptibility
to Flood
0.50 High Susceptibility Area
0.33 Moderate Susceptibility Area
0.17 Low Susceptibility Area
Table 6 shows the contribution of each indicator to the index. Results from the AHP workshop shows that among all indicators from the sensitivity and adaptive capacity sub-index that were given weights, the proportion of persons with disability ranked 1st and given overall weight of 0.047. Using equal weights, this indicator was given 0.028 value. Furthermore, expert’s judgment using AHP shows that the least important is the indicator proportion of voters with 0.006 but in an equal weights environment, this indicator got 0.011. It is also interesting to note that there are indicators whose weights are still the same using equal and revised weights from expert’s judgement using AHP. These are:
a. Number of DRR communication equipment (0.033) b. Proportion of employed persons with skills (0.013)

c. Number of regulations on Climate Change (0.011)
Meanwhile, the sub-categories under exposure (landslide, flood and typhoon) were included in the AHP but not the indicators/susceptibility categories (high, moderate and low) as they are already pre-assigned experts’ opinion. Table 6. Synthesized weights for the CCVI based on equal and revised weights from expert’s judgement using the AHP
Indicators Synthesized weights Equal Revised
Proportion of persons with disability 0.028 0.047 Percentage of agricultural lands 0.037 0.043 Proportion of children (below 15) 0.028 0.040 Population density (Land area/population) 0.028 0.036 Proportion of elders (60 and above) 0.028 0.036 Proportion of Protected areas 0.056 0.033 Number of DRR communication equipment 0.033 0.033 Proportion HHs engaged in fishing 0.037 0.032 Number of DRR equipment (except communication equipment) 0.011 0.026 Presence of early warning system 0.011 0.025 Number of Trained persons on DRR per 100 population 0.013 0.022 Proportion of households with access to landline or mobile phone 0.033 0.019 Number of buildings for evacuations (except health facilities) 0.011 0.019 Percentage of industrial lands and commercial lands 0.037 0.018 Number of health facilities 0.011 0.017 Average Income per capita 0.011 0.016 Proportion of population below the poverty threshold 0.011 0.016 Number of health workers per 100 population 0.013 0.016 Presence of Disaster Risk Reduction plans 0.011 0.014 Poverty gap 0.011 0.014 Financial resources for disaster risk reduction (peso per person) 0.011 0.013 Proportion of employed persons with skills 0.013 0.013 Length of dikes 0.011 0.012 Number of Local Heritage sites 0.056 0.012 Length of good quality road in km 0.011 0.012 Number of regulations on Climate Change 0.011 0.011 Proportion of population who are members of community organizations 0.011 0.010 Literacy rate 0.013 0.010 Income inequality (Gini coefficient) 0.011 0.009 Average number of Assets per HH 0.011 0.009 Average Number of years in school (15 years old and above) 0.013 0.009 Number of dams 0.011 0.008 Proportion of adult population (15-59 years old) 0.011 0.007 Proportion of Voters 0.011 0.006 Sub-total 0.667 0.663 Total number of typhoons per year which crossed the LGU from 1948- 0.111 0.131

2009
Flood Susceptibility 0.111 0.101 Landslide Susceptibility 0.111 0.105 Sub-total 0.333 0.337 Total 1.000 1.000
4. Sources of data There are three main sources of data used in the computation of the AHP: CBMS, LGU administrative data and secondary data from National Government Agencies. In terms of exposure indicators, the number of typhoons which crossed the province from 1948-2009 were taken from the Philippine Atmospheric, Geophysical and Astronomical Services Administration (PAGASA) - an attached agency to the Department of Science and Technology (DOST) which provides weather, flood, climate and astronomical products and services to promote the people’s safety and well-being, and contribute to national development. Meanwhile, susceptibility maps of landslide and typhoon were taken from the Mines and Geosciences Bureau (MGB) – a bureau under the Department of Environment and Natural Resources (DENR) which oversees the country's mineral resources and conducts geological studies as an integral element of socio-economic development, environmental protection and human safety. Sensitivity indicators such as households engaged in fishing as well as proportion of elders, children and persons with disabilities are taken from CBMS database of the LGU. Other sensitivity indicators on protected areas, local heritage sites and percentages of agricultural, industrial and commercial lands were taken from administrative records of the LGU. Meanwhile, population density is computed using land area (from LGU records) divided by population (CBMS results). 12 out of 25 Indicators comprising adaptive capacity are from CBMS while the remaining is from LGU records.
5. Results
a. Carmona
Table 7 shows the resulting computed sub-indices and vulnerability index. Barangay 1 (Pob.) resulted to be the most vulnerable among the barangays. As shown in Figure 1, Barangay 1 (Pob.) is most exposed to climate hazards as the barangays is surrounded by a river making it highly susceptible to floods.
Table 7. Computed sub-indices and Climate Change Vulnerability, Carmona, Cavite
Barangay SensitivityAdaptive Capacity Exposure
Climate Change Vulnerability
Bancal 0.365 0.577 0.392 0.452

Cabilang Baybay 0.253 0.562 0.394 0.413 Lantic 0.458 0.545 0.392 0.467 Mabuhay 0.257 0.532 0.408 0.408 Maduya 0.444 0.403 0.402 0.415 Milagrosa 0.463 0.470 0.423 0.452 Barangay 1 (Pob.) 0.387 0.642 0.465 0.506 Barangay 2 (Pob.) 0.342 0.601 0.422 0.463 Barangay 3 (Pob.) 0.164 0.646 0.423 0.428 Barangay 4 (Pob.) 0.192 0.587 0.423 0.414 Barangay 5 (Pob.) 0.214 0.641 0.427 0.442 Barangay 6 (Pob.) 0.217 0.683 0.426 0.458 Barangay 7 (Pob.) 0.311 0.648 0.424 0.472 Barangay 8 (Pob.) 0.219 0.619 0.399 0.426
Figure 1. Exposure Sub-Index, by Barangay, Municipality of Carmona, 2011
In terms of sensitivity, Brgy. Milagrosa ranked 1st at 0.463 because of high livelihood and population at risk in this barangay. Barangay 3 registered the lowest sensitivity sub-index.
Figure 2. Sensitivity Sub-Index, by Barangay, Municipality of Carmona, 2011

Inadequacy in adaptive capacity is observed to be higher in the poblacion barangays as compared to the other barangays.
Figure 3. Lack of Adaptive Capacity Sub-Index, by Barangay,
Municipality of Carmona, 2011
As shown in Figure 4, Barangay 1 was recorded to have the highest vulnerability index at 0.506.
Figure 4. Climate Change Vulnerability Index, by Barangay, Municipality of Carmona, 2011

b. Marinduque
Exposure. The results showed that from among the six municipalities, the Municipality of Sta. Cruz which is the largest municipality in terms of land area has high Exposure Index with 0.762. This means that many of the barangays in Sta.Cruz are prone to landslides, flooding and typhoon. Figure 5. Exposure Index, by Municipality and Barangay, Province of Marinduque, 2011
The exposure index map (Figure 5) simply explains that the darker the color, the higher the vulnerability index. Sta. Cruz recorded the highest Sensitivity Index with 0.561 followed by Mogpog with 0.533. Figure 6. Sensitivity Index, by Municipality and Barangay, Province of Marinduque, 2011

Figure 6 indicates that the barangays with high Sensitivity Index are located mostly in the interior portion or along the coastal areas. Lack of Adaptive Capacity. Figure 7 shows clearly that among the 6 municipalities, Boac has the best adaptive capacity index. Available data show that Boac, which is a 1st class municipality, has available health workers and barangay health facilities that can cater to the population in the area. It may not yet be adequate, but compared with the other municipalities in the province, it is better equipped and can address these particular service and facility requirement in the barangay. For instance, there are evacuation centers in almost all the barangays (usually, the schools and barangay hall/centers are being utilized as evacuation center); most barangays have good roads; 100 percent of the barangays have DRR communication equipment such as cellphone; presence of EWS; and more than half of the household population have access to phones. Figure 7. Lack of Adaptive Capacity Index, by Municipality and Barangay, Province of Marinduque, 2011

Climate Change Vulnerability Index. Summarizing the 3 categories or indexes, the result shows that the municipality of Santa Cruz has the highest CCVI at 0.789. Figure 8. Climate Change Vulnerability Index, by Municipality and Barangay, Province of Marinduque, 2011

6. Policy Recommendations
a. Conclusion With the climate change manifestations already being observed in the world, international and national initiatives have been conducted related to climate change vulnerability assessment. However, local governments, being the forefront in providing service to citizens, should be equipped with knowledge on vulnerability assessment to better serve its constituents. This study contributes to this idea of capacitating local government units to estimate vulnerabilities down to the village level. LGUs selected as pilot sites for this study are now aware of these vulnerabilities and had provided proposed adaptation strategies to address them. Moreover, the study had employed an expanded set of indicators available at the local level. In the Philippines, the local government units have a rich database having implemented CBMS. 16 out of the 41 indicators/sub-categories considered in the index are from CBMS database. 7 of the indicators/sub-categories are from NGAs and the remaining 18 indicators are from administrative records from different offices of the LGUs. Another significant contribution of this initiative is determination of appropriate weights using the AHP method. In actual scenario, lives are more important than property, which in turn is given more value than ecology. However, the judgment on the importance of the indicators is bound by the actual list of indicators provided. Expanding the list of indicators in the future will entail another AHP workshop as judgment on 2 indicators differs when another indicator in added in the scenario. b. Policy Recommendations In terms of policy recommendations, the results of this initiative can be used as inputs to the drafting/formulating or enhancing existing Disaster Risk Reduction and Climate Change Adaptation (DRR CCA) Plan, which is being prepared at the national as well as local levels. In the mainstreaming of LGU DRR CCA in development planning process, the result of the CCVI is an important input particularly in the prioritization of programs/projects for budgeting and implementation. It is likewise recommended to local governments included in this initiative to undertake the following adaptation strategies: Possible adaptation strategies Agriculture Adjustment of planting dates and crop variety;
Crop relocation; Improved land management, e.g. erosion control and soil protection through
tree planting and reforestation Infrastructure/
settlement
(including
Temporary or permanent relocation; Placement of seawalls, dikes and storm surge barriers; Building/repair of new/existing dams Land acquisition and creation of marshlands/wetlands as buffer against sea
level rise and flooding; Protection of existing natural barriers

coastal zones) and service facilities
Installation of Community early warning system such as flood warning system
Building drainage channels and floodways; Land use planning for flood avoidance. Establishment/construction of evacuation centers in strategic areas in the
communities. Human health Provision of emergency medical services;
Improved climate-sensitive disease surveillance and control; Safe water and improved sanitation
Transport Design standards and planning for roads, rail and other infrastructure to cope with warming and drainage
Improvement and Construction of Roads and Feeder Roads, Drainage Facilities, Footbridges, Spillways and Floodways to priority areas.
Emergency response
Capability and Capacity Building of the Local Disaster Risk Reduction Council on Disaster Response and Preparedness (warning, search and rescue, emergency relief, logistic and supply, communication and information management, emergency operation management, evacuation plan and management, health emergency education and post disaster management).
Review/Updating/enhancement of PDRRM Plan. Strengthen coordination with NGOs and communities

References:
Chanton, J. (n.d.). Global Warming & Rising Oceans. Retrieved March 11, 2012, from http://www.actionbioscience.org/environment/chanton.html.
Climate Institute. (n.d.). Oceans and Sea Level Rise. Retrieved March 11, 2012, from http://www.climate.org/topics/sea-level/index.html
Environmental Defense Fund. (2007). More Droughts Expected in Warmer World. Retrieved March 10, 2012, from http://apps.edf.org/article.cfm?contentID=6580. Francisco, H. A. (2008). Adaptation to Climate Change: Needs and Opportunities in Southeast Asia. Asean Economic Bulletin. 25 (1). Francisco, H. A.; Yusuf A. (2009). Climate Change Vulnerability Mapping for Southeast Asia. Economy and Environment Program for Southeast Asia (EEPSEA). McCarthy, J.; Canziani, O.; Leary, N.; Dokken, D.; and White, K. (eds). (2001) Climate Change 2001: Impacts, Adaptation, and Vulnerability. Contribution of Working Group II to the Third Assessment Report of the Inter-governmental Panel on Climate Change. Cambridge University Press. ISBN 0 521 80768 9. Pachauri, R.K; and Reisinger, A., ed., Core Writing Team. (2007). Climate Change 2007: Synthesis Report, Contribution of Working Groups I, II and III to the Fourth Assessment Report of the Intergovernmental Panel on Climate Change, Geneva, Switzerland: IPCC, ISBN 92-9169-122-4. United Nations Framework Convention on Climate Change. Feeling the Heat: Climate Science and the Basis of the Convention (n.d.). Retrieved March 11, 2012, from http://unfccc.int/essential _background/the_science/items/6064.php.
US Environment Protection Agency. (n.d.). A Student’s guide to Global Climate Change. Retrieved March 11, 2012, from http://epa.gov/climatechange/kids/impacts/signs/ temperature.html
World Meteorological Organization. (n.d.). Natural Hazard. Retrieved March 11, 2012 from http://www.wmo.int/pages/themes/hazards/index_en.html