climate change risk assessment adaptation plan
TRANSCRIPT
Climate Change Risk Assessment
and
Adaptation Plan
Final Risk Assessment Report
15 April 2009
Copyright © Marsden Jacob Associates and Broadleaf Capital International Pty Ltd 2008
Redland City Council
Climate Change Risk Assessment and Adaptation Plan
15 April 2009
2
2
TABLE OF CONTENTS
Page
1. Summary ............................................................................................................... 3
2. Risk Management Process .................................................................................... 5
2.1.Scope of the Assessment ......................................................................................... 5
2.2.Rating Periods .......................................................................................................... 7
2.3.Key Elements ............................................................................................................ 8
2.4.Climate Change and Policy Scenarios ...................................................................... 9
2.5.Objectives and Success Criteria .............................................................................10
2.6.Scales for Consequences, Likelihoods and Risk .....................................................10
3. Results ................................................................................................................. 14
3.1.Results in Brief .......................................................................................................14
3.2.Risks for Infrastructure...........................................................................................23
3.3.Risks for Planning and Development .....................................................................38
3.4.Risks for Environmental Management ...................................................................42
3.5.Risks for Community and Social Planning ..............................................................55
3.6.Risks for Corporate Services...................................................................................66
4. Preliminary Spatial and Other Assessments ....................................................... 68
4.1.Issues for Infrastructure .........................................................................................70
4.2.Issues for Planning and Development ...................................................................72
4.3.Issues for Environmental Management .................................................................75
4.4.Issues for Community and Social Planning ............................................................83
5. Follow-Up Assessments ...................................................................................... 86
6. Appendix 1: Risk Register .................................................................................... 99
7. Appendix 2: Climate Change and Policy Scenarios ........................................... 103
7.1.Climate Change Scenarios ....................................................................................103
7.2.Policy Scenarios ....................................................................................................105
8. Appendix 3: Risk Workshop Participants .......................................................... 109
Redland City Council
Climate Change Risk Assessment and Adaptation Plan
15 April 2009
3
3
1. Summary
Climate change is emerging as a critical issue for Australian communities. Even with
international action to reduce greenhouse gas emissions, the global climate is projected to
undergo significant change in the 21st Century, with the potential to create many risks as
well as opportunities. It is important that the impacts of climate change are addressed at
the local level, since local attributes including socio-economic characteristics and the
physical environment will significantly determine the extent of the risks, as well as the
nature of adaptation responses.
Recognising this, the Commonwealth Government has provided funding through the Local
Adaptation Pathways Program (LAPP) to help councils undertake climate change risk
assessments to identify likely impacts of climate change on council operations, and develop
action plans to prepare for the likely local impacts of climate change. Redland City Council
(RCC) is one of over 60 council that have secured funding in the first round of LAPP.
This is a report of a climate change risk assessment conducted on behalf of Council by
Marsden Jacob Associates (MJA) and Broadleaf Capital International (Broadleaf) as the first
step toward developing a Climate Change Risk Assessment and Adaptation Plan. The
purpose of the risk assessment was to explore the ways in which climate change may
impact on Council assets and services, and to obtain a prioritised register of risks that could
be taken forward as the focus for the adaptation plan.
The project is funded in part by the Australian Government Department of Climate Change,
and will be undertaken in two stages:
- Climate Change Risk Management – identifying and prioritising climate change risks.
- Climate Change Adaptation – developing an adaptation plan that will help RCC to
mitigate key climate change threats and realising any opportunities.
The Climate Change Risk Management component of the project has been carried out in
the following seven discrete steps:
- Preliminary Desktop Analysis;
- Risk Assessment Workshops;
- Draft Risk Assessment Report;
- Issues Paper;
- Preliminary Spatial and Other Assessments; and
Final Risk Assessment Report.
More detailed spatial modelling of sea level, storm surges, severe storms and flooding will
follow. This work was delayed due to: (a) the decision by RCC to commission a review of the
existing work of Cardno Lawson Treloar (Cardno); and (b) the further delay while Cardno
completed their study and provided us with their datasets.
Redland City Council
Climate Change Risk Assessment and Adaptation Plan
15 April 2009
4
4
The risk assessment followed the approach described in the
Australian Greenhouse Office publication, Climate Change Impacts
and Risk Management: A Guide for Business and Government.
Broadleaf and MJA authored the AGO Guide, which is based on
the Australian standard for Risk Management AS/NZS4360 (2004).
The assessments utilised the RCC risk evaluation framework,
which is described in its Risk Assessment Handbook and précised
in Section 2.
In brief, forty-eight (48) risks were identified against five Key Elements and 31 Risk
Categories. None of these was rated Extreme under any of the three time horizons upon
which the assessment was based (current, 2030 and 2070). A synopsis of ratings and
priorities (Figure 4) showed that risks to Infrastructure dominated the results overall, and
dominated the Medium-High ranks. This was most obvious for short-term risks, but the
trend persisted for all three time periods considered (immediate, 2020, 2070). One risk to
Corporate Services was also highly ranked. Eleven risks were accrued to Environmental
Management and ten to Community and Social Planning. A small number of these achieved
a High rating in the longer term (2070). Risk differences were also assessed (Table 8), and
illustrated the extent to which key risks were expected to change over the three times
periods. The extent of change reflects both the sensitivity to the particular climate change
variable(s) concerned — in particular, the proximity of any critical climate thresholds — and
the extent to which identified controls are able to mitigate the increasing pressure from
climate change.
The risks and priorities obtained from the risk assessment workshop are listed in the risk
register in Appendix 1 (page 99). Some preliminary spatial and other assessments have
been carried out to better understand key issues that arose during the process. These
assessments are documented in section 4. The risk register and preliminary assessments
will be taken forward to the adaptation planning component of the project.
The report also highlights some areas where follow-up spatial risk assessment and other
forms of desktop assessment will help to clarify or substantiate individual risks or risk
ratings (section 5). We do not maintain that all of this work need be done immediately, and
suggest only that RCC review the summary and, where relevant, the more detailed
discussions of each risk, and draw their own conclusions about the assessments that they
consider most critical to the integrity of the exercise.
Redland City Council
Climate Change Risk Assessment and Adaptation Plan
15 April 2009
5
5
2. Risk Management Process
The climate change risk management component of the project followed the approach and
terminology described in the Australian Greenhouse Office (AGO) publication, Climate
Change Impacts and Risk Management: A Guide for Business and Government. Broadleaf
and MJA authored the AGO Guide, which is based on the Australian standard for Risk
Management AS/NZS4360 (2004).
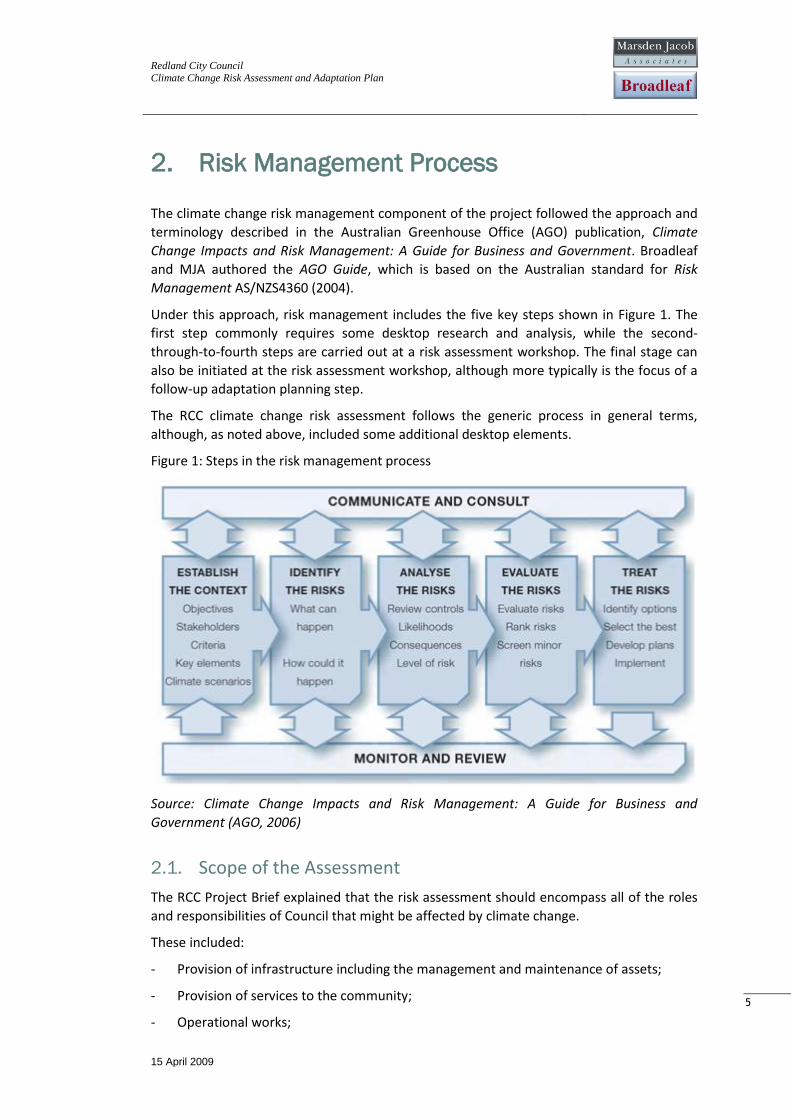
Under this approach, risk management includes the five key steps shown in Figure 1. The
first step commonly requires some desktop research and analysis, while the second-
through-to-fourth steps are carried out at a risk assessment workshop. The final stage can
also be initiated at the risk assessment workshop, although more typically is the focus of a
follow-up adaptation planning step.
The RCC climate change risk assessment follows the generic process in general terms,
although, as noted above, included some additional desktop elements.
Figure 1: Steps in the risk management process
Source: Climate Change Impacts and Risk Management: A Guide for Business and
Government (AGO, 2006)
2.1. Scope of the Assessment
The RCC Project Brief explained that the risk assessment should encompass all of the roles
and responsibilities of Council that might be affected by climate change.
These included:
- Provision of infrastructure including the management and maintenance of assets;
- Provision of services to the community;
- Operational works;
Redland City Council
Climate Change Risk Assessment and Adaptation Plan
15 April 2009
6
6
- Planning and management of development and land use; and
- Land and water management.
The Project Brief also indicated that the risk assessment should not extend to Redland
Water and Waste (RWW) water or wastewater bulk supply, transport, or distribution. The
state government water reforms in southeast Queensland (southeast Queensland) remove
and transition most of RWW into new State-operated regional water businesses for which
the planning horizon is now substantially outside the scope of Council influence. We note in
particular that:
- The bulk supply entity now controls RWW major water supply assets (handed over on
30 June 2008), including Leslie Harrison Dam, Capalaba water treatment plant, North
Stradbroke Island (NSI) bore fields and the NSI water treatment plant.
- The bulk transport entity now controls the main trunk water pipeline from NSI to
Heinemann Road reservoir, together with the bulk main from Capalaba treatment
plant, Alexandra Hills reservoir and Heinemann Road reservoir (as of 30 June 2008).
- The water and wastewater reticulation and wastewater treatment plants will be
transitioned to a new single water distribution business by July 2010, with the retail
functions moving to a separate retail business at the same time.
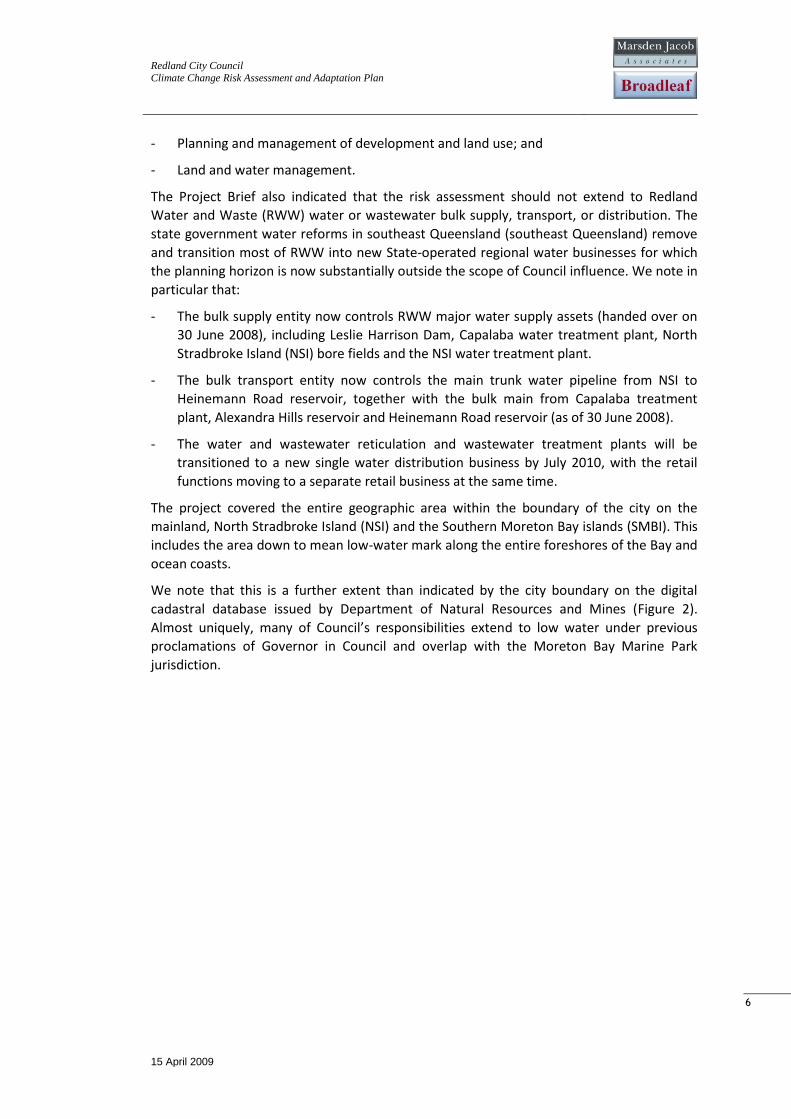
The project covered the entire geographic area within the boundary of the city on the
mainland, North Stradbroke Island (NSI) and the Southern Moreton Bay islands (SMBI). This
includes the area down to mean low-water mark along the entire foreshores of the Bay and
ocean coasts.
We note that this is a further extent than indicated by the city boundary on the digital
cadastral database issued by Department of Natural Resources and Mines (Figure 2).
Almost uniquely, many of Council’s responsibilities extend to low water under previous
proclamations of Governor in Council and overlap with the Moreton Bay Marine Park
jurisdiction.
Redland City Council
Climate Change Risk Assessment and Adaptation Plan
15 April 2009
7
7
Figure 2: City of Redland
Source: digital cadastral database, Queensland Department of Natural Resources and Mines
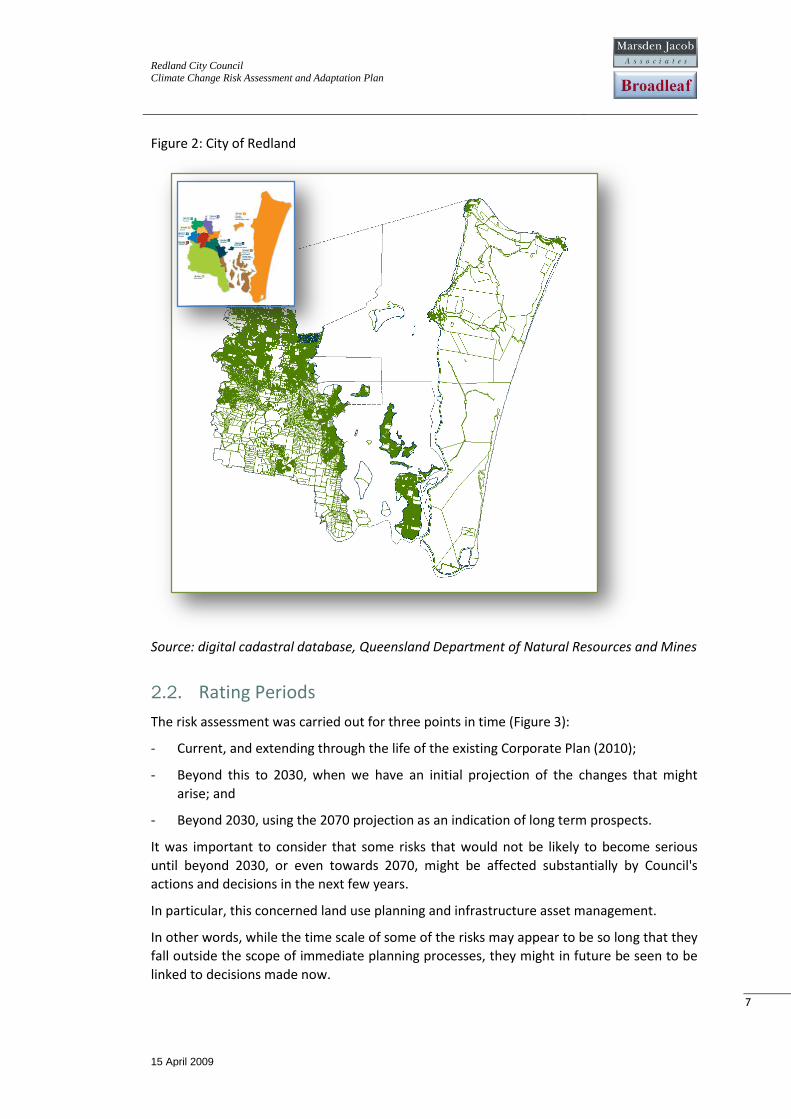
2.2. Rating Periods
The risk assessment was carried out for three points in time (Figure 3):
- Current, and extending through the life of the existing Corporate Plan (2010);
- Beyond this to 2030, when we have an initial projection of the changes that might
arise; and
- Beyond 2030, using the 2070 projection as an indication of long term prospects.
It was important to consider that some risks that would not be likely to become serious
until beyond 2030, or even towards 2070, might be affected substantially by Council's
actions and decisions in the next few years.
In particular, this concerned land use planning and infrastructure asset management.
In other words, while the time scale of some of the risks may appear to be so long that they
fall outside the scope of immediate planning processes, they might in future be seen to be
linked to decisions made now.
Redland City Council
Climate Change Risk Assessment and Adaptation Plan
15 April 2009
8
8
Figure 3: Risk rating time periods
2.3. Key Elements
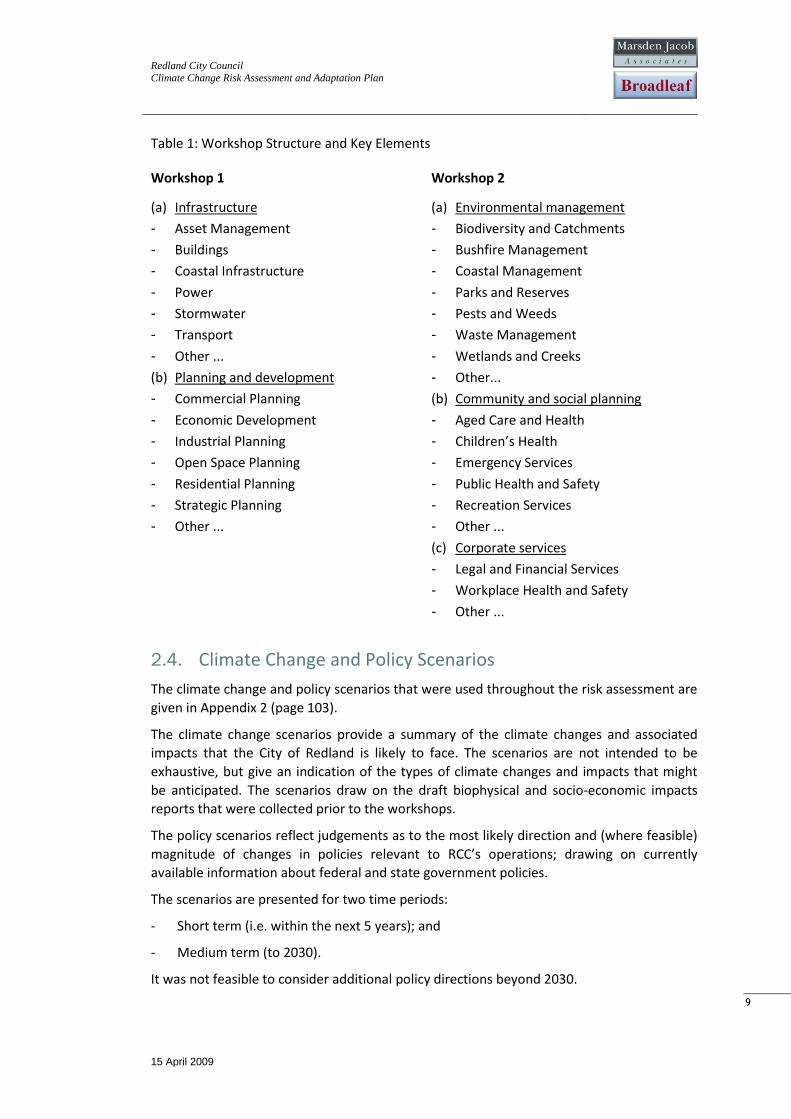
Key Elements and Risk Categories are a set of topics that allow a systematic approach to the
risk identification and analysis steps of the process. Each topic is somewhat narrower than
the entire assessment scope, allowing workshop attendees to focus their thoughts and go
into more depth than they would if they tried to deal with everything in one go.
The Key Elements and Risk Categories that were used for the risk workshops are shown in
Table 1. They provided a useful breakdown of RCC operations and services, and useful
division of expertise.
Current - 2010
2030
2070
Redland City Council
Climate Change Risk Assessment and Adaptation Plan
15 April 2009
9
9
Table 1: Workshop Structure and Key Elements
Workshop 1 Workshop 2
(a) Infrastructure
- Asset Management
- Buildings
- Coastal Infrastructure
- Power
- Stormwater
- Transport
- Other ...
(b) Planning and development
- Commercial Planning
- Economic Development
- Industrial Planning
- Open Space Planning
- Residential Planning
- Strategic Planning
- Other ...
(a) Environmental management
- Biodiversity and Catchments
- Bushfire Management
- Coastal Management
- Parks and Reserves
- Pests and Weeds
- Waste Management
- Wetlands and Creeks
- Other...
(b) Community and social planning
- Aged Care and Health
- Children’s Health
- Emergency Services
- Public Health and Safety
- Recreation Services
- Other ...
(c) Corporate services
- Legal and Financial Services
- Workplace Health and Safety
- Other ...
2.4. Climate Change and Policy Scenarios
The climate change and policy scenarios that were used throughout the risk assessment are
given in Appendix 2 (page 103).
The climate change scenarios provide a summary of the climate changes and associated
impacts that the City of Redland is likely to face. The scenarios are not intended to be
exhaustive, but give an indication of the types of climate changes and impacts that might
be anticipated. The scenarios draw on the draft biophysical and socio-economic impacts
reports that were collected prior to the workshops.
The policy scenarios reflect judgements as to the most likely direction and (where feasible)
magnitude of changes in policies relevant to RCC’s operations; drawing on currently
available information about federal and state government policies.
The scenarios are presented for two time periods:
- Short term (i.e. within the next 5 years); and
- Medium term (to 2030).
It was not feasible to consider additional policy directions beyond 2030.
Redland City Council
Climate Change Risk Assessment and Adaptation Plan
15 April 2009
10
10
2.5. Objectives and Success Criteria
Redland City Council’s strategic priorities are contained within the Corporate Plan 2006-
2010. In brief, Council is focussed on the following:
- Natural Environment: Ensure the enhancement of biodiversity including koala habitat,
bushland, green-space, waterways, catchments, air and coastal ecosystems in
recognition of our unique location on Moreton Bay.
- Land Use: Preserve a balance with urban, rural, bushland, village, coastal and island
character of the Redlands by managing growth.
- Essential Services: Provide and maintain water, waste services, roads, drainage and
support the provision of transport and waterways infrastructure.
- Community Health and Wellbeing: Build safe, strong and self reliant communities with
access to community services, infrastructure and opportunities for participation in
community life.
- Economic Prosperity: Enhance employment participation and the community’s
standard of living through encouraging economic development opportunities.
- Governance: To provide a clear organisational direction supported by effective
leadership and a framework of policies, plans and strategies that are responsive to the
community’s needs and which promote accountable and ethical standards of practice.
- Corporate Services: Support the organisation’s capacity to deliver services to the
community by building a skilled, motivated and continually learning workforce,
ensuring our assets and finances are well managed, our corporate knowledge is
captured and used to best advantage, and that we market and communicate our
services effectively.
These priorities were used as a guide in identifying and analysing the risks associated with
climate change.
2.6. Scales for Consequences, Likelihoods and Risk
Three scales were used for the risk assessment:
- A scale to describe the level of consequence of a risk if it should happen;
- A scale to describe the likelihood of suffering that level of consequence; and
- A scale to assign a priority rating to each risk, given its consequences and likelihood.
Redland City Council has published a high-level Risk Management Framework, as well as
the more operational Risk Assessment Handbook. The Handbook includes scales for
consequences and likelihood, and a matrix for risk evaluation.
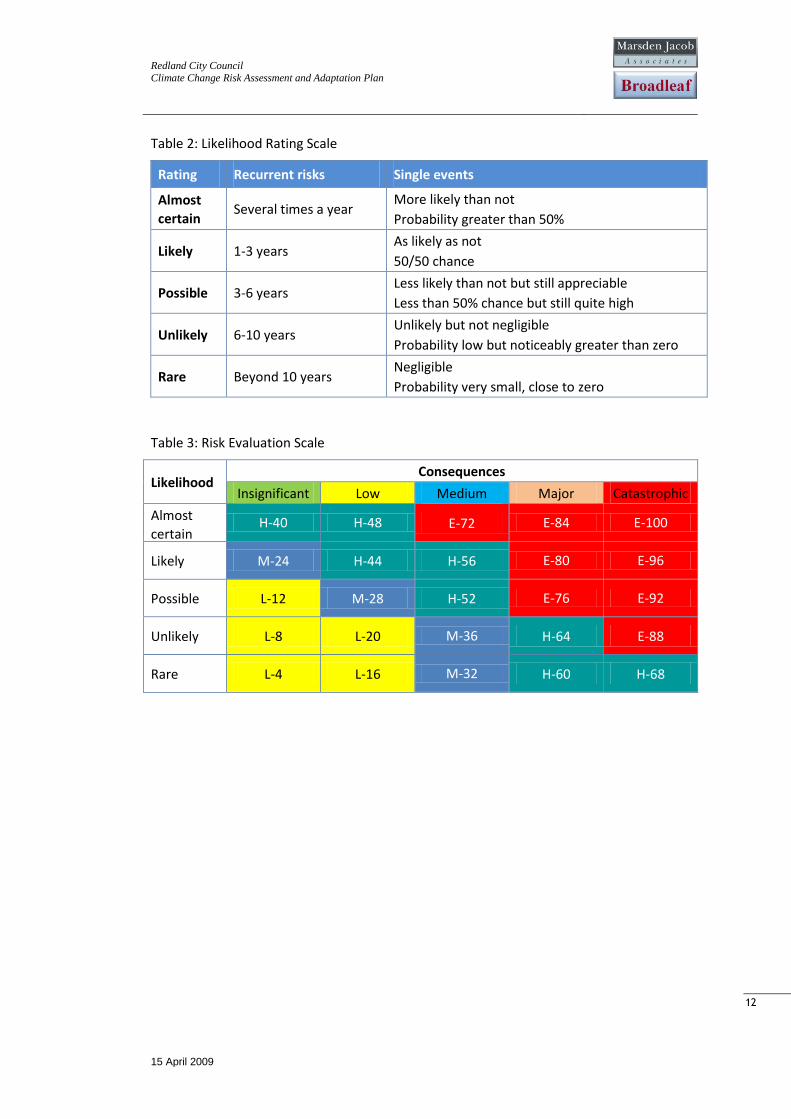
We adopted the evaluation framework as written, with a minor addition to the likelihood
scale so as to include risks that are not expected to recur. This is in keeping with the AGO
Guide. By adopting the RCC evaluation framework we ensure that the climate change risks
and priorities we obtain from the exercise can be maintained within Council’s existing risk
register and plans for monitoring and review.
The RCC likelihood scale is given in Table 2. The risk evaluation matrix is in Table 3. Table 4
overleaf shows the consequence scale.
These scales were applied under two key assumptions:
Redland City Council
Climate Change Risk Assessment and Adaptation Plan
15 April 2009
11
11
- We rated the consequences associate with each risk only once, and referred to this
single rating when estimating likelihoods for each of the three rating periods. If the
consequences associated with a particular risk had been thought to change markedly
over time, then a new risk for each subsequent rating period would have been
instantiated. That said, none of the identified risks fell into this category.
- We identified the controls associated with each risk, and considered the effect of such
controls when assigning a likelihood to each rating period.
Threats and Opportunities
We note that AS/NZS4360 defines risk in terms that allow for both desirable and
undesirable outcomes of uncertainty; sometimes termed ‘opportunities’ and ‘threats’. It is
clear that some of the effects of climate change may lead to some new opportunities, and
that RCC will wish to anticipate and exploit these as well as preparing to deal with the
threats.
For this reason, we sought to identify opportunities as we discussed each key element and
offered to record them in our spreadsheet. The consequences of opportunities were to be
assessed using the same consequences scale, but with the direction of effect reversed — on
the principle that a potential gain indentified but not taken is effectively the same as a loss.
This notwithstanding, no climate change opportunities were specifically identified, as
evidenced by the risk register in Appendix 1 (page 99).
Key Assumptions
The evaluation of consequences and likelihoods rested on the following key assumptions:
- That current controls for each risk have been taken into account and that therefore the
risk level describes additional risk resulting from climate change. i.e. Additional
management and works by Council required on top of that currently being conducted
in 2007.
- That consequence (cost) is assumed to remain constant over time. This assumption
states that potential variations in the severity of the cause of the risk, over time, (and
other potential influences on annual cost) have not been factored into the
consequence assessment process. For example, that Council will not need to spend
more money per annum for mosquito control in 2070 than in 2030.
- That the ‘Current day’, ‘2030’ and ‘2070’ likelihood assessments are based on Council
not implementing any additional controls over time. However, where possible, external
control factors have been factored in. For example, Council not providing additional
money but receiving expected State government assistance to respond to a climate
change risk.
- That where Council efforts or other events result in a permanent solution to
requirements for climate change controls by the given date 2030 or 2070, the
likelihood is ‘completed’, and the risk becomes zero.
Redland City Council
Climate Change Risk Assessment and Adaptation Plan
15 April 2009
12
12
Table 2: Likelihood Rating Scale
Rating Recurrent risks Single events
Almost
certain Several times a year
More likely than not
Probability greater than 50%
Likely 1-3 years As likely as not
50/50 chance
Possible 3-6 years Less likely than not but still appreciable
Less than 50% chance but still quite high
Unlikely 6-10 years Unlikely but not negligible
Probability low but noticeably greater than zero
Rare Beyond 10 years Negligible
Probability very small, close to zero
Table 3: Risk Evaluation Scale
Likelihood Consequences
Insignificant Low Medium Major Catastrophic
Almost
certain H-40 H-48 E-72 E-84 E-100
Likely M-24 H-44 H-56 E-80 E-96
Possible L-12 M-28 H-52 E-76 E-92
Unlikely L-8 L-20 M-36 H-64 E-88
Rare L-4 L-16 M-32 H-60 H-68
15 April 2009
13
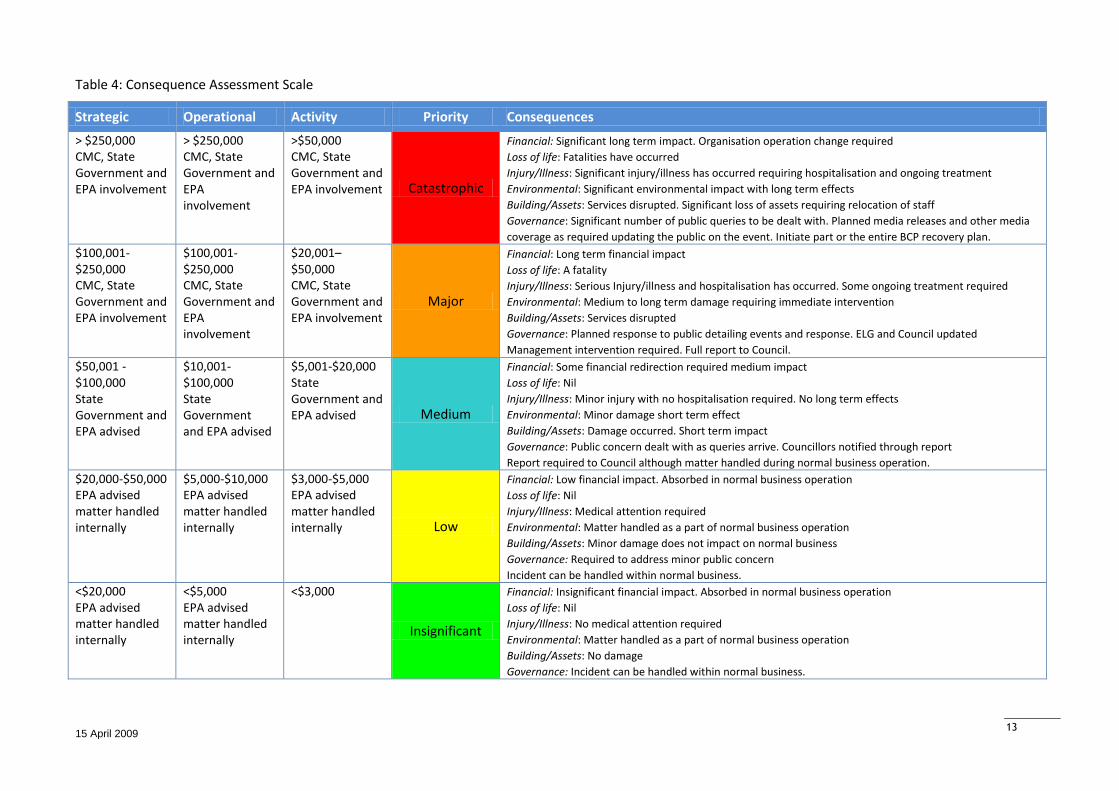
Table 4: Consequence Assessment Scale
Strategic Operational Activity Priority Consequences
> $250,000 CMC, State Government and EPA involvement
> $250,000 CMC, State Government and EPA involvement
>$50,000 CMC, State Government and EPA involvement Catastrophic
Financial: Significant long term impact. Organisation operation change required
Loss of life: Fatalities have occurred
Injury/Illness: Significant injury/illness has occurred requiring hospitalisation and ongoing treatment
Environmental: Significant environmental impact with long term effects
Building/Assets: Services disrupted. Significant loss of assets requiring relocation of staff
Governance: Significant number of public queries to be dealt with. Planned media releases and other media
coverage as required updating the public on the event. Initiate part or the entire BCP recovery plan.
$100,001-$250,000 CMC, State Government and EPA involvement
$100,001-$250,000 CMC, State Government and EPA involvement
$20,001–$50,000 CMC, State Government and EPA involvement
Major
Financial: Long term financial impact
Loss of life: A fatality
Injury/Illness: Serious Injury/illness and hospitalisation has occurred. Some ongoing treatment required
Environmental: Medium to long term damage requiring immediate intervention
Building/Assets: Services disrupted
Governance: Planned response to public detailing events and response. ELG and Council updated
Management intervention required. Full report to Council.
$50,001 - $100,000 State Government and EPA advised
$10,001-$100,000 State Government and EPA advised
$5,001-$20,000 State Government and EPA advised Medium
Financial: Some financial redirection required medium impact
Loss of life: Nil
Injury/Illness: Minor injury with no hospitalisation required. No long term effects
Environmental: Minor damage short term effect
Building/Assets: Damage occurred. Short term impact
Governance: Public concern dealt with as queries arrive. Councillors notified through report
Report required to Council although matter handled during normal business operation.
$20,000-$50,000 EPA advised matter handled internally
$5,000-$10,000 EPA advised matter handled internally
$3,000-$5,000 EPA advised matter handled internally Low
Financial: Low financial impact. Absorbed in normal business operation
Loss of life: Nil
Injury/Illness: Medical attention required
Environmental: Matter handled as a part of normal business operation
Building/Assets: Minor damage does not impact on normal business
Governance: Required to address minor public concern
Incident can be handled within normal business.
<$20,000 EPA advised matter handled internally
<$5,000 EPA advised matter handled internally
<$3,000
Insignificant
Financial: Insignificant financial impact. Absorbed in normal business operation
Loss of life: Nil
Injury/Illness: No medical attention required
Environmental: Matter handled as a part of normal business operation
Building/Assets: No damage
Governance: Incident can be handled within normal business.
Redland City Council
Climate Change Risk Assessment and Adaptation Plan
15 April 2009
14
14
3. Results
3.1. Results in Brief
3.1.1. Priorities
Forty-eight (48) risks were identified against the five Key Elements and 31 Risk Categories
shown in Table 1. A further risk — Significant escalation of the distribution of acid sulphate
soils — was raised and flagged as an important issue for RCC, but was not rated pending
further assessment (page 54).
A summary of risk ratings by Key Element is given in Figure 2.
Most striking is the fact that no climate change risks were rated Extreme over any of the
three time periods. As mentioned previously, the risks were assessed using the RCC scales
and matrix to ensure that this assessment sits comfortably within the RCC corporate
register.
Next to the absence of any Extreme risks, the most striking characteristic of the risks is that
the Medium and High risks are almost all associated with Infrastructure. This dominance is
clearest with short term risks but also seen in the medium and long term assessments.
One of the two liability risks to risks to Corporate Services — threat of flooding or sea level
rise described on page 66 — also warrants mention. This risk was not only ranked High for
all three time periods, but was also the second highest rated of all of the climate change
risks identified (Table 5).
A substantial number of risks to environmental management were identified, but tended to
be rated Low in the short-medium term. Two of these risks moved to a rating of High in the
long term, and three more were rated Medium, but the ratings were lower across the
board than might have been expected at the start of the assessment. Further detail about
the approach to rating risks to environmental management is given on page 42.
Redland City Council
Climate Change Risk Assessment and Adaptation Plan
15 April 2009
15
15
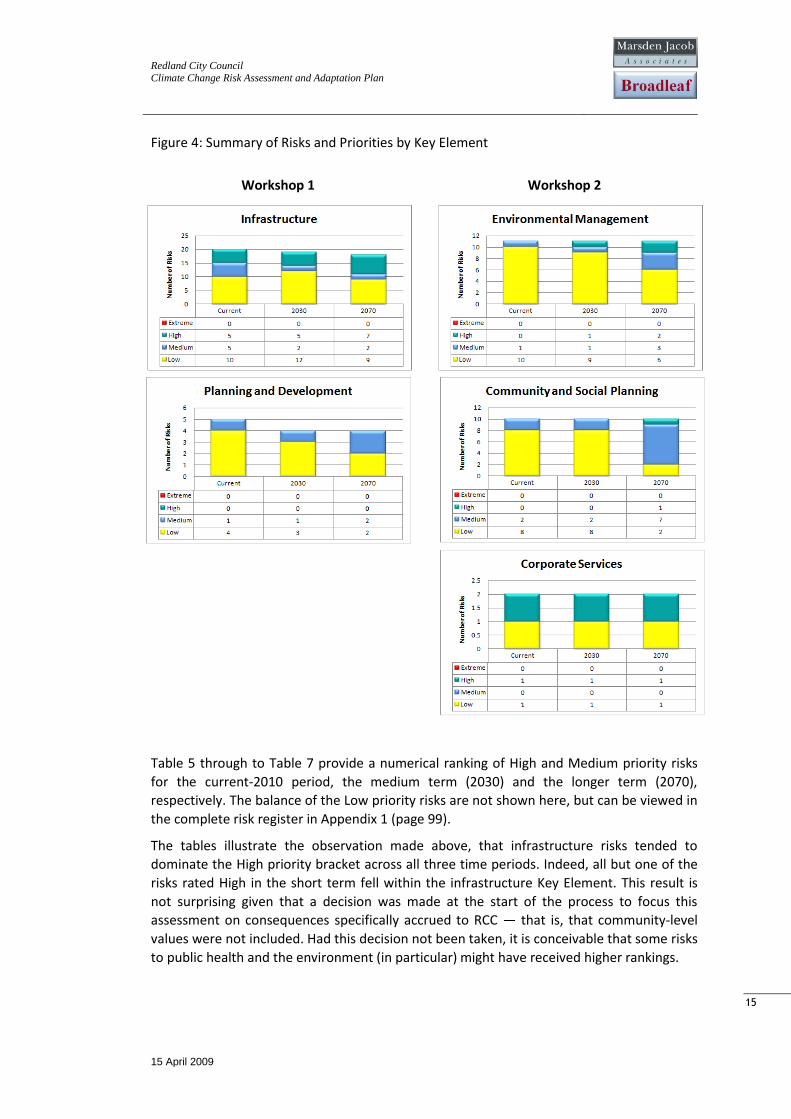
Figure 4: Summary of Risks and Priorities by Key Element
Workshop 1 Workshop 2
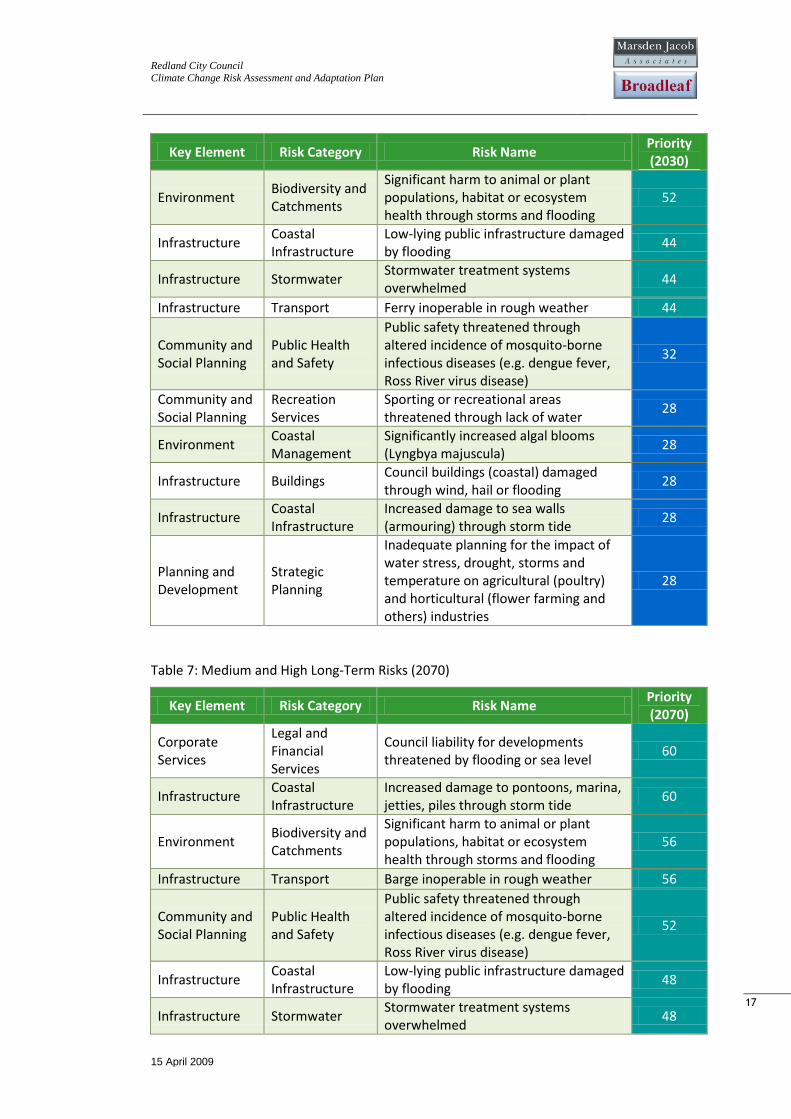
Table 5 through to Table 7 provide a numerical ranking of High and Medium priority risks
for the current-2010 period, the medium term (2030) and the longer term (2070),
respectively. The balance of the Low priority risks are not shown here, but can be viewed in
the complete risk register in Appendix 1 (page 99).
The tables illustrate the observation made above, that infrastructure risks tended to
dominate the High priority bracket across all three time periods. Indeed, all but one of the
risks rated High in the short term fell within the infrastructure Key Element. This result is
not surprising given that a decision was made at the start of the process to focus this
assessment on consequences specifically accrued to RCC — that is, that community-level
values were not included. Had this decision not been taken, it is conceivable that some risks
to public health and the environment (in particular) might have received higher rankings.
Redland City Council
Climate Change Risk Assessment and Adaptation Plan
15 April 2009
16
16
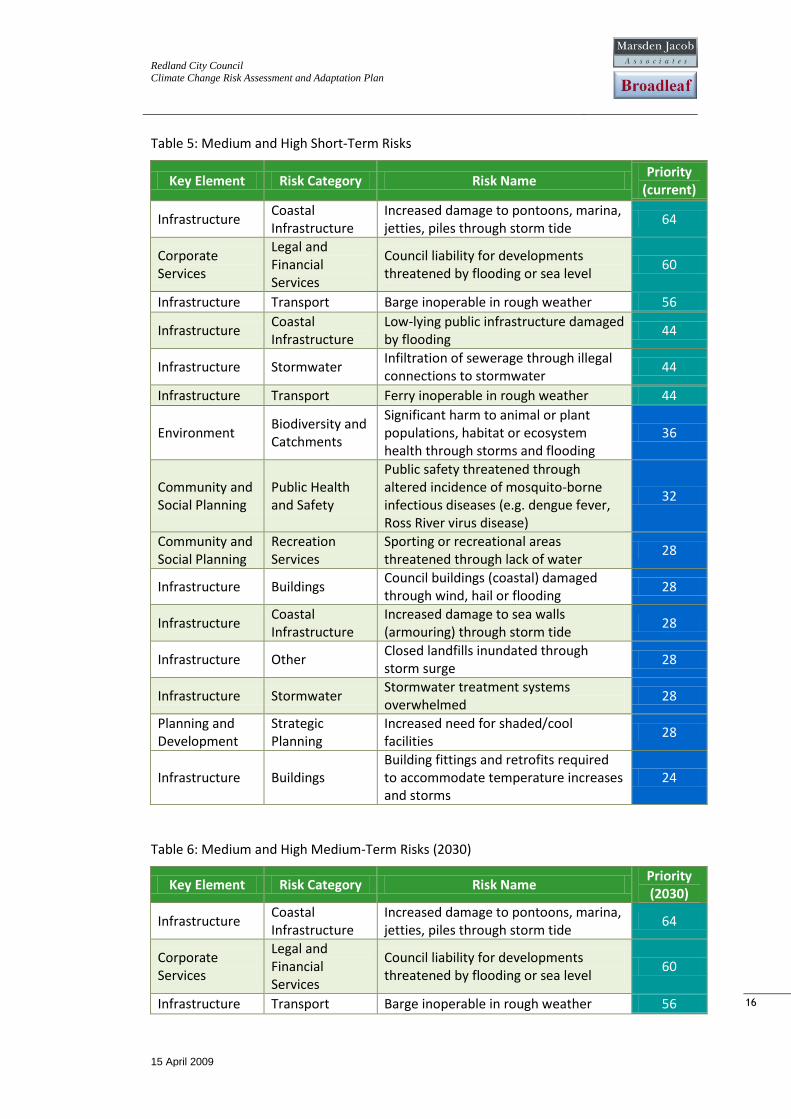
Table 5: Medium and High Short-Term Risks
Key Element Risk Category Risk Name Priority
(current)
Infrastructure Coastal Infrastructure
Increased damage to pontoons, marina, jetties, piles through storm tide
64
Corporate Services
Legal and Financial Services
Council liability for developments threatened by flooding or sea level
60
Infrastructure Transport Barge inoperable in rough weather 56
Infrastructure Coastal Infrastructure
Low-lying public infrastructure damaged by flooding
44
Infrastructure Stormwater Infiltration of sewerage through illegal connections to stormwater
44
Infrastructure Transport Ferry inoperable in rough weather 44
Environment Biodiversity and Catchments
Significant harm to animal or plant populations, habitat or ecosystem health through storms and flooding
36
Community and Social Planning
Public Health and Safety
Public safety threatened through altered incidence of mosquito-borne infectious diseases (e.g. dengue fever, Ross River virus disease)
32
Community and Social Planning
Recreation Services
Sporting or recreational areas threatened through lack of water
28
Infrastructure Buildings Council buildings (coastal) damaged through wind, hail or flooding
28
Infrastructure Coastal Infrastructure
Increased damage to sea walls (armouring) through storm tide
28
Infrastructure Other Closed landfills inundated through storm surge
28
Infrastructure Stormwater Stormwater treatment systems overwhelmed
28
Planning and Development
Strategic Planning
Increased need for shaded/cool facilities
28
Infrastructure Buildings Building fittings and retrofits required to accommodate temperature increases and storms
24
Table 6: Medium and High Medium-Term Risks (2030)
Key Element Risk Category Risk Name Priority (2030)
Infrastructure Coastal Infrastructure
Increased damage to pontoons, marina, jetties, piles through storm tide
64
Corporate Services
Legal and Financial Services
Council liability for developments threatened by flooding or sea level
60
Infrastructure Transport Barge inoperable in rough weather 56
Redland City Council
Climate Change Risk Assessment and Adaptation Plan
15 April 2009
17
17
Key Element Risk Category Risk Name Priority (2030)
Environment Biodiversity and Catchments
Significant harm to animal or plant populations, habitat or ecosystem health through storms and flooding
52
Infrastructure Coastal Infrastructure
Low-lying public infrastructure damaged by flooding
44
Infrastructure Stormwater Stormwater treatment systems overwhelmed
44
Infrastructure Transport Ferry inoperable in rough weather 44
Community and Social Planning
Public Health and Safety
Public safety threatened through altered incidence of mosquito-borne infectious diseases (e.g. dengue fever, Ross River virus disease)
32
Community and Social Planning
Recreation Services
Sporting or recreational areas threatened through lack of water
28
Environment Coastal Management
Significantly increased algal blooms (Lyngbya majuscula)
28
Infrastructure Buildings Council buildings (coastal) damaged through wind, hail or flooding
28
Infrastructure Coastal Infrastructure
Increased damage to sea walls (armouring) through storm tide
28
Planning and Development
Strategic Planning
Inadequate planning for the impact of water stress, drought, storms and temperature on agricultural (poultry) and horticultural (flower farming and others) industries
28
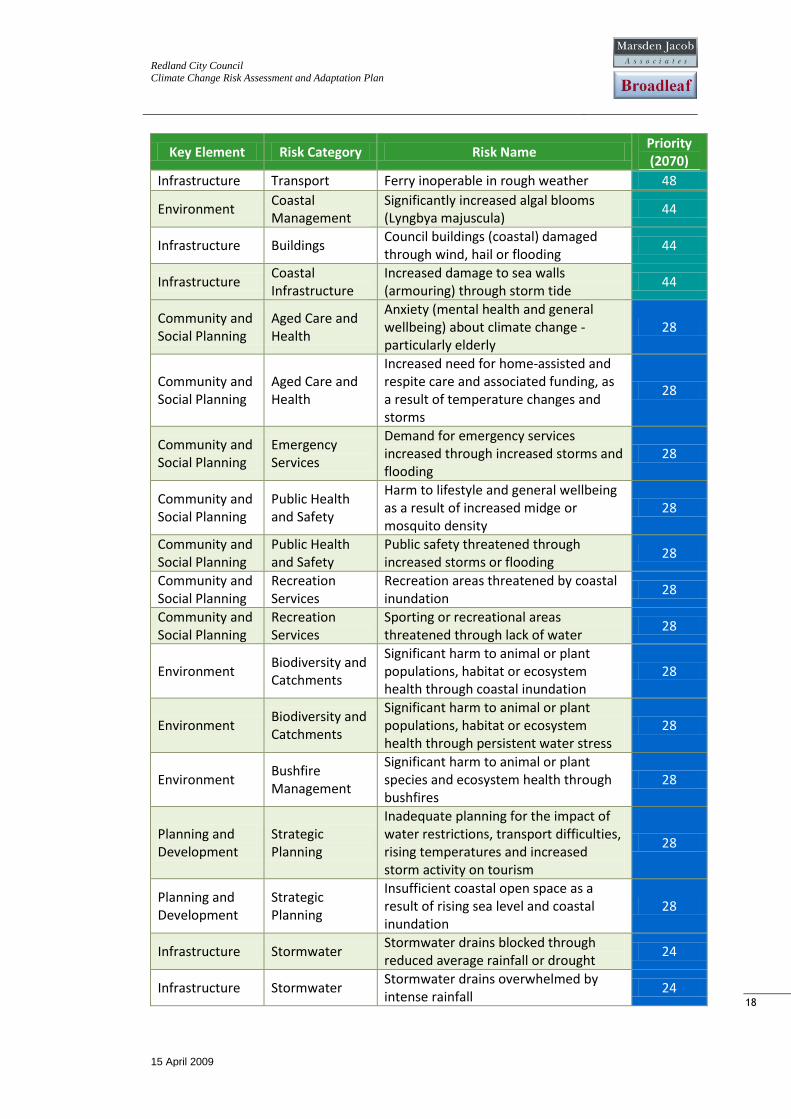
Table 7: Medium and High Long-Term Risks (2070)
Key Element Risk Category Risk Name Priority (2070)
Corporate Services
Legal and Financial Services
Council liability for developments threatened by flooding or sea level
60
Infrastructure Coastal Infrastructure
Increased damage to pontoons, marina, jetties, piles through storm tide
60
Environment Biodiversity and Catchments
Significant harm to animal or plant populations, habitat or ecosystem health through storms and flooding
56
Infrastructure Transport Barge inoperable in rough weather 56
Community and Social Planning
Public Health and Safety
Public safety threatened through altered incidence of mosquito-borne infectious diseases (e.g. dengue fever, Ross River virus disease)
52
Infrastructure Coastal Infrastructure
Low-lying public infrastructure damaged by flooding
48
Infrastructure Stormwater Stormwater treatment systems overwhelmed
48
Redland City Council
Climate Change Risk Assessment and Adaptation Plan
15 April 2009
18
18
Key Element Risk Category Risk Name Priority (2070)
Infrastructure Transport Ferry inoperable in rough weather 48
Environment Coastal Management
Significantly increased algal blooms (Lyngbya majuscula)
44
Infrastructure Buildings Council buildings (coastal) damaged through wind, hail or flooding
44
Infrastructure Coastal Infrastructure
Increased damage to sea walls (armouring) through storm tide
44
Community and Social Planning
Aged Care and Health
Anxiety (mental health and general wellbeing) about climate change - particularly elderly
28
Community and Social Planning
Aged Care and Health
Increased need for home-assisted and respite care and associated funding, as a result of temperature changes and storms
28
Community and Social Planning
Emergency Services
Demand for emergency services increased through increased storms and flooding
28
Community and Social Planning
Public Health and Safety
Harm to lifestyle and general wellbeing as a result of increased midge or mosquito density
28
Community and Social Planning
Public Health and Safety
Public safety threatened through increased storms or flooding
28
Community and Social Planning
Recreation Services
Recreation areas threatened by coastal inundation
28
Community and Social Planning
Recreation Services
Sporting or recreational areas threatened through lack of water
28
Environment Biodiversity and Catchments
Significant harm to animal or plant populations, habitat or ecosystem health through coastal inundation
28
Environment Biodiversity and Catchments
Significant harm to animal or plant populations, habitat or ecosystem health through persistent water stress
28
Environment Bushfire Management
Significant harm to animal or plant species and ecosystem health through bushfires
28
Planning and Development
Strategic Planning
Inadequate planning for the impact of water restrictions, transport difficulties, rising temperatures and increased storm activity on tourism
28
Planning and Development
Strategic Planning
Insufficient coastal open space as a result of rising sea level and coastal inundation
28
Infrastructure Stormwater Stormwater drains blocked through reduced average rainfall or drought
24
Infrastructure Stormwater Stormwater drains overwhelmed by intense rainfall
24
Redland City Council
Climate Change Risk Assessment and Adaptation Plan
15 April 2009
19
19
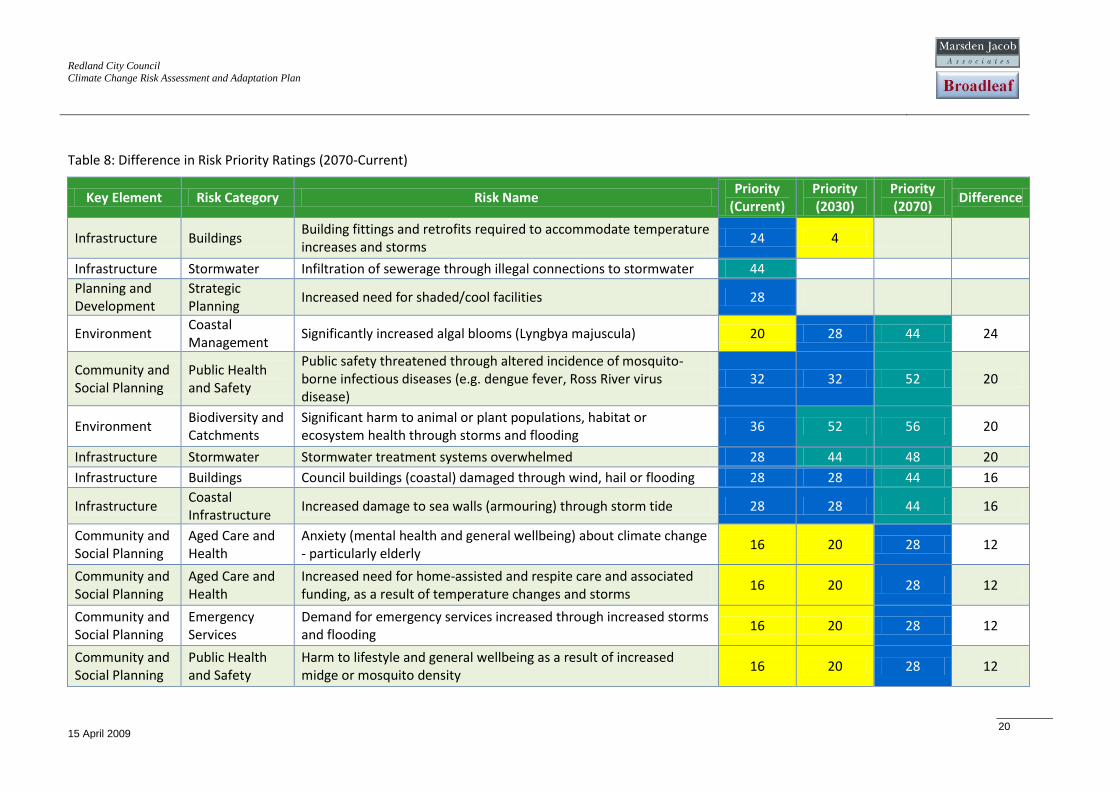
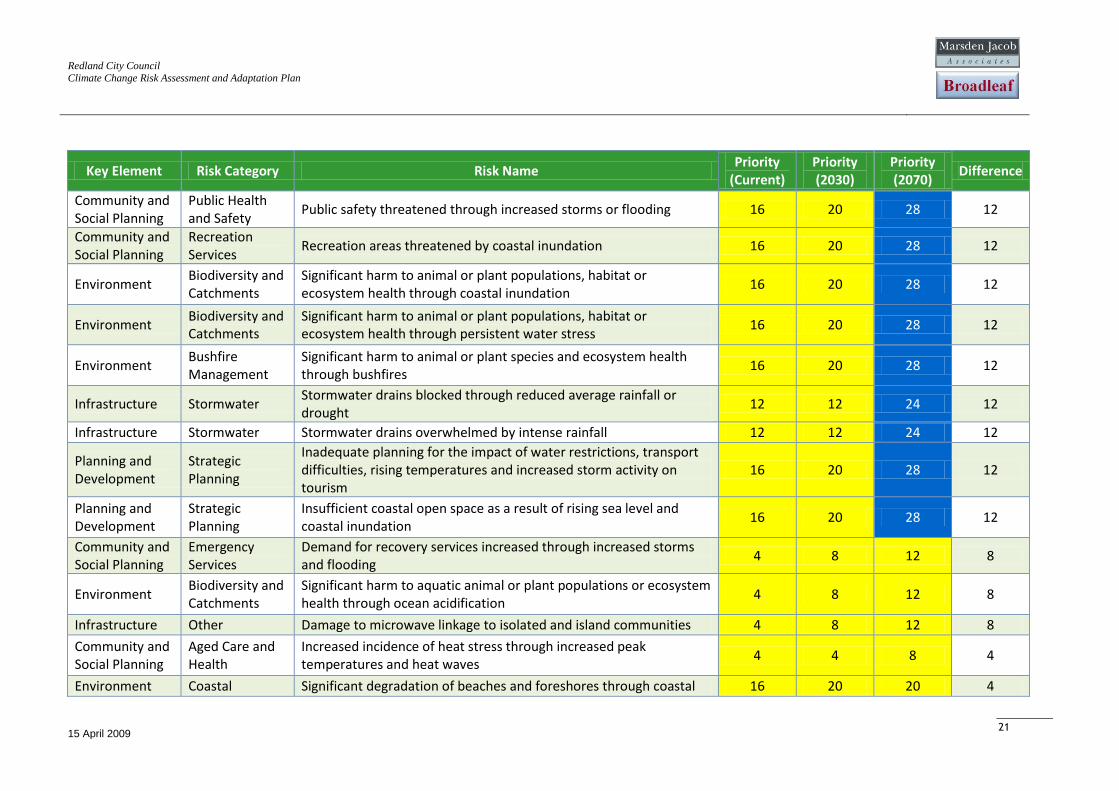
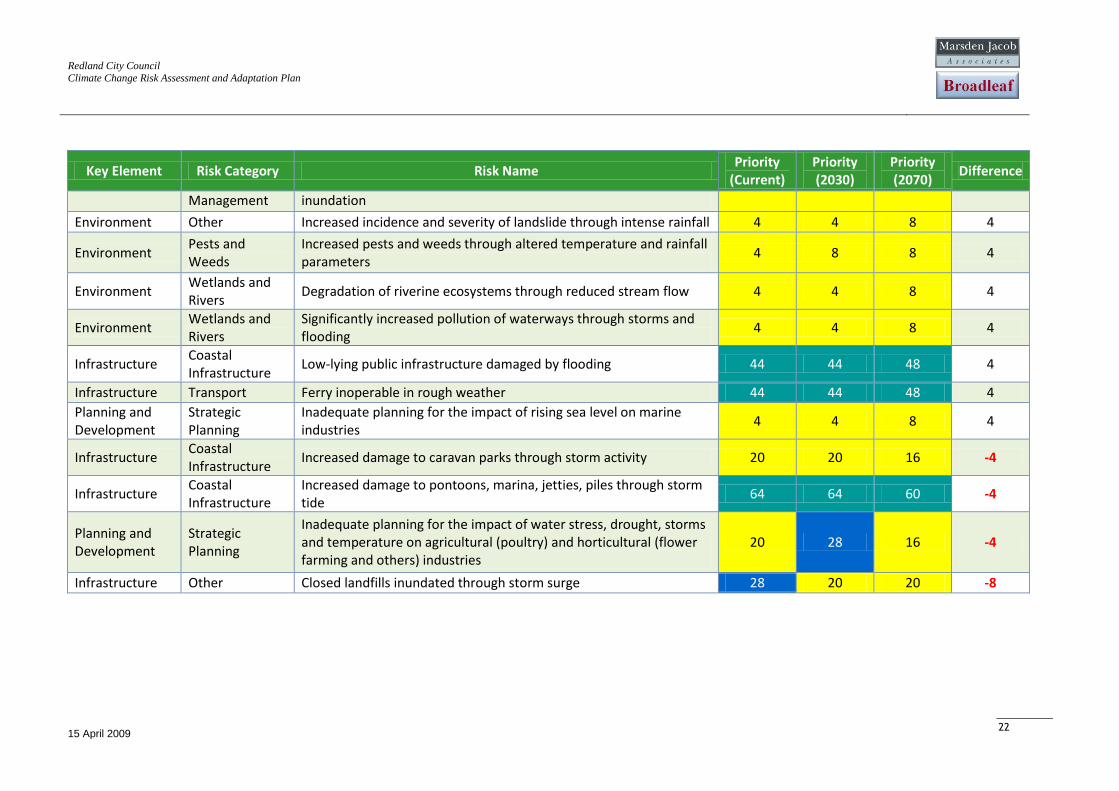
3.1.2. Trends
Table 8 (overleaf) ranks risks according to the magnitude of change in their numerical
ratings across the three time periods. The final three risks in the table decreased over time,
and have a negative difference rating. Risks that did not change are not shown in this table.
Interpretation of risk difference is complex, but in most cases reflects: (a) the relative
sensitivity of RCC to climate variables in the areas concerned combined with the relative
increase of consequences or likelihood as climate change becomes more marked; and (b)
the relative extent to which existing controls would mitigate these changes.
Many of the risks that change most over time relate to issues over which RCC has little or
no scope for adaptive control over-and-above that already at work. The risks associated
with algal blooms or burgeoning mosquito populations provide good examples of this.
While existing controls are generally sufficient, both issues are likely to be sensitive to
climate change and both are likely to become substantially more difficult for RCC to
manage without a specific adaptation plan (risk treatment).
Although zero-change risks were left out of the table (for brevity), they are also instructive
in the sense that they represent situations where adaptive controls are likely to able to
keep pace with changes in climate stressors. A typical example of this is damage to RCC
buildings, where the combination of adaptive insurance and an evolving building code
mean that the consequences and likelihood of building damage will remain relatively
constant over time.
Some risks are similar or the same in the short and medium term but rise dramatically in
the longer term. These may be particularly important to include in the adaptation
component of the project. They tend to represent situations where controls cease to
compensate for climate change or where a threshold in background tolerance is likely to be
breached.
Redland City Council
Climate Change Risk Assessment and Adaptation Plan
15 April 2009
20
Table 8: Difference in Risk Priority Ratings (2070-Current)
Key Element Risk Category Risk Name Priority
(Current) Priority (2030)
Priority (2070)
Difference
Infrastructure Buildings Building fittings and retrofits required to accommodate temperature increases and storms
24 4
Infrastructure Stormwater Infiltration of sewerage through illegal connections to stormwater 44
Planning and Development
Strategic Planning
Increased need for shaded/cool facilities 28
Environment Coastal Management
Significantly increased algal blooms (Lyngbya majuscula) 20 28 44 24
Community and Social Planning
Public Health and Safety
Public safety threatened through altered incidence of mosquito-borne infectious diseases (e.g. dengue fever, Ross River virus disease)
32 32 52 20
Environment Biodiversity and Catchments
Significant harm to animal or plant populations, habitat or ecosystem health through storms and flooding
36 52 56 20
Infrastructure Stormwater Stormwater treatment systems overwhelmed 28 44 48 20
Infrastructure Buildings Council buildings (coastal) damaged through wind, hail or flooding 28 28 44 16
Infrastructure Coastal Infrastructure
Increased damage to sea walls (armouring) through storm tide 28 28 44 16
Community and Social Planning
Aged Care and Health
Anxiety (mental health and general wellbeing) about climate change - particularly elderly
16 20 28 12
Community and Social Planning
Aged Care and Health
Increased need for home-assisted and respite care and associated funding, as a result of temperature changes and storms
16 20 28 12
Community and Social Planning
Emergency Services
Demand for emergency services increased through increased storms and flooding
16 20 28 12
Community and Social Planning
Public Health and Safety
Harm to lifestyle and general wellbeing as a result of increased midge or mosquito density
16 20 28 12
Redland City Council
Climate Change Risk Assessment and Adaptation Plan
15 April 2009
21
Key Element Risk Category Risk Name Priority
(Current) Priority (2030)
Priority (2070)
Difference
Community and Social Planning
Public Health and Safety
Public safety threatened through increased storms or flooding 16 20 28 12
Community and Social Planning
Recreation Services
Recreation areas threatened by coastal inundation 16 20 28 12
Environment Biodiversity and Catchments
Significant harm to animal or plant populations, habitat or ecosystem health through coastal inundation
16 20 28 12
Environment Biodiversity and Catchments
Significant harm to animal or plant populations, habitat or ecosystem health through persistent water stress
16 20 28 12
Environment Bushfire Management
Significant harm to animal or plant species and ecosystem health through bushfires
16 20 28 12
Infrastructure Stormwater Stormwater drains blocked through reduced average rainfall or drought
12 12 24 12
Infrastructure Stormwater Stormwater drains overwhelmed by intense rainfall 12 12 24 12
Planning and Development
Strategic Planning
Inadequate planning for the impact of water restrictions, transport difficulties, rising temperatures and increased storm activity on tourism
16 20 28 12
Planning and Development
Strategic Planning
Insufficient coastal open space as a result of rising sea level and coastal inundation
16 20 28 12
Community and Social Planning
Emergency Services
Demand for recovery services increased through increased storms and flooding
4 8 12 8
Environment Biodiversity and Catchments
Significant harm to aquatic animal or plant populations or ecosystem health through ocean acidification
4 8 12 8
Infrastructure Other Damage to microwave linkage to isolated and island communities 4 8 12 8
Community and Social Planning
Aged Care and Health
Increased incidence of heat stress through increased peak temperatures and heat waves
4 4 8 4
Environment Coastal Significant degradation of beaches and foreshores through coastal 16 20 20 4
Redland City Council
Climate Change Risk Assessment and Adaptation Plan
15 April 2009
22
Key Element Risk Category Risk Name Priority
(Current) Priority (2030)
Priority (2070)
Difference
Management inundation
Environment Other Increased incidence and severity of landslide through intense rainfall 4 4 8 4
Environment Pests and Weeds
Increased pests and weeds through altered temperature and rainfall parameters
4 8 8 4
Environment Wetlands and Rivers
Degradation of riverine ecosystems through reduced stream flow 4 4 8 4
Environment Wetlands and Rivers
Significantly increased pollution of waterways through storms and flooding
4 4 8 4
Infrastructure Coastal Infrastructure
Low-lying public infrastructure damaged by flooding 44 44 48 4
Infrastructure Transport Ferry inoperable in rough weather 44 44 48 4
Planning and Development
Strategic Planning
Inadequate planning for the impact of rising sea level on marine industries
4 4 8 4
Infrastructure Coastal Infrastructure
Increased damage to caravan parks through storm activity 20 20 16 -4
Infrastructure Coastal Infrastructure
Increased damage to pontoons, marina, jetties, piles through storm tide
64 64 60 -4
Planning and Development
Strategic Planning
Inadequate planning for the impact of water stress, drought, storms and temperature on agricultural (poultry) and horticultural (flower farming and others) industries
20 28 16 -4
Infrastructure Other Closed landfills inundated through storm surge 28 20 20 -8
Redland City Council
Climate Change Risk Assessment and Adaptation Plan
15 April 2009
23
23
3.2. Risks for Infrastructure
3.2.1. Asset Management
No risks specifically addressing asset management were identified.
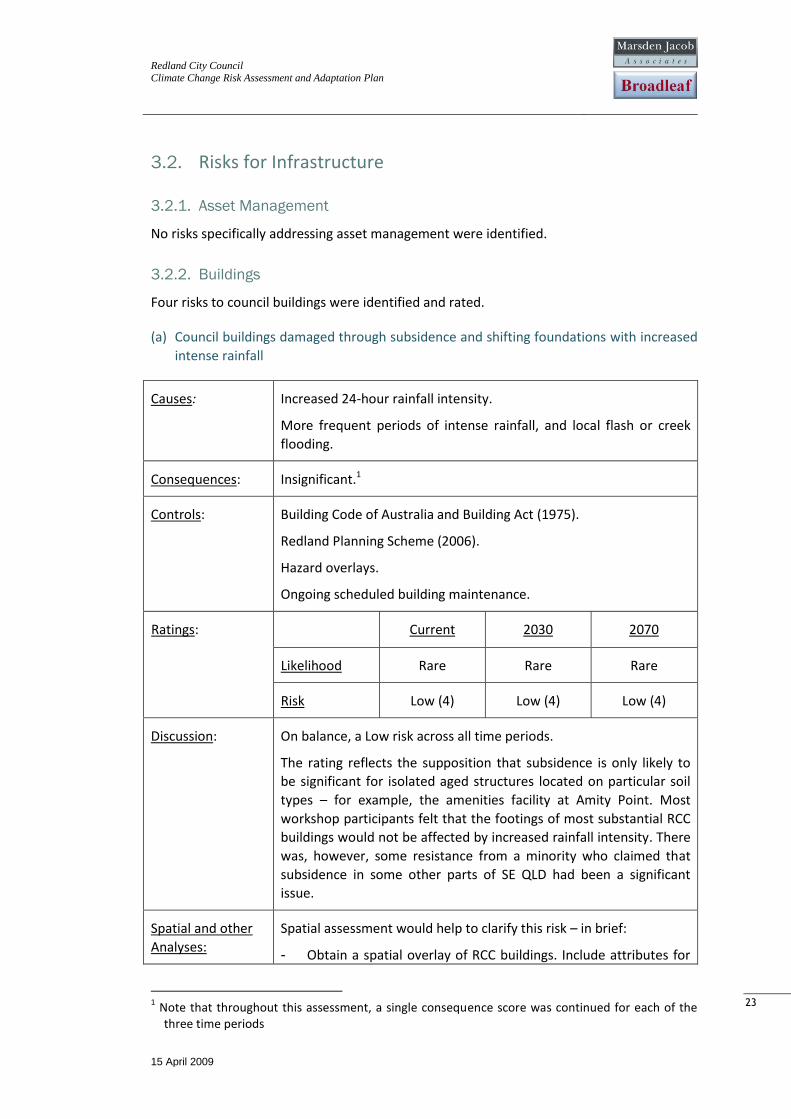
3.2.2. Buildings
Four risks to council buildings were identified and rated.
(a) Council buildings damaged through subsidence and shifting foundations with increased
intense rainfall
Causes: Increased 24-hour rainfall intensity.
More frequent periods of intense rainfall, and local flash or creek
flooding.
Consequences: Insignificant.1
Controls: Building Code of Australia and Building Act (1975).
Redland Planning Scheme (2006).
Hazard overlays.
Ongoing scheduled building maintenance.
Ratings: Current 2030 2070
Likelihood Rare Rare Rare
Risk Low (4) Low (4) Low (4)
Discussion: On balance, a Low risk across all time periods.
The rating reflects the supposition that subsidence is only likely to
be significant for isolated aged structures located on particular soil
types – for example, the amenities facility at Amity Point. Most
workshop participants felt that the footings of most substantial RCC
buildings would not be affected by increased rainfall intensity. There
was, however, some resistance from a minority who claimed that
subsidence in some other parts of SE QLD had been a significant
issue.
Spatial and other
Analyses: Spatial assessment would help to clarify this risk – in brief:
- Obtain a spatial overlay of RCC buildings. Include attributes for
1 Note that throughout this assessment, a single consequence score was continued for each of the
three time periods
Redland City Council
Climate Change Risk Assessment and Adaptation Plan
15 April 2009
24
24
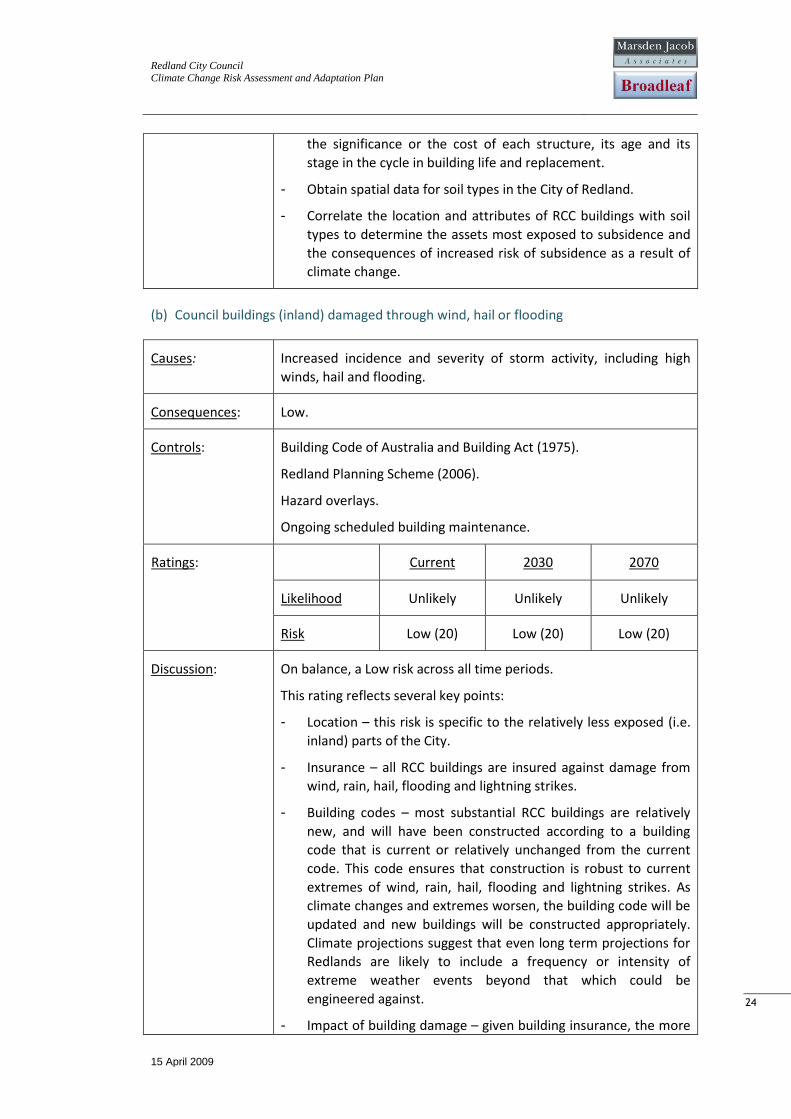
the significance or the cost of each structure, its age and its
stage in the cycle in building life and replacement.
- Obtain spatial data for soil types in the City of Redland.
- Correlate the location and attributes of RCC buildings with soil
types to determine the assets most exposed to subsidence and
the consequences of increased risk of subsidence as a result of
climate change.
(b) Council buildings (inland) damaged through wind, hail or flooding
Causes: Increased incidence and severity of storm activity, including high
winds, hail and flooding.
Consequences: Low.
Controls: Building Code of Australia and Building Act (1975).
Redland Planning Scheme (2006).
Hazard overlays.
Ongoing scheduled building maintenance.
Ratings: Current 2030 2070
Likelihood Unlikely Unlikely Unlikely
Risk Low (20) Low (20) Low (20)
Discussion: On balance, a Low risk across all time periods.
This rating reflects several key points:
- Location – this risk is specific to the relatively less exposed (i.e.
inland) parts of the City.
- Insurance – all RCC buildings are insured against damage from
wind, rain, hail, flooding and lightning strikes.
- Building codes – most substantial RCC buildings are relatively
new, and will have been constructed according to a building
code that is current or relatively unchanged from the current
code. This code ensures that construction is robust to current
extremes of wind, rain, hail, flooding and lightning strikes. As
climate changes and extremes worsen, the building code will be
updated and new buildings will be constructed appropriately.
Climate projections suggest that even long term projections for
Redlands are likely to include a frequency or intensity of
extreme weather events beyond that which could be
engineered against.
- Impact of building damage – given building insurance, the more
Redland City Council
Climate Change Risk Assessment and Adaptation Plan
15 April 2009
25
25
significant impact of building damage concerns disruption of the
delivery of normal RCC services. This could be substantial if
substantial damage was sustained to a key building, such as the
council chambers.
Spatial and other
Analyses: The fact that building insurance negates much of the cost to RCC
associated with building damage through extreme weather events
may mean that further assessment of this risk is not required.
This notwithstanding, the following spatial assessment could be
undertaken:
- Obtain a spatial overlay of RCC buildings. Include attributes for
the significance or the cost of each structure, its age and its
stage in the cycle in building life and replacement. Select from
this the RCC buildings that are not coastal.
- Obtain spatial data (hazard overlay) for storm tides and
flooding. This will be embellished through GEMS modelling.
- Correlate the location and attributes of inland RCC buildings
with storm tides and flooding to determine the assets most
exposed and the consequences of increased risk of damage as a
result of climate change.
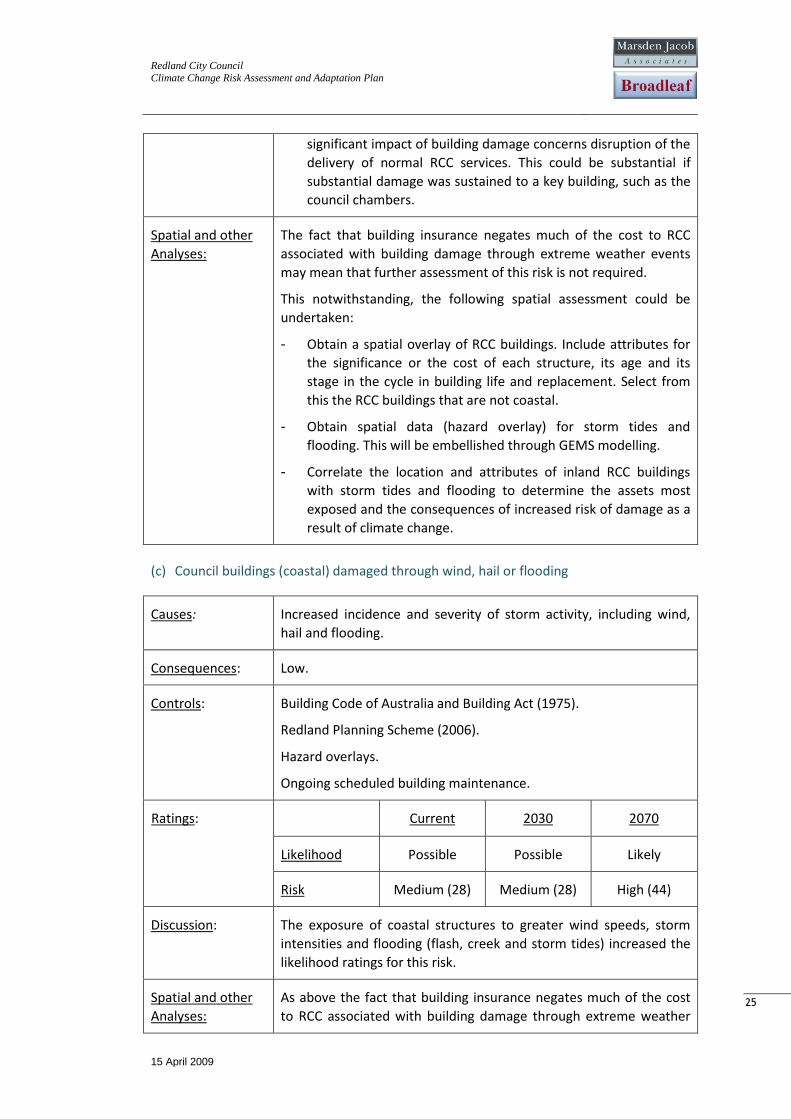
(c) Council buildings (coastal) damaged through wind, hail or flooding
Causes: Increased incidence and severity of storm activity, including wind,
hail and flooding.
Consequences: Low.
Controls: Building Code of Australia and Building Act (1975).
Redland Planning Scheme (2006).
Hazard overlays.
Ongoing scheduled building maintenance.
Ratings: Current 2030 2070
Likelihood Possible Possible Likely
Risk Medium (28) Medium (28) High (44)
Discussion: The exposure of coastal structures to greater wind speeds, storm
intensities and flooding (flash, creek and storm tides) increased the
likelihood ratings for this risk.
Spatial and other
Analyses: As above the fact that building insurance negates much of the cost
to RCC associated with building damage through extreme weather
Redland City Council
Climate Change Risk Assessment and Adaptation Plan
15 April 2009
26
26
events may mean that further assessment of this risk is not required.
This notwithstanding, the following spatial assessment could be
undertaken:
- Obtain a spatial overlay of RCC buildings. Include attributes for
the significance or the cost of each structure, its age and its
stage in the cycle in building life and replacement. Select from
this the RCC buildings that are coastal.
- Obtain spatial data (hazard overlay) for storm tides and
flooding. This will be embellished through GEMS modelling.
- Correlate the location and attributes of coastal RCC buildings
with storm tides and flooding to determine the assets most
exposed and the consequences of increased risk of damage as a
result of climate change.
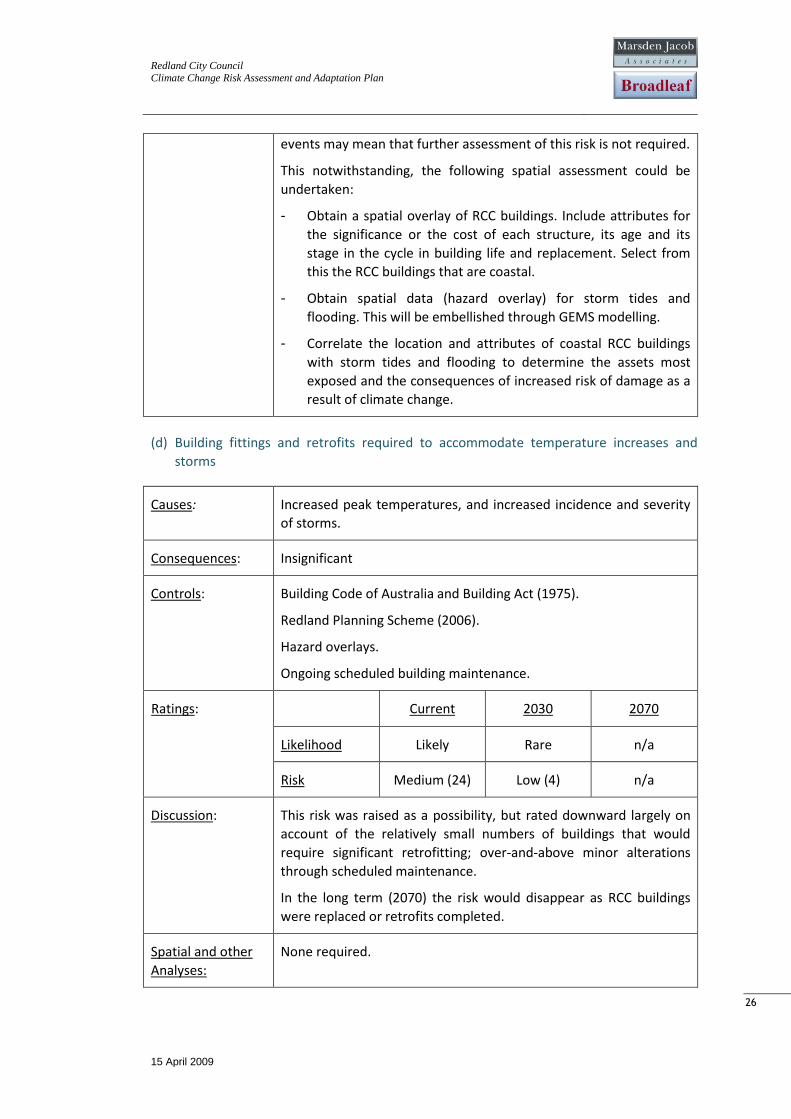
(d) Building fittings and retrofits required to accommodate temperature increases and
storms
Causes: Increased peak temperatures, and increased incidence and severity
of storms.
Consequences: Insignificant
Controls: Building Code of Australia and Building Act (1975).
Redland Planning Scheme (2006).
Hazard overlays.
Ongoing scheduled building maintenance.
Ratings: Current 2030 2070
Likelihood Likely Rare n/a
Risk Medium (24) Low (4) n/a
Discussion: This risk was raised as a possibility, but rated downward largely on
account of the relatively small numbers of buildings that would
require significant retrofitting; over-and-above minor alterations
through scheduled maintenance.
In the long term (2070) the risk would disappear as RCC buildings
were replaced or retrofits completed.
Spatial and other
Analyses: None required.
Redland City Council
Climate Change Risk Assessment and Adaptation Plan
15 April 2009
27
27
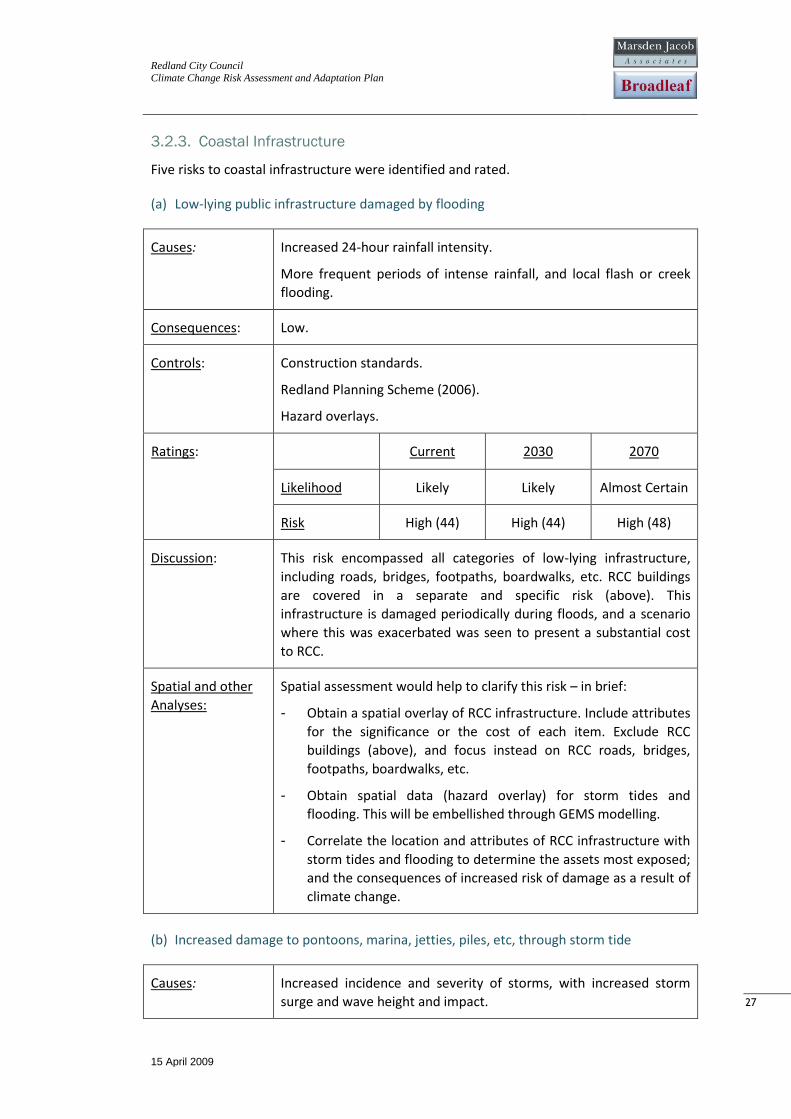
3.2.3. Coastal Infrastructure
Five risks to coastal infrastructure were identified and rated.
(a) Low-lying public infrastructure damaged by flooding
Causes: Increased 24-hour rainfall intensity.
More frequent periods of intense rainfall, and local flash or creek
flooding.
Consequences: Low.
Controls: Construction standards.
Redland Planning Scheme (2006).
Hazard overlays.
Ratings: Current 2030 2070
Likelihood Likely Likely Almost Certain
Risk High (44) High (44) High (48)
Discussion: This risk encompassed all categories of low-lying infrastructure,
including roads, bridges, footpaths, boardwalks, etc. RCC buildings
are covered in a separate and specific risk (above). This
infrastructure is damaged periodically during floods, and a scenario
where this was exacerbated was seen to present a substantial cost
to RCC.
Spatial and other
Analyses: Spatial assessment would help to clarify this risk – in brief:
- Obtain a spatial overlay of RCC infrastructure. Include attributes
for the significance or the cost of each item. Exclude RCC
buildings (above), and focus instead on RCC roads, bridges,
footpaths, boardwalks, etc.
- Obtain spatial data (hazard overlay) for storm tides and
flooding. This will be embellished through GEMS modelling.
- Correlate the location and attributes of RCC infrastructure with
storm tides and flooding to determine the assets most exposed;
and the consequences of increased risk of damage as a result of
climate change.
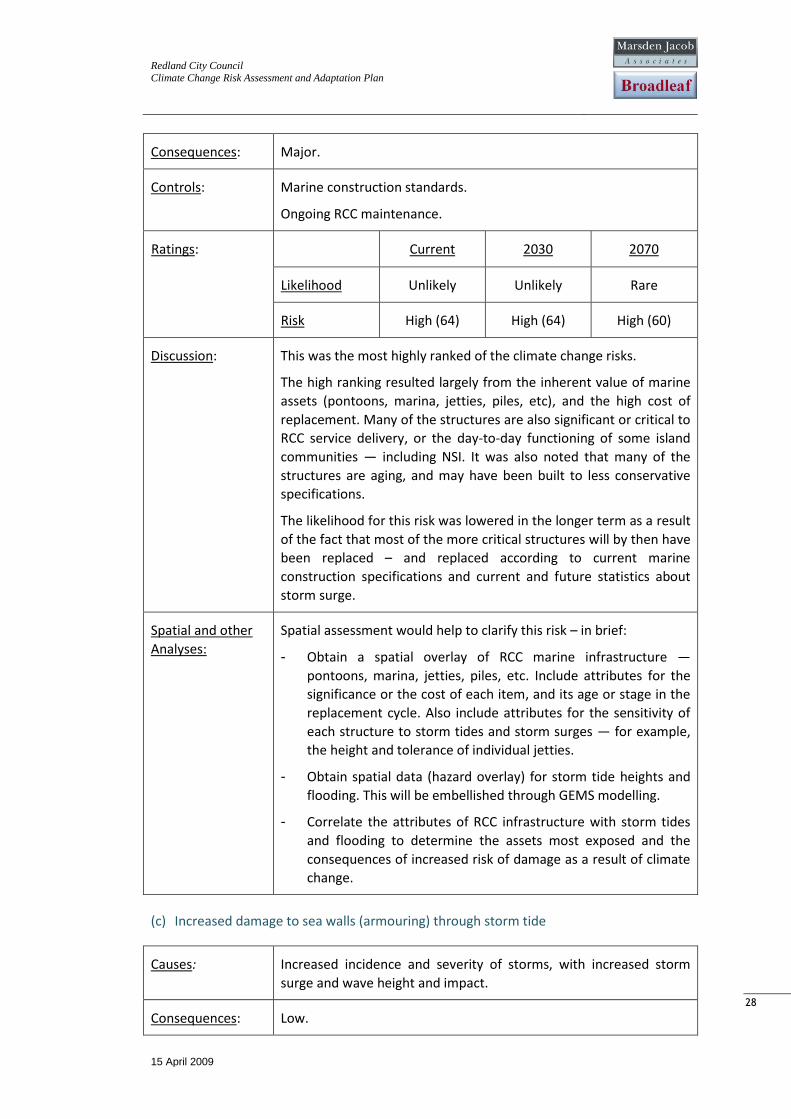
(b) Increased damage to pontoons, marina, jetties, piles, etc, through storm tide
Causes: Increased incidence and severity of storms, with increased storm
surge and wave height and impact.
Redland City Council
Climate Change Risk Assessment and Adaptation Plan
15 April 2009
28
28
Consequences: Major.
Controls: Marine construction standards.
Ongoing RCC maintenance.
Ratings: Current 2030 2070
Likelihood Unlikely Unlikely Rare
Risk High (64) High (64) High (60)
Discussion: This was the most highly ranked of the climate change risks.
The high ranking resulted largely from the inherent value of marine
assets (pontoons, marina, jetties, piles, etc), and the high cost of
replacement. Many of the structures are also significant or critical to
RCC service delivery, or the day-to-day functioning of some island
communities — including NSI. It was also noted that many of the
structures are aging, and may have been built to less conservative
specifications.
The likelihood for this risk was lowered in the longer term as a result
of the fact that most of the more critical structures will by then have
been replaced – and replaced according to current marine
construction specifications and current and future statistics about
storm surge.
Spatial and other
Analyses: Spatial assessment would help to clarify this risk – in brief:
- Obtain a spatial overlay of RCC marine infrastructure —
pontoons, marina, jetties, piles, etc. Include attributes for the
significance or the cost of each item, and its age or stage in the
replacement cycle. Also include attributes for the sensitivity of
each structure to storm tides and storm surges — for example,
the height and tolerance of individual jetties.
- Obtain spatial data (hazard overlay) for storm tide heights and
flooding. This will be embellished through GEMS modelling.
- Correlate the attributes of RCC infrastructure with storm tides
and flooding to determine the assets most exposed and the
consequences of increased risk of damage as a result of climate
change.
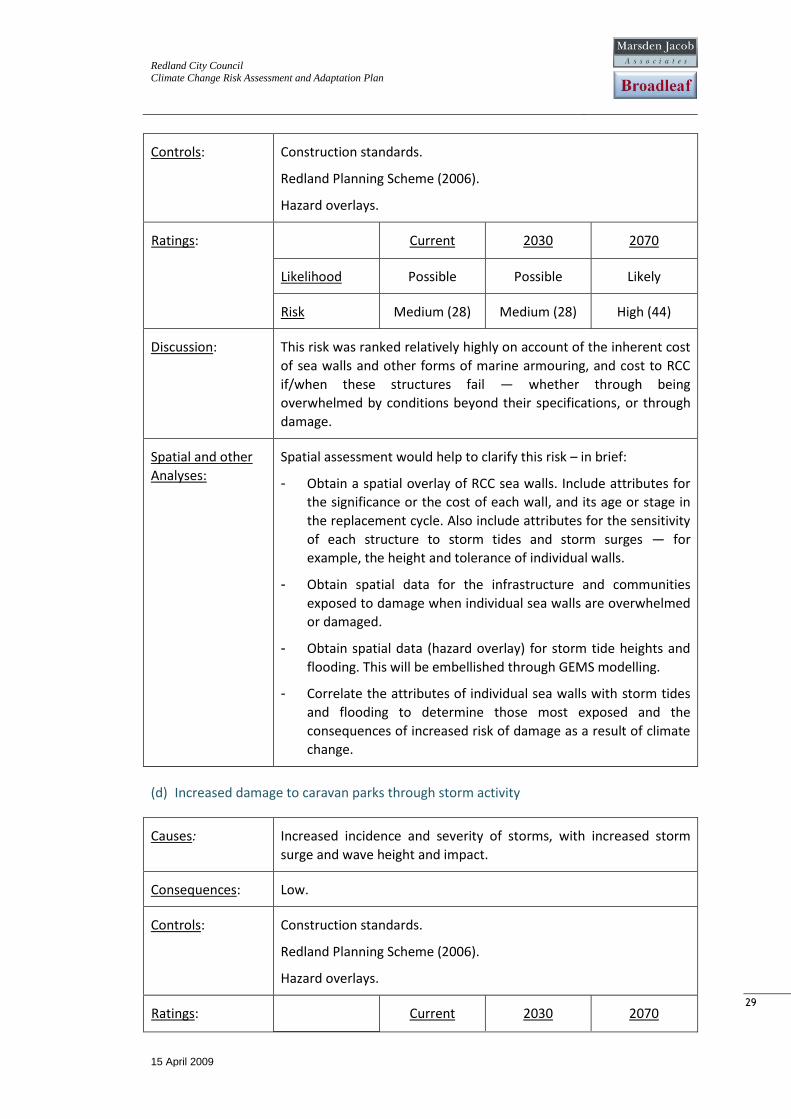
(c) Increased damage to sea walls (armouring) through storm tide
Causes: Increased incidence and severity of storms, with increased storm
surge and wave height and impact.
Consequences: Low.
Redland City Council
Climate Change Risk Assessment and Adaptation Plan
15 April 2009
29
29
Controls: Construction standards.
Redland Planning Scheme (2006).
Hazard overlays.
Ratings: Current 2030 2070
Likelihood Possible Possible Likely
Risk Medium (28) Medium (28) High (44)
Discussion: This risk was ranked relatively highly on account of the inherent cost
of sea walls and other forms of marine armouring, and cost to RCC
if/when these structures fail — whether through being
overwhelmed by conditions beyond their specifications, or through
damage.
Spatial and other
Analyses: Spatial assessment would help to clarify this risk – in brief:
- Obtain a spatial overlay of RCC sea walls. Include attributes for
the significance or the cost of each wall, and its age or stage in
the replacement cycle. Also include attributes for the sensitivity
of each structure to storm tides and storm surges — for
example, the height and tolerance of individual walls.
- Obtain spatial data for the infrastructure and communities
exposed to damage when individual sea walls are overwhelmed
or damaged.
- Obtain spatial data (hazard overlay) for storm tide heights and
flooding. This will be embellished through GEMS modelling.
- Correlate the attributes of individual sea walls with storm tides
and flooding to determine those most exposed and the
consequences of increased risk of damage as a result of climate
change.
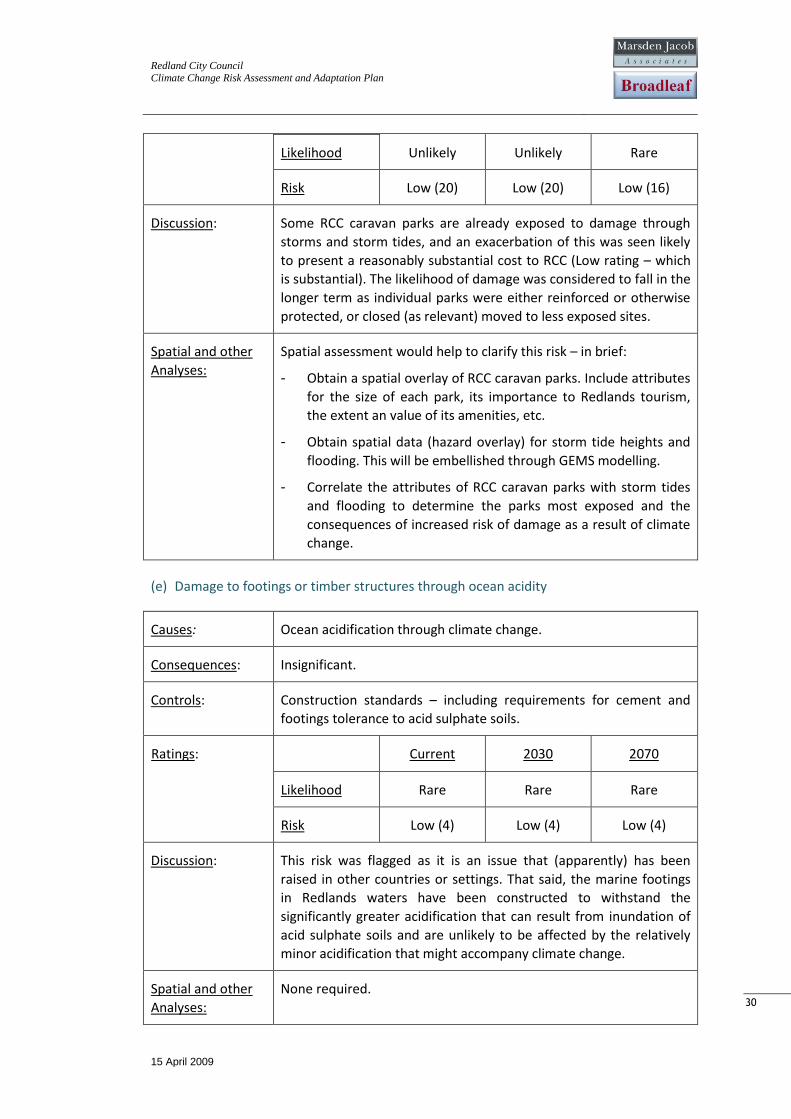
(d) Increased damage to caravan parks through storm activity
Causes: Increased incidence and severity of storms, with increased storm
surge and wave height and impact.
Consequences: Low.
Controls: Construction standards.
Redland Planning Scheme (2006).
Hazard overlays.
Ratings: Current 2030 2070
Redland City Council
Climate Change Risk Assessment and Adaptation Plan
15 April 2009
30
30
Likelihood Unlikely Unlikely Rare
Risk Low (20) Low (20) Low (16)
Discussion: Some RCC caravan parks are already exposed to damage through
storms and storm tides, and an exacerbation of this was seen likely
to present a reasonably substantial cost to RCC (Low rating – which
is substantial). The likelihood of damage was considered to fall in the
longer term as individual parks were either reinforced or otherwise
protected, or closed (as relevant) moved to less exposed sites.
Spatial and other
Analyses: Spatial assessment would help to clarify this risk – in brief:
- Obtain a spatial overlay of RCC caravan parks. Include attributes
for the size of each park, its importance to Redlands tourism,
the extent an value of its amenities, etc.
- Obtain spatial data (hazard overlay) for storm tide heights and
flooding. This will be embellished through GEMS modelling.
- Correlate the attributes of RCC caravan parks with storm tides
and flooding to determine the parks most exposed and the
consequences of increased risk of damage as a result of climate
change.
(e) Damage to footings or timber structures through ocean acidity
Causes: Ocean acidification through climate change.
Consequences: Insignificant.
Controls: Construction standards – including requirements for cement and
footings tolerance to acid sulphate soils.
Ratings: Current 2030 2070
Likelihood Rare Rare Rare
Risk Low (4) Low (4) Low (4)
Discussion: This risk was flagged as it is an issue that (apparently) has been
raised in other countries or settings. That said, the marine footings
in Redlands waters have been constructed to withstand the
significantly greater acidification that can result from inundation of
acid sulphate soils and are unlikely to be affected by the relatively
minor acidification that might accompany climate change.
Spatial and other
Analyses: None required.
Redland City Council
Climate Change Risk Assessment and Adaptation Plan
15 April 2009
31
31
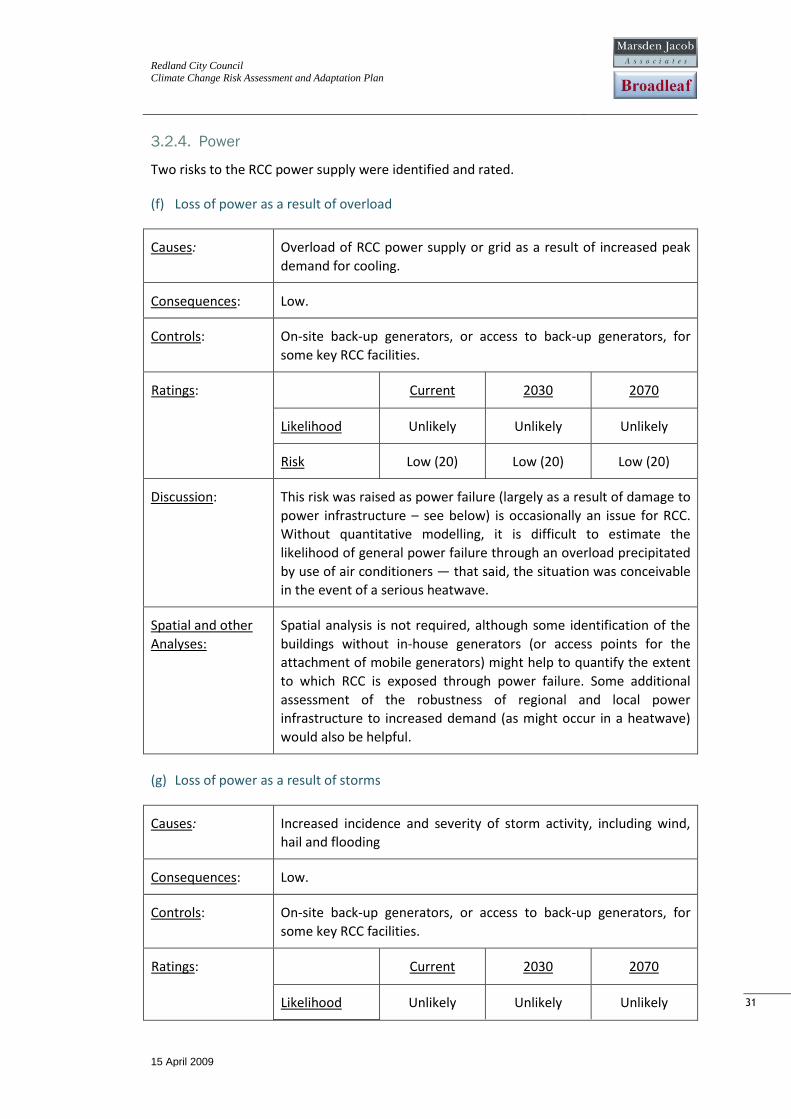
3.2.4. Power
Two risks to the RCC power supply were identified and rated.
(f) Loss of power as a result of overload
Causes: Overload of RCC power supply or grid as a result of increased peak
demand for cooling.
Consequences: Low.
Controls: On-site back-up generators, or access to back-up generators, for
some key RCC facilities.
Ratings: Current 2030 2070
Likelihood Unlikely Unlikely Unlikely
Risk Low (20) Low (20) Low (20)
Discussion: This risk was raised as power failure (largely as a result of damage to
power infrastructure – see below) is occasionally an issue for RCC.
Without quantitative modelling, it is difficult to estimate the
likelihood of general power failure through an overload precipitated
by use of air conditioners — that said, the situation was conceivable
in the event of a serious heatwave.
Spatial and other
Analyses: Spatial analysis is not required, although some identification of the
buildings without in-house generators (or access points for the
attachment of mobile generators) might help to quantify the extent
to which RCC is exposed through power failure. Some additional
assessment of the robustness of regional and local power
infrastructure to increased demand (as might occur in a heatwave)
would also be helpful.
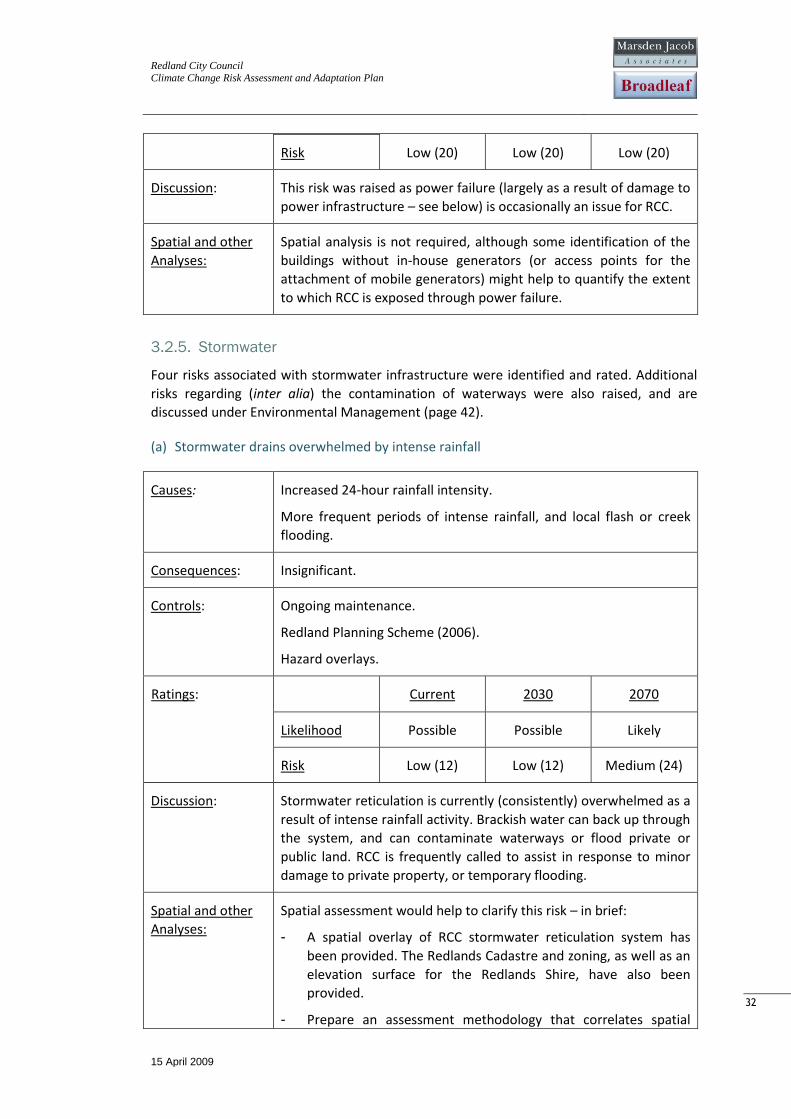
(g) Loss of power as a result of storms
Causes: Increased incidence and severity of storm activity, including wind,
hail and flooding
Consequences: Low.
Controls: On-site back-up generators, or access to back-up generators, for
some key RCC facilities.
Ratings: Current 2030 2070
Likelihood Unlikely Unlikely Unlikely
Redland City Council
Climate Change Risk Assessment and Adaptation Plan
15 April 2009
32
32
Risk Low (20) Low (20) Low (20)
Discussion: This risk was raised as power failure (largely as a result of damage to
power infrastructure – see below) is occasionally an issue for RCC.
Spatial and other
Analyses: Spatial analysis is not required, although some identification of the
buildings without in-house generators (or access points for the
attachment of mobile generators) might help to quantify the extent
to which RCC is exposed through power failure.
3.2.5. Stormwater
Four risks associated with stormwater infrastructure were identified and rated. Additional
risks regarding (inter alia) the contamination of waterways were also raised, and are
discussed under Environmental Management (page 42).
(a) Stormwater drains overwhelmed by intense rainfall
Causes: Increased 24-hour rainfall intensity.
More frequent periods of intense rainfall, and local flash or creek
flooding.
Consequences: Insignificant.
Controls: Ongoing maintenance.
Redland Planning Scheme (2006).
Hazard overlays.
Ratings: Current 2030 2070
Likelihood Possible Possible Likely
Risk Low (12) Low (12) Medium (24)
Discussion: Stormwater reticulation is currently (consistently) overwhelmed as a
result of intense rainfall activity. Brackish water can back up through
the system, and can contaminate waterways or flood private or
public land. RCC is frequently called to assist in response to minor
damage to private property, or temporary flooding.
Spatial and other
Analyses: Spatial assessment would help to clarify this risk – in brief:
- A spatial overlay of RCC stormwater reticulation system has
been provided. The Redlands Cadastre and zoning, as well as an
elevation surface for the Redlands Shire, have also been
provided.
- Prepare an assessment methodology that correlates spatial
Redland City Council
Climate Change Risk Assessment and Adaptation Plan
15 April 2009
33
33
predictors for exposure to flooding as a result of stormwater
with assets at risk – RCC assets, as well as community and
commercial assets. Ground truth the assessment methodology
with observed impacts of stormwater backwash.
- Use the assessment methodology to better estimate the extent
of likely harm to RCC as a result of stormwater backwash and
flooding.
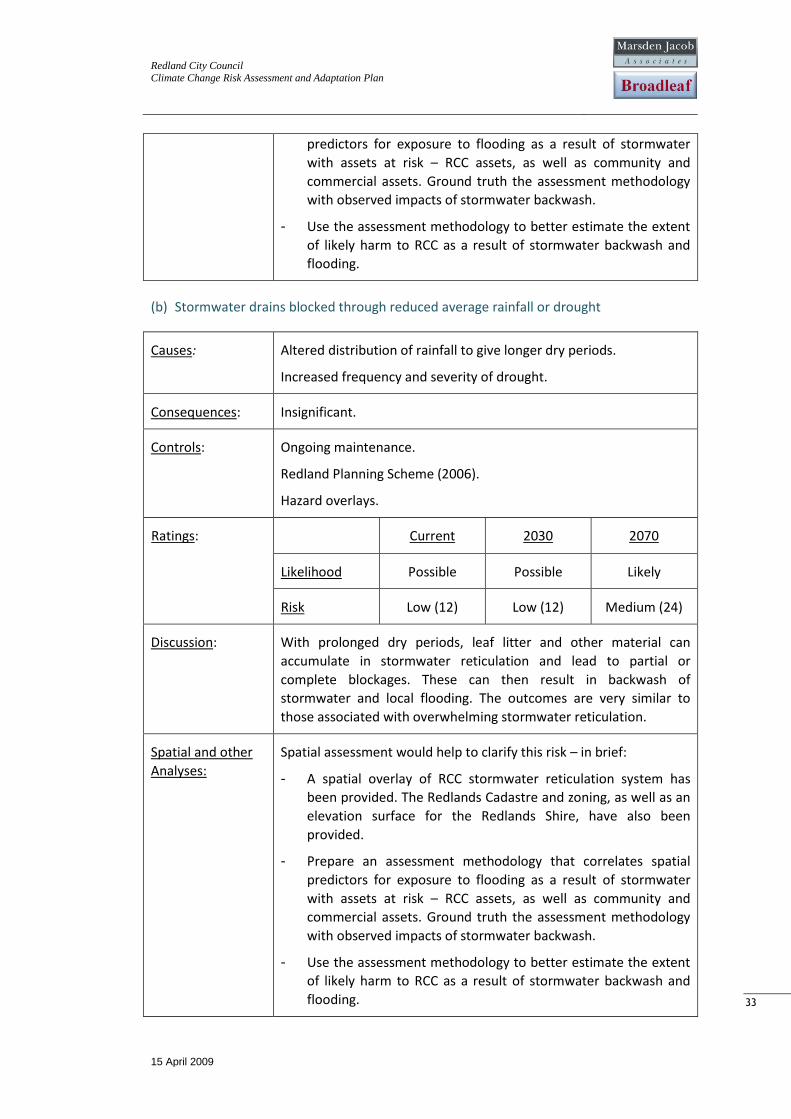
(b) Stormwater drains blocked through reduced average rainfall or drought
Causes: Altered distribution of rainfall to give longer dry periods.
Increased frequency and severity of drought.
Consequences: Insignificant.
Controls: Ongoing maintenance.
Redland Planning Scheme (2006).
Hazard overlays.
Ratings: Current 2030 2070
Likelihood Possible Possible Likely
Risk Low (12) Low (12) Medium (24)
Discussion: With prolonged dry periods, leaf litter and other material can
accumulate in stormwater reticulation and lead to partial or
complete blockages. These can then result in backwash of
stormwater and local flooding. The outcomes are very similar to
those associated with overwhelming stormwater reticulation.
Spatial and other
Analyses: Spatial assessment would help to clarify this risk – in brief:
- A spatial overlay of RCC stormwater reticulation system has
been provided. The Redlands Cadastre and zoning, as well as an
elevation surface for the Redlands Shire, have also been
provided.
- Prepare an assessment methodology that correlates spatial
predictors for exposure to flooding as a result of stormwater
with assets at risk – RCC assets, as well as community and
commercial assets. Ground truth the assessment methodology
with observed impacts of stormwater backwash.
- Use the assessment methodology to better estimate the extent
of likely harm to RCC as a result of stormwater backwash and
flooding.
Redland City Council
Climate Change Risk Assessment and Adaptation Plan
15 April 2009
34
34
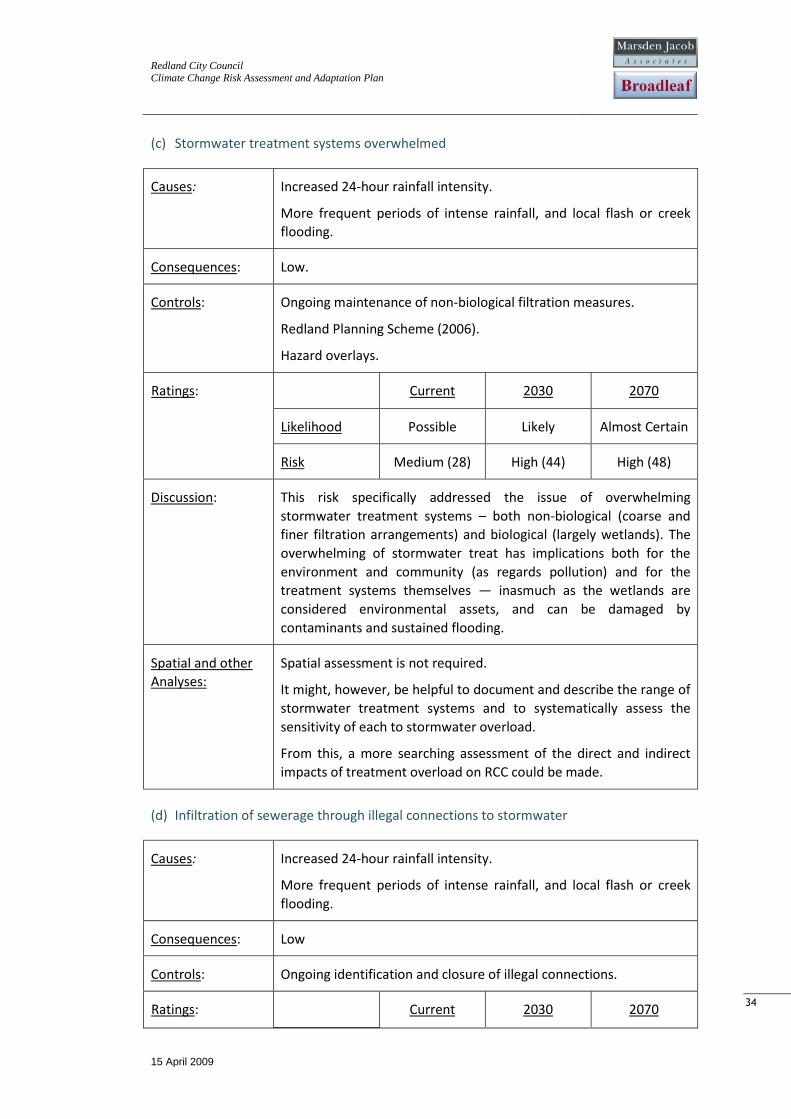
(c) Stormwater treatment systems overwhelmed
Causes: Increased 24-hour rainfall intensity.
More frequent periods of intense rainfall, and local flash or creek
flooding.
Consequences: Low.
Controls: Ongoing maintenance of non-biological filtration measures.
Redland Planning Scheme (2006).
Hazard overlays.
Ratings: Current 2030 2070
Likelihood Possible Likely Almost Certain
Risk Medium (28) High (44) High (48)
Discussion: This risk specifically addressed the issue of overwhelming
stormwater treatment systems – both non-biological (coarse and
finer filtration arrangements) and biological (largely wetlands). The
overwhelming of stormwater treat has implications both for the
environment and community (as regards pollution) and for the
treatment systems themselves — inasmuch as the wetlands are
considered environmental assets, and can be damaged by
contaminants and sustained flooding.
Spatial and other
Analyses: Spatial assessment is not required.
It might, however, be helpful to document and describe the range of
stormwater treatment systems and to systematically assess the
sensitivity of each to stormwater overload.
From this, a more searching assessment of the direct and indirect
impacts of treatment overload on RCC could be made.
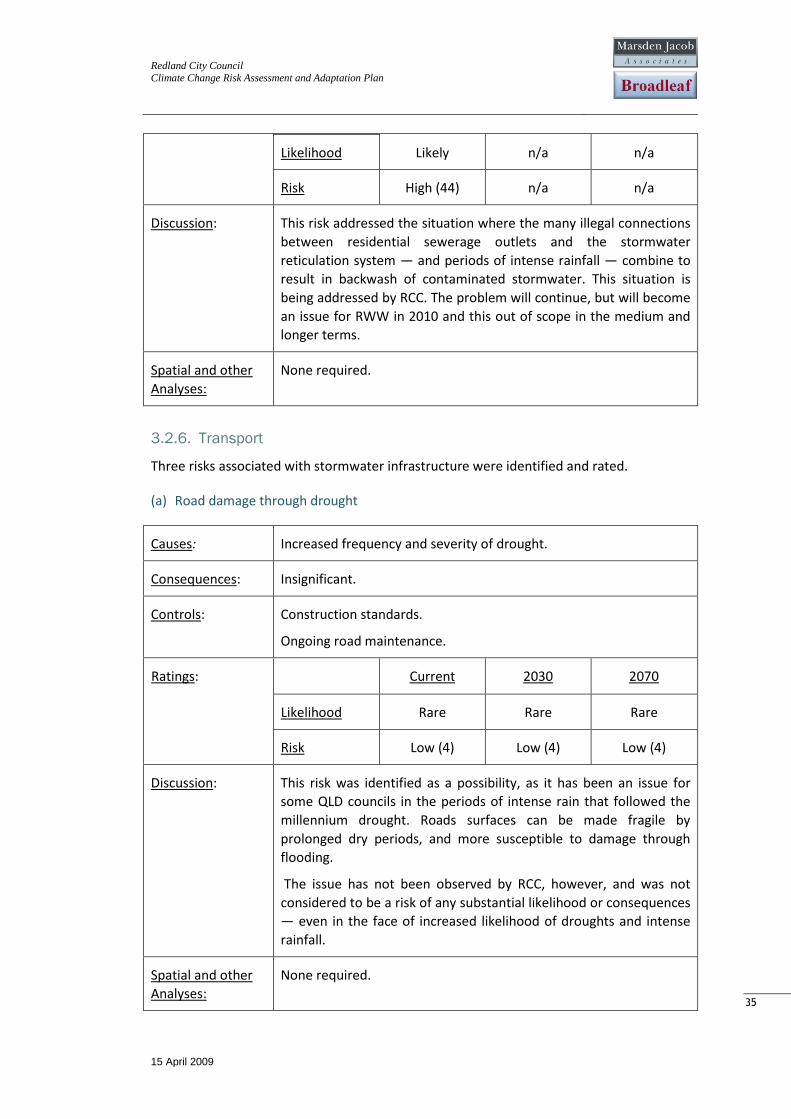
(d) Infiltration of sewerage through illegal connections to stormwater
Causes: Increased 24-hour rainfall intensity.
More frequent periods of intense rainfall, and local flash or creek
flooding.
Consequences: Low
Controls: Ongoing identification and closure of illegal connections.
Ratings: Current 2030 2070
Redland City Council
Climate Change Risk Assessment and Adaptation Plan
15 April 2009
35
35
Likelihood Likely n/a n/a
Risk High (44) n/a n/a
Discussion: This risk addressed the situation where the many illegal connections
between residential sewerage outlets and the stormwater
reticulation system — and periods of intense rainfall — combine to
result in backwash of contaminated stormwater. This situation is
being addressed by RCC. The problem will continue, but will become
an issue for RWW in 2010 and this out of scope in the medium and
longer terms.
Spatial and other
Analyses: None required.
3.2.6. Transport
Three risks associated with stormwater infrastructure were identified and rated.
(a) Road damage through drought
Causes: Increased frequency and severity of drought.
Consequences: Insignificant.
Controls: Construction standards.
Ongoing road maintenance.
Ratings: Current 2030 2070
Likelihood Rare Rare Rare
Risk Low (4) Low (4) Low (4)
Discussion: This risk was identified as a possibility, as it has been an issue for
some QLD councils in the periods of intense rain that followed the
millennium drought. Roads surfaces can be made fragile by
prolonged dry periods, and more susceptible to damage through
flooding.
The issue has not been observed by RCC, however, and was not
considered to be a risk of any substantial likelihood or consequences
— even in the face of increased likelihood of droughts and intense
rainfall.
Spatial and other
Analyses: None required.
Redland City Council
Climate Change Risk Assessment and Adaptation Plan
15 April 2009
36
36
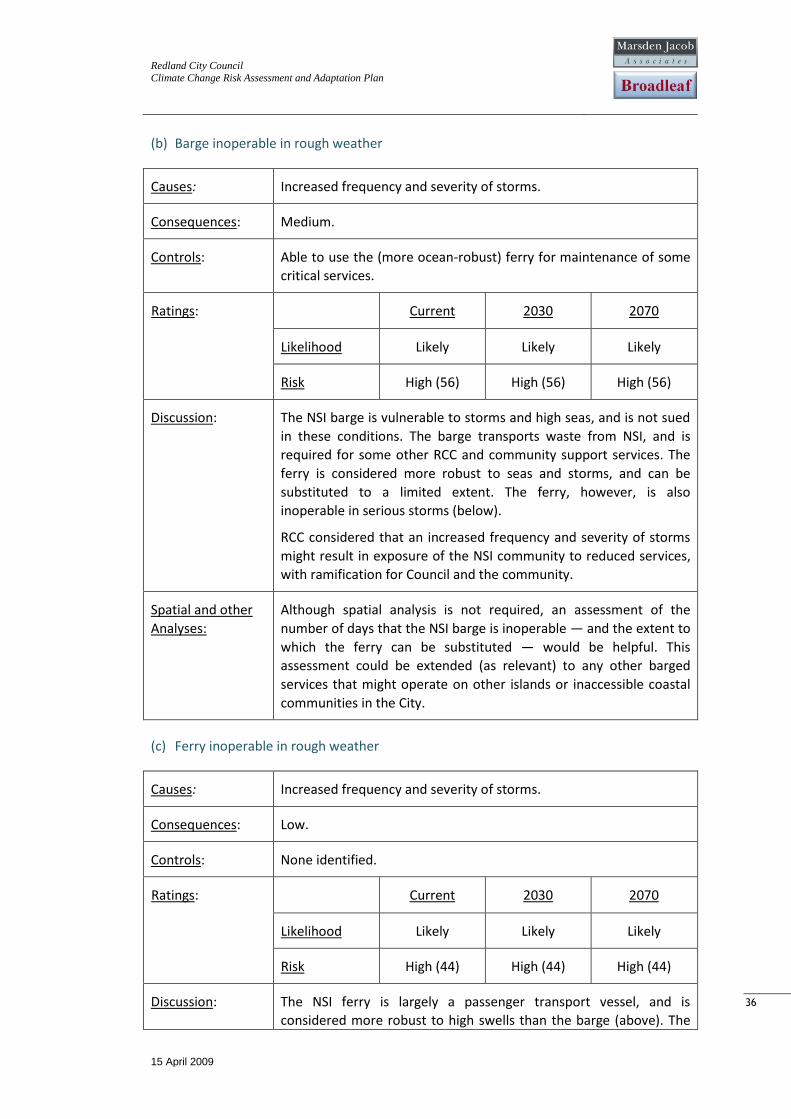
(b) Barge inoperable in rough weather
Causes: Increased frequency and severity of storms.
Consequences: Medium.
Controls: Able to use the (more ocean-robust) ferry for maintenance of some
critical services.
Ratings: Current 2030 2070
Likelihood Likely Likely Likely
Risk High (56) High (56) High (56)
Discussion: The NSI barge is vulnerable to storms and high seas, and is not sued
in these conditions. The barge transports waste from NSI, and is
required for some other RCC and community support services. The
ferry is considered more robust to seas and storms, and can be
substituted to a limited extent. The ferry, however, is also
inoperable in serious storms (below).
RCC considered that an increased frequency and severity of storms
might result in exposure of the NSI community to reduced services,
with ramification for Council and the community.
Spatial and other
Analyses: Although spatial analysis is not required, an assessment of the
number of days that the NSI barge is inoperable — and the extent to
which the ferry can be substituted — would be helpful. This
assessment could be extended (as relevant) to any other barged
services that might operate on other islands or inaccessible coastal
communities in the City.
(c) Ferry inoperable in rough weather
Causes: Increased frequency and severity of storms.
Consequences: Low.
Controls: None identified.
Ratings: Current 2030 2070
Likelihood Likely Likely Likely
Risk High (44) High (44) High (44)
Discussion: The NSI ferry is largely a passenger transport vessel, and is
considered more robust to high swells than the barge (above). The
Redland City Council
Climate Change Risk Assessment and Adaptation Plan
15 April 2009
37
37
ferry is, however, used to a limited extent in place of the barge to
transport waste and enable some other community services to the
island to be maintained.
Spatial and other
Analyses: Although spatial analysis is not required, an assessment of the
number of days that the NSI ferry is inoperable would be helpful.
This assessment could be extended (as relevant) to any other ferry
services that might operate on other islands or inaccessible coastal
communities in the City.
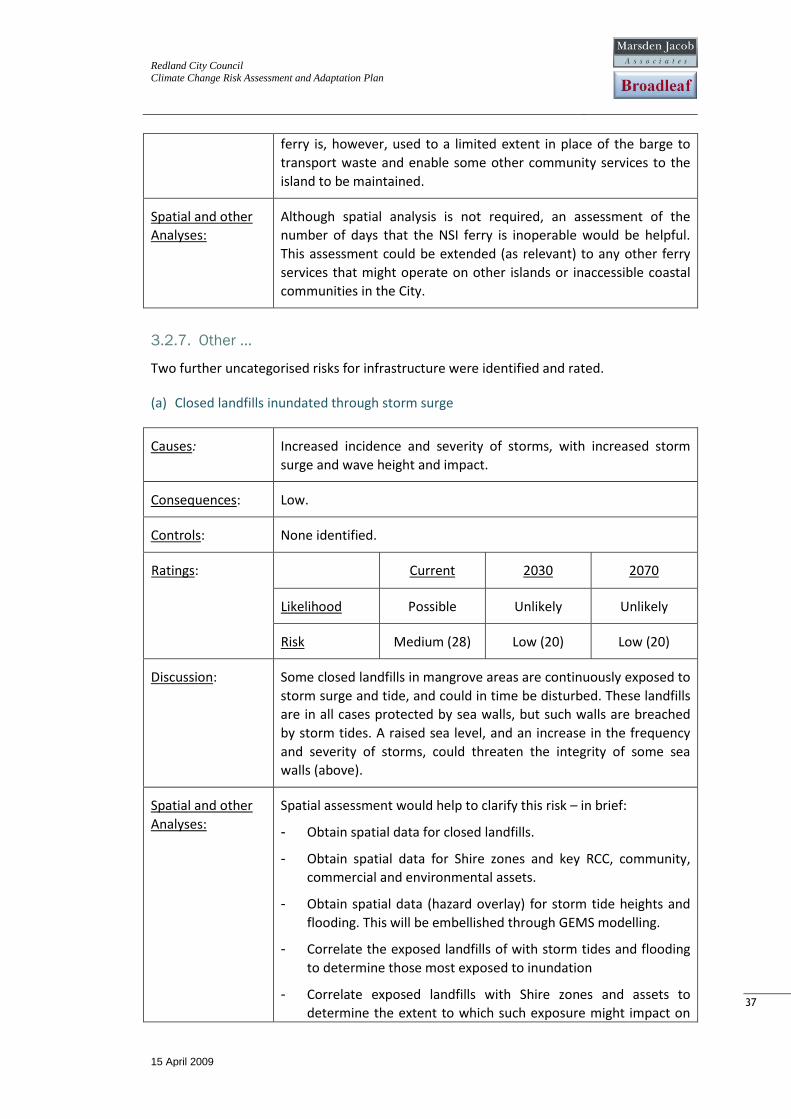
3.2.7. Other ...
Two further uncategorised risks for infrastructure were identified and rated.
(a) Closed landfills inundated through storm surge
Causes: Increased incidence and severity of storms, with increased storm
surge and wave height and impact.
Consequences: Low.
Controls: None identified.
Ratings: Current 2030 2070
Likelihood Possible Unlikely Unlikely
Risk Medium (28) Low (20) Low (20)
Discussion: Some closed landfills in mangrove areas are continuously exposed to
storm surge and tide, and could in time be disturbed. These landfills
are in all cases protected by sea walls, but such walls are breached
by storm tides. A raised sea level, and an increase in the frequency
and severity of storms, could threaten the integrity of some sea
walls (above).
Spatial and other
Analyses: Spatial assessment would help to clarify this risk – in brief:
- Obtain spatial data for closed landfills.
- Obtain spatial data for Shire zones and key RCC, community,
commercial and environmental assets.
- Obtain spatial data (hazard overlay) for storm tide heights and
flooding. This will be embellished through GEMS modelling.
- Correlate the exposed landfills of with storm tides and flooding
to determine those most exposed to inundation
- Correlate exposed landfills with Shire zones and assets to
determine the extent to which such exposure might impact on

Redland City Council
Climate Change Risk Assessment and Adaptation Plan
15 April 2009
38
38
RCC.
(b) Damage to microwave linkage to isolated and island communities
Causes: Increased frequency and severity of storms — principally wind and
lightening.
Consequences: Insignificant.
Controls: Ongoing maintenance.
Ratings: Current 2030 2070
Likelihood Rare Unlikely Possible
Risk Low (4) Low (8) Low (12)
Discussion: Microwave links are used to connect some of the more isolated
parts of the City. Microwave links are also used extensively by RWW.
Currently, microwave linkages fail for approximately 3 hours each
quarter.
This risk considered the impact that an increase in the frequency and
severity of storms might have on RCC as a result of disconnection of
communities dependent on microwave linkages or on RWW. The
issue, whilst important to maintain on the register, was not
considered substantial as the direct impacts are minor and short-
lived and are not accrued directly to RCC.
Spatial and other
Analyses: None required.
3.3. Risks for Planning and Development
Risk categories and draft risks were created for Commercial Planning, Economic
Development, Industrial Planning, Open Space Planning, Residential Planning, Strategic
Planning and ‘other’ Planning. However, only Strategic Planning was retained at the close of
the workshop. In truth, most risks identified under the Planning and Development Key
Element could rationally be classified in any one of several different categories, and
restriction of risks to the category of Strategic Planning was seen as a pragmatic
abbreviation of terminology rather than a scaling back of important issues.
Within Strategic Planning, five risks were identified and rated.
(a) Increased need for shaded/cool facilities
Causes: Increased number of extremely hot days and increased peak
temperatures.
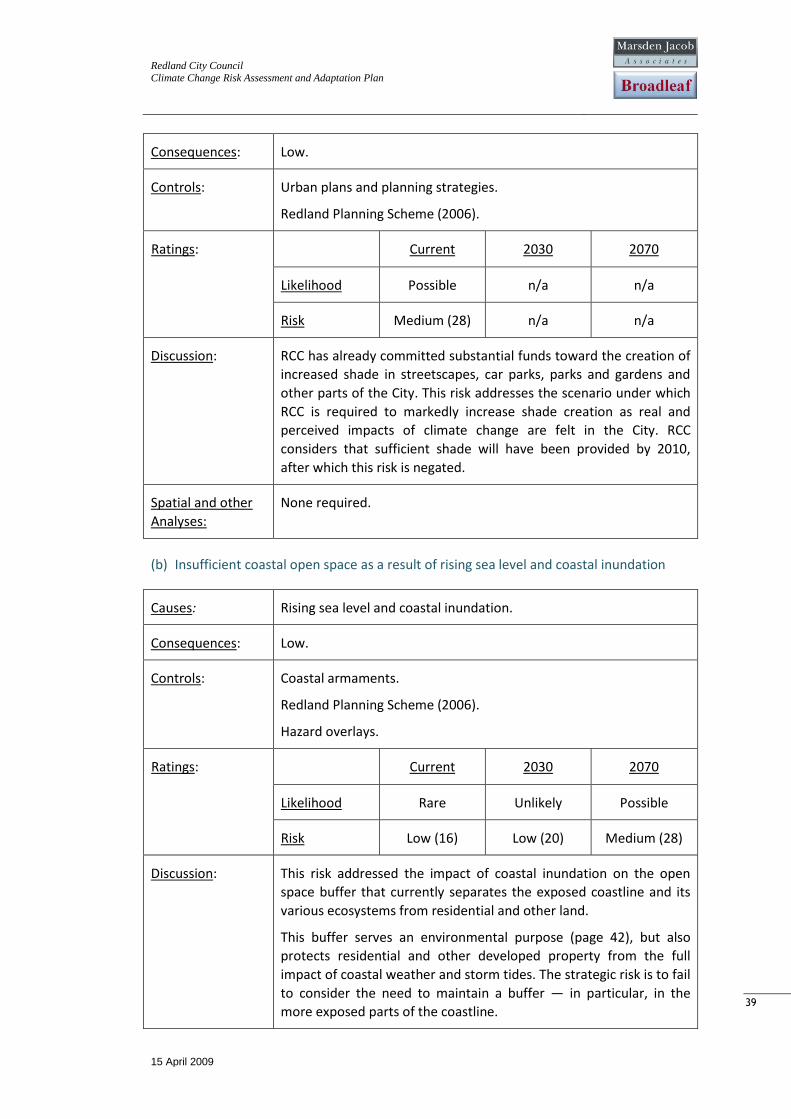
Redland City Council
Climate Change Risk Assessment and Adaptation Plan
15 April 2009
39
39
Consequences: Low.
Controls: Urban plans and planning strategies.
Redland Planning Scheme (2006).
Ratings: Current 2030 2070
Likelihood Possible n/a n/a
Risk Medium (28) n/a n/a
Discussion: RCC has already committed substantial funds toward the creation of
increased shade in streetscapes, car parks, parks and gardens and
other parts of the City. This risk addresses the scenario under which
RCC is required to markedly increase shade creation as real and
perceived impacts of climate change are felt in the City. RCC
considers that sufficient shade will have been provided by 2010,
after which this risk is negated.
Spatial and other
Analyses: None required.
(b) Insufficient coastal open space as a result of rising sea level and coastal inundation
Causes: Rising sea level and coastal inundation.
Consequences: Low.
Controls: Coastal armaments.
Redland Planning Scheme (2006).
Hazard overlays.
Ratings: Current 2030 2070
Likelihood Rare Unlikely Possible
Risk Low (16) Low (20) Medium (28)
Discussion: This risk addressed the impact of coastal inundation on the open
space buffer that currently separates the exposed coastline and its
various ecosystems from residential and other land.
This buffer serves an environmental purpose (page 42), but also
protects residential and other developed property from the full
impact of coastal weather and storm tides. The strategic risk is to fail
to consider the need to maintain a buffer — in particular, in the
more exposed parts of the coastline.
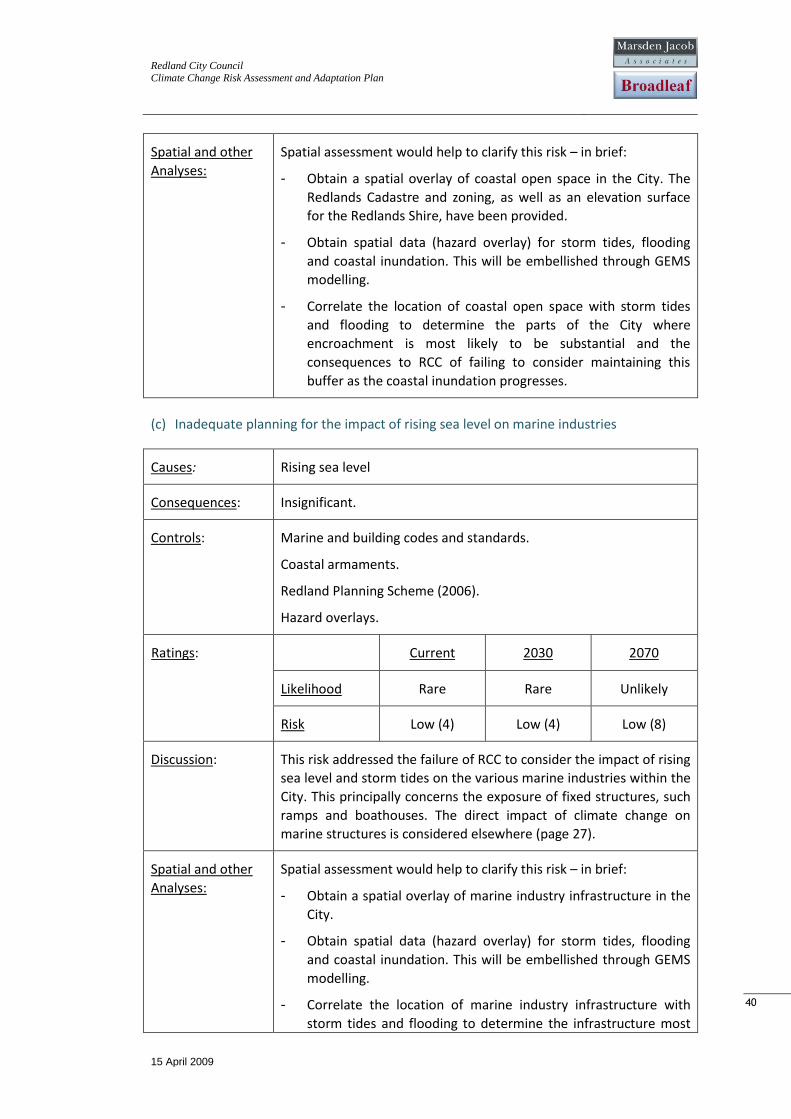
Redland City Council
Climate Change Risk Assessment and Adaptation Plan
15 April 2009
40
40
Spatial and other
Analyses: Spatial assessment would help to clarify this risk – in brief:
- Obtain a spatial overlay of coastal open space in the City. The
Redlands Cadastre and zoning, as well as an elevation surface
for the Redlands Shire, have been provided.
- Obtain spatial data (hazard overlay) for storm tides, flooding
and coastal inundation. This will be embellished through GEMS
modelling.
- Correlate the location of coastal open space with storm tides
and flooding to determine the parts of the City where
encroachment is most likely to be substantial and the
consequences to RCC of failing to consider maintaining this
buffer as the coastal inundation progresses.
(c) Inadequate planning for the impact of rising sea level on marine industries
Causes: Rising sea level
Consequences: Insignificant.
Controls: Marine and building codes and standards.
Coastal armaments.
Redland Planning Scheme (2006).
Hazard overlays.
Ratings: Current 2030 2070
Likelihood Rare Rare Unlikely
Risk Low (4) Low (4) Low (8)
Discussion: This risk addressed the failure of RCC to consider the impact of rising
sea level and storm tides on the various marine industries within the
City. This principally concerns the exposure of fixed structures, such
ramps and boathouses. The direct impact of climate change on
marine structures is considered elsewhere (page 27).
Spatial and other
Analyses: Spatial assessment would help to clarify this risk – in brief:
- Obtain a spatial overlay of marine industry infrastructure in the
City.
- Obtain spatial data (hazard overlay) for storm tides, flooding
and coastal inundation. This will be embellished through GEMS
modelling.
- Correlate the location of marine industry infrastructure with
storm tides and flooding to determine the infrastructure most
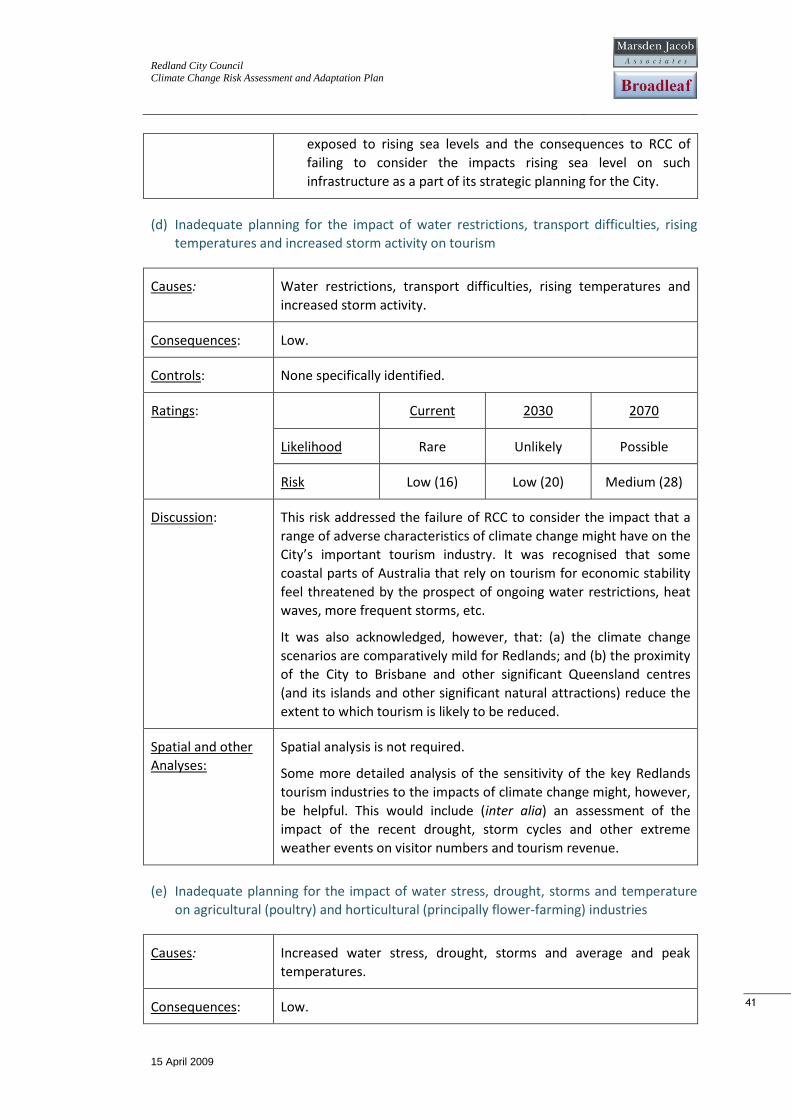
Redland City Council
Climate Change Risk Assessment and Adaptation Plan
15 April 2009
41
41
exposed to rising sea levels and the consequences to RCC of
failing to consider the impacts rising sea level on such
infrastructure as a part of its strategic planning for the City.
(d) Inadequate planning for the impact of water restrictions, transport difficulties, rising
temperatures and increased storm activity on tourism
Causes: Water restrictions, transport difficulties, rising temperatures and
increased storm activity.
Consequences: Low.
Controls: None specifically identified.
Ratings: Current 2030 2070
Likelihood Rare Unlikely Possible
Risk Low (16) Low (20) Medium (28)
Discussion: This risk addressed the failure of RCC to consider the impact that a
range of adverse characteristics of climate change might have on the
City’s important tourism industry. It was recognised that some
coastal parts of Australia that rely on tourism for economic stability
feel threatened by the prospect of ongoing water restrictions, heat
waves, more frequent storms, etc.
It was also acknowledged, however, that: (a) the climate change
scenarios are comparatively mild for Redlands; and (b) the proximity
of the City to Brisbane and other significant Queensland centres
(and its islands and other significant natural attractions) reduce the
extent to which tourism is likely to be reduced.
Spatial and other
Analyses: Spatial analysis is not required.
Some more detailed analysis of the sensitivity of the key Redlands
tourism industries to the impacts of climate change might, however,
be helpful. This would include (inter alia) an assessment of the
impact of the recent drought, storm cycles and other extreme
weather events on visitor numbers and tourism revenue.
(e) Inadequate planning for the impact of water stress, drought, storms and temperature
on agricultural (poultry) and horticultural (principally flower-farming) industries
Causes: Increased water stress, drought, storms and average and peak
temperatures.
Consequences: Low.
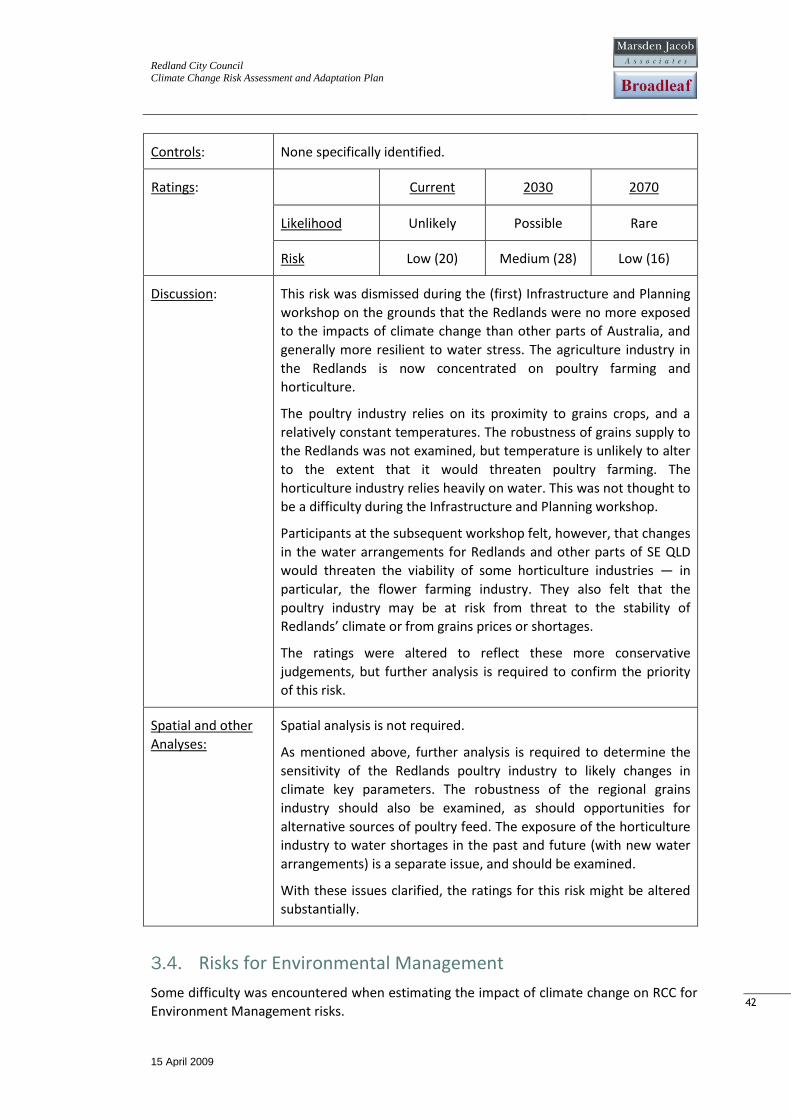
Redland City Council
Climate Change Risk Assessment and Adaptation Plan
15 April 2009
42
42
Controls: None specifically identified.
Ratings: Current 2030 2070
Likelihood Unlikely Possible Rare
Risk Low (20) Medium (28) Low (16)
Discussion: This risk was dismissed during the (first) Infrastructure and Planning
workshop on the grounds that the Redlands were no more exposed
to the impacts of climate change than other parts of Australia, and
generally more resilient to water stress. The agriculture industry in
the Redlands is now concentrated on poultry farming and
horticulture.
The poultry industry relies on its proximity to grains crops, and a
relatively constant temperatures. The robustness of grains supply to
the Redlands was not examined, but temperature is unlikely to alter
to the extent that it would threaten poultry farming. The
horticulture industry relies heavily on water. This was not thought to
be a difficulty during the Infrastructure and Planning workshop.
Participants at the subsequent workshop felt, however, that changes
in the water arrangements for Redlands and other parts of SE QLD
would threaten the viability of some horticulture industries — in
particular, the flower farming industry. They also felt that the
poultry industry may be at risk from threat to the stability of
Redlands’ climate or from grains prices or shortages.
The ratings were altered to reflect these more conservative
judgements, but further analysis is required to confirm the priority
of this risk.
Spatial and other
Analyses: Spatial analysis is not required.
As mentioned above, further analysis is required to determine the
sensitivity of the Redlands poultry industry to likely changes in
climate key parameters. The robustness of the regional grains
industry should also be examined, as should opportunities for
alternative sources of poultry feed. The exposure of the horticulture
industry to water shortages in the past and future (with new water
arrangements) is a separate issue, and should be examined.
With these issues clarified, the ratings for this risk might be altered
substantially.
3.4. Risks for Environmental Management
Some difficulty was encountered when estimating the impact of climate change on RCC for
Environment Management risks.
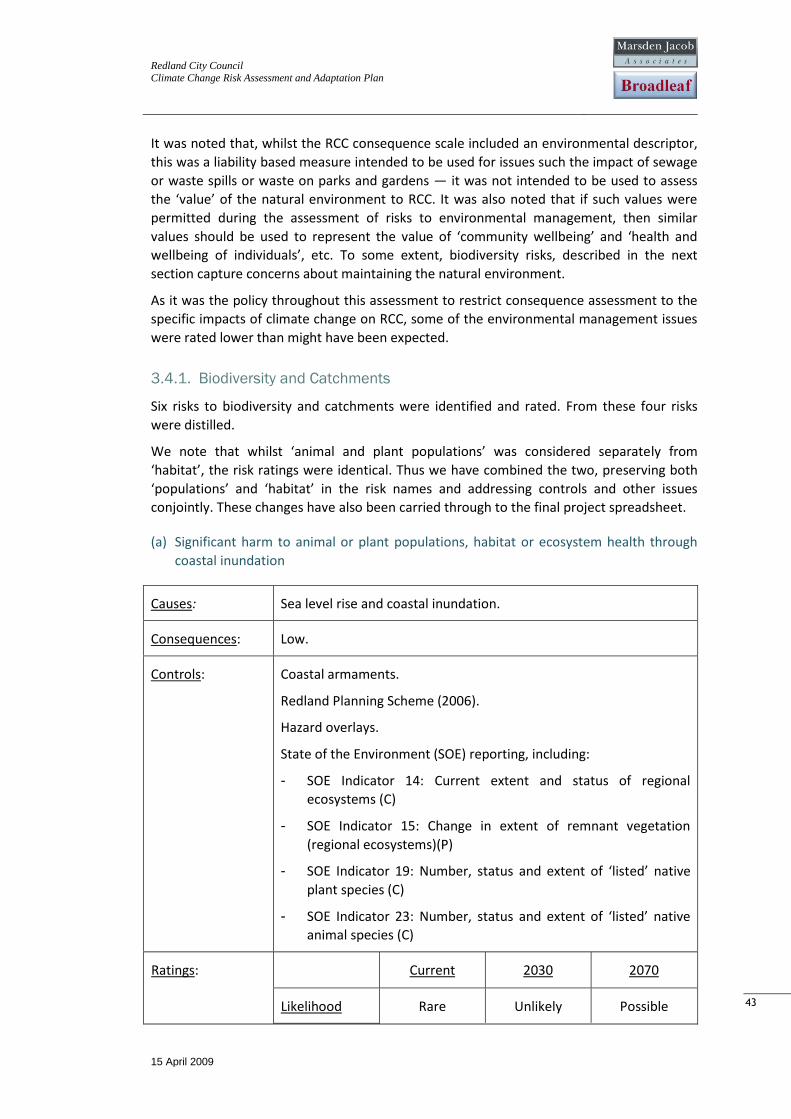
Redland City Council
Climate Change Risk Assessment and Adaptation Plan
15 April 2009
43
43
It was noted that, whilst the RCC consequence scale included an environmental descriptor,
this was a liability based measure intended to be used for issues such the impact of sewage
or waste spills or waste on parks and gardens — it was not intended to be used to assess
the ‘value’ of the natural environment to RCC. It was also noted that if such values were
permitted during the assessment of risks to environmental management, then similar
values should be used to represent the value of ‘community wellbeing’ and ‘health and
wellbeing of individuals’, etc. To some extent, biodiversity risks, described in the next
section capture concerns about maintaining the natural environment.
As it was the policy throughout this assessment to restrict consequence assessment to the
specific impacts of climate change on RCC, some of the environmental management issues
were rated lower than might have been expected.
3.4.1. Biodiversity and Catchments
Six risks to biodiversity and catchments were identified and rated. From these four risks
were distilled.
We note that whilst ‘animal and plant populations’ was considered separately from
‘habitat’, the risk ratings were identical. Thus we have combined the two, preserving both
‘populations’ and ‘habitat’ in the risk names and addressing controls and other issues
conjointly. These changes have also been carried through to the final project spreadsheet.
(a) Significant harm to animal or plant populations, habitat or ecosystem health through
coastal inundation
Causes: Sea level rise and coastal inundation.
Consequences: Low.
Controls: Coastal armaments.
Redland Planning Scheme (2006).
Hazard overlays.
State of the Environment (SOE) reporting, including:
- SOE Indicator 14: Current extent and status of regional
ecosystems (C)
- SOE Indicator 15: Change in extent of remnant vegetation
(regional ecosystems)(P)
- SOE Indicator 19: Number, status and extent of ‘listed’ native
plant species (C)
- SOE Indicator 23: Number, status and extent of ‘listed’ native
animal species (C)
Ratings: Current 2030 2070
Likelihood Rare Unlikely Possible
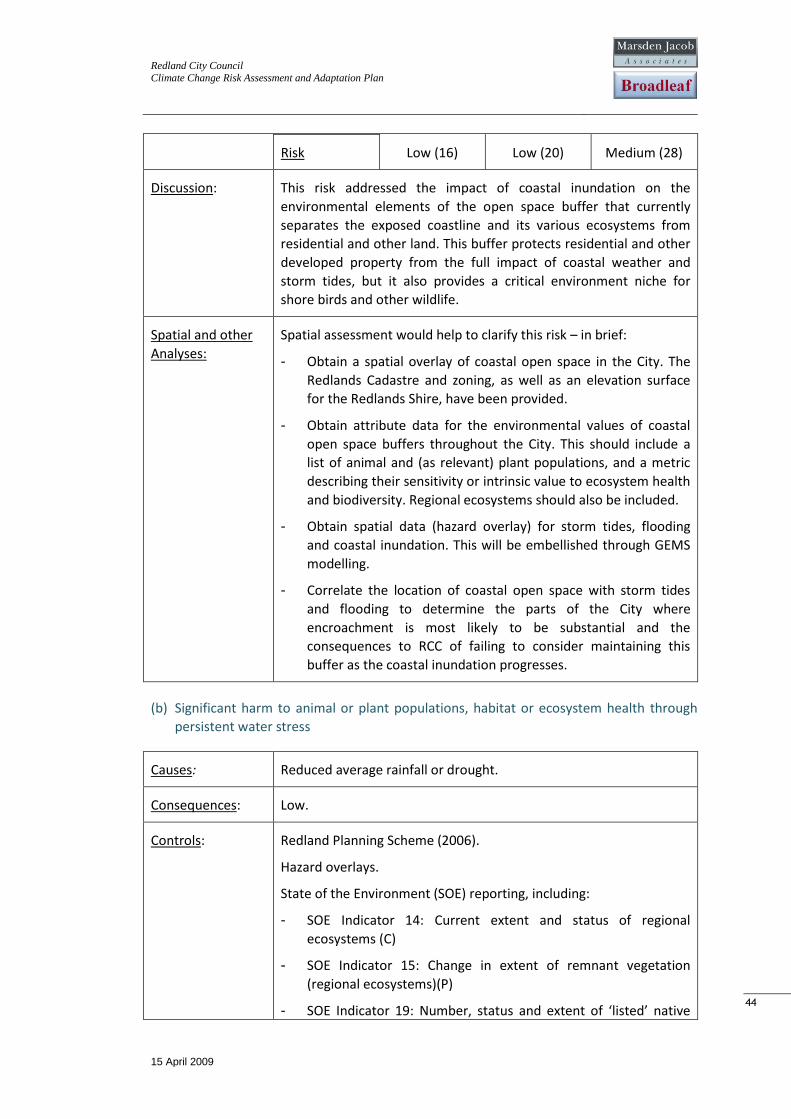
Redland City Council
Climate Change Risk Assessment and Adaptation Plan
15 April 2009
44
44
Risk Low (16) Low (20) Medium (28)
Discussion: This risk addressed the impact of coastal inundation on the
environmental elements of the open space buffer that currently
separates the exposed coastline and its various ecosystems from
residential and other land. This buffer protects residential and other
developed property from the full impact of coastal weather and
storm tides, but it also provides a critical environment niche for
shore birds and other wildlife.
Spatial and other
Analyses: Spatial assessment would help to clarify this risk – in brief:
- Obtain a spatial overlay of coastal open space in the City. The
Redlands Cadastre and zoning, as well as an elevation surface
for the Redlands Shire, have been provided.
- Obtain attribute data for the environmental values of coastal
open space buffers throughout the City. This should include a
list of animal and (as relevant) plant populations, and a metric
describing their sensitivity or intrinsic value to ecosystem health
and biodiversity. Regional ecosystems should also be included.
- Obtain spatial data (hazard overlay) for storm tides, flooding
and coastal inundation. This will be embellished through GEMS
modelling.
- Correlate the location of coastal open space with storm tides
and flooding to determine the parts of the City where
encroachment is most likely to be substantial and the
consequences to RCC of failing to consider maintaining this
buffer as the coastal inundation progresses.
(b) Significant harm to animal or plant populations, habitat or ecosystem health through
persistent water stress
Causes: Reduced average rainfall or drought.
Consequences: Low.
Controls: Redland Planning Scheme (2006).
Hazard overlays.
State of the Environment (SOE) reporting, including:
- SOE Indicator 14: Current extent and status of regional
ecosystems (C)
- SOE Indicator 15: Change in extent of remnant vegetation
(regional ecosystems)(P)
- SOE Indicator 19: Number, status and extent of ‘listed’ native
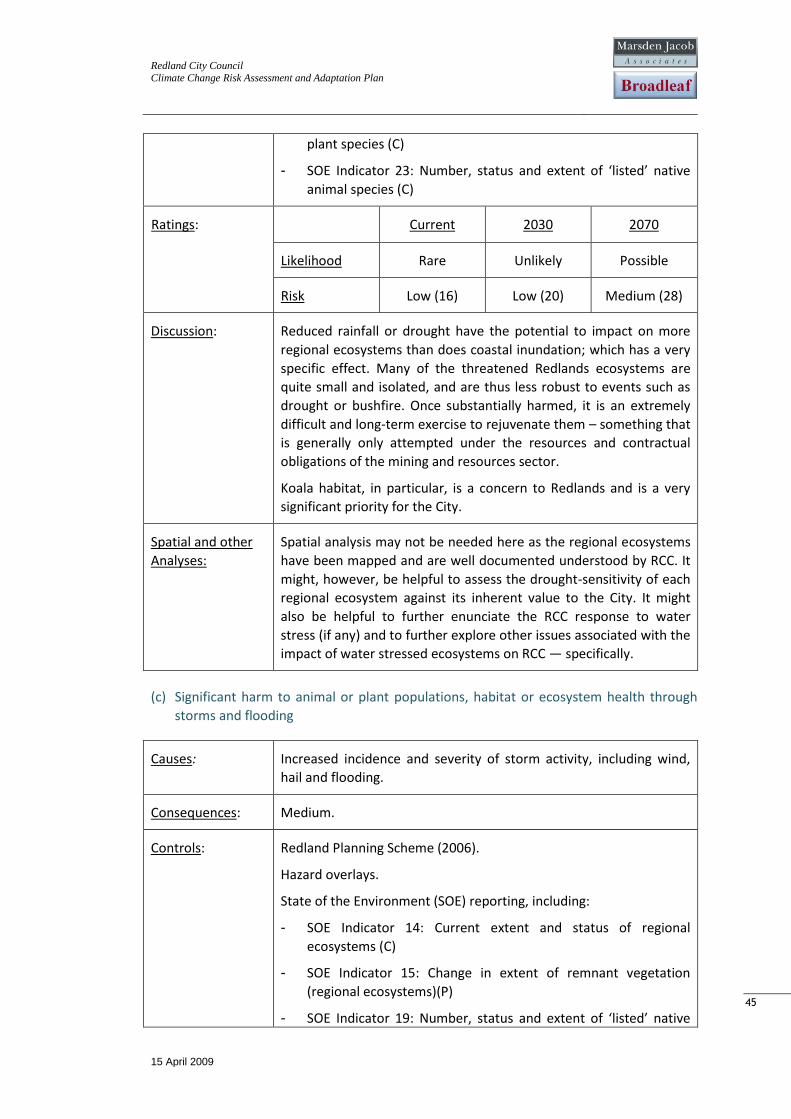
Redland City Council
Climate Change Risk Assessment and Adaptation Plan
15 April 2009
45
45
plant species (C)
- SOE Indicator 23: Number, status and extent of ‘listed’ native
animal species (C)
Ratings: Current 2030 2070
Likelihood Rare Unlikely Possible
Risk Low (16) Low (20) Medium (28)
Discussion: Reduced rainfall or drought have the potential to impact on more
regional ecosystems than does coastal inundation; which has a very
specific effect. Many of the threatened Redlands ecosystems are
quite small and isolated, and are thus less robust to events such as
drought or bushfire. Once substantially harmed, it is an extremely
difficult and long-term exercise to rejuvenate them – something that
is generally only attempted under the resources and contractual
obligations of the mining and resources sector.
Koala habitat, in particular, is a concern to Redlands and is a very
significant priority for the City.
Spatial and other
Analyses: Spatial analysis may not be needed here as the regional ecosystems
have been mapped and are well documented understood by RCC. It
might, however, be helpful to assess the drought-sensitivity of each
regional ecosystem against its inherent value to the City. It might
also be helpful to further enunciate the RCC response to water
stress (if any) and to further explore other issues associated with the
impact of water stressed ecosystems on RCC — specifically.
(c) Significant harm to animal or plant populations, habitat or ecosystem health through
storms and flooding
Causes: Increased incidence and severity of storm activity, including wind,
hail and flooding.
Consequences: Medium.
Controls: Redland Planning Scheme (2006).
Hazard overlays.
State of the Environment (SOE) reporting, including:
- SOE Indicator 14: Current extent and status of regional
ecosystems (C)
- SOE Indicator 15: Change in extent of remnant vegetation
(regional ecosystems)(P)
- SOE Indicator 19: Number, status and extent of ‘listed’ native
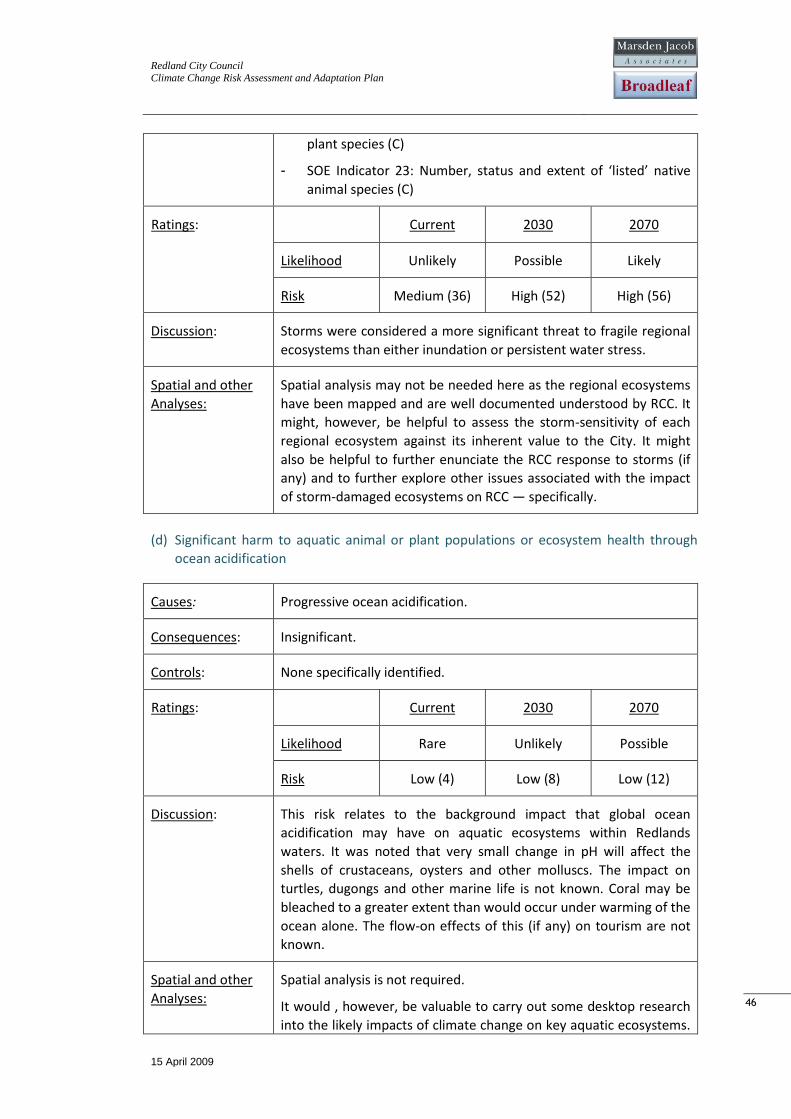
Redland City Council
Climate Change Risk Assessment and Adaptation Plan
15 April 2009
46
46
plant species (C)
- SOE Indicator 23: Number, status and extent of ‘listed’ native
animal species (C)
Ratings: Current 2030 2070
Likelihood Unlikely Possible Likely
Risk Medium (36) High (52) High (56)
Discussion: Storms were considered a more significant threat to fragile regional
ecosystems than either inundation or persistent water stress.
Spatial and other
Analyses: Spatial analysis may not be needed here as the regional ecosystems
have been mapped and are well documented understood by RCC. It
might, however, be helpful to assess the storm-sensitivity of each
regional ecosystem against its inherent value to the City. It might
also be helpful to further enunciate the RCC response to storms (if
any) and to further explore other issues associated with the impact
of storm-damaged ecosystems on RCC — specifically.
(d) Significant harm to aquatic animal or plant populations or ecosystem health through
ocean acidification
Causes: Progressive ocean acidification.
Consequences: Insignificant.
Controls: None specifically identified.
Ratings: Current 2030 2070
Likelihood Rare Unlikely Possible
Risk Low (4) Low (8) Low (12)
Discussion: This risk relates to the background impact that global ocean
acidification may have on aquatic ecosystems within Redlands
waters. It was noted that very small change in pH will affect the
shells of crustaceans, oysters and other molluscs. The impact on
turtles, dugongs and other marine life is not known. Coral may be
bleached to a greater extent than would occur under warming of the
ocean alone. The flow-on effects of this (if any) on tourism are not
known.
Spatial and other
Analyses: Spatial analysis is not required.
It would , however, be valuable to carry out some desktop research
into the likely impacts of climate change on key aquatic ecosystems.
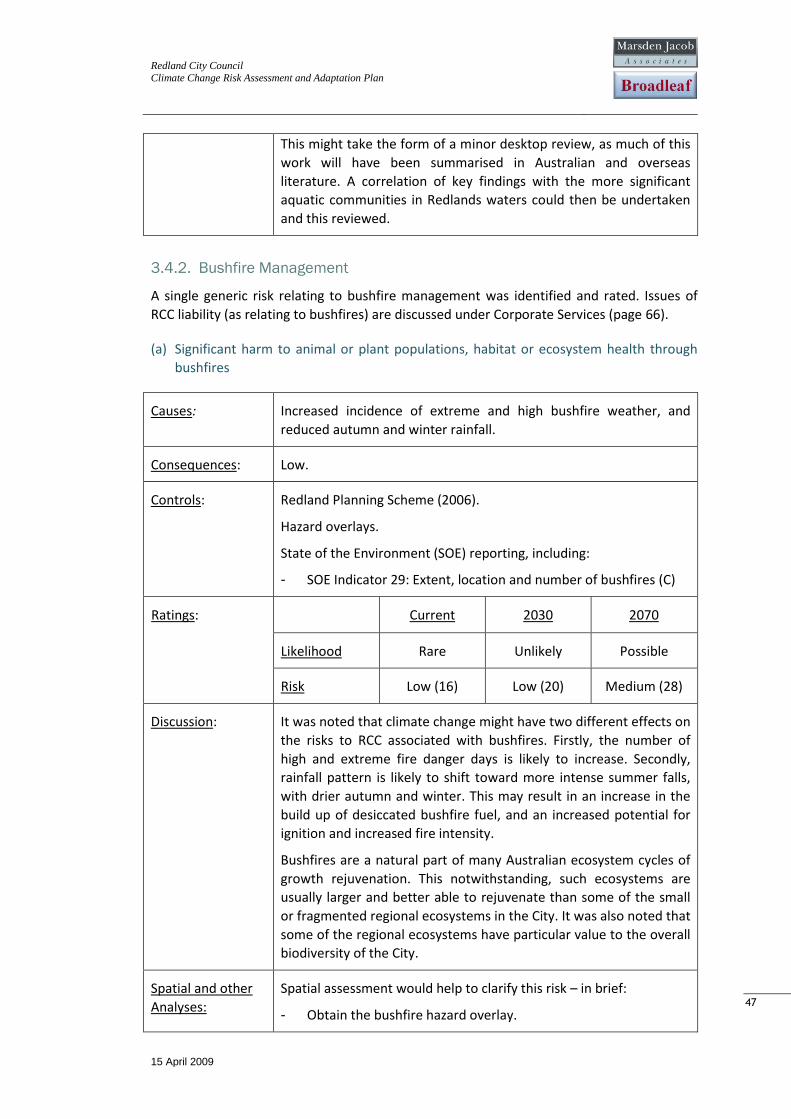
Redland City Council
Climate Change Risk Assessment and Adaptation Plan
15 April 2009
47
47
This might take the form of a minor desktop review, as much of this
work will have been summarised in Australian and overseas
literature. A correlation of key findings with the more significant
aquatic communities in Redlands waters could then be undertaken
and this reviewed.
3.4.2. Bushfire Management
A single generic risk relating to bushfire management was identified and rated. Issues of
RCC liability (as relating to bushfires) are discussed under Corporate Services (page 66).
(a) Significant harm to animal or plant populations, habitat or ecosystem health through
bushfires
Causes: Increased incidence of extreme and high bushfire weather, and
reduced autumn and winter rainfall.
Consequences: Low.
Controls: Redland Planning Scheme (2006).
Hazard overlays.
State of the Environment (SOE) reporting, including:
- SOE Indicator 29: Extent, location and number of bushfires (C)
Ratings: Current 2030 2070
Likelihood Rare Unlikely Possible
Risk Low (16) Low (20) Medium (28)
Discussion: It was noted that climate change might have two different effects on
the risks to RCC associated with bushfires. Firstly, the number of
high and extreme fire danger days is likely to increase. Secondly,
rainfall pattern is likely to shift toward more intense summer falls,
with drier autumn and winter. This may result in an increase in the
build up of desiccated bushfire fuel, and an increased potential for
ignition and increased fire intensity.
Bushfires are a natural part of many Australian ecosystem cycles of
growth rejuvenation. This notwithstanding, such ecosystems are
usually larger and better able to rejuvenate than some of the small
or fragmented regional ecosystems in the City. It was also noted that
some of the regional ecosystems have particular value to the overall
biodiversity of the City.
Spatial and other
Analyses: Spatial assessment would help to clarify this risk – in brief:
- Obtain the bushfire hazard overlay.
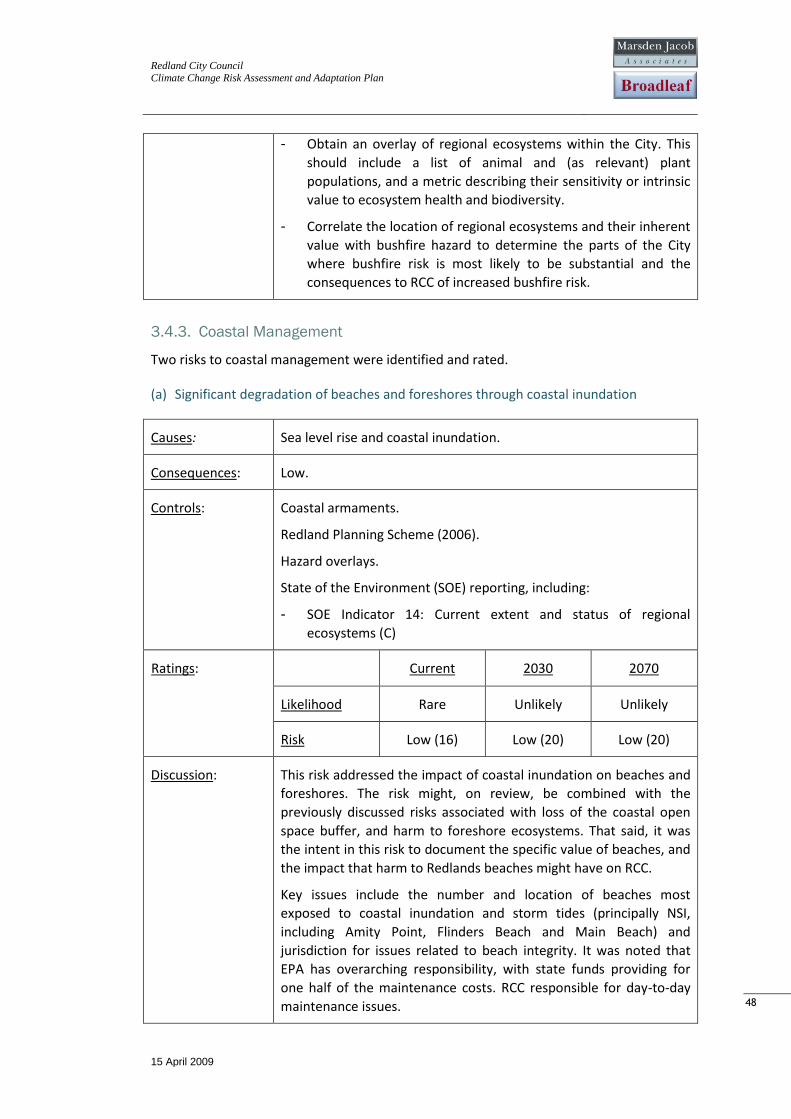
Redland City Council
Climate Change Risk Assessment and Adaptation Plan
15 April 2009
48
48
- Obtain an overlay of regional ecosystems within the City. This
should include a list of animal and (as relevant) plant
populations, and a metric describing their sensitivity or intrinsic
value to ecosystem health and biodiversity.
- Correlate the location of regional ecosystems and their inherent
value with bushfire hazard to determine the parts of the City
where bushfire risk is most likely to be substantial and the
consequences to RCC of increased bushfire risk.
3.4.3. Coastal Management
Two risks to coastal management were identified and rated.
(a) Significant degradation of beaches and foreshores through coastal inundation
Causes: Sea level rise and coastal inundation.
Consequences: Low.
Controls: Coastal armaments.
Redland Planning Scheme (2006).
Hazard overlays.
State of the Environment (SOE) reporting, including:
- SOE Indicator 14: Current extent and status of regional
ecosystems (C)
Ratings: Current 2030 2070
Likelihood Rare Unlikely Unlikely
Risk Low (16) Low (20) Low (20)
Discussion: This risk addressed the impact of coastal inundation on beaches and
foreshores. The risk might, on review, be combined with the
previously discussed risks associated with loss of the coastal open
space buffer, and harm to foreshore ecosystems. That said, it was
the intent in this risk to document the specific value of beaches, and
the impact that harm to Redlands beaches might have on RCC.
Key issues include the number and location of beaches most
exposed to coastal inundation and storm tides (principally NSI,
including Amity Point, Flinders Beach and Main Beach) and
jurisdiction for issues related to beach integrity. It was noted that
EPA has overarching responsibility, with state funds providing for
one half of the maintenance costs. RCC responsible for day-to-day
maintenance issues.
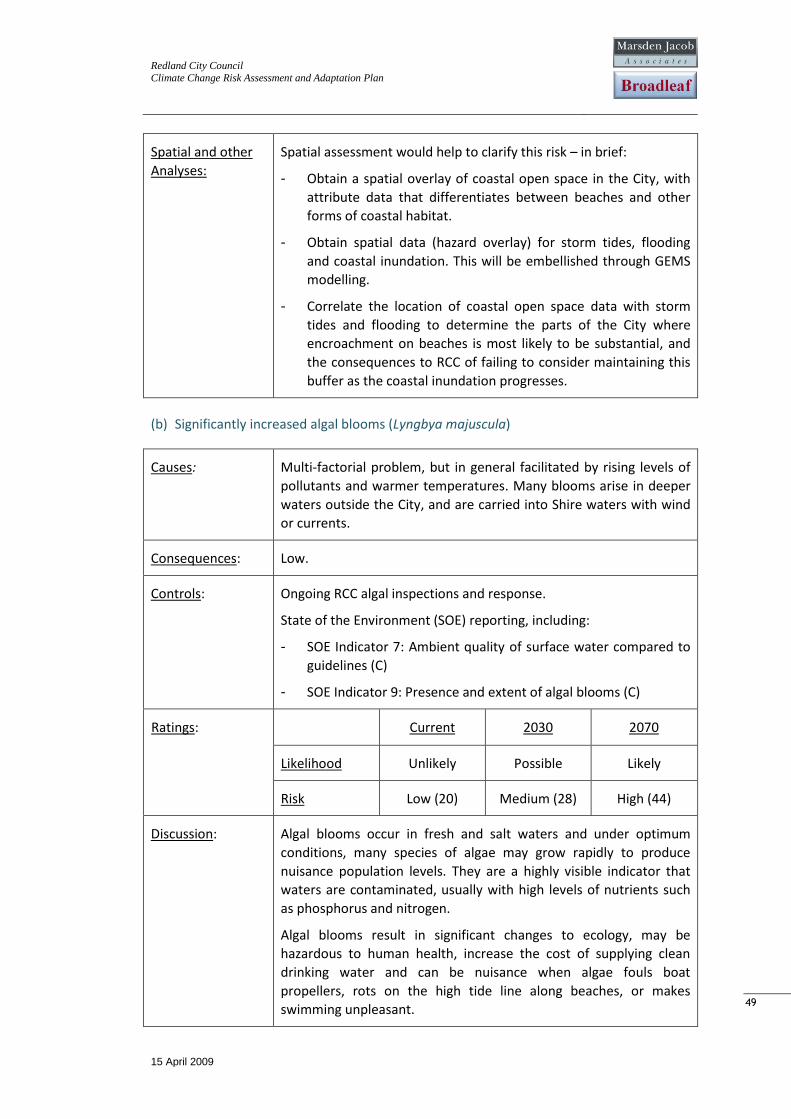
Redland City Council
Climate Change Risk Assessment and Adaptation Plan
15 April 2009
49
49
Spatial and other
Analyses: Spatial assessment would help to clarify this risk – in brief:
- Obtain a spatial overlay of coastal open space in the City, with
attribute data that differentiates between beaches and other
forms of coastal habitat.
- Obtain spatial data (hazard overlay) for storm tides, flooding
and coastal inundation. This will be embellished through GEMS
modelling.
- Correlate the location of coastal open space data with storm
tides and flooding to determine the parts of the City where
encroachment on beaches is most likely to be substantial, and
the consequences to RCC of failing to consider maintaining this
buffer as the coastal inundation progresses.
(b) Significantly increased algal blooms (Lyngbya majuscula)
Causes: Multi-factorial problem, but in general facilitated by rising levels of
pollutants and warmer temperatures. Many blooms arise in deeper
waters outside the City, and are carried into Shire waters with wind
or currents.
Consequences: Low.
Controls: Ongoing RCC algal inspections and response.
State of the Environment (SOE) reporting, including:
- SOE Indicator 7: Ambient quality of surface water compared to
guidelines (C)
- SOE Indicator 9: Presence and extent of algal blooms (C)
Ratings: Current 2030 2070
Likelihood Unlikely Possible Likely
Risk Low (20) Medium (28) High (44)
Discussion: Algal blooms occur in fresh and salt waters and under optimum
conditions, many species of algae may grow rapidly to produce
nuisance population levels. They are a highly visible indicator that
waters are contaminated, usually with high levels of nutrients such
as phosphorus and nitrogen.
Algal blooms result in significant changes to ecology, may be
hazardous to human health, increase the cost of supplying clean
drinking water and can be nuisance when algae fouls boat
propellers, rots on the high tide line along beaches, or makes
swimming unpleasant.
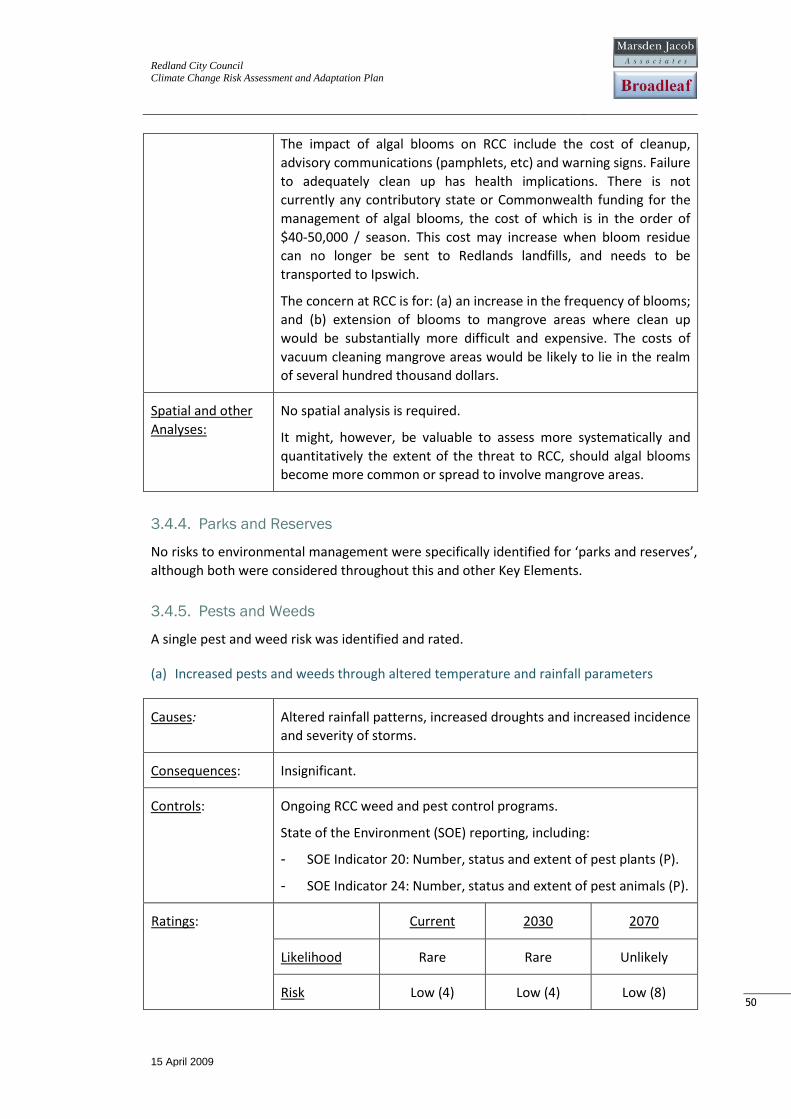
Redland City Council
Climate Change Risk Assessment and Adaptation Plan
15 April 2009
50
50
The impact of algal blooms on RCC include the cost of cleanup,
advisory communications (pamphlets, etc) and warning signs. Failure
to adequately clean up has health implications. There is not
currently any contributory state or Commonwealth funding for the
management of algal blooms, the cost of which is in the order of
$40-50,000 / season. This cost may increase when bloom residue
can no longer be sent to Redlands landfills, and needs to be
transported to Ipswich.
The concern at RCC is for: (a) an increase in the frequency of blooms;
and (b) extension of blooms to mangrove areas where clean up
would be substantially more difficult and expensive. The costs of
vacuum cleaning mangrove areas would be likely to lie in the realm
of several hundred thousand dollars.
Spatial and other
Analyses: No spatial analysis is required.
It might, however, be valuable to assess more systematically and
quantitatively the extent of the threat to RCC, should algal blooms
become more common or spread to involve mangrove areas.
3.4.4. Parks and Reserves
No risks to environmental management were specifically identified for ‘parks and reserves’,
although both were considered throughout this and other Key Elements.
3.4.5. Pests and Weeds
A single pest and weed risk was identified and rated.
(a) Increased pests and weeds through altered temperature and rainfall parameters
Causes: Altered rainfall patterns, increased droughts and increased incidence
and severity of storms.
Consequences: Insignificant.
Controls: Ongoing RCC weed and pest control programs.
State of the Environment (SOE) reporting, including:
- SOE Indicator 20: Number, status and extent of pest plants (P).
- SOE Indicator 24: Number, status and extent of pest animals (P).
Ratings: Current 2030 2070
Likelihood Rare Rare Unlikely
Risk Low (4) Low (4) Low (8)
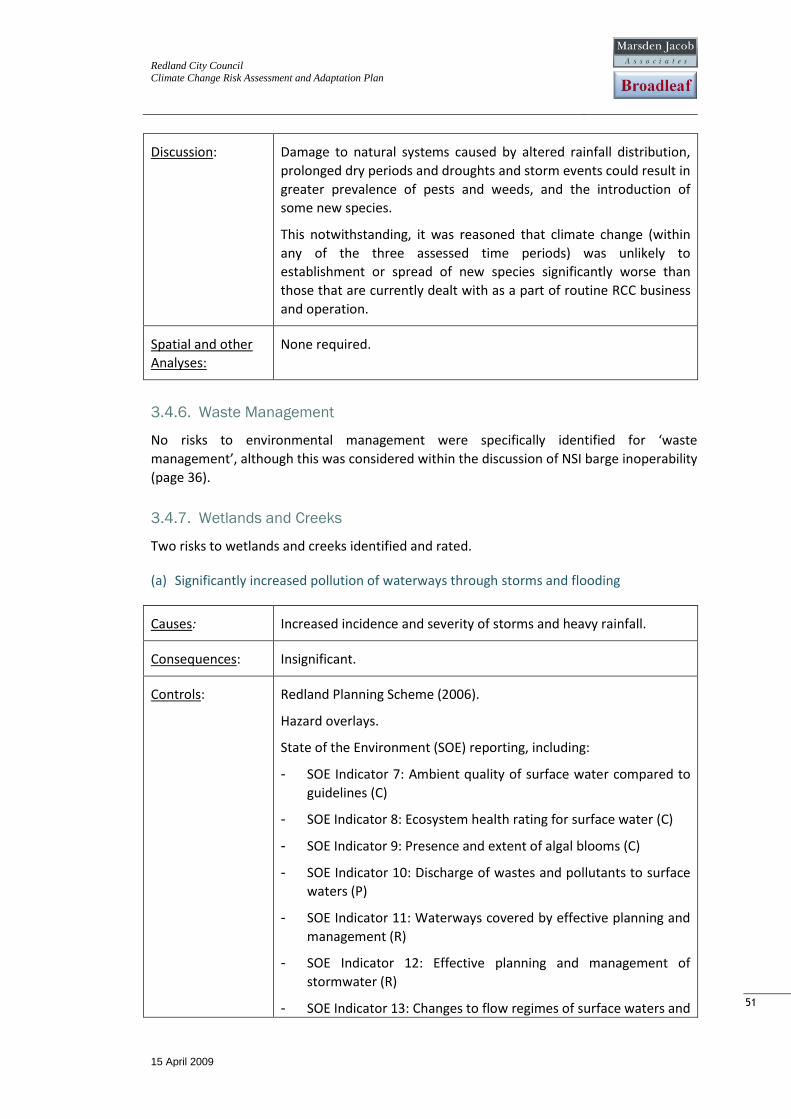
Redland City Council
Climate Change Risk Assessment and Adaptation Plan
15 April 2009
51
51
Discussion: Damage to natural systems caused by altered rainfall distribution,
prolonged dry periods and droughts and storm events could result in
greater prevalence of pests and weeds, and the introduction of
some new species.
This notwithstanding, it was reasoned that climate change (within
any of the three assessed time periods) was unlikely to
establishment or spread of new species significantly worse than
those that are currently dealt with as a part of routine RCC business
and operation.
Spatial and other
Analyses: None required.
3.4.6. Waste Management
No risks to environmental management were specifically identified for ‘waste
management’, although this was considered within the discussion of NSI barge inoperability
(page 36).
3.4.7. Wetlands and Creeks
Two risks to wetlands and creeks identified and rated.
(a) Significantly increased pollution of waterways through storms and flooding
Causes: Increased incidence and severity of storms and heavy rainfall.
Consequences: Insignificant.
Controls: Redland Planning Scheme (2006).
Hazard overlays.
State of the Environment (SOE) reporting, including:
- SOE Indicator 7: Ambient quality of surface water compared to
guidelines (C)
- SOE Indicator 8: Ecosystem health rating for surface water (C)
- SOE Indicator 9: Presence and extent of algal blooms (C)
- SOE Indicator 10: Discharge of wastes and pollutants to surface
waters (P)
- SOE Indicator 11: Waterways covered by effective planning and
management (R)
- SOE Indicator 12: Effective planning and management of
stormwater (R)
- SOE Indicator 13: Changes to flow regimes of surface waters and
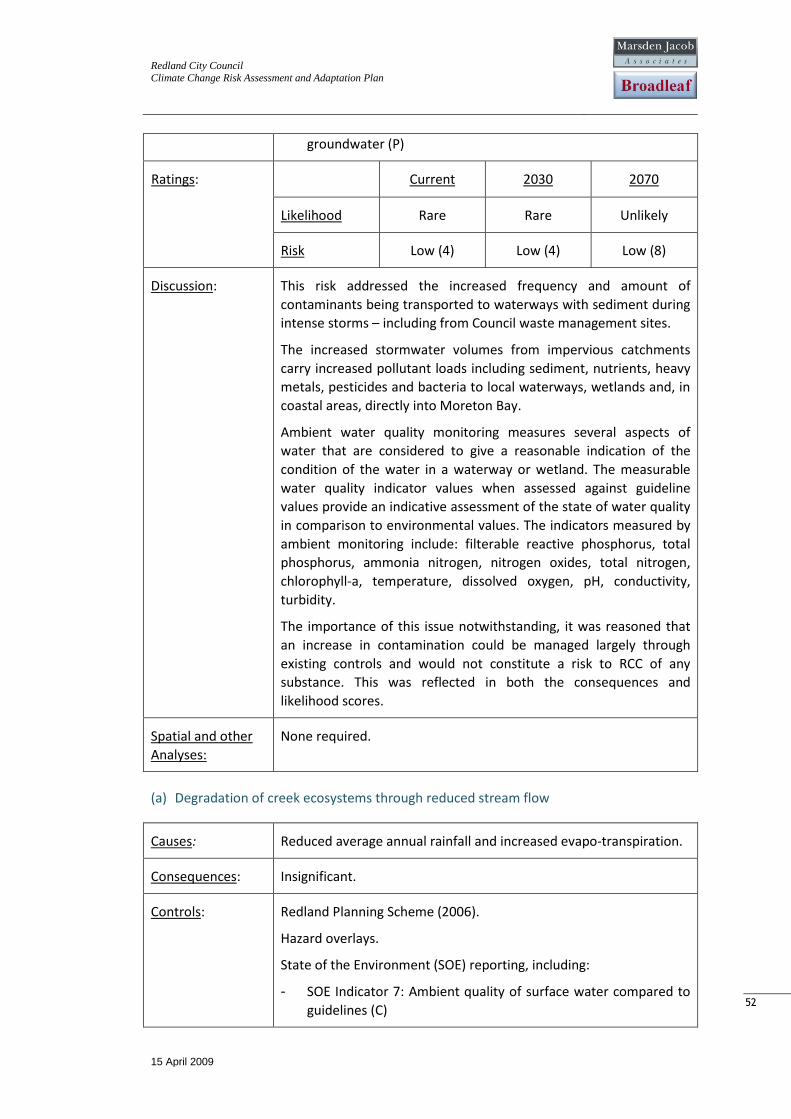
Redland City Council
Climate Change Risk Assessment and Adaptation Plan
15 April 2009
52
52
groundwater (P)
Ratings: Current 2030 2070
Likelihood Rare Rare Unlikely
Risk Low (4) Low (4) Low (8)
Discussion: This risk addressed the increased frequency and amount of
contaminants being transported to waterways with sediment during
intense storms – including from Council waste management sites.
The increased stormwater volumes from impervious catchments
carry increased pollutant loads including sediment, nutrients, heavy
metals, pesticides and bacteria to local waterways, wetlands and, in
coastal areas, directly into Moreton Bay.
Ambient water quality monitoring measures several aspects of
water that are considered to give a reasonable indication of the
condition of the water in a waterway or wetland. The measurable
water quality indicator values when assessed against guideline
values provide an indicative assessment of the state of water quality
in comparison to environmental values. The indicators measured by
ambient monitoring include: filterable reactive phosphorus, total
phosphorus, ammonia nitrogen, nitrogen oxides, total nitrogen,
chlorophyll-a, temperature, dissolved oxygen, pH, conductivity,
turbidity.
The importance of this issue notwithstanding, it was reasoned that
an increase in contamination could be managed largely through
existing controls and would not constitute a risk to RCC of any
substance. This was reflected in both the consequences and
likelihood scores.
Spatial and other
Analyses: None required.
(a) Degradation of creek ecosystems through reduced stream flow
Causes: Reduced average annual rainfall and increased evapo-transpiration.
Consequences: Insignificant.
Controls: Redland Planning Scheme (2006).
Hazard overlays.
State of the Environment (SOE) reporting, including:
- SOE Indicator 7: Ambient quality of surface water compared to
guidelines (C)
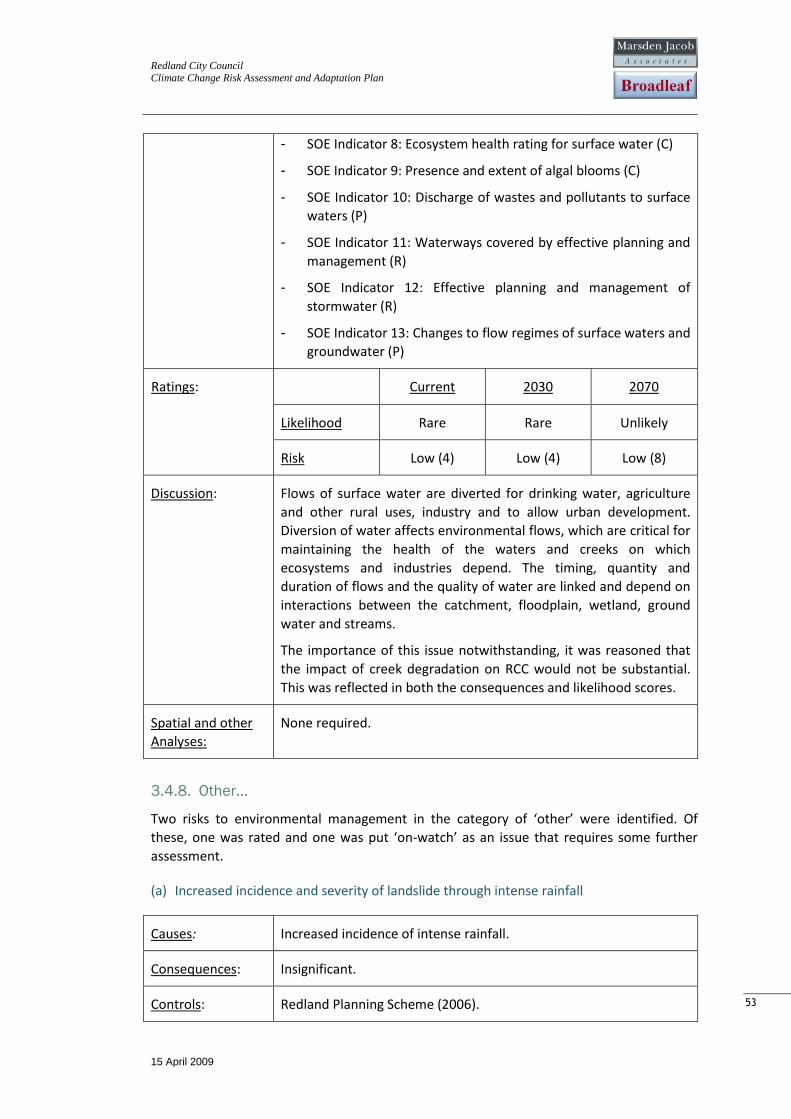
Redland City Council
Climate Change Risk Assessment and Adaptation Plan
15 April 2009
53
53
- SOE Indicator 8: Ecosystem health rating for surface water (C)
- SOE Indicator 9: Presence and extent of algal blooms (C)
- SOE Indicator 10: Discharge of wastes and pollutants to surface
waters (P)
- SOE Indicator 11: Waterways covered by effective planning and
management (R)
- SOE Indicator 12: Effective planning and management of
stormwater (R)
- SOE Indicator 13: Changes to flow regimes of surface waters and
groundwater (P)
Ratings: Current 2030 2070
Likelihood Rare Rare Unlikely
Risk Low (4) Low (4) Low (8)
Discussion: Flows of surface water are diverted for drinking water, agriculture
and other rural uses, industry and to allow urban development.
Diversion of water affects environmental flows, which are critical for
maintaining the health of the waters and creeks on which
ecosystems and industries depend. The timing, quantity and
duration of flows and the quality of water are linked and depend on
interactions between the catchment, floodplain, wetland, ground
water and streams.
The importance of this issue notwithstanding, it was reasoned that
the impact of creek degradation on RCC would not be substantial.
This was reflected in both the consequences and likelihood scores.
Spatial and other
Analyses: None required.
3.4.8. Other...
Two risks to environmental management in the category of ‘other’ were identified. Of
these, one was rated and one was put ‘on-watch’ as an issue that requires some further
assessment.
(a) Increased incidence and severity of landslide through intense rainfall
Causes: Increased incidence of intense rainfall.
Consequences: Insignificant.
Controls: Redland Planning Scheme (2006).
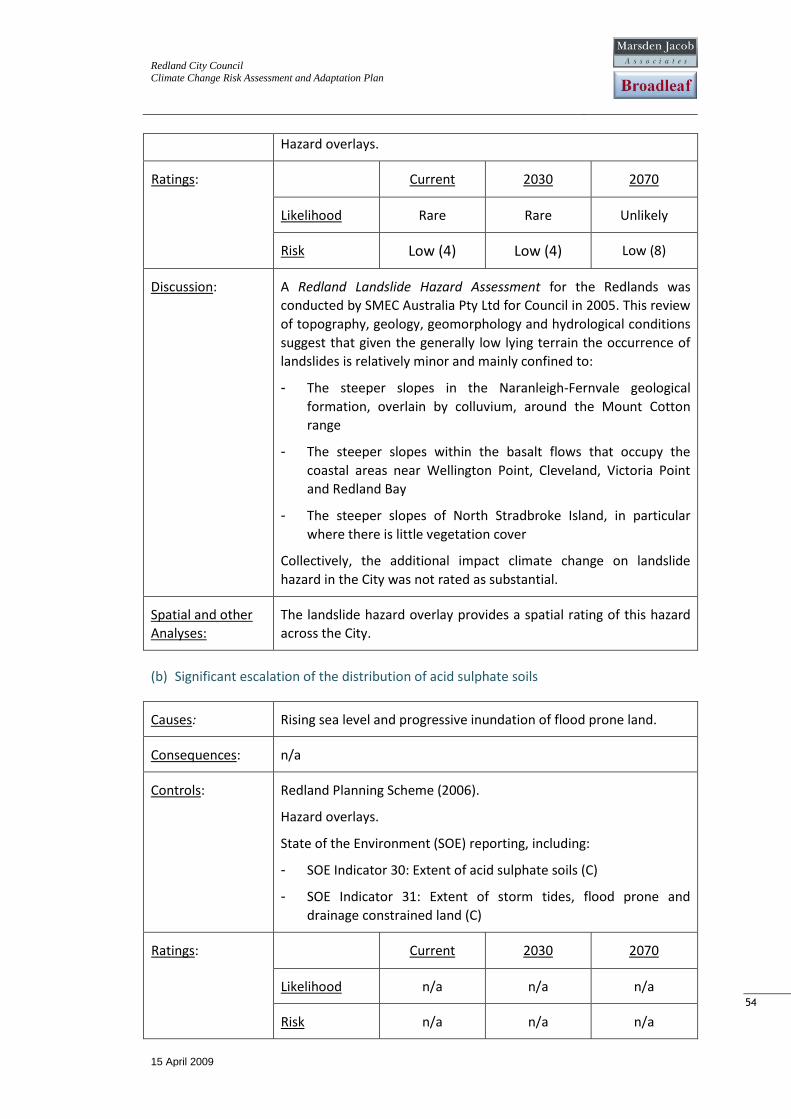
Redland City Council
Climate Change Risk Assessment and Adaptation Plan
15 April 2009
54
54
Hazard overlays.
Ratings: Current 2030 2070
Likelihood Rare Rare Unlikely
Risk Low (4) Low (4) Low (8)
Discussion: A Redland Landslide Hazard Assessment for the Redlands was
conducted by SMEC Australia Pty Ltd for Council in 2005. This review
of topography, geology, geomorphology and hydrological conditions
suggest that given the generally low lying terrain the occurrence of
landslides is relatively minor and mainly confined to:
- The steeper slopes in the Naranleigh-Fernvale geological
formation, overlain by colluvium, around the Mount Cotton
range
- The steeper slopes within the basalt flows that occupy the
coastal areas near Wellington Point, Cleveland, Victoria Point
and Redland Bay
- The steeper slopes of North Stradbroke Island, in particular
where there is little vegetation cover
Collectively, the additional impact climate change on landslide
hazard in the City was not rated as substantial.
Spatial and other
Analyses: The landslide hazard overlay provides a spatial rating of this hazard
across the City.
(b) Significant escalation of the distribution of acid sulphate soils
Causes: Rising sea level and progressive inundation of flood prone land.
Consequences: n/a
Controls: Redland Planning Scheme (2006).
Hazard overlays.
State of the Environment (SOE) reporting, including:
- SOE Indicator 30: Extent of acid sulphate soils (C)
- SOE Indicator 31: Extent of storm tides, flood prone and
drainage constrained land (C)
Ratings: Current 2030 2070
Likelihood n/a n/a n/a
Risk n/a n/a n/a
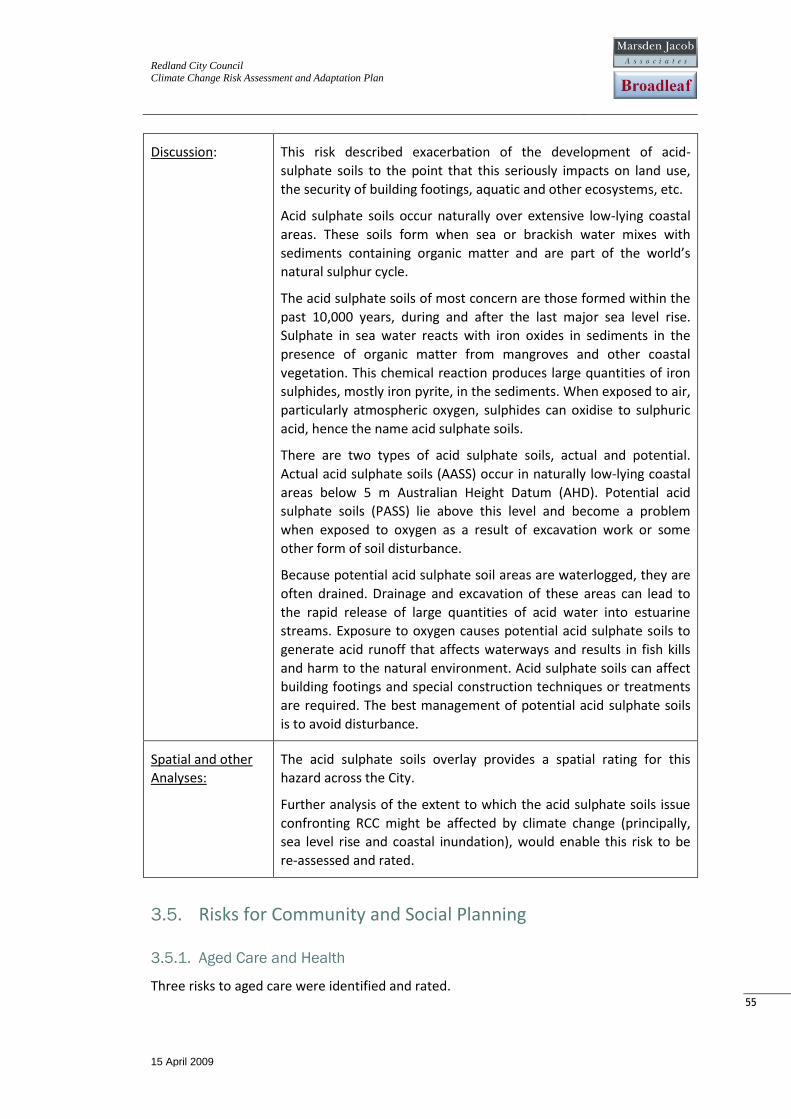
Redland City Council
Climate Change Risk Assessment and Adaptation Plan
15 April 2009
55
55
Discussion: This risk described exacerbation of the development of acid-
sulphate soils to the point that this seriously impacts on land use,
the security of building footings, aquatic and other ecosystems, etc.
Acid sulphate soils occur naturally over extensive low-lying coastal
areas. These soils form when sea or brackish water mixes with
sediments containing organic matter and are part of the world’s
natural sulphur cycle.
The acid sulphate soils of most concern are those formed within the
past 10,000 years, during and after the last major sea level rise.
Sulphate in sea water reacts with iron oxides in sediments in the
presence of organic matter from mangroves and other coastal
vegetation. This chemical reaction produces large quantities of iron
sulphides, mostly iron pyrite, in the sediments. When exposed to air,
particularly atmospheric oxygen, sulphides can oxidise to sulphuric
acid, hence the name acid sulphate soils.
There are two types of acid sulphate soils, actual and potential.
Actual acid sulphate soils (AASS) occur in naturally low-lying coastal
areas below 5 m Australian Height Datum (AHD). Potential acid
sulphate soils (PASS) lie above this level and become a problem
when exposed to oxygen as a result of excavation work or some
other form of soil disturbance.
Because potential acid sulphate soil areas are waterlogged, they are
often drained. Drainage and excavation of these areas can lead to
the rapid release of large quantities of acid water into estuarine
streams. Exposure to oxygen causes potential acid sulphate soils to
generate acid runoff that affects waterways and results in fish kills
and harm to the natural environment. Acid sulphate soils can affect
building footings and special construction techniques or treatments
are required. The best management of potential acid sulphate soils
is to avoid disturbance.
Spatial and other
Analyses: The acid sulphate soils overlay provides a spatial rating for this
hazard across the City.
Further analysis of the extent to which the acid sulphate soils issue
confronting RCC might be affected by climate change (principally,
sea level rise and coastal inundation), would enable this risk to be
re-assessed and rated.
3.5. Risks for Community and Social Planning
3.5.1. Aged Care and Health
Three risks to aged care were identified and rated.
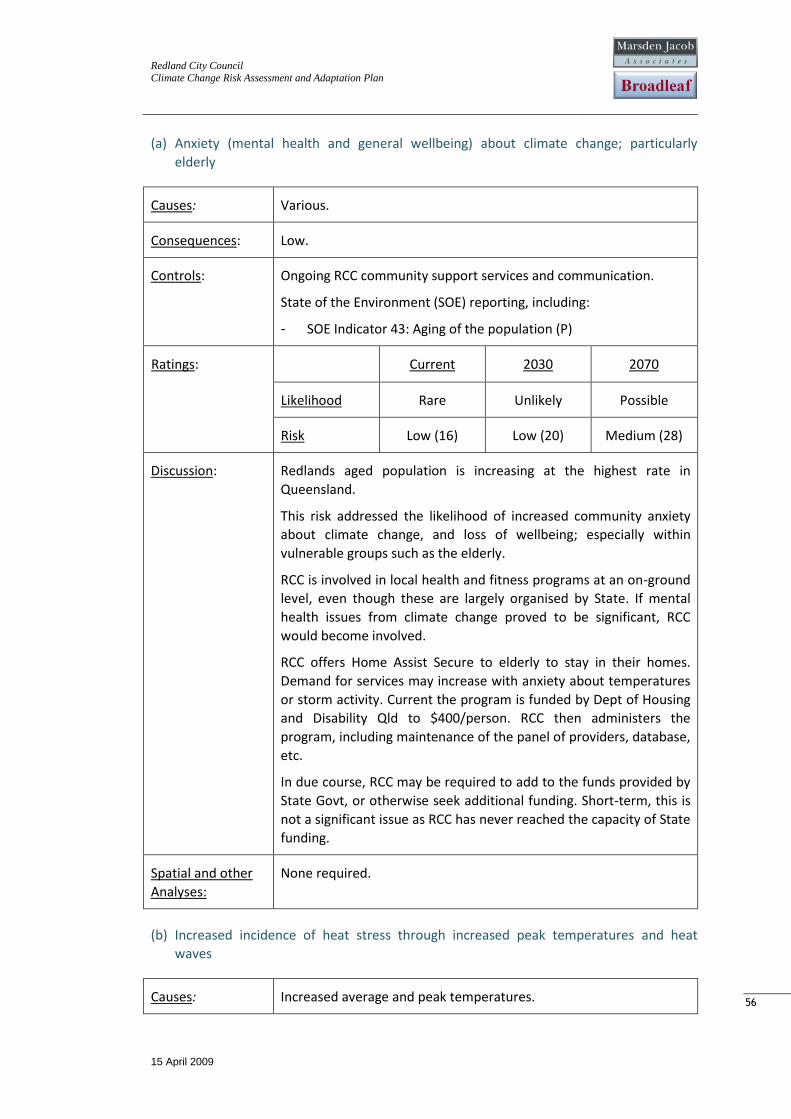
Redland City Council
Climate Change Risk Assessment and Adaptation Plan
15 April 2009
56
56
(a) Anxiety (mental health and general wellbeing) about climate change; particularly
elderly
Causes: Various.
Consequences: Low.
Controls: Ongoing RCC community support services and communication.
State of the Environment (SOE) reporting, including:
- SOE Indicator 43: Aging of the population (P)
Ratings: Current 2030 2070
Likelihood Rare Unlikely Possible
Risk Low (16) Low (20) Medium (28)
Discussion: Redlands aged population is increasing at the highest rate in
Queensland.
This risk addressed the likelihood of increased community anxiety
about climate change, and loss of wellbeing; especially within
vulnerable groups such as the elderly.
RCC is involved in local health and fitness programs at an on-ground
level, even though these are largely organised by State. If mental
health issues from climate change proved to be significant, RCC
would become involved.
RCC offers Home Assist Secure to elderly to stay in their homes.
Demand for services may increase with anxiety about temperatures
or storm activity. Current the program is funded by Dept of Housing
and Disability Qld to $400/person. RCC then administers the
program, including maintenance of the panel of providers, database,
etc.
In due course, RCC may be required to add to the funds provided by
State Govt, or otherwise seek additional funding. Short-term, this is
not a significant issue as RCC has never reached the capacity of State
funding.
Spatial and other
Analyses: None required.
(b) Increased incidence of heat stress through increased peak temperatures and heat
waves
Causes: Increased average and peak temperatures.
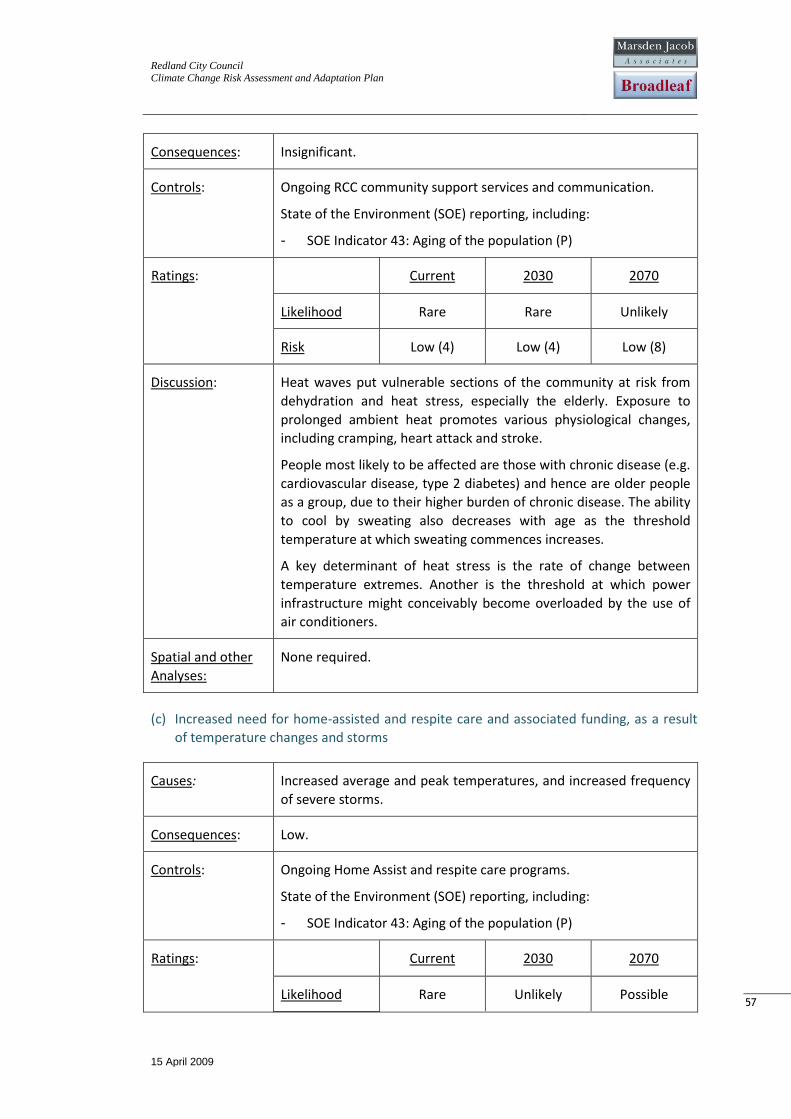
Redland City Council
Climate Change Risk Assessment and Adaptation Plan
15 April 2009
57
57
Consequences: Insignificant.
Controls: Ongoing RCC community support services and communication.
State of the Environment (SOE) reporting, including:
- SOE Indicator 43: Aging of the population (P)
Ratings: Current 2030 2070
Likelihood Rare Rare Unlikely
Risk Low (4) Low (4) Low (8)
Discussion: Heat waves put vulnerable sections of the community at risk from
dehydration and heat stress, especially the elderly. Exposure to
prolonged ambient heat promotes various physiological changes,
including cramping, heart attack and stroke.
People most likely to be affected are those with chronic disease (e.g.
cardiovascular disease, type 2 diabetes) and hence are older people
as a group, due to their higher burden of chronic disease. The ability
to cool by sweating also decreases with age as the threshold
temperature at which sweating commences increases.
A key determinant of heat stress is the rate of change between
temperature extremes. Another is the threshold at which power
infrastructure might conceivably become overloaded by the use of
air conditioners.
Spatial and other
Analyses: None required.
(c) Increased need for home-assisted and respite care and associated funding, as a result
of temperature changes and storms
Causes: Increased average and peak temperatures, and increased frequency
of severe storms.
Consequences: Low.
Controls: Ongoing Home Assist and respite care programs.
State of the Environment (SOE) reporting, including:
- SOE Indicator 43: Aging of the population (P)
Ratings: Current 2030 2070
Likelihood Rare Unlikely Possible
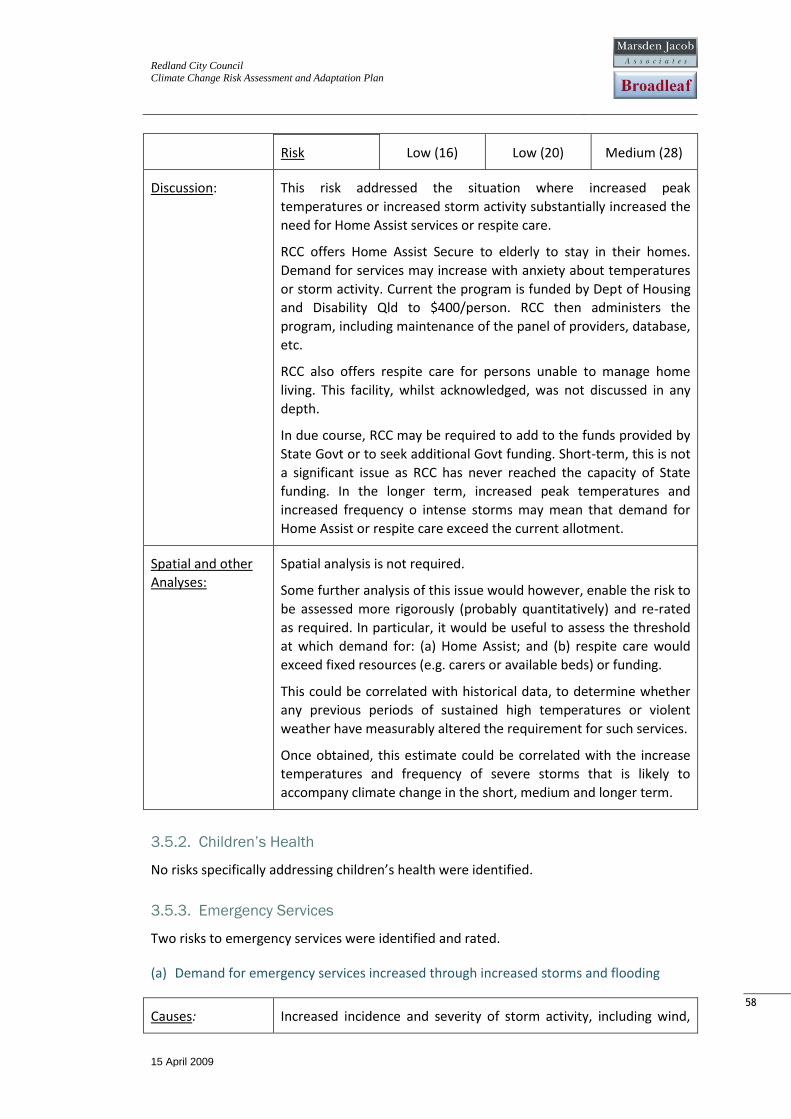
Redland City Council
Climate Change Risk Assessment and Adaptation Plan
15 April 2009
58
58
Risk Low (16) Low (20) Medium (28)
Discussion: This risk addressed the situation where increased peak
temperatures or increased storm activity substantially increased the
need for Home Assist services or respite care.
RCC offers Home Assist Secure to elderly to stay in their homes.
Demand for services may increase with anxiety about temperatures
or storm activity. Current the program is funded by Dept of Housing
and Disability Qld to $400/person. RCC then administers the
program, including maintenance of the panel of providers, database,
etc.
RCC also offers respite care for persons unable to manage home
living. This facility, whilst acknowledged, was not discussed in any
depth.
In due course, RCC may be required to add to the funds provided by
State Govt or to seek additional Govt funding. Short-term, this is not
a significant issue as RCC has never reached the capacity of State
funding. In the longer term, increased peak temperatures and
increased frequency o intense storms may mean that demand for
Home Assist or respite care exceed the current allotment.
Spatial and other
Analyses: Spatial analysis is not required.
Some further analysis of this issue would however, enable the risk to
be assessed more rigorously (probably quantitatively) and re-rated
as required. In particular, it would be useful to assess the threshold
at which demand for: (a) Home Assist; and (b) respite care would
exceed fixed resources (e.g. carers or available beds) or funding.
This could be correlated with historical data, to determine whether
any previous periods of sustained high temperatures or violent
weather have measurably altered the requirement for such services.
Once obtained, this estimate could be correlated with the increase
temperatures and frequency of severe storms that is likely to
accompany climate change in the short, medium and longer term.
3.5.2. Children’s Health
No risks specifically addressing children’s health were identified.
3.5.3. Emergency Services
Two risks to emergency services were identified and rated.
(a) Demand for emergency services increased through increased storms and flooding
Causes: Increased incidence and severity of storm activity, including wind,
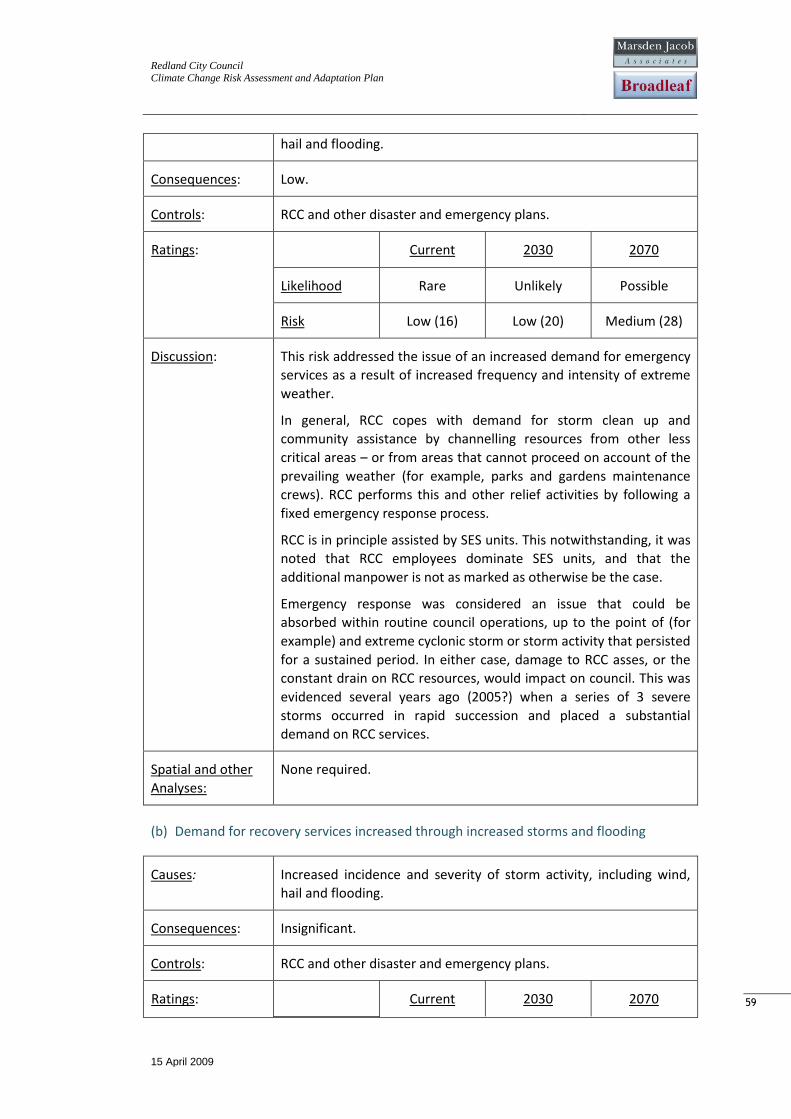
Redland City Council
Climate Change Risk Assessment and Adaptation Plan
15 April 2009
59
59
hail and flooding.
Consequences: Low.
Controls: RCC and other disaster and emergency plans.
Ratings: Current 2030 2070
Likelihood Rare Unlikely Possible
Risk Low (16) Low (20) Medium (28)
Discussion: This risk addressed the issue of an increased demand for emergency
services as a result of increased frequency and intensity of extreme
weather.
In general, RCC copes with demand for storm clean up and
community assistance by channelling resources from other less
critical areas – or from areas that cannot proceed on account of the
prevailing weather (for example, parks and gardens maintenance
crews). RCC performs this and other relief activities by following a
fixed emergency response process.
RCC is in principle assisted by SES units. This notwithstanding, it was
noted that RCC employees dominate SES units, and that the
additional manpower is not as marked as otherwise be the case.
Emergency response was considered an issue that could be
absorbed within routine council operations, up to the point of (for
example) and extreme cyclonic storm or storm activity that persisted
for a sustained period. In either case, damage to RCC asses, or the
constant drain on RCC resources, would impact on council. This was
evidenced several years ago (2005?) when a series of 3 severe
storms occurred in rapid succession and placed a substantial
demand on RCC services.
Spatial and other
Analyses: None required.
(b) Demand for recovery services increased through increased storms and flooding
Causes: Increased incidence and severity of storm activity, including wind,
hail and flooding.
Consequences: Insignificant.
Controls: RCC and other disaster and emergency plans.
Ratings: Current 2030 2070
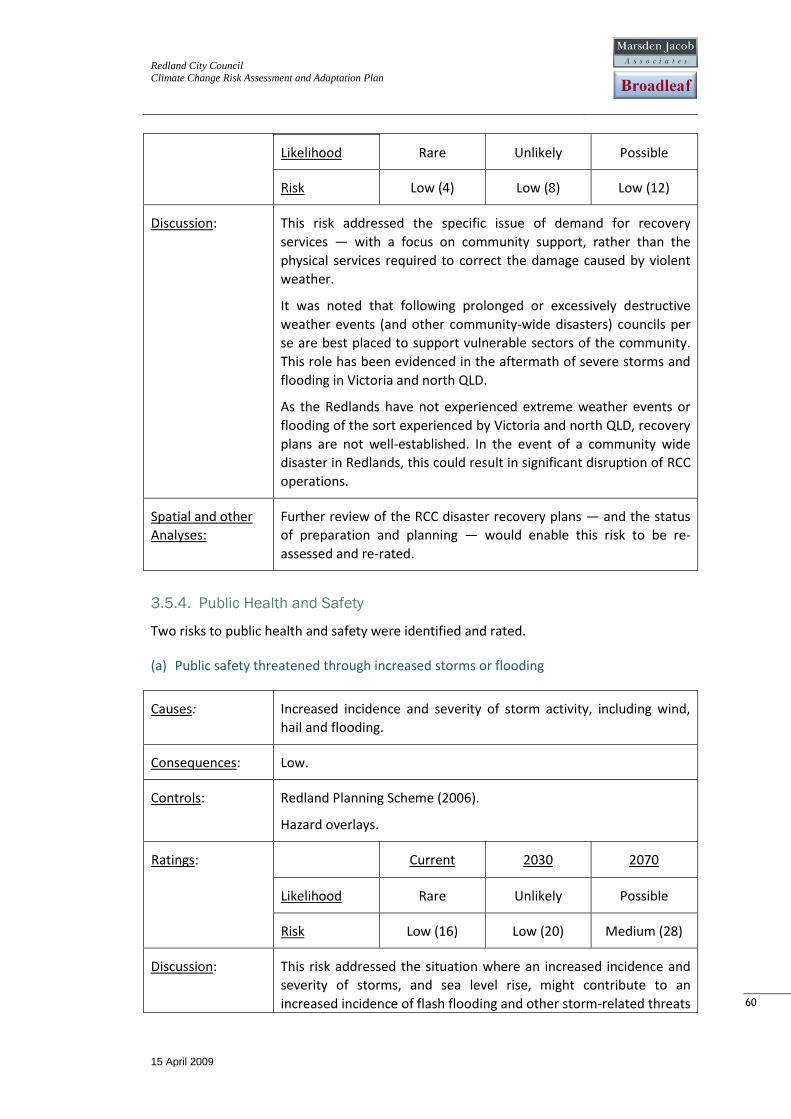
Redland City Council
Climate Change Risk Assessment and Adaptation Plan
15 April 2009
60
60
Likelihood Rare Unlikely Possible
Risk Low (4) Low (8) Low (12)
Discussion: This risk addressed the specific issue of demand for recovery
services — with a focus on community support, rather than the
physical services required to correct the damage caused by violent
weather.
It was noted that following prolonged or excessively destructive
weather events (and other community-wide disasters) councils per
se are best placed to support vulnerable sectors of the community.
This role has been evidenced in the aftermath of severe storms and
flooding in Victoria and north QLD.
As the Redlands have not experienced extreme weather events or
flooding of the sort experienced by Victoria and north QLD, recovery
plans are not well-established. In the event of a community wide
disaster in Redlands, this could result in significant disruption of RCC
operations.
Spatial and other
Analyses: Further review of the RCC disaster recovery plans — and the status
of preparation and planning — would enable this risk to be re-
assessed and re-rated.
3.5.4. Public Health and Safety
Two risks to public health and safety were identified and rated.
(a) Public safety threatened through increased storms or flooding
Causes: Increased incidence and severity of storm activity, including wind,
hail and flooding.
Consequences: Low.
Controls: Redland Planning Scheme (2006).
Hazard overlays.
Ratings: Current 2030 2070
Likelihood Rare Unlikely Possible
Risk Low (16) Low (20) Medium (28)
Discussion: This risk addressed the situation where an increased incidence and
severity of storms, and sea level rise, might contribute to an
increased incidence of flash flooding and other storm-related threats
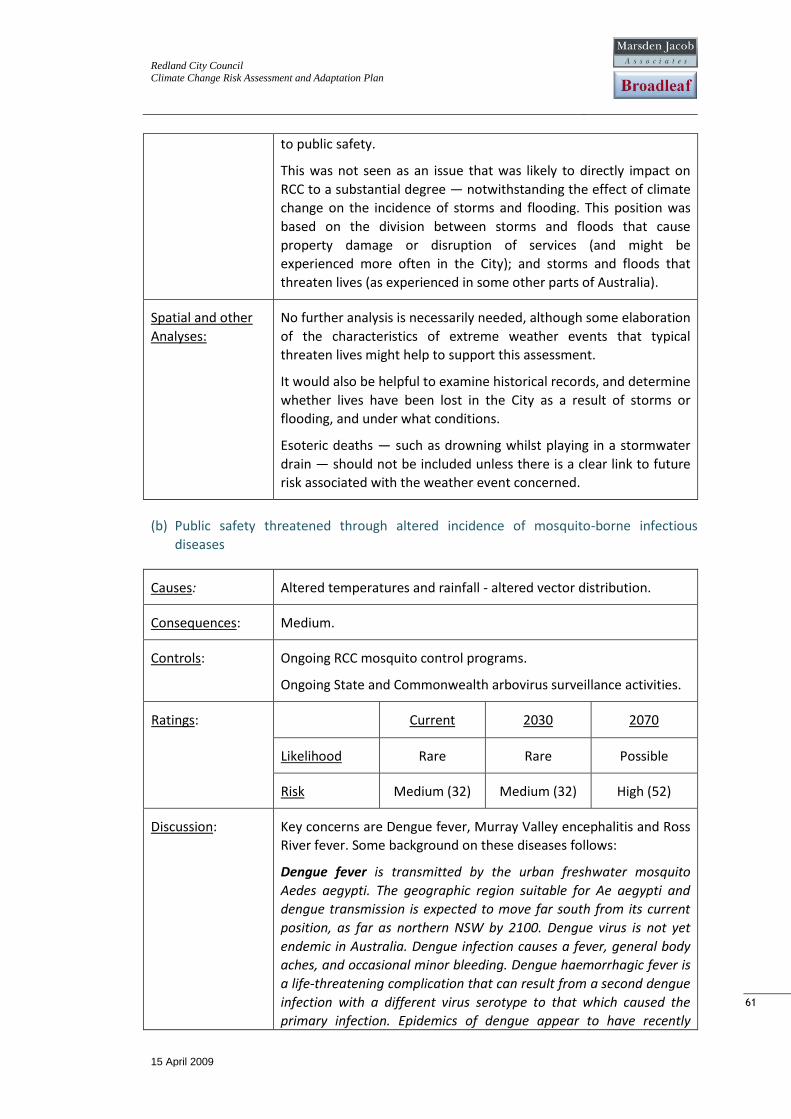
Redland City Council
Climate Change Risk Assessment and Adaptation Plan
15 April 2009
61
61
to public safety.
This was not seen as an issue that was likely to directly impact on
RCC to a substantial degree — notwithstanding the effect of climate
change on the incidence of storms and flooding. This position was
based on the division between storms and floods that cause
property damage or disruption of services (and might be
experienced more often in the City); and storms and floods that
threaten lives (as experienced in some other parts of Australia).
Spatial and other
Analyses: No further analysis is necessarily needed, although some elaboration
of the characteristics of extreme weather events that typical
threaten lives might help to support this assessment.
It would also be helpful to examine historical records, and determine
whether lives have been lost in the City as a result of storms or
flooding, and under what conditions.
Esoteric deaths — such as drowning whilst playing in a stormwater
drain — should not be included unless there is a clear link to future
risk associated with the weather event concerned.
(b) Public safety threatened through altered incidence of mosquito-borne infectious
diseases
Causes: Altered temperatures and rainfall - altered vector distribution.
Consequences: Medium.
Controls: Ongoing RCC mosquito control programs.
Ongoing State and Commonwealth arbovirus surveillance activities.
Ratings: Current 2030 2070
Likelihood Rare Rare Possible
Risk Medium (32) Medium (32) High (52)
Discussion: Key concerns are Dengue fever, Murray Valley encephalitis and Ross
River fever. Some background on these diseases follows:
Dengue fever is transmitted by the urban freshwater mosquito
Aedes aegypti. The geographic region suitable for Ae aegypti and
dengue transmission is expected to move far south from its current
position, as far as northern NSW by 2100. Dengue virus is not yet
endemic in Australia. Dengue infection causes a fever, general body
aches, and occasional minor bleeding. Dengue haemorrhagic fever is
a life-threatening complication that can result from a second dengue
infection with a different virus serotype to that which caused the
primary infection. Epidemics of dengue appear to have recently
Redland City Council
Climate Change Risk Assessment and Adaptation Plan
15 April 2009
62
62
become more regular in north Queensland, with 5 major epidemics
and many smaller epidemics between 1992 and 2004. Distribution of
Ae. aegypti is not the only concern. The ‘Asian tiger’ mosquito (Ae.
albopictus) has been observed in far northern Australia. This
mosquito is more cold tolerant than Ae. Aegypti, and if it becomes
established it could be a more efficient vector in southern temperate
regions.
Ross River virus (RRv) is an arbovirus that is widely distributed
throughout Australia. It has also been reported in many Pacific island
countries including Papua New Guinea, the Solomon Islands,
American Samoa, Fiji, New Caledonia and the Cook Islands. The virus
can cause epidemic polyarthritis, which consists of arthritic
symptoms that persist for several months and can be severe and
debilitating. In some people the disease has been reported to linger
for years. Rising temperatures and changing rainfall patterns are
likely to have significant impacts on the epidemiology of RRv disease.
These impacts would vary by geographical area.
Murray Valley encephalitis is a uniquely Australian pathogen,
although closely related to West Nile virus. In nature, MVE virus
survives in natural cycles involving birds (especially water birds) and
some species of mosquito. Murray Valley encephalitis (MVE) virus
occurs naturally throughout the northern half of Australia, Papua
New Guinea and eastern Indonesia. MVEV can commonly infect
humans without producing apparent disease (subclinical infection),
or it may cause a comparatively mild disease with features such as
fever, headache, nausea and vomiting. In a small percentage of all
people infected, mild disease may be a prequel to disease
progression and involvement of the central nervous system, causing
meningitis, or in the worst scenario, encephalitis of variable severity.
The primary mosquito vector during epidemics is Cx. annulirostris.
Other mosquitoes such as Cx. australicus and some Ochlerotatus
species may be involved in other aspects of MVEV ecology.
RCC has a Ross River virus cluster in Reedy Bay. This is quite a small
cluster by state standards, but a significant issue for the local
community.
RCC spends approximately $700,000/year on the control of
mosquitoes. The concern is that with an increase in summer rainfall,
mosquito populations will also increase. The added concern is that
sea level rise and the inundation of higher mudflats will result in
increased mosquito habitat and further increase in populations.
With current king tides, the cost of control increases by
approximately $100,000. Under expanded habitat scenario, this
might increase to $200-300,000 or beyond.
The movement of Dengue fever to SE QLD would necessitate a
completely different form of control activity. Dengue fever control is
focussed on urban populations, with small teams assisting the
Redland City Council
Climate Change Risk Assessment and Adaptation Plan
15 April 2009
63
63
community to minimise standing water. The cost of these measures
to RCC is difficult to determine, as some funding or resources would
be provided by the State government.
Spatial and other
Analyses: Further spatial and other desktop analysis of this issue would be
helpful.
In particular, spatial data for mosquito populations could be
correlated with waterways, regional ecosystems and storm tide and
flooding overlays to determine the extent to which mosquito habitat
is likely to alter under each of the three temporal scenarios. It would
also be helpful to obtain the costs to council and state associated
with dengue fever control in affected parts of northern Australia.
These desktop assessments would help to better understand the
collective consequences to RCC for altered disease and mosquito
distribution and density. At this more detailed level, however, the
issues would be better separated with individual assessments for
expanding mosquito distributions (further divided by species, as
relevant), and for each of the three arbovirus diseases.
(c) Harm to lifestyle and general wellbeing as a result of altered midge or mosquito
distribution and density
Causes: Altered temperatures and rainfall - altered vector distribution.
Consequences: Low.
Controls: Ongoing RCC mosquito control programs.
Ratings: Current 2030 2070
Likelihood Rare Unlikely Possible
Risk Low (16) Low (20) Medium (28)
Discussion: This risk addressed the issue of the effect of an increased mosquito
and midge density on lifestyle within the City, and the impact of this
on RCC.
There is no doubt that increased mosquito and midge populations
could seriously impact on the outdoor lifestyle enjoyed by many
(most) Shire residents. There could also be an impact on tourism.
The consequences of this to RCC would be focussed largely on the
increased cost of mosquito control. It was explained above that With
current king tides, the cost of control increases by approximately
$100,000. Under expanded habitat scenario, this might increase to
$200-300,000 or beyond.
Spatial and other Further spatial and other desktop analysis of this issue would be
Redland City Council
Climate Change Risk Assessment and Adaptation Plan
15 April 2009
64
64
Analyses: helpful.
In particular, spatial data for mosquito populations could be
correlated with waterways, regional ecosystems and storm tide and
flooding overlays to determine the extent to which mosquito habitat
is likely to alter under each of the three temporal scenarios.
These desktop assessments would help to better understand the
collective consequences to RCC associated with altered mosquito
distribution and density.
At this more detailed level, however, the issues would be better
separated with individual assessments for each of the major species
of mosquito or midge. These assessments would include spatial
correlations (as above) but would also include consideration of the
relative impact of each species on lifestyle, and the costs and
logistics of control.
3.5.5. Recreation Services
Two risks to recreation services were identified and rated.
(a) Sporting or recreational areas threatened through lack of water
Causes: Reduced average rainfall or drought, raised average and peak
temperatures and increased evapo-transpiration.
Consequences: Low.
Controls: Redland Planning Scheme (2006).
Ongoing scheduled maintenance.
RWW and RCC water management plans and policies.
Ongoing research into drought-tolerant turf species.
Ratings: Current 2030 2070
Likelihood Possible Possible Possible
Risk Medium (28) Medium (28) Medium (28)
Discussion: RCC holds responsibilities for most of the sporting facilities within
the City — any impacts of climate change on these facilities will
translate to a direct impact on RCC. In total, the value of these
facilities is approximately $64million.
Workshop participants were divided as to the impact of climate
change on sporting facilities. One group noted that RCC facilities
remained healthy on balance throughout the recent drought, and
are generally considered some of the greenest and best maintained
Redland City Council
Climate Change Risk Assessment and Adaptation Plan
15 April 2009
65
65
in SE QLD. Another group noted the imminent changes to RWW
arrangements and water policy, and the ramifications this is likely to
have as regards water restrictions within the City.
Spatial and other
Analyses: No spatial analysis is required.
Some further communication with RCC and minor desktop
assessment would however be helpful in clarifying whether the
exposure of RCC sporting facilities is likely to increase as a result of
new water policies, and what this might mean to RCC in the light of
more frequent droughts and dry periods and increased evapo-
transpiration.
(b) Recreation areas threatened by coastal inundation
Causes: Rising sea level and coastal inundation.
Consequences: Low.
Controls: Redland Planning Scheme (2006).
Ongoing scheduled maintenance.
Ratings: Current 2030 2070
Likelihood Rare Unlikely Possible
Risk Low (16) Low (20) Medium (28)
Discussion: This risk specifically addressed the issue of progressive inundation of
coastal recreation areas, and the impact this might have on RCC. The
buffer action of coastal open space — and its importance from a
biodiversity standpoint — have been (pages 44 and 48, respectively).
Coastal inundation and storm tides were reasoned to have a slower
and lesser impact on the integrity of coastal recreation areas as
places for recreation, than they would have on the biodiversity of
such places or their importance as buffers. This is because salt-
tolerant grasses and other plants tend to have been planted (or
otherwise grow on) such areas, and because their tolerance to
sporadic inundation is much higher than the tolerance (or particular
needs) nesting shore birds and the like.
Spatial and other
Analyses: Spatial assessment would help to clarify this risk – in brief:
- Obtain a spatial overlay of coastal open space in the City. The
Redlands Cadastre and zoning, as well as an elevation surface
for the Redlands Shire, have been provided.
- Obtain spatial data (hazard overlay) for storm tides, flooding
and coastal inundation. This will be embellished through GEMS
Redland City Council
Climate Change Risk Assessment and Adaptation Plan
15 April 2009
66
66
modelling.
- Correlate the location of coastal open space with storm tides
and flooding to determine the parts of the City where
encroachment is most likely to be substantial, and the
consequences to RCC of failing to consider maintaining this
open space as viable recreation asset as the coastal inundation
progresses.
3.6. Risks for Corporate Services
Two risks were identified for Corporate Services – both fell within the category of Legal and
Financial Services. The following additional risks associated with liability were raised in draft
form for workshop discussion, but ruled off the register:
- Council liability for damage through inappropriate building codes or standards
– Ruled out on account of the fact that such standards are set by within the
Building Code of Australia, and are not the legal responsibility of RCC.
- Council liability for damage through acid-sulphate subsidence of foundations
– Ruled out on account of the of the extensive spatial risk work that RCC have
undertaken on acid sulphate soils as a part of the (ongoing) Redlands Planning
Scheme.
(a) Council liability for property damage through bushfires
Causes: Increased incidence of extreme and high bushfire weather, and
reduced autumn and winter rainfall.
Consequences: Insignificant.
Controls: Redland Planning Scheme (2006).
Hazard overlays.
State of the Environment (SOE) reporting, including:
- SOE Indicator 29: Extent, location and number of bushfires (C)
Ratings: Current 2030 2070
Likelihood Rare Rare Rare
Risk Low (4) Low (4) Low (4)
Discussion: This risk describes legal liability that might arise as a result of the
permission of (or inadequate restrictions on) residential or
commercial developments in areas of high bushfire risk.
Spatial and other None required.
Redland City Council
Climate Change Risk Assessment and Adaptation Plan
15 April 2009
67
67
Analyses:
(b) Council liability for developments threatened by flooding or sea level rise
Causes: Sea level rise and coastal inundation.
Consequences: Major.
Controls: Redland Planning Scheme (2006).
Hazard overlays.
Ratings: Current 2030 2070
Likelihood Rare Rare Rare
Risk High (60) High (60) High (60)
Discussion: This risk addressed the issue of litigation arising from the harm to
approved developments (commercial or residential) as a result of
rising sea level or inundation. Corporate Services personnel
considered the likelihood of this event to be diminishingly small, but
the consequences either major or (in one senior opinion)
catastrophic. Concern was expressed as to the current lack of case
law on this important issue. Land buy-back would be the preferred
option, but the value of such land is likely to be subject to argument.
Spatial and other
Analyses: Two forms of follow-up assessment would be worthwhile to better
understand (and more definitively rate) this risk.
- Review of the existing case law and legal instruments
- Spatial assessment of the extent of possible exposure of coastal
developments at each of the three time periods
The review of case law and legal instruments is beyond or expertise,
and might well be an activity that RCC could carry out in-house.
The spatial assessment is discussed further – in brief:
- Obtain a spatial overlay of coastal developments within the City,
with attribute data that differentiates between residential and
commercial developments and notes the date of approval.
- Obtain spatial data (hazard overlay) for storm tides, flooding
and coastal inundation. This will be embellished through GEMS
modelling.
- Correlate the location of coastal developments with storm tides
and flooding to determine the developments where (at each
time horizon) inundation is most likely to be a concern, and the
date of approval and extent of exposure to litigation
Redland City Council
Climate Change Risk Assessment and Adaptation Plan
15 April 2009
68
68
4. Preliminary Spatial and Other Assessments
The purpose of this preliminary and essentially ‘qualitative’2 assessment of spatial and
other data is to investigate some of the key issues identified during the risk assessment
workshop, and to provide some context for more detailed follow-up work (section 5) that
Redlands may choose to undertake for key risks.
In general terms, spatial assessment can be used in two ways:
- To illustrate or analyse the magnitude and spatial distribution of an asset; and
- To illustrate or analyse the extent to which one or more spatially distributed stressors
(principally sea level or depth of inundation) is likely to impact on that asset.
The City of Redland is fortunate in having an extensive and highly developed library of
spatial data and existing spatial assessments (termed ‘hazard overlays’). This includes a fine
detail digital terrain model (DTM), which provides a 2m gridded representation of elevation
across the City. The spatial datasets are used principally to inform the (similarly developed)
Redland Planning Scheme, asset management and other core works and services. In
addition, Council has access to a range of Australian topographical and other baseline
datasets, as well as the Cardno Lawson Treloar (Cardno) storm tide modelling study for
Redland and Logan City Councils. This storm tide modelling study considered inundation
depth across the City, given 1:20, 1:50, 1:100, 1:1,000, and 1:10,000 year storm tides.
As a component of this climate change risk assessment and adaptation planning project, we
have reviewed the Cardno work and are in the process of developing revised storm surge
datasets for similar storm and flood return intervals. These revised datasets include
adjustment for: (a) the more conservative assumptions upon which our model is based; and
(b) the likely effect of climate change on sea level in 2030, 2070 and 2100. The revised
datasets will have one of two broad implications in relation to estimates of coastal
inundation discussed in the following sections:
- The extent of land subject to inundation and the depth of inundation is likely to
significantly greater than indicated; or
- The return interval for land currently subject to storm tide inundation is likely to be
significantly lower than indicated. For example, land currently subject to 1:100 storm
tide inundation will be subject to more frequent inundation under revised estimates.
The revised datasets will be important if further quantitative spatial assessment is to be
carried out (section 5). For this preliminary qualitative work, however, the Cardno storm
surge modelling data will provide an adequate point of reference. Specifically, the dataset
we have used to guide inference about spatial exposure of Council assets to inundation is
the 1:100 year storm tide inundation depth, with adjustment for enhanced cyclonic
intensity and frequency. This file can be identified in the Cardno dataset as:
RCC-Storm Tide Depth_100Y_GH.TAB
2 We stress that whilst numbers are cited throughout this section, the intent is to communicate general trends
and patterns — that is, the assessment is intended to be essentially qualitative.
Redland City Council
Climate Change Risk Assessment and Adaptation Plan
15 April 2009
69
69
We note that Cardno also provide a ‘Planning’ dataset for all ARIs and years, which includes
the 0.3m freeboard, which is currently being used by Redlands for planning purposes.
A screen shot of the ‘RCC-Storm Tide Depth_100Y_GH’ dataset is given in Figure 5. The
dataset was provided as a thematic raster layer. This thematic layer used 0.25m increments
to grade inundation depth, with colours ranging from dark blue (least inundation) to dark
orange or red (maximum inundation), as shown in Figure 5.
We extracted the inundation depth data from this raster layer, and inserted it into a
25mx25m grid file that could then be queried by MapInfo GIS. A screen shot of this grid
layer is shown in the lower insert on Figure 5. Grids are helpful, as their area has meaning
and their borders support a range of intuitive GIS queries. For example, it is a simple
enough exercise to select all grids representing an inundation depth of 1.5 to 2m that
intersect with a spatial object representing a foreshore reserve. The total area of the
selected grids will the approximate the area of the reserve that is likely to be inundated to a
depth of 1.5 to 2m. Much of this section of the report has been constructed from simple
spatial queries of this sort.
Inundation depth categories were mentioned above. Whilst the 25mx25m gridded dataset
includes the precise measurements for inundation depth that were provided by Cardno it
has also been graded into 5 inundation depth categories:
Category 1: 0 to 0.5m
Category 2: 0.5 to 1m
Category 3: 1 to 1.5m
Category 4: 1.5 to 2m
Category 5: greater than 2m
The five inundation depth categories have been used throughout this section of the report,
as: (a) they provided a tractable solution for analysing the extent to which different forms
of land or assets might be affected by storm surge; and (b) they reinforced the fact that this
preliminary analysis (whilst necessarily numeric) was intended to be an essentially
qualitative and superficial assessment.
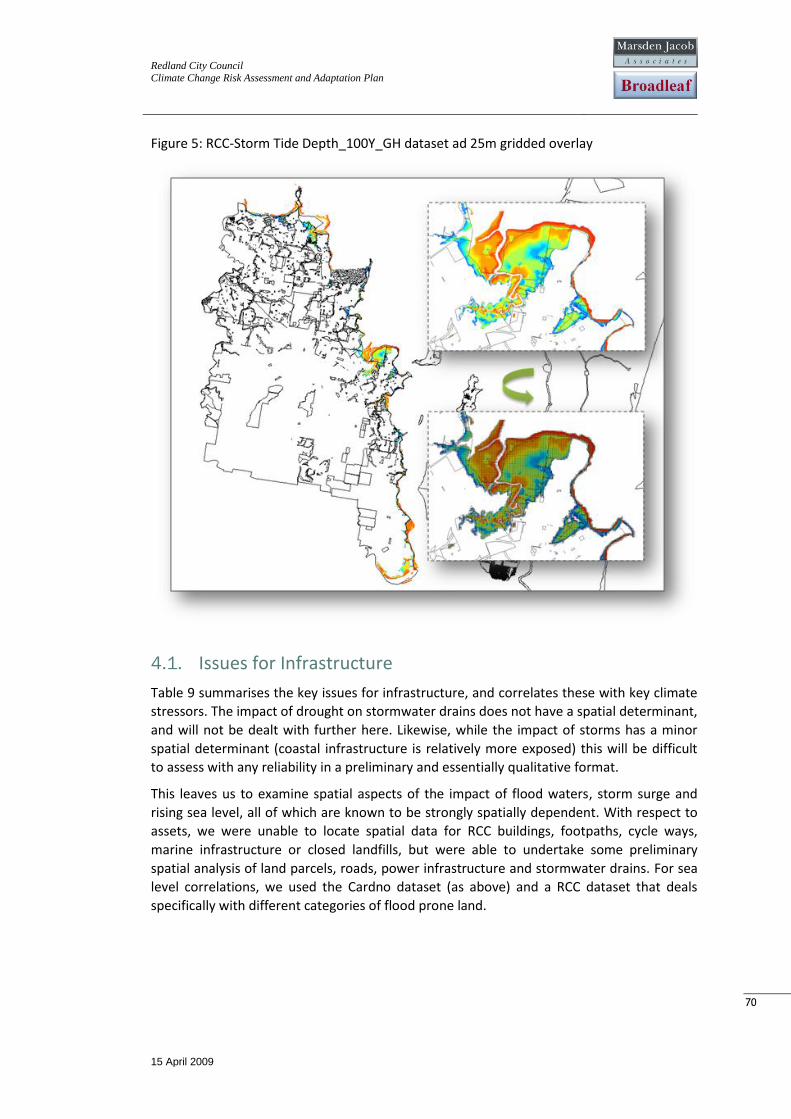
Redland City Council
Climate Change Risk Assessment and Adaptation Plan
15 April 2009
70
70
Figure 5: RCC-Storm Tide Depth_100Y_GH dataset ad 25m gridded overlay
4.1. Issues for Infrastructure
Table 9 summarises the key issues for infrastructure, and correlates these with key climate
stressors. The impact of drought on stormwater drains does not have a spatial determinant,
and will not be dealt with further here. Likewise, while the impact of storms has a minor
spatial determinant (coastal infrastructure is relatively more exposed) this will be difficult
to assess with any reliability in a preliminary and essentially qualitative format.
This leaves us to examine spatial aspects of the impact of flood waters, storm surge and
rising sea level, all of which are known to be strongly spatially dependent. With respect to
assets, we were unable to locate spatial data for RCC buildings, footpaths, cycle ways,
marine infrastructure or closed landfills, but were able to undertake some preliminary
spatial analysis of land parcels, roads, power infrastructure and stormwater drains. For sea
level correlations, we used the Cardno dataset (as above) and a RCC dataset that deals
specifically with different categories of flood prone land.
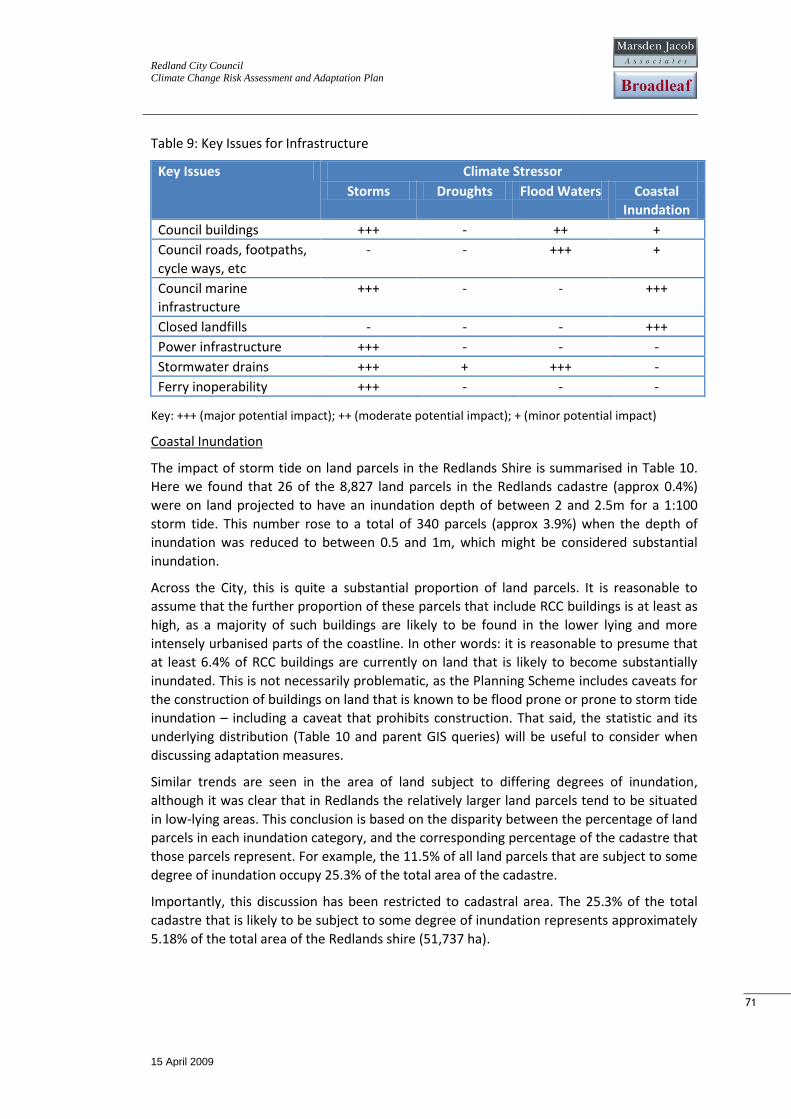
Redland City Council
Climate Change Risk Assessment and Adaptation Plan
15 April 2009
71
71
Table 9: Key Issues for Infrastructure
Key Issues Climate Stressor
Storms Droughts Flood Waters Coastal
Inundation
Council buildings +++ - ++ +
Council roads, footpaths,
cycle ways, etc
- - +++ +
Council marine
infrastructure
+++ - - +++
Closed landfills - - - +++
Power infrastructure +++ - - -
Stormwater drains +++ + +++ -
Ferry inoperability +++ - - -
Key: +++ (major potential impact); ++ (moderate potential impact); + (minor potential impact)
Coastal Inundation
The impact of storm tide on land parcels in the Redlands Shire is summarised in Table 10.
Here we found that 26 of the 8,827 land parcels in the Redlands cadastre (approx 0.4%)
were on land projected to have an inundation depth of between 2 and 2.5m for a 1:100
storm tide. This number rose to a total of 340 parcels (approx 3.9%) when the depth of
inundation was reduced to between 0.5 and 1m, which might be considered substantial
inundation.
Across the City, this is quite a substantial proportion of land parcels. It is reasonable to
assume that the further proportion of these parcels that include RCC buildings is at least as
high, as a majority of such buildings are likely to be found in the lower lying and more
intensely urbanised parts of the coastline. In other words: it is reasonable to presume that
at least 6.4% of RCC buildings are currently on land that is likely to become substantially
inundated. This is not necessarily problematic, as the Planning Scheme includes caveats for
the construction of buildings on land that is known to be flood prone or prone to storm tide
inundation – including a caveat that prohibits construction. That said, the statistic and its
underlying distribution (Table 10 and parent GIS queries) will be useful to consider when
discussing adaptation measures.
Similar trends are seen in the area of land subject to differing degrees of inundation,
although it was clear that in Redlands the relatively larger land parcels tend to be situated
in low-lying areas. This conclusion is based on the disparity between the percentage of land
parcels in each inundation category, and the corresponding percentage of the cadastre that
those parcels represent. For example, the 11.5% of all land parcels that are subject to some
degree of inundation occupy 25.3% of the total area of the cadastre.
Importantly, this discussion has been restricted to cadastral area. The 25.3% of the total
cadastre that is likely to be subject to some degree of inundation represents approximately
5.18% of the total area of the Redlands shire (51,737 ha).
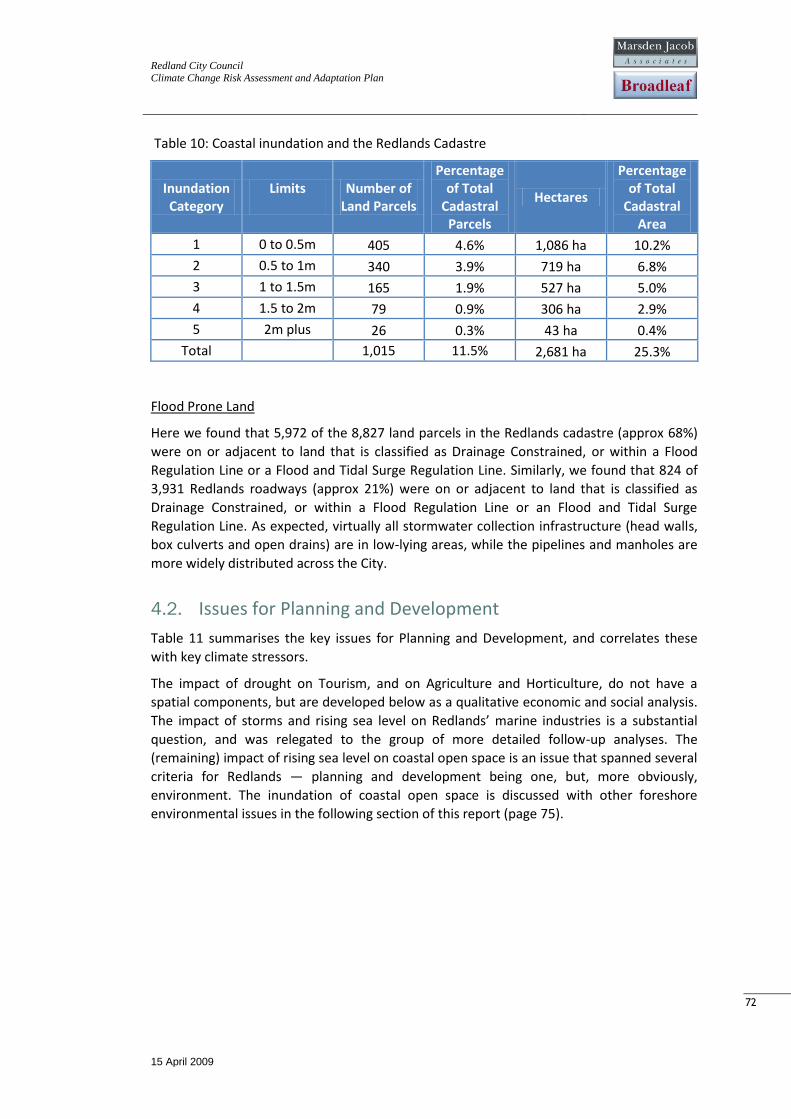
Redland City Council
Climate Change Risk Assessment and Adaptation Plan
15 April 2009
72
72
Table 10: Coastal inundation and the Redlands Cadastre
Inundation Category
Limits
Number of Land Parcels
Percentage of Total
Cadastral Parcels
Hectares
Percentage of Total
Cadastral Area
1 0 to 0.5m 405 4.6% 1,086 ha 10.2%
2 0.5 to 1m 340 3.9% 719 ha 6.8%
3 1 to 1.5m 165 1.9% 527 ha 5.0%
4 1.5 to 2m 79 0.9% 306 ha 2.9%
5 2m plus 26 0.3% 43 ha 0.4%
Total 1,015 11.5% 2,681 ha 25.3%
Flood Prone Land
Here we found that 5,972 of the 8,827 land parcels in the Redlands cadastre (approx 68%)
were on or adjacent to land that is classified as Drainage Constrained, or within a Flood
Regulation Line or a Flood and Tidal Surge Regulation Line. Similarly, we found that 824 of
3,931 Redlands roadways (approx 21%) were on or adjacent to land that is classified as
Drainage Constrained, or within a Flood Regulation Line or an Flood and Tidal Surge
Regulation Line. As expected, virtually all stormwater collection infrastructure (head walls,
box culverts and open drains) are in low-lying areas, while the pipelines and manholes are
more widely distributed across the City.
4.2. Issues for Planning and Development
Table 11 summarises the key issues for Planning and Development, and correlates these
with key climate stressors.
The impact of drought on Tourism, and on Agriculture and Horticulture, do not have a
spatial components, but are developed below as a qualitative economic and social analysis.
The impact of storms and rising sea level on Redlands’ marine industries is a substantial
question, and was relegated to the group of more detailed follow-up analyses. The
(remaining) impact of rising sea level on coastal open space is an issue that spanned several
criteria for Redlands — planning and development being one, but, more obviously,
environment. The inundation of coastal open space is discussed with other foreshore
environmental issues in the following section of this report (page 75).
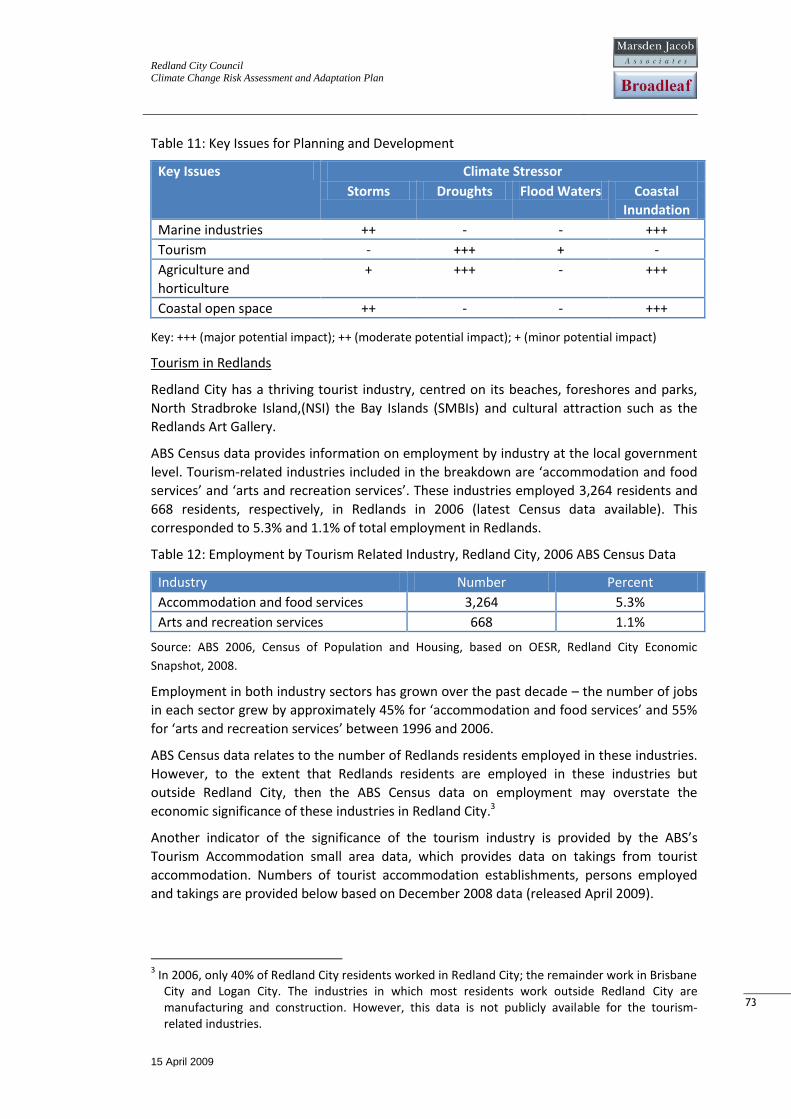
Redland City Council
Climate Change Risk Assessment and Adaptation Plan
15 April 2009
73
73
Table 11: Key Issues for Planning and Development
Key Issues Climate Stressor
Storms Droughts Flood Waters Coastal
Inundation
Marine industries ++ - - +++
Tourism - +++ + -
Agriculture and
horticulture
+ +++ - +++
Coastal open space ++ - - +++
Key: +++ (major potential impact); ++ (moderate potential impact); + (minor potential impact)
Tourism in Redlands
Redland City has a thriving tourist industry, centred on its beaches, foreshores and parks,
North Stradbroke Island,(NSI) the Bay Islands (SMBIs) and cultural attraction such as the
Redlands Art Gallery.
ABS Census data provides information on employment by industry at the local government
level. Tourism-related industries included in the breakdown are ‘accommodation and food
services’ and ‘arts and recreation services’. These industries employed 3,264 residents and
668 residents, respectively, in Redlands in 2006 (latest Census data available). This
corresponded to 5.3% and 1.1% of total employment in Redlands.
Table 12: Employment by Tourism Related Industry, Redland City, 2006 ABS Census Data
Industry Number Percent
Accommodation and food services 3,264 5.3%
Arts and recreation services 668 1.1%
Source: ABS 2006, Census of Population and Housing, based on OESR, Redland City Economic
Snapshot, 2008.
Employment in both industry sectors has grown over the past decade – the number of jobs
in each sector grew by approximately 45% for ‘accommodation and food services’ and 55%
for ‘arts and recreation services’ between 1996 and 2006.
ABS Census data relates to the number of Redlands residents employed in these industries.
However, to the extent that Redlands residents are employed in these industries but
outside Redland City, then the ABS Census data on employment may overstate the
economic significance of these industries in Redland City.3
Another indicator of the significance of the tourism industry is provided by the ABS’s
Tourism Accommodation small area data, which provides data on takings from tourist
accommodation. Numbers of tourist accommodation establishments, persons employed
and takings are provided below based on December 2008 data (released April 2009).
3 In 2006, only 40% of Redland City residents worked in Redland City; the remainder work in Brisbane
City and Logan City. The industries in which most residents work outside Redland City are manufacturing and construction. However, this data is not publicly available for the tourism-related industries.
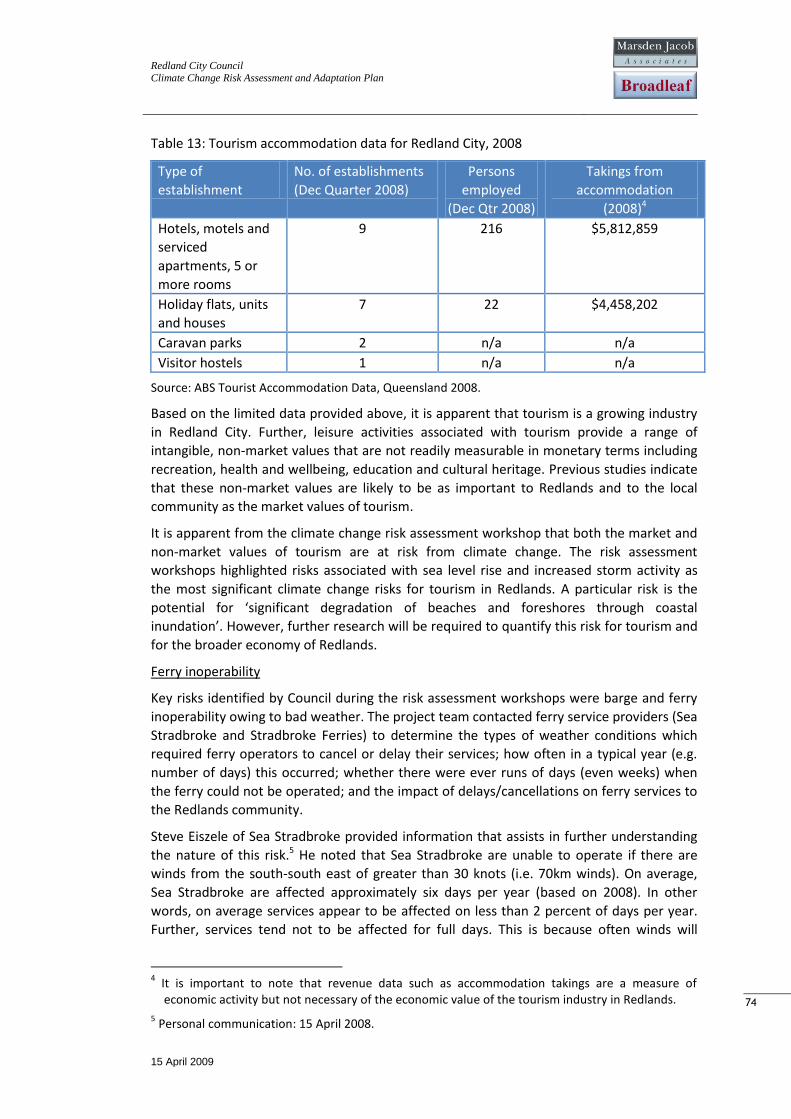
Redland City Council
Climate Change Risk Assessment and Adaptation Plan
15 April 2009
74
74
Table 13: Tourism accommodation data for Redland City, 2008
Type of
establishment
No. of establishments
(Dec Quarter 2008)
Persons
employed
(Dec Qtr 2008)
Takings from
accommodation
(2008)4
Hotels, motels and
serviced
apartments, 5 or
more rooms
9 216 $5,812,859
Holiday flats, units
and houses
7 22 $4,458,202
Caravan parks 2 n/a n/a
Visitor hostels 1 n/a n/a
Source: ABS Tourist Accommodation Data, Queensland 2008.
Based on the limited data provided above, it is apparent that tourism is a growing industry
in Redland City. Further, leisure activities associated with tourism provide a range of
intangible, non-market values that are not readily measurable in monetary terms including
recreation, health and wellbeing, education and cultural heritage. Previous studies indicate
that these non-market values are likely to be as important to Redlands and to the local
community as the market values of tourism.
It is apparent from the climate change risk assessment workshop that both the market and
non-market values of tourism are at risk from climate change. The risk assessment
workshops highlighted risks associated with sea level rise and increased storm activity as
the most significant climate change risks for tourism in Redlands. A particular risk is the
potential for ‘significant degradation of beaches and foreshores through coastal
inundation’. However, further research will be required to quantify this risk for tourism and
for the broader economy of Redlands.
Ferry inoperability
Key risks identified by Council during the risk assessment workshops were barge and ferry
inoperability owing to bad weather. The project team contacted ferry service providers (Sea
Stradbroke and Stradbroke Ferries) to determine the types of weather conditions which
required ferry operators to cancel or delay their services; how often in a typical year (e.g.
number of days) this occurred; whether there were ever runs of days (even weeks) when
the ferry could not be operated; and the impact of delays/cancellations on ferry services to
the Redlands community.
Steve Eiszele of Sea Stradbroke provided information that assists in further understanding
the nature of this risk.5 He noted that Sea Stradbroke are unable to operate if there are
winds from the south-south east of greater than 30 knots (i.e. 70km winds). On average,
Sea Stradbroke are affected approximately six days per year (based on 2008). In other
words, on average services appear to be affected on less than 2 percent of days per year.
Further, services tend not to be affected for full days. This is because often winds will
4 It is important to note that revenue data such as accommodation takings are a measure of
economic activity but not necessary of the economic value of the tourism industry in Redlands.
5 Personal communication: 15 April 2008.
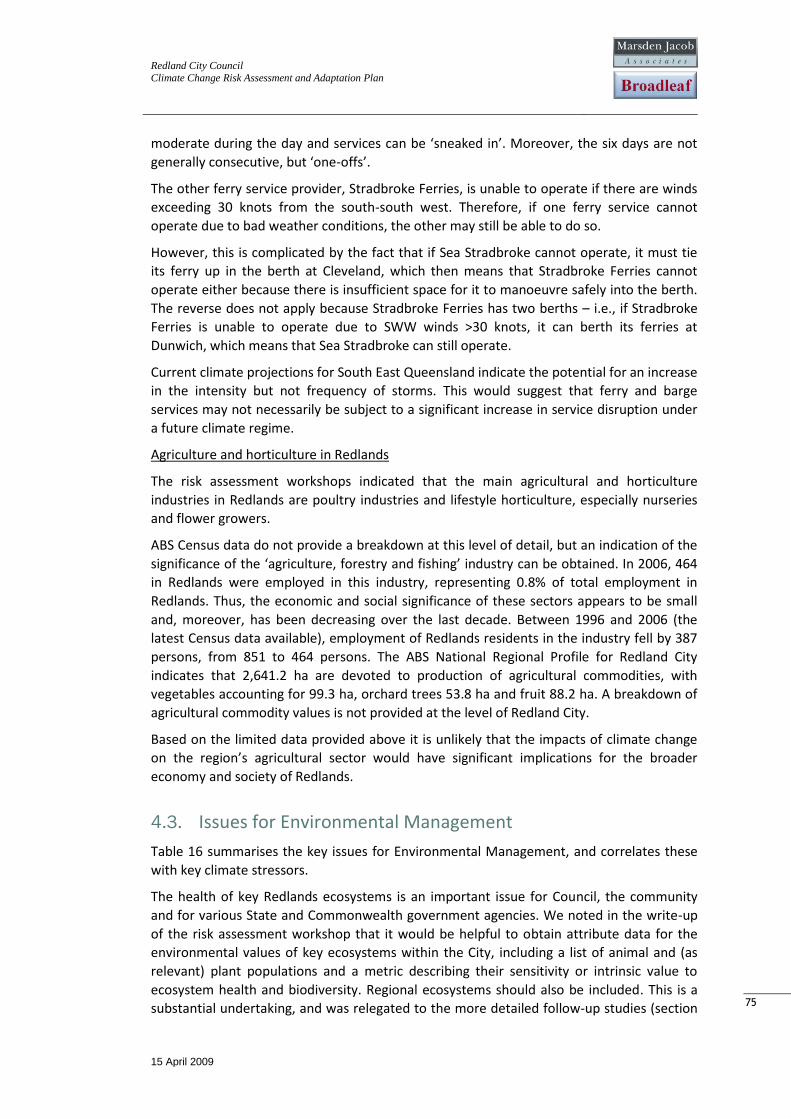
Redland City Council
Climate Change Risk Assessment and Adaptation Plan
15 April 2009
75
75
moderate during the day and services can be ‘sneaked in’. Moreover, the six days are not
generally consecutive, but ‘one-offs’.
The other ferry service provider, Stradbroke Ferries, is unable to operate if there are winds
exceeding 30 knots from the south-south west. Therefore, if one ferry service cannot
operate due to bad weather conditions, the other may still be able to do so.
However, this is complicated by the fact that if Sea Stradbroke cannot operate, it must tie
its ferry up in the berth at Cleveland, which then means that Stradbroke Ferries cannot
operate either because there is insufficient space for it to manoeuvre safely into the berth.
The reverse does not apply because Stradbroke Ferries has two berths – i.e., if Stradbroke
Ferries is unable to operate due to SWW winds >30 knots, it can berth its ferries at
Dunwich, which means that Sea Stradbroke can still operate.
Current climate projections for South East Queensland indicate the potential for an increase
in the intensity but not frequency of storms. This would suggest that ferry and barge
services may not necessarily be subject to a significant increase in service disruption under
a future climate regime.
Agriculture and horticulture in Redlands
The risk assessment workshops indicated that the main agricultural and horticulture
industries in Redlands are poultry industries and lifestyle horticulture, especially nurseries
and flower growers.
ABS Census data do not provide a breakdown at this level of detail, but an indication of the
significance of the ‘agriculture, forestry and fishing’ industry can be obtained. In 2006, 464
in Redlands were employed in this industry, representing 0.8% of total employment in
Redlands. Thus, the economic and social significance of these sectors appears to be small
and, moreover, has been decreasing over the last decade. Between 1996 and 2006 (the
latest Census data available), employment of Redlands residents in the industry fell by 387
persons, from 851 to 464 persons. The ABS National Regional Profile for Redland City
indicates that 2,641.2 ha are devoted to production of agricultural commodities, with
vegetables accounting for 99.3 ha, orchard trees 53.8 ha and fruit 88.2 ha. A breakdown of
agricultural commodity values is not provided at the level of Redland City.
Based on the limited data provided above it is unlikely that the impacts of climate change
on the region’s agricultural sector would have significant implications for the broader
economy and society of Redlands.
4.3. Issues for Environmental Management
Table 16 summarises the key issues for Environmental Management, and correlates these
with key climate stressors.
The health of key Redlands ecosystems is an important issue for Council, the community
and for various State and Commonwealth government agencies. We noted in the write-up
of the risk assessment workshop that it would be helpful to obtain attribute data for the
environmental values of key ecosystems within the City, including a list of animal and (as
relevant) plant populations and a metric describing their sensitivity or intrinsic value to
ecosystem health and biodiversity. Regional ecosystems should also be included. This is a
substantial undertaking, and was relegated to the more detailed follow-up studies (section
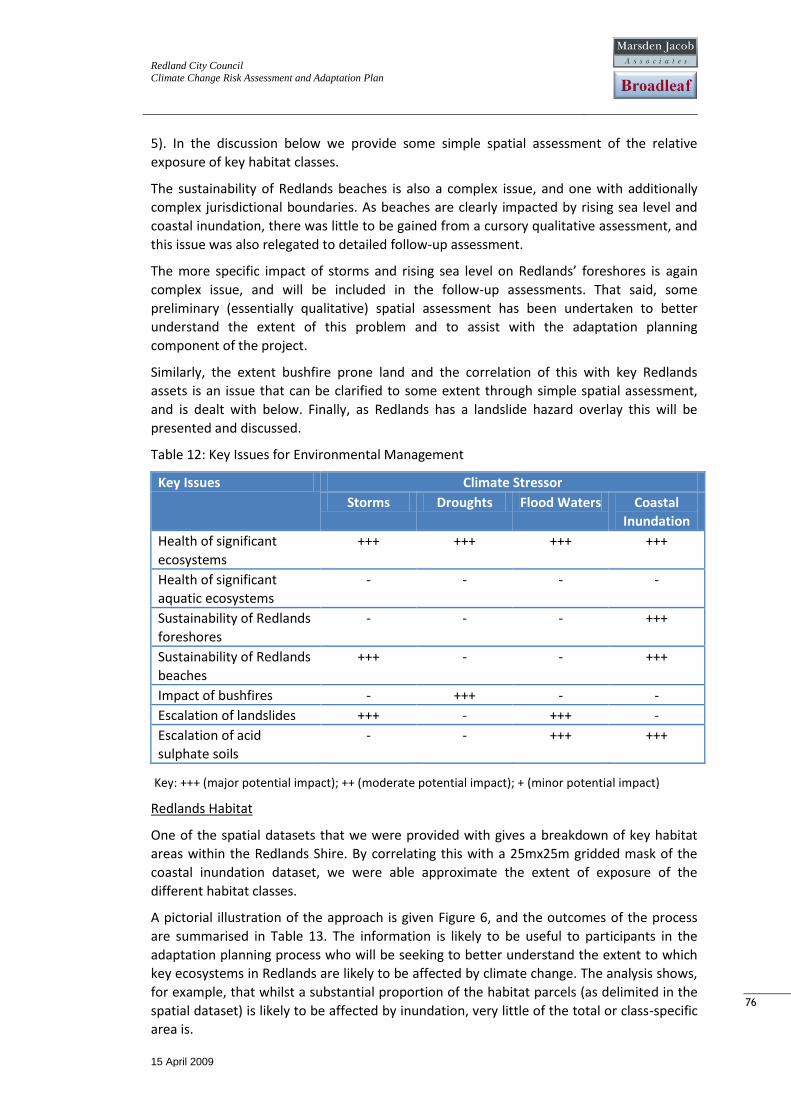
Redland City Council
Climate Change Risk Assessment and Adaptation Plan
15 April 2009
76
76
5). In the discussion below we provide some simple spatial assessment of the relative
exposure of key habitat classes.
The sustainability of Redlands beaches is also a complex issue, and one with additionally
complex jurisdictional boundaries. As beaches are clearly impacted by rising sea level and
coastal inundation, there was little to be gained from a cursory qualitative assessment, and
this issue was also relegated to detailed follow-up assessment.
The more specific impact of storms and rising sea level on Redlands’ foreshores is again
complex issue, and will be included in the follow-up assessments. That said, some
preliminary (essentially qualitative) spatial assessment has been undertaken to better
understand the extent of this problem and to assist with the adaptation planning
component of the project.
Similarly, the extent bushfire prone land and the correlation of this with key Redlands
assets is an issue that can be clarified to some extent through simple spatial assessment,
and is dealt with below. Finally, as Redlands has a landslide hazard overlay this will be
presented and discussed.
Table 12: Key Issues for Environmental Management
Key Issues Climate Stressor
Storms Droughts Flood Waters Coastal
Inundation
Health of significant
ecosystems
+++ +++ +++ +++
Health of significant
aquatic ecosystems
- - - -
Sustainability of Redlands
foreshores
- - - +++
Sustainability of Redlands
beaches
+++ - - +++
Impact of bushfires - +++ - -
Escalation of landslides +++ - +++ -
Escalation of acid
sulphate soils
- - +++ +++
Key: +++ (major potential impact); ++ (moderate potential impact); + (minor potential impact)
Redlands Habitat
One of the spatial datasets that we were provided with gives a breakdown of key habitat
areas within the Redlands Shire. By correlating this with a 25mx25m gridded mask of the
coastal inundation dataset, we were able approximate the extent of exposure of the
different habitat classes.
A pictorial illustration of the approach is given Figure 6, and the outcomes of the process
are summarised in Table 13. The information is likely to be useful to participants in the
adaptation planning process who will be seeking to better understand the extent to which
key ecosystems in Redlands are likely to be affected by climate change. The analysis shows,
for example, that whilst a substantial proportion of the habitat parcels (as delimited in the
spatial dataset) is likely to be affected by inundation, very little of the total or class-specific
area is.
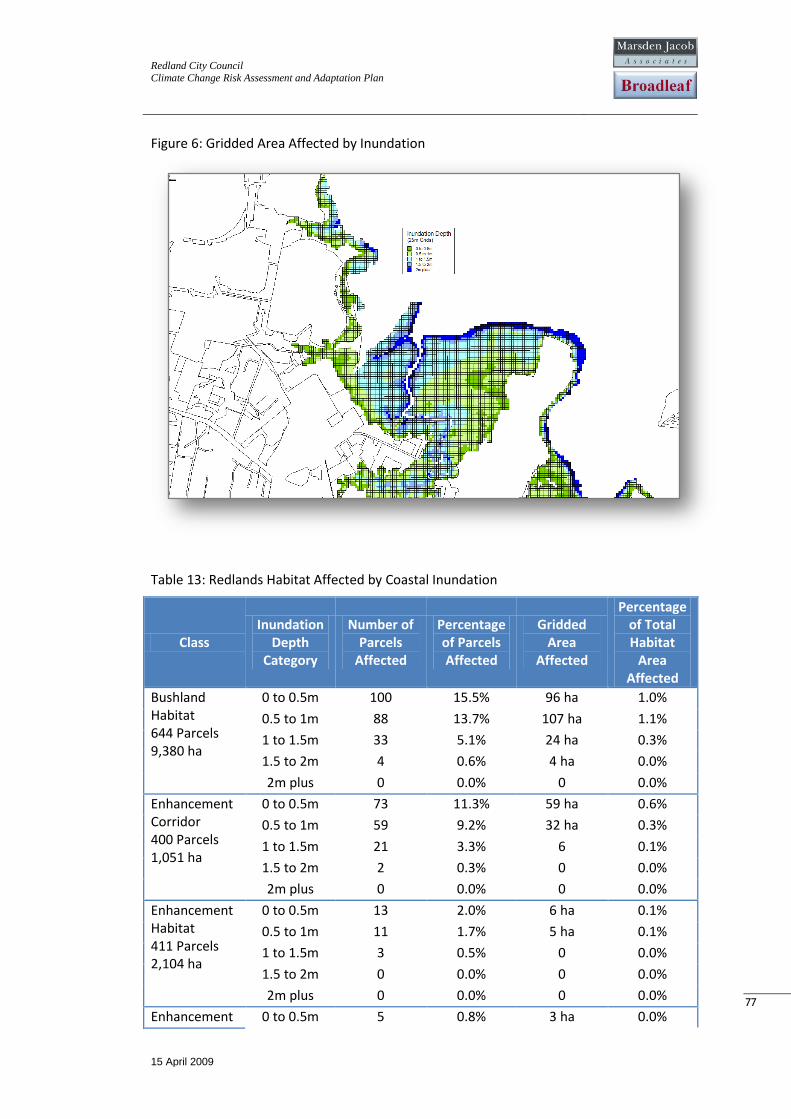
Redland City Council
Climate Change Risk Assessment and Adaptation Plan
15 April 2009
77
77
Figure 6: Gridded Area Affected by Inundation
Table 13: Redlands Habitat Affected by Coastal Inundation
Class Inundation
Depth Category
Number of Parcels
Affected
Percentage of Parcels Affected
Gridded Area
Affected
Percentage of Total Habitat
Area Affected
Bushland Habitat 644 Parcels 9,380 ha
0 to 0.5m 100 15.5% 96 ha 1.0%
0.5 to 1m 88 13.7% 107 ha 1.1%
1 to 1.5m 33 5.1% 24 ha 0.3%
1.5 to 2m 4 0.6% 4 ha 0.0%
2m plus 0 0.0% 0 0.0%
Enhancement Corridor 400 Parcels 1,051 ha
0 to 0.5m 73 11.3% 59 ha 0.6%
0.5 to 1m 59 9.2% 32 ha 0.3%
1 to 1.5m 21 3.3% 6 0.1%
1.5 to 2m 2 0.3% 0 0.0%
2m plus 0 0.0% 0 0.0%
Enhancement Habitat 411 Parcels 2,104 ha
0 to 0.5m 13 2.0% 6 ha 0.1%
0.5 to 1m 11 1.7% 5 ha 0.1%
1 to 1.5m 3 0.5% 0 0.0%
1.5 to 2m 0 0.0% 0 0.0%
2m plus 0 0.0% 0 0.0%
Enhancement 0 to 0.5m 5 0.8% 3 ha 0.0%
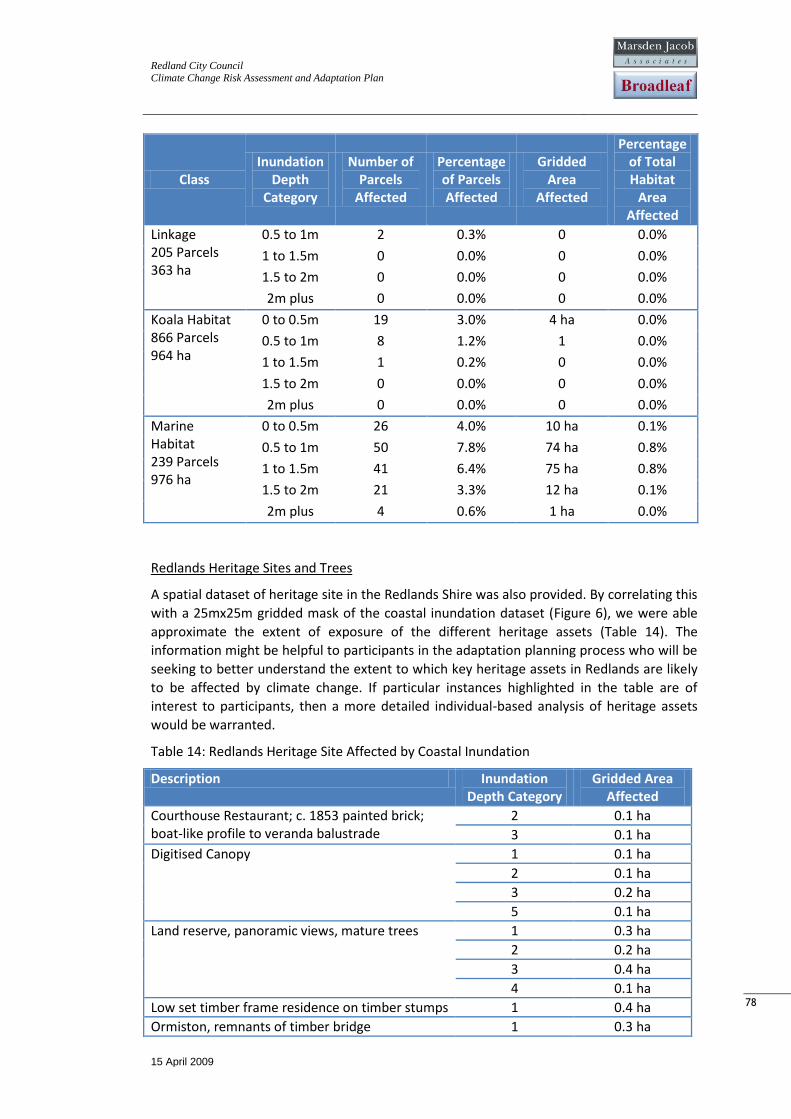
Redland City Council
Climate Change Risk Assessment and Adaptation Plan
15 April 2009
78
78
Class Inundation
Depth Category
Number of Parcels
Affected
Percentage of Parcels Affected
Gridded Area
Affected
Percentage of Total Habitat
Area Affected
Linkage 205 Parcels 363 ha
0.5 to 1m 2 0.3% 0 0.0%
1 to 1.5m 0 0.0% 0 0.0%
1.5 to 2m 0 0.0% 0 0.0%
2m plus 0 0.0% 0 0.0%
Koala Habitat 866 Parcels 964 ha
0 to 0.5m 19 3.0% 4 ha 0.0%
0.5 to 1m 8 1.2% 1 0.0%
1 to 1.5m 1 0.2% 0 0.0%
1.5 to 2m 0 0.0% 0 0.0%
2m plus 0 0.0% 0 0.0%
Marine Habitat 239 Parcels 976 ha
0 to 0.5m 26 4.0% 10 ha 0.1%
0.5 to 1m 50 7.8% 74 ha 0.8%
1 to 1.5m 41 6.4% 75 ha 0.8%
1.5 to 2m 21 3.3% 12 ha 0.1%
2m plus 4 0.6% 1 ha 0.0%
Redlands Heritage Sites and Trees
A spatial dataset of heritage site in the Redlands Shire was also provided. By correlating this
with a 25mx25m gridded mask of the coastal inundation dataset (Figure 6), we were able
approximate the extent of exposure of the different heritage assets (Table 14). The
information might be helpful to participants in the adaptation planning process who will be
seeking to better understand the extent to which key heritage assets in Redlands are likely
to be affected by climate change. If particular instances highlighted in the table are of
interest to participants, then a more detailed individual-based analysis of heritage assets
would be warranted.
Table 14: Redlands Heritage Site Affected by Coastal Inundation
Description Inundation Depth Category
Gridded Area Affected
Courthouse Restaurant; c. 1853 painted brick; boat-like profile to veranda balustrade
2 0.1 ha
3 0.1 ha
Digitised Canopy 1 0.1 ha
2 0.1 ha
3 0.2 ha
5 0.1 ha
Land reserve, panoramic views, mature trees 1 0.3 ha
2 0.2 ha
3 0.4 ha
4 0.1 ha
Low set timber frame residence on timber stumps 1 0.4 ha
Ormiston, remnants of timber bridge 1 0.3 ha
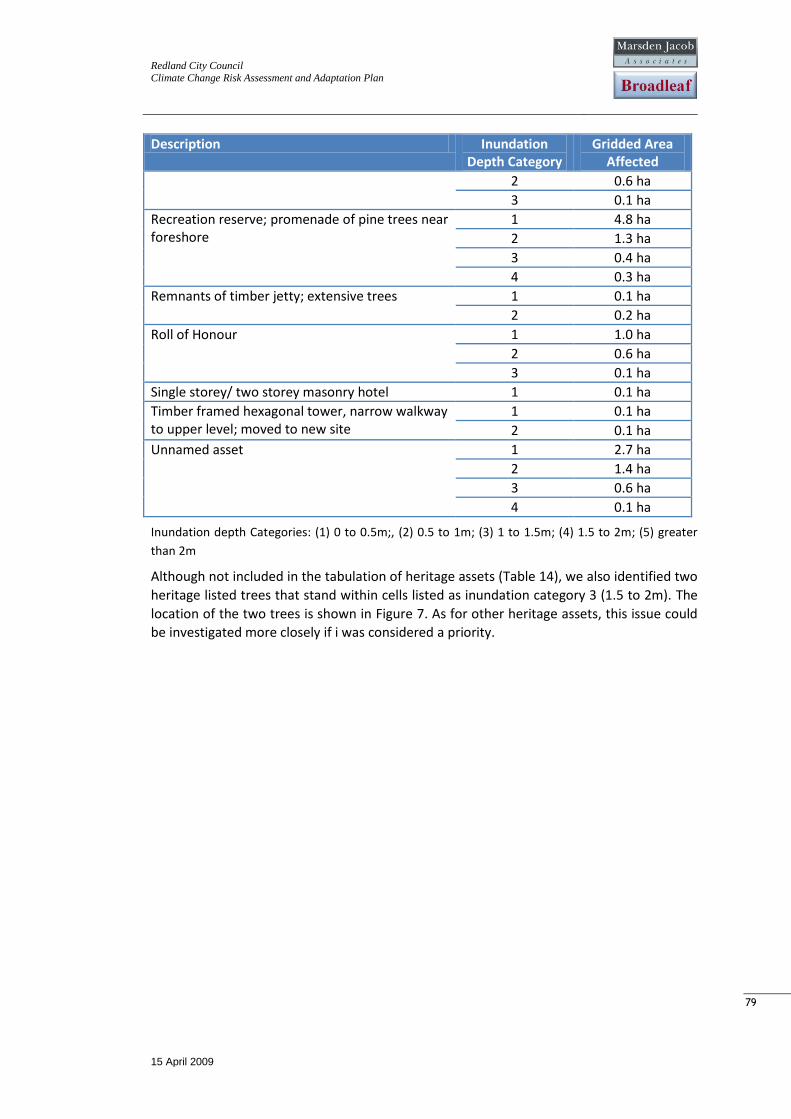
Redland City Council
Climate Change Risk Assessment and Adaptation Plan
15 April 2009
79
79
Description Inundation Depth Category
Gridded Area Affected
2 0.6 ha
3 0.1 ha
Recreation reserve; promenade of pine trees near foreshore
1 4.8 ha
2 1.3 ha
3 0.4 ha
4 0.3 ha
Remnants of timber jetty; extensive trees 1 0.1 ha
2 0.2 ha
Roll of Honour 1 1.0 ha
2 0.6 ha
3 0.1 ha
Single storey/ two storey masonry hotel 1 0.1 ha
Timber framed hexagonal tower, narrow walkway to upper level; moved to new site
1 0.1 ha
2 0.1 ha
Unnamed asset 1 2.7 ha
2 1.4 ha
3 0.6 ha
4 0.1 ha
Inundation depth Categories: (1) 0 to 0.5m;, (2) 0.5 to 1m; (3) 1 to 1.5m; (4) 1.5 to 2m; (5) greater
than 2m
Although not included in the tabulation of heritage assets (Table 14), we also identified two
heritage listed trees that stand within cells listed as inundation category 3 (1.5 to 2m). The
location of the two trees is shown in Figure 7. As for other heritage assets, this issue could
be investigated more closely if i was considered a priority.
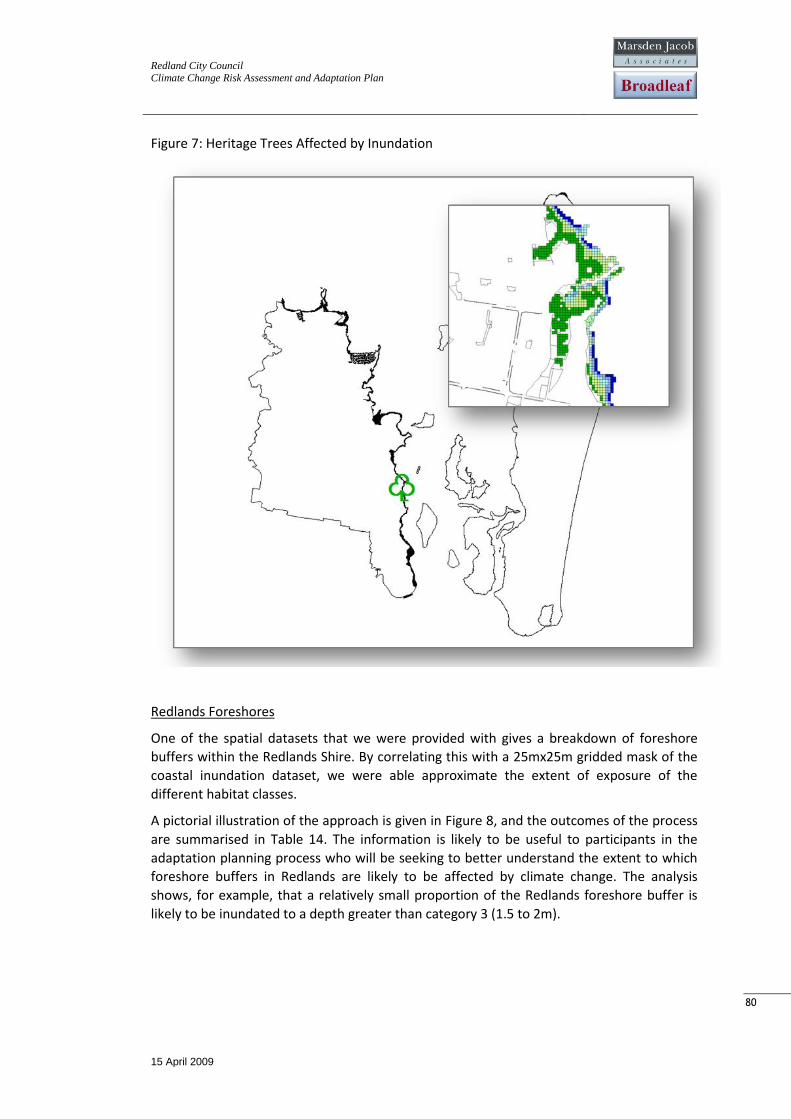
Redland City Council
Climate Change Risk Assessment and Adaptation Plan
15 April 2009
80
80
Figure 7: Heritage Trees Affected by Inundation
Redlands Foreshores
One of the spatial datasets that we were provided with gives a breakdown of foreshore
buffers within the Redlands Shire. By correlating this with a 25mx25m gridded mask of the
coastal inundation dataset, we were able approximate the extent of exposure of the
different habitat classes.
A pictorial illustration of the approach is given in Figure 8, and the outcomes of the process
are summarised in Table 14. The information is likely to be useful to participants in the
adaptation planning process who will be seeking to better understand the extent to which
foreshore buffers in Redlands are likely to be affected by climate change. The analysis
shows, for example, that a relatively small proportion of the Redlands foreshore buffer is
likely to be inundated to a depth greater than category 3 (1.5 to 2m).
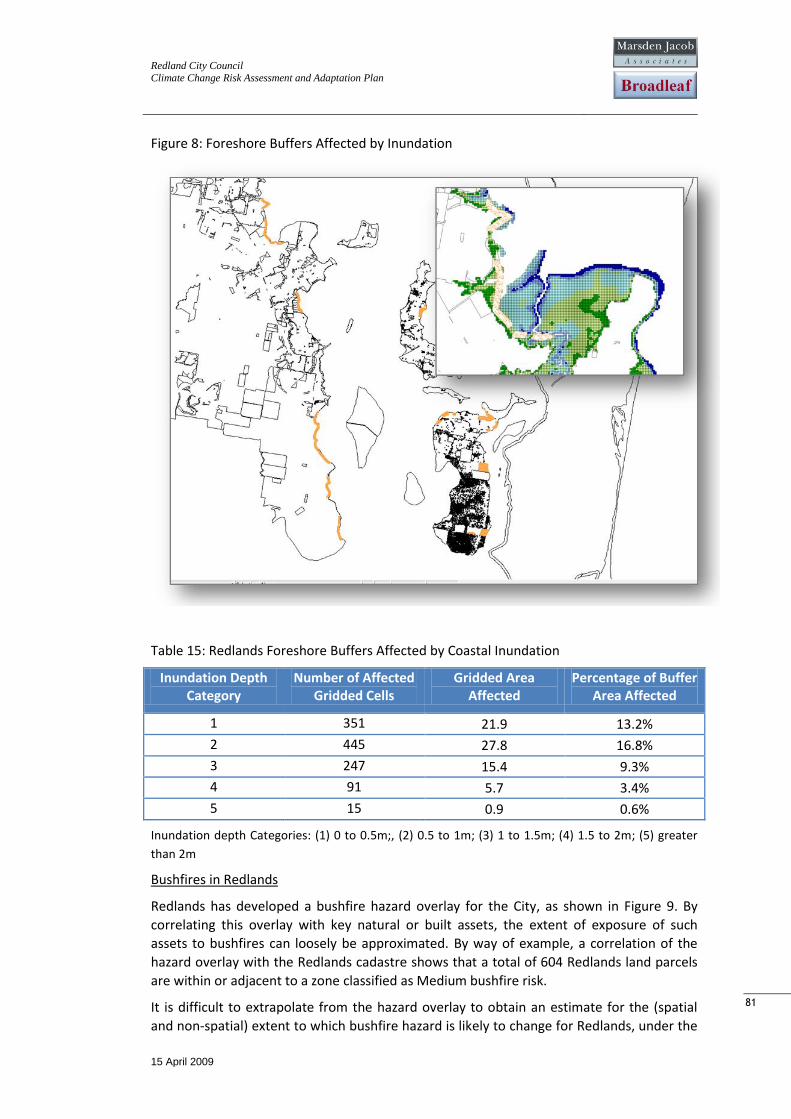
Redland City Council
Climate Change Risk Assessment and Adaptation Plan
15 April 2009
81
81
Figure 8: Foreshore Buffers Affected by Inundation
Table 15: Redlands Foreshore Buffers Affected by Coastal Inundation
Inundation Depth Category
Number of Affected Gridded Cells
Gridded Area Affected
Percentage of Buffer Area Affected
1 351 21.9 13.2%
2 445 27.8 16.8%
3 247 15.4 9.3%
4 91 5.7 3.4%
5 15 0.9 0.6%
Inundation depth Categories: (1) 0 to 0.5m;, (2) 0.5 to 1m; (3) 1 to 1.5m; (4) 1.5 to 2m; (5) greater
than 2m
Bushfires in Redlands
Redlands has developed a bushfire hazard overlay for the City, as shown in Figure 9. By
correlating this overlay with key natural or built assets, the extent of exposure of such
assets to bushfires can loosely be approximated. By way of example, a correlation of the
hazard overlay with the Redlands cadastre shows that a total of 604 Redlands land parcels
are within or adjacent to a zone classified as Medium bushfire risk.
It is difficult to extrapolate from the hazard overlay to obtain an estimate for the (spatial
and non-spatial) extent to which bushfire hazard is likely to change for Redlands, under the
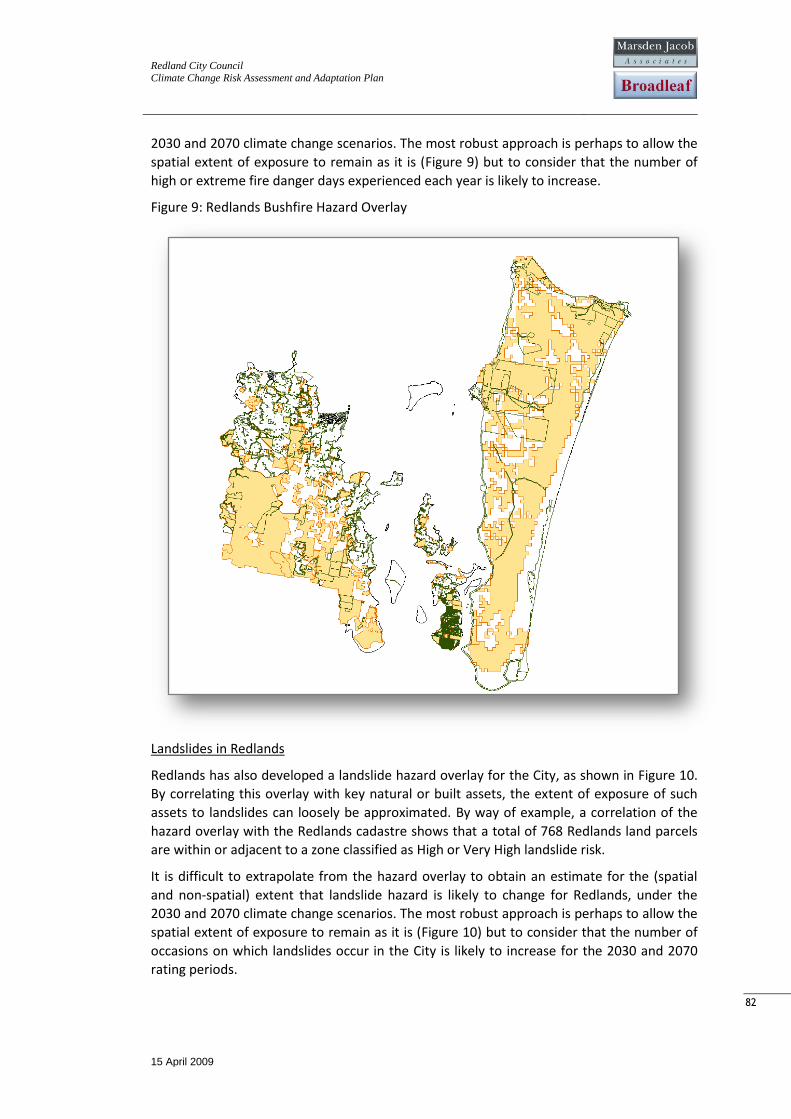
Redland City Council
Climate Change Risk Assessment and Adaptation Plan
15 April 2009
82
82
2030 and 2070 climate change scenarios. The most robust approach is perhaps to allow the
spatial extent of exposure to remain as it is (Figure 9) but to consider that the number of
high or extreme fire danger days experienced each year is likely to increase.
Figure 9: Redlands Bushfire Hazard Overlay
Landslides in Redlands
Redlands has also developed a landslide hazard overlay for the City, as shown in Figure 10.
By correlating this overlay with key natural or built assets, the extent of exposure of such
assets to landslides can loosely be approximated. By way of example, a correlation of the
hazard overlay with the Redlands cadastre shows that a total of 768 Redlands land parcels
are within or adjacent to a zone classified as High or Very High landslide risk.
It is difficult to extrapolate from the hazard overlay to obtain an estimate for the (spatial
and non-spatial) extent that landslide hazard is likely to change for Redlands, under the
2030 and 2070 climate change scenarios. The most robust approach is perhaps to allow the
spatial extent of exposure to remain as it is (Figure 10) but to consider that the number of
occasions on which landslides occur in the City is likely to increase for the 2030 and 2070
rating periods.
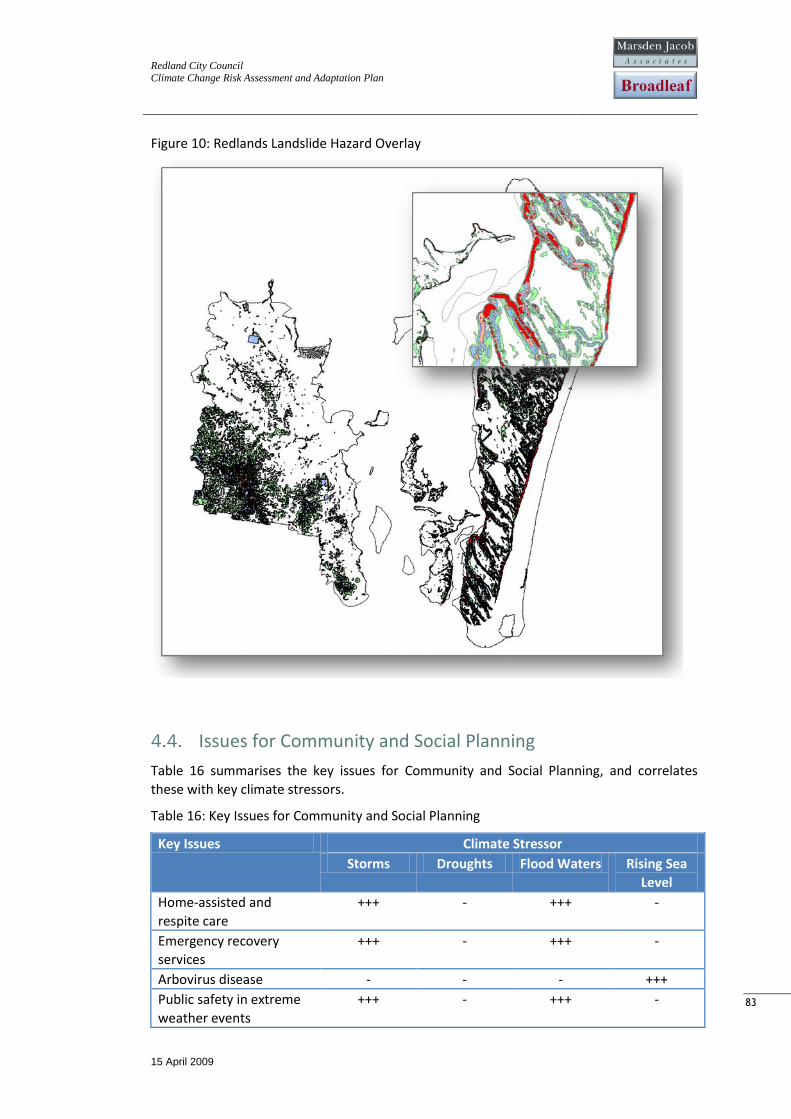
Redland City Council
Climate Change Risk Assessment and Adaptation Plan
15 April 2009
83
83
Figure 10: Redlands Landslide Hazard Overlay
4.4. Issues for Community and Social Planning
Table 16 summarises the key issues for Community and Social Planning, and correlates
these with key climate stressors.
Table 16: Key Issues for Community and Social Planning
Key Issues Climate Stressor
Storms Droughts Flood Waters Rising Sea
Level
Home-assisted and
respite care
+++ - +++ -
Emergency recovery
services
+++ - +++ -
Arbovirus disease - - - +++
Public safety in extreme
weather events
+++ - +++ -
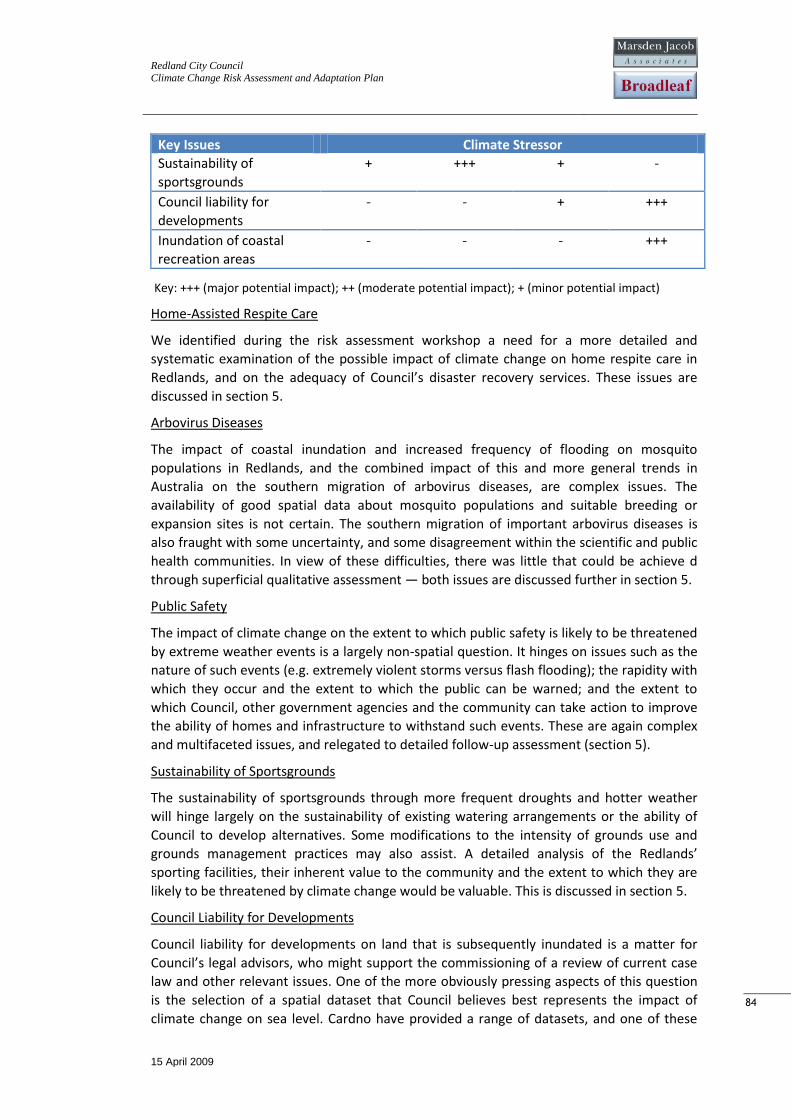
Redland City Council
Climate Change Risk Assessment and Adaptation Plan
15 April 2009
84
84
Key Issues Climate Stressor
Sustainability of
sportsgrounds
+ +++ + -
Council liability for
developments
- - + +++
Inundation of coastal
recreation areas
- - - +++
Key: +++ (major potential impact); ++ (moderate potential impact); + (minor potential impact)
Home-Assisted Respite Care
We identified during the risk assessment workshop a need for a more detailed and
systematic examination of the possible impact of climate change on home respite care in
Redlands, and on the adequacy of Council’s disaster recovery services. These issues are
discussed in section 5.
Arbovirus Diseases
The impact of coastal inundation and increased frequency of flooding on mosquito
populations in Redlands, and the combined impact of this and more general trends in
Australia on the southern migration of arbovirus diseases, are complex issues. The
availability of good spatial data about mosquito populations and suitable breeding or
expansion sites is not certain. The southern migration of important arbovirus diseases is
also fraught with some uncertainty, and some disagreement within the scientific and public
health communities. In view of these difficulties, there was little that could be achieve d
through superficial qualitative assessment — both issues are discussed further in section 5.
Public Safety
The impact of climate change on the extent to which public safety is likely to be threatened
by extreme weather events is a largely non-spatial question. It hinges on issues such as the
nature of such events (e.g. extremely violent storms versus flash flooding); the rapidity with
which they occur and the extent to which the public can be warned; and the extent to
which Council, other government agencies and the community can take action to improve
the ability of homes and infrastructure to withstand such events. These are again complex
and multifaceted issues, and relegated to detailed follow-up assessment (section 5).
Sustainability of Sportsgrounds
The sustainability of sportsgrounds through more frequent droughts and hotter weather
will hinge largely on the sustainability of existing watering arrangements or the ability of
Council to develop alternatives. Some modifications to the intensity of grounds use and
grounds management practices may also assist. A detailed analysis of the Redlands’
sporting facilities, their inherent value to the community and the extent to which they are
likely to be threatened by climate change would be valuable. This is discussed in section 5.
Council Liability for Developments
Council liability for developments on land that is subsequently inundated is a matter for
Council’s legal advisors, who might support the commissioning of a review of current case
law and other relevant issues. One of the more obviously pressing aspects of this question
is the selection of a spatial dataset that Council believes best represents the impact of
climate change on sea level. Cardno have provided a range of datasets, and one of these
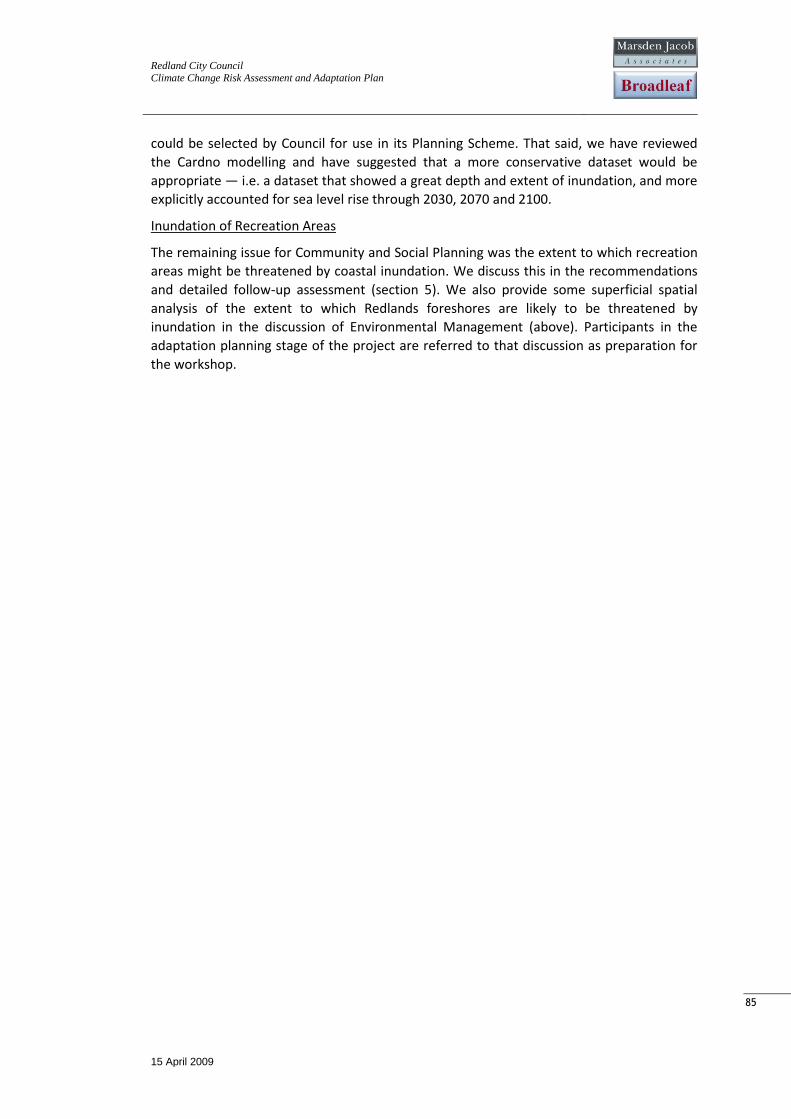
Redland City Council
Climate Change Risk Assessment and Adaptation Plan
15 April 2009
85
85
could be selected by Council for use in its Planning Scheme. That said, we have reviewed
the Cardno modelling and have suggested that a more conservative dataset would be
appropriate — i.e. a dataset that showed a great depth and extent of inundation, and more
explicitly accounted for sea level rise through 2030, 2070 and 2100.
Inundation of Recreation Areas
The remaining issue for Community and Social Planning was the extent to which recreation
areas might be threatened by coastal inundation. We discuss this in the recommendations
and detailed follow-up assessment (section 5). We also provide some superficial spatial
analysis of the extent to which Redlands foreshores are likely to be threatened by
inundation in the discussion of Environmental Management (above). Participants in the
adaptation planning stage of the project are referred to that discussion as preparation for
the workshop.
Redland City Council
Climate Change Risk Assessment and Adaptation Plan
15 April 2009
86
86
5. Follow-Up Assessments
In this section of the report we describe recommendations for more detailed follow-up
spatial and other assessments.
A brief summary of the recommendations about the follow-up assessments is given in Table
17 overleaf. We don’t maintain that all of this work need be done immediately, and suggest
only that RCC review the summary — and, as relevant, the more detailed discussions of
each risk — and draw their own conclusions about the assessments that they consider most
critical to the integrity of the exercise.
This work is distinct from the detailed spatial modelling of sea level, storm surges, severe
storms and flooding that is being carried out by GEMS (Dr Graeme Hubbert).
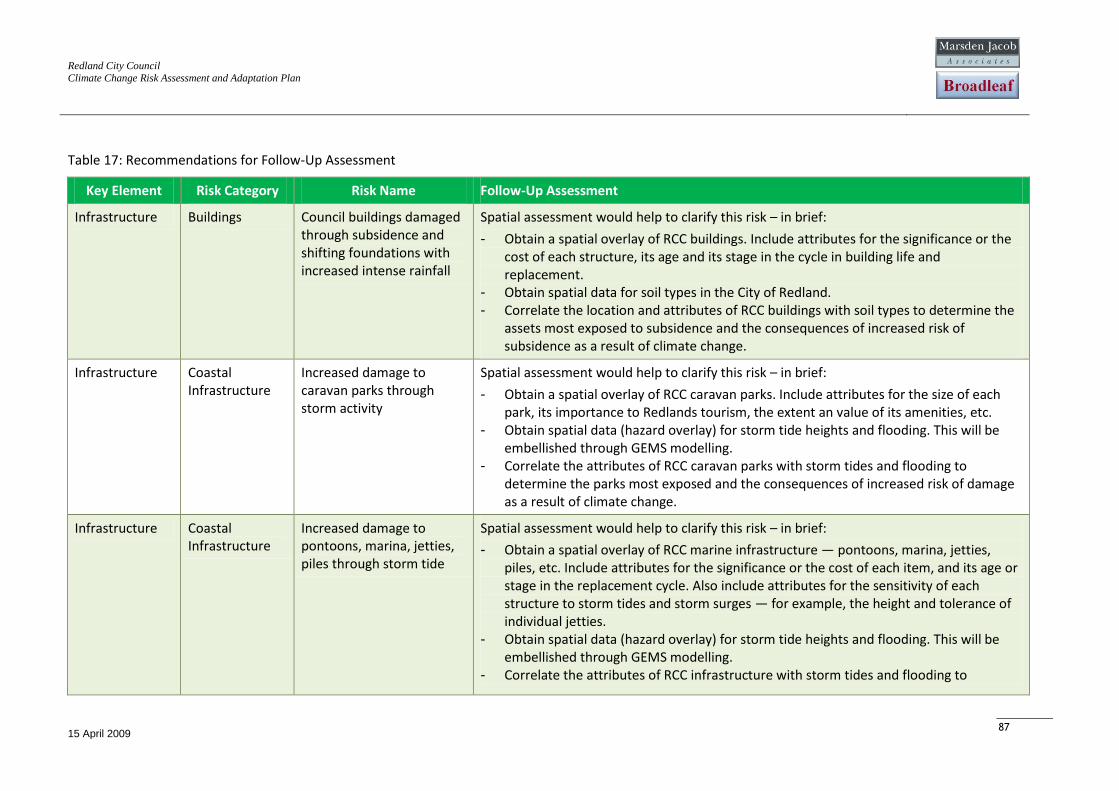
Redland City Council
Climate Change Risk Assessment and Adaptation Plan
15 April 2009
87
Table 17: Recommendations for Follow-Up Assessment
Key Element Risk Category Risk Name Follow-Up Assessment
Infrastructure Buildings Council buildings damaged through subsidence and shifting foundations with increased intense rainfall
Spatial assessment would help to clarify this risk – in brief:
- Obtain a spatial overlay of RCC buildings. Include attributes for the significance or the cost of each structure, its age and its stage in the cycle in building life and replacement.
- Obtain spatial data for soil types in the City of Redland. - Correlate the location and attributes of RCC buildings with soil types to determine the
assets most exposed to subsidence and the consequences of increased risk of subsidence as a result of climate change.
Infrastructure Coastal Infrastructure
Increased damage to caravan parks through storm activity
Spatial assessment would help to clarify this risk – in brief:
- Obtain a spatial overlay of RCC caravan parks. Include attributes for the size of each park, its importance to Redlands tourism, the extent an value of its amenities, etc.
- Obtain spatial data (hazard overlay) for storm tide heights and flooding. This will be embellished through GEMS modelling.
- Correlate the attributes of RCC caravan parks with storm tides and flooding to determine the parks most exposed and the consequences of increased risk of damage as a result of climate change.
Infrastructure Coastal Infrastructure
Increased damage to pontoons, marina, jetties, piles through storm tide
Spatial assessment would help to clarify this risk – in brief:
- Obtain a spatial overlay of RCC marine infrastructure — pontoons, marina, jetties, piles, etc. Include attributes for the significance or the cost of each item, and its age or stage in the replacement cycle. Also include attributes for the sensitivity of each structure to storm tides and storm surges — for example, the height and tolerance of individual jetties.
- Obtain spatial data (hazard overlay) for storm tide heights and flooding. This will be embellished through GEMS modelling.
- Correlate the attributes of RCC infrastructure with storm tides and flooding to
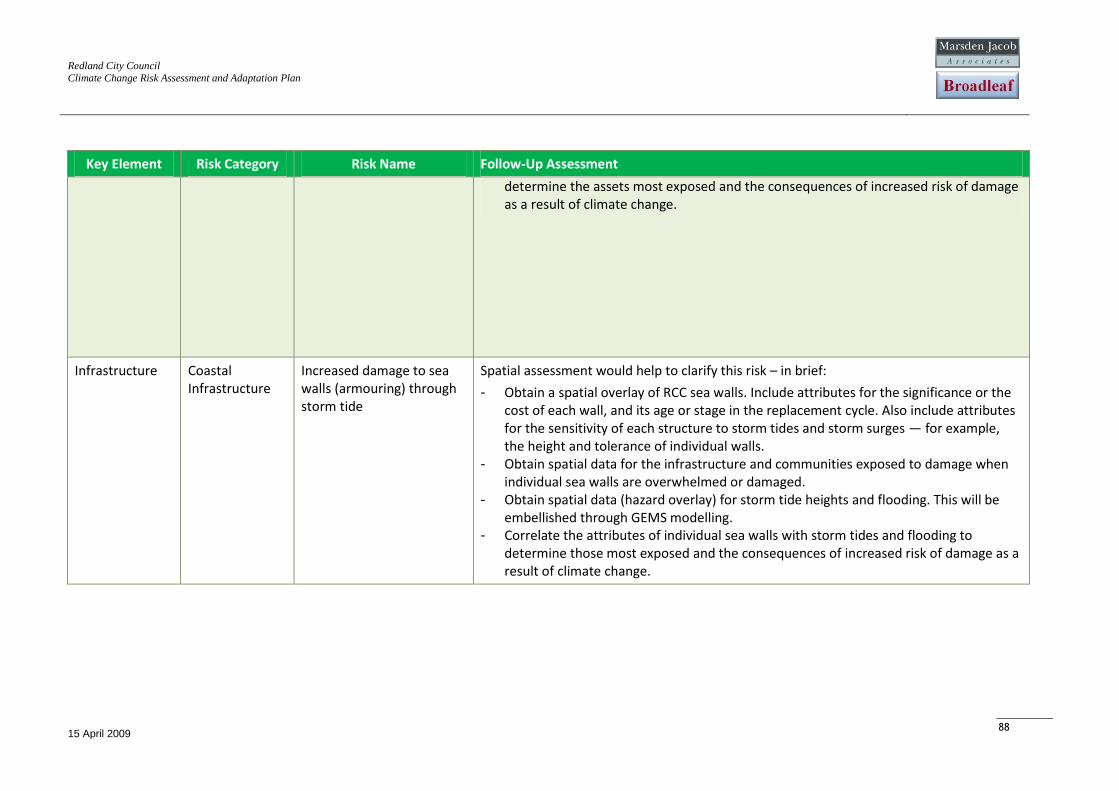
Redland City Council
Climate Change Risk Assessment and Adaptation Plan
15 April 2009
88
Key Element Risk Category Risk Name Follow-Up Assessment
determine the assets most exposed and the consequences of increased risk of damage as a result of climate change.
Infrastructure Coastal Infrastructure
Increased damage to sea walls (armouring) through storm tide
Spatial assessment would help to clarify this risk – in brief:
- Obtain a spatial overlay of RCC sea walls. Include attributes for the significance or the cost of each wall, and its age or stage in the replacement cycle. Also include attributes for the sensitivity of each structure to storm tides and storm surges — for example, the height and tolerance of individual walls.
- Obtain spatial data for the infrastructure and communities exposed to damage when individual sea walls are overwhelmed or damaged.
- Obtain spatial data (hazard overlay) for storm tide heights and flooding. This will be embellished through GEMS modelling.
- Correlate the attributes of individual sea walls with storm tides and flooding to determine those most exposed and the consequences of increased risk of damage as a result of climate change.
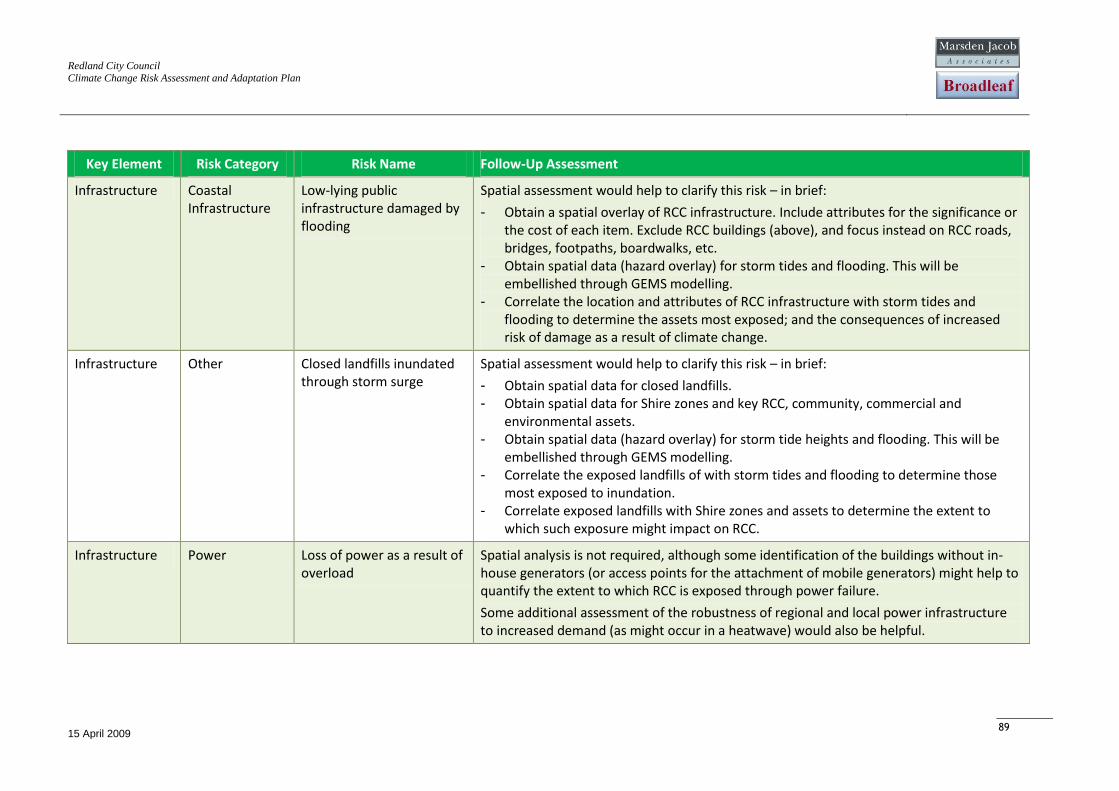
Redland City Council
Climate Change Risk Assessment and Adaptation Plan
15 April 2009
89
Key Element Risk Category Risk Name Follow-Up Assessment
Infrastructure Coastal Infrastructure
Low-lying public infrastructure damaged by flooding
Spatial assessment would help to clarify this risk – in brief:
- Obtain a spatial overlay of RCC infrastructure. Include attributes for the significance or the cost of each item. Exclude RCC buildings (above), and focus instead on RCC roads, bridges, footpaths, boardwalks, etc.
- Obtain spatial data (hazard overlay) for storm tides and flooding. This will be embellished through GEMS modelling.
- Correlate the location and attributes of RCC infrastructure with storm tides and flooding to determine the assets most exposed; and the consequences of increased risk of damage as a result of climate change.
Infrastructure Other Closed landfills inundated through storm surge
Spatial assessment would help to clarify this risk – in brief:
- Obtain spatial data for closed landfills. - Obtain spatial data for Shire zones and key RCC, community, commercial and
environmental assets. - Obtain spatial data (hazard overlay) for storm tide heights and flooding. This will be
embellished through GEMS modelling. - Correlate the exposed landfills of with storm tides and flooding to determine those
most exposed to inundation. - Correlate exposed landfills with Shire zones and assets to determine the extent to
which such exposure might impact on RCC.
Infrastructure Power Loss of power as a result of overload
Spatial analysis is not required, although some identification of the buildings without in-house generators (or access points for the attachment of mobile generators) might help to quantify the extent to which RCC is exposed through power failure.
Some additional assessment of the robustness of regional and local power infrastructure to increased demand (as might occur in a heatwave) would also be helpful.
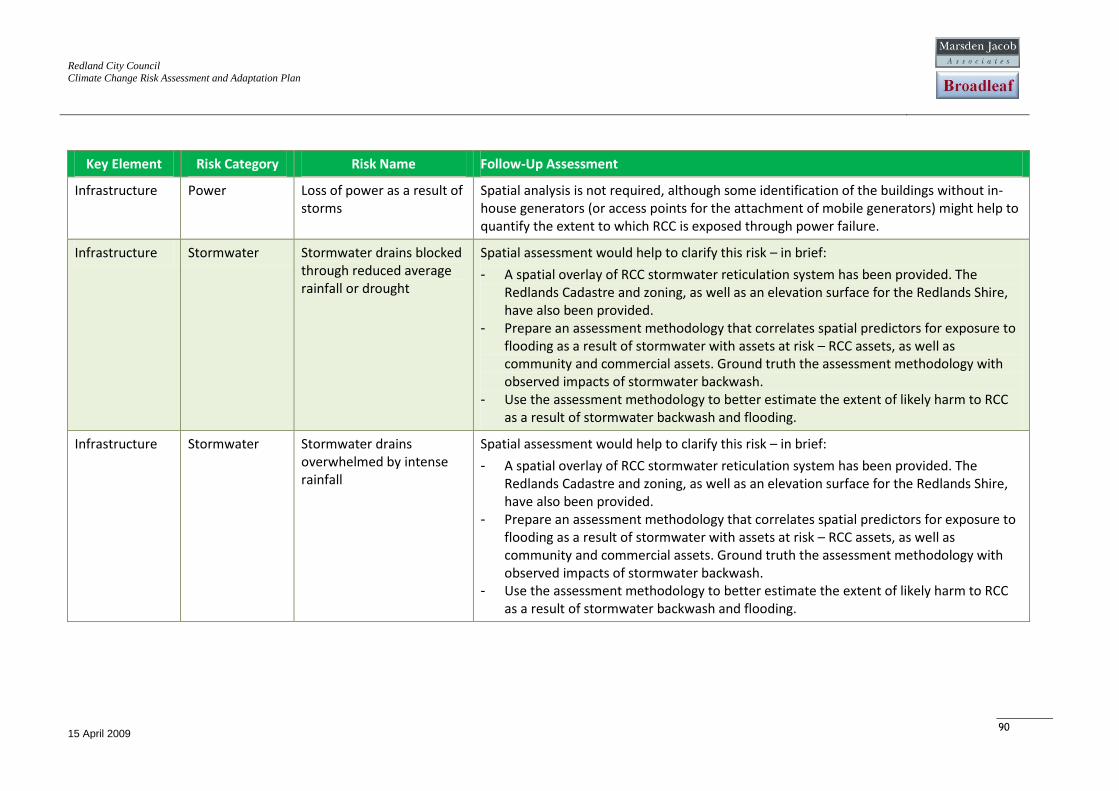
Redland City Council
Climate Change Risk Assessment and Adaptation Plan
15 April 2009
90
Key Element Risk Category Risk Name Follow-Up Assessment
Infrastructure Power Loss of power as a result of storms
Spatial analysis is not required, although some identification of the buildings without in-house generators (or access points for the attachment of mobile generators) might help to quantify the extent to which RCC is exposed through power failure.
Infrastructure Stormwater Stormwater drains blocked through reduced average rainfall or drought
Spatial assessment would help to clarify this risk – in brief:
- A spatial overlay of RCC stormwater reticulation system has been provided. The Redlands Cadastre and zoning, as well as an elevation surface for the Redlands Shire, have also been provided.
- Prepare an assessment methodology that correlates spatial predictors for exposure to flooding as a result of stormwater with assets at risk – RCC assets, as well as community and commercial assets. Ground truth the assessment methodology with observed impacts of stormwater backwash.
- Use the assessment methodology to better estimate the extent of likely harm to RCC as a result of stormwater backwash and flooding.
Infrastructure Stormwater Stormwater drains overwhelmed by intense rainfall
Spatial assessment would help to clarify this risk – in brief:
- A spatial overlay of RCC stormwater reticulation system has been provided. The Redlands Cadastre and zoning, as well as an elevation surface for the Redlands Shire, have also been provided.
- Prepare an assessment methodology that correlates spatial predictors for exposure to flooding as a result of stormwater with assets at risk – RCC assets, as well as community and commercial assets. Ground truth the assessment methodology with observed impacts of stormwater backwash.
- Use the assessment methodology to better estimate the extent of likely harm to RCC as a result of stormwater backwash and flooding.
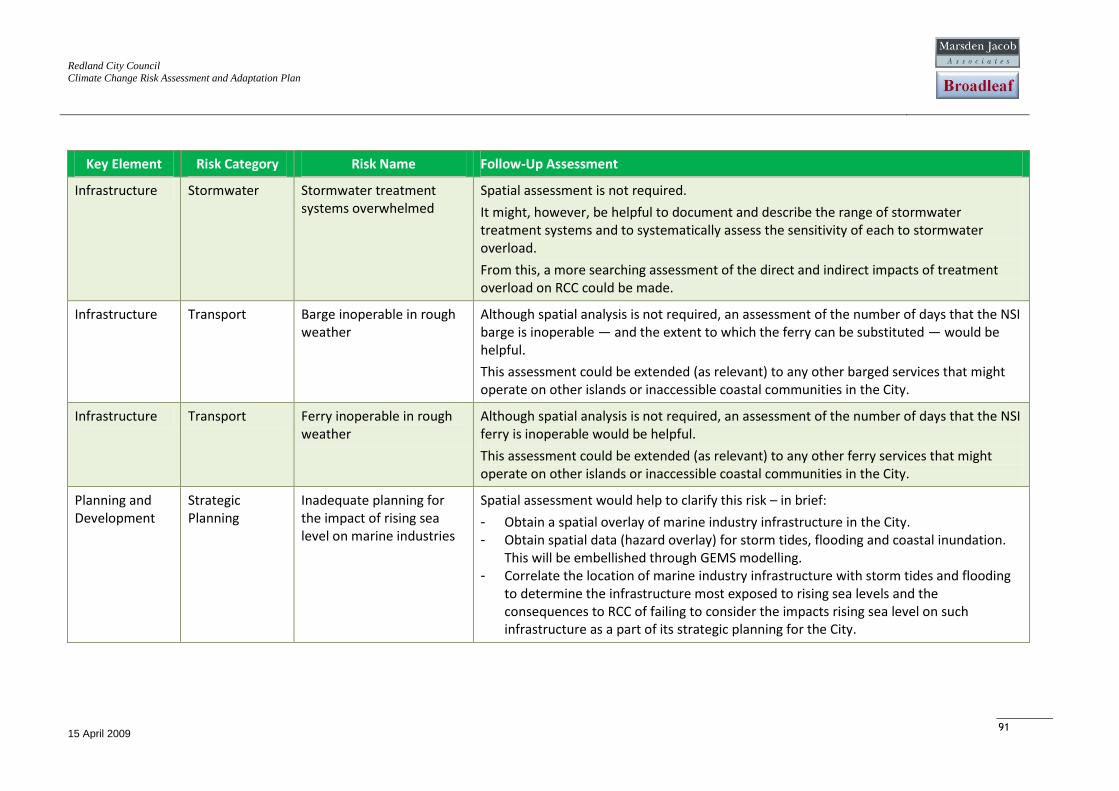
Redland City Council
Climate Change Risk Assessment and Adaptation Plan
15 April 2009
91
Key Element Risk Category Risk Name Follow-Up Assessment
Infrastructure Stormwater Stormwater treatment systems overwhelmed
Spatial assessment is not required.
It might, however, be helpful to document and describe the range of stormwater treatment systems and to systematically assess the sensitivity of each to stormwater overload.
From this, a more searching assessment of the direct and indirect impacts of treatment overload on RCC could be made.
Infrastructure Transport Barge inoperable in rough weather
Although spatial analysis is not required, an assessment of the number of days that the NSI barge is inoperable — and the extent to which the ferry can be substituted — would be helpful.
This assessment could be extended (as relevant) to any other barged services that might operate on other islands or inaccessible coastal communities in the City.
Infrastructure Transport Ferry inoperable in rough weather
Although spatial analysis is not required, an assessment of the number of days that the NSI ferry is inoperable would be helpful.
This assessment could be extended (as relevant) to any other ferry services that might operate on other islands or inaccessible coastal communities in the City.
Planning and Development
Strategic Planning
Inadequate planning for the impact of rising sea level on marine industries
Spatial assessment would help to clarify this risk – in brief:
- Obtain a spatial overlay of marine industry infrastructure in the City. - Obtain spatial data (hazard overlay) for storm tides, flooding and coastal inundation.
This will be embellished through GEMS modelling. - Correlate the location of marine industry infrastructure with storm tides and flooding
to determine the infrastructure most exposed to rising sea levels and the consequences to RCC of failing to consider the impacts rising sea level on such infrastructure as a part of its strategic planning for the City.
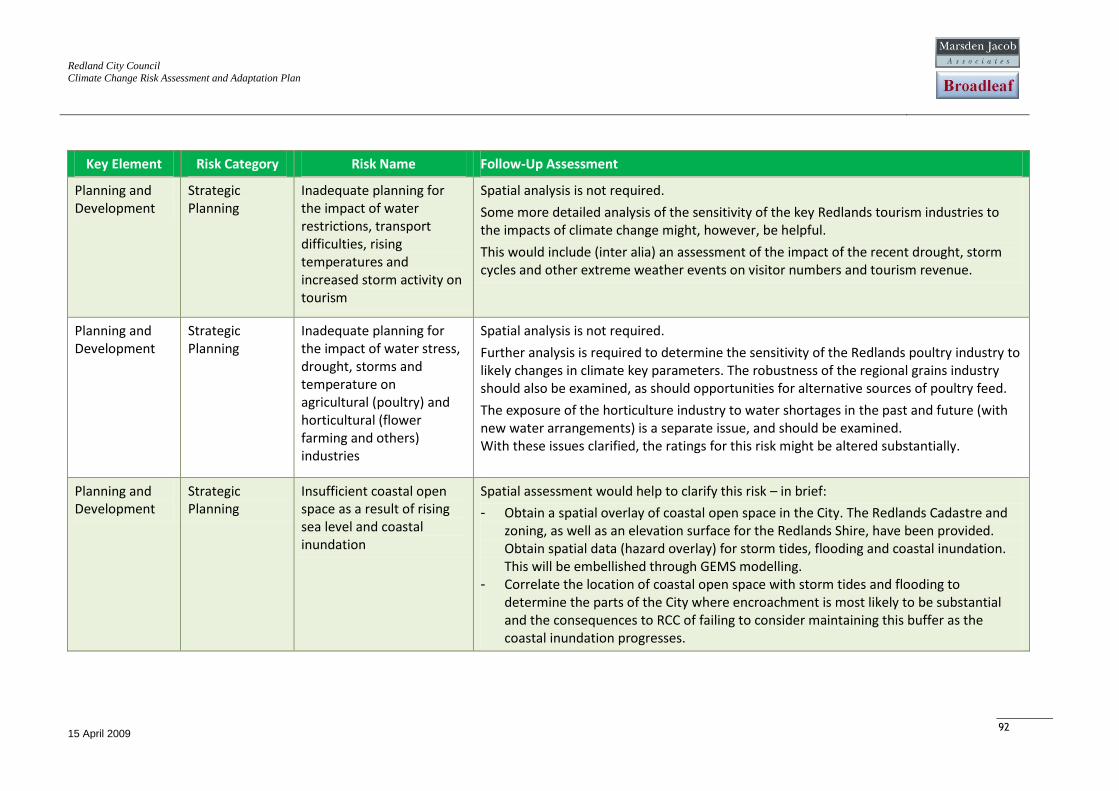
Redland City Council
Climate Change Risk Assessment and Adaptation Plan
15 April 2009
92
Key Element Risk Category Risk Name Follow-Up Assessment
Planning and Development
Strategic Planning
Inadequate planning for the impact of water restrictions, transport difficulties, rising temperatures and increased storm activity on tourism
Spatial analysis is not required.
Some more detailed analysis of the sensitivity of the key Redlands tourism industries to the impacts of climate change might, however, be helpful.
This would include (inter alia) an assessment of the impact of the recent drought, storm cycles and other extreme weather events on visitor numbers and tourism revenue.
Planning and Development
Strategic Planning
Inadequate planning for the impact of water stress, drought, storms and temperature on agricultural (poultry) and horticultural (flower farming and others) industries
Spatial analysis is not required.
Further analysis is required to determine the sensitivity of the Redlands poultry industry to likely changes in climate key parameters. The robustness of the regional grains industry should also be examined, as should opportunities for alternative sources of poultry feed.
The exposure of the horticulture industry to water shortages in the past and future (with new water arrangements) is a separate issue, and should be examined. With these issues clarified, the ratings for this risk might be altered substantially.
Planning and Development
Strategic Planning
Insufficient coastal open space as a result of rising sea level and coastal inundation
Spatial assessment would help to clarify this risk – in brief:
- Obtain a spatial overlay of coastal open space in the City. The Redlands Cadastre and zoning, as well as an elevation surface for the Redlands Shire, have been provided. Obtain spatial data (hazard overlay) for storm tides, flooding and coastal inundation. This will be embellished through GEMS modelling.
- Correlate the location of coastal open space with storm tides and flooding to determine the parts of the City where encroachment is most likely to be substantial and the consequences to RCC of failing to consider maintaining this buffer as the coastal inundation progresses.
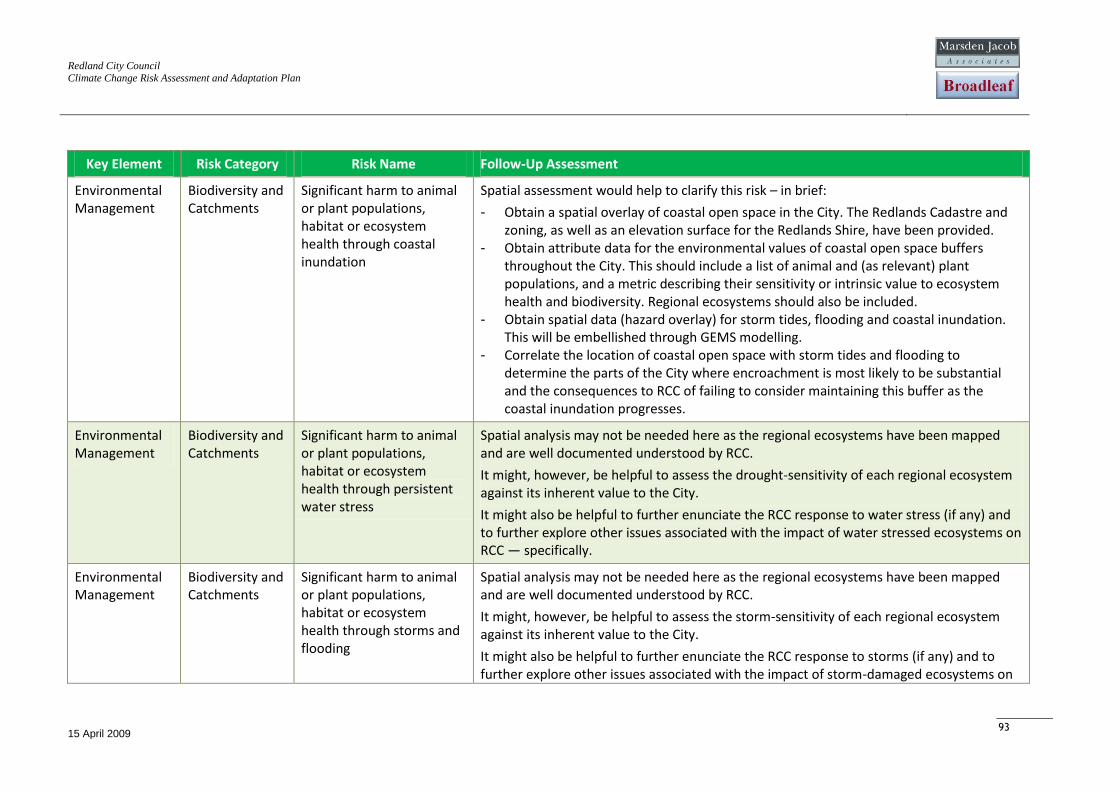
Redland City Council
Climate Change Risk Assessment and Adaptation Plan
15 April 2009
93
Key Element Risk Category Risk Name Follow-Up Assessment
Environmental Management
Biodiversity and Catchments
Significant harm to animal or plant populations, habitat or ecosystem health through coastal inundation
Spatial assessment would help to clarify this risk – in brief:
- Obtain a spatial overlay of coastal open space in the City. The Redlands Cadastre and zoning, as well as an elevation surface for the Redlands Shire, have been provided.
- Obtain attribute data for the environmental values of coastal open space buffers throughout the City. This should include a list of animal and (as relevant) plant populations, and a metric describing their sensitivity or intrinsic value to ecosystem health and biodiversity. Regional ecosystems should also be included.
- Obtain spatial data (hazard overlay) for storm tides, flooding and coastal inundation. This will be embellished through GEMS modelling.
- Correlate the location of coastal open space with storm tides and flooding to determine the parts of the City where encroachment is most likely to be substantial and the consequences to RCC of failing to consider maintaining this buffer as the coastal inundation progresses.
Environmental Management
Biodiversity and Catchments
Significant harm to animal or plant populations, habitat or ecosystem health through persistent water stress
Spatial analysis may not be needed here as the regional ecosystems have been mapped and are well documented understood by RCC.
It might, however, be helpful to assess the drought-sensitivity of each regional ecosystem against its inherent value to the City.
It might also be helpful to further enunciate the RCC response to water stress (if any) and to further explore other issues associated with the impact of water stressed ecosystems on RCC — specifically.
Environmental Management
Biodiversity and Catchments
Significant harm to animal or plant populations, habitat or ecosystem health through storms and flooding
Spatial analysis may not be needed here as the regional ecosystems have been mapped and are well documented understood by RCC.
It might, however, be helpful to assess the storm-sensitivity of each regional ecosystem against its inherent value to the City.
It might also be helpful to further enunciate the RCC response to storms (if any) and to further explore other issues associated with the impact of storm-damaged ecosystems on
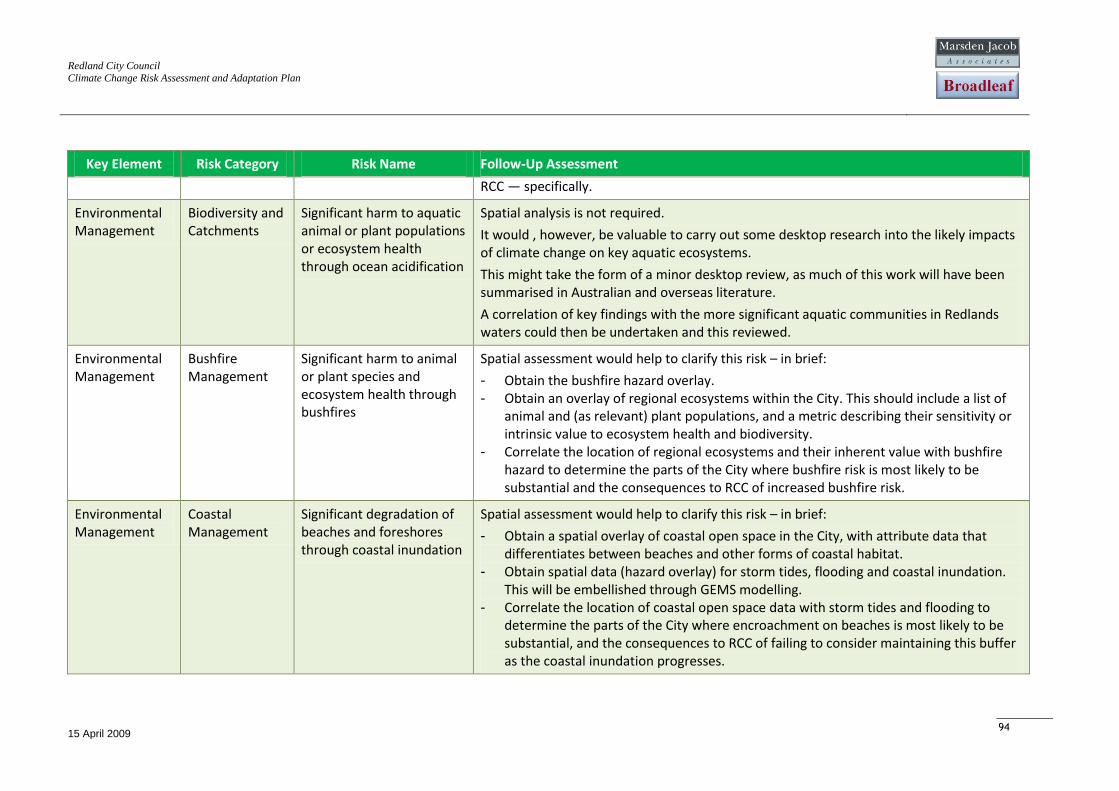
Redland City Council
Climate Change Risk Assessment and Adaptation Plan
15 April 2009
94
Key Element Risk Category Risk Name Follow-Up Assessment
RCC — specifically.
Environmental Management
Biodiversity and Catchments
Significant harm to aquatic animal or plant populations or ecosystem health through ocean acidification
Spatial analysis is not required.
It would , however, be valuable to carry out some desktop research into the likely impacts of climate change on key aquatic ecosystems.
This might take the form of a minor desktop review, as much of this work will have been summarised in Australian and overseas literature.
A correlation of key findings with the more significant aquatic communities in Redlands waters could then be undertaken and this reviewed.
Environmental Management
Bushfire Management
Significant harm to animal or plant species and ecosystem health through bushfires
Spatial assessment would help to clarify this risk – in brief:
- Obtain the bushfire hazard overlay. - Obtain an overlay of regional ecosystems within the City. This should include a list of
animal and (as relevant) plant populations, and a metric describing their sensitivity or intrinsic value to ecosystem health and biodiversity.
- Correlate the location of regional ecosystems and their inherent value with bushfire hazard to determine the parts of the City where bushfire risk is most likely to be substantial and the consequences to RCC of increased bushfire risk.
Environmental Management
Coastal Management
Significant degradation of beaches and foreshores through coastal inundation
Spatial assessment would help to clarify this risk – in brief:
- Obtain a spatial overlay of coastal open space in the City, with attribute data that differentiates between beaches and other forms of coastal habitat.
- Obtain spatial data (hazard overlay) for storm tides, flooding and coastal inundation. This will be embellished through GEMS modelling.
- Correlate the location of coastal open space data with storm tides and flooding to determine the parts of the City where encroachment on beaches is most likely to be substantial, and the consequences to RCC of failing to consider maintaining this buffer as the coastal inundation progresses.
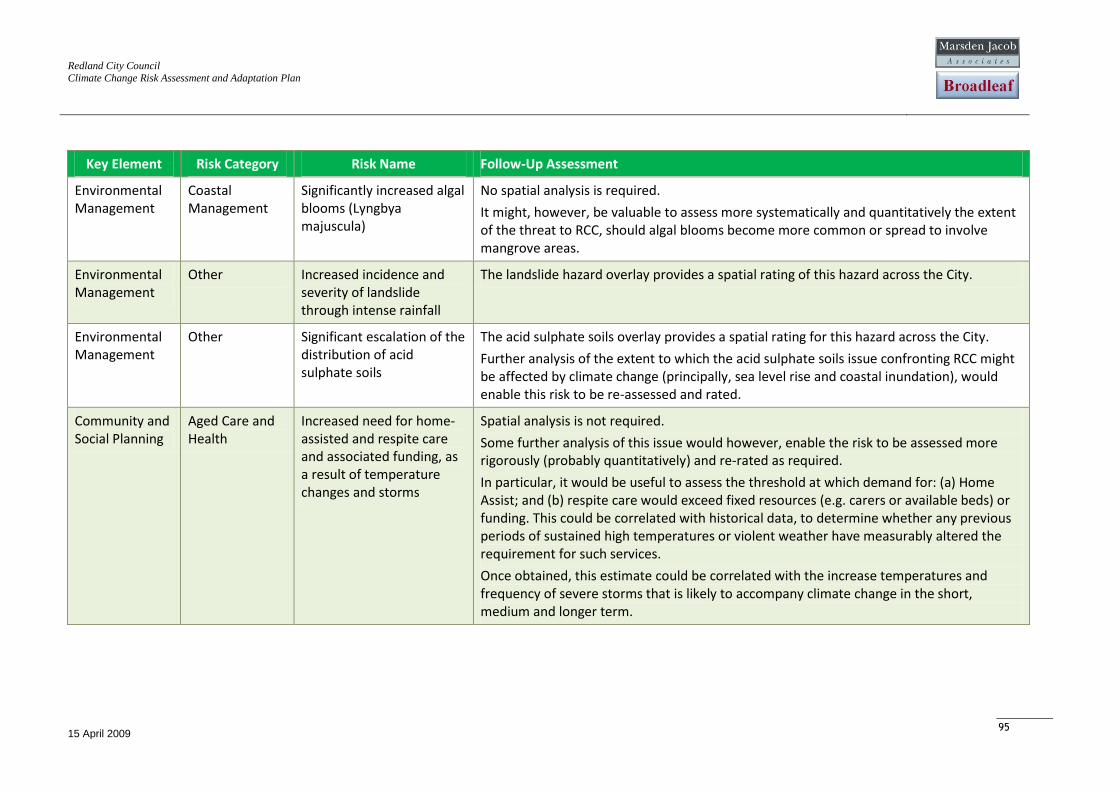
Redland City Council
Climate Change Risk Assessment and Adaptation Plan
15 April 2009
95
Key Element Risk Category Risk Name Follow-Up Assessment
Environmental Management
Coastal Management
Significantly increased algal blooms (Lyngbya majuscula)
No spatial analysis is required.
It might, however, be valuable to assess more systematically and quantitatively the extent of the threat to RCC, should algal blooms become more common or spread to involve mangrove areas.
Environmental Management
Other Increased incidence and severity of landslide through intense rainfall
The landslide hazard overlay provides a spatial rating of this hazard across the City.
Environmental Management
Other Significant escalation of the distribution of acid sulphate soils
The acid sulphate soils overlay provides a spatial rating for this hazard across the City.
Further analysis of the extent to which the acid sulphate soils issue confronting RCC might be affected by climate change (principally, sea level rise and coastal inundation), would enable this risk to be re-assessed and rated.
Community and Social Planning
Aged Care and Health
Increased need for home-assisted and respite care and associated funding, as a result of temperature changes and storms
Spatial analysis is not required.
Some further analysis of this issue would however, enable the risk to be assessed more rigorously (probably quantitatively) and re-rated as required.
In particular, it would be useful to assess the threshold at which demand for: (a) Home Assist; and (b) respite care would exceed fixed resources (e.g. carers or available beds) or funding. This could be correlated with historical data, to determine whether any previous periods of sustained high temperatures or violent weather have measurably altered the requirement for such services.
Once obtained, this estimate could be correlated with the increase temperatures and frequency of severe storms that is likely to accompany climate change in the short, medium and longer term.
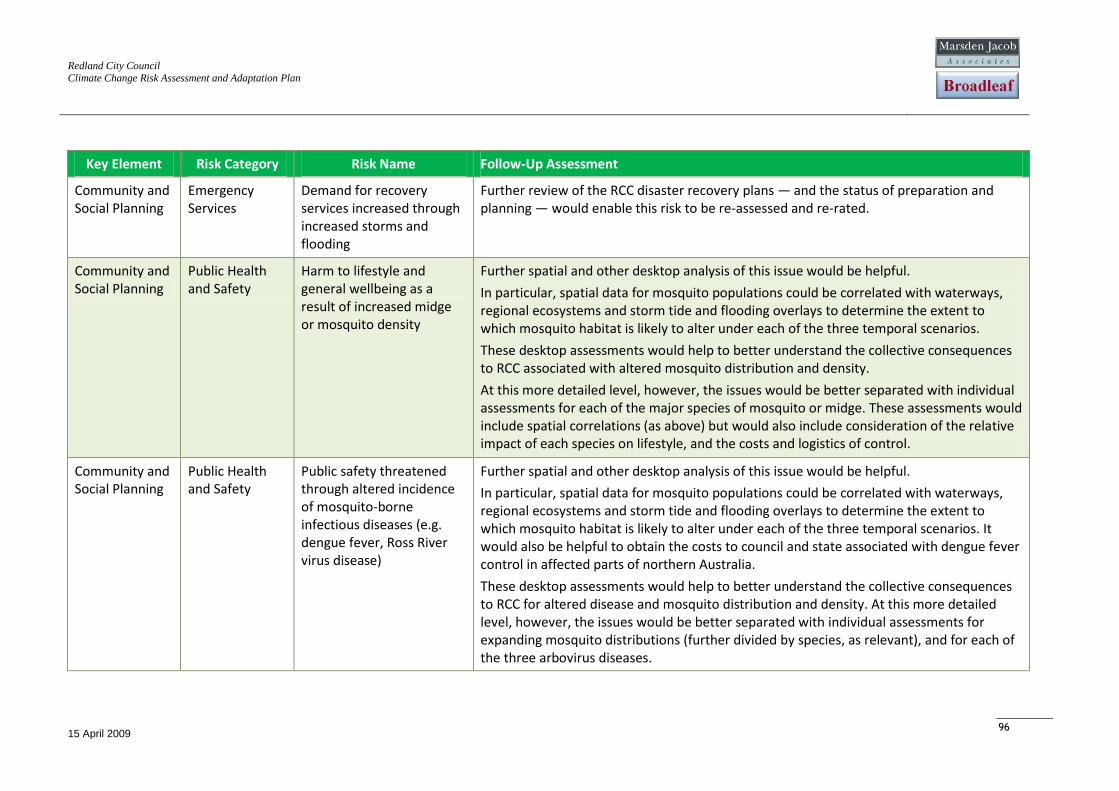
Redland City Council
Climate Change Risk Assessment and Adaptation Plan
15 April 2009
96
Key Element Risk Category Risk Name Follow-Up Assessment
Community and Social Planning
Emergency Services
Demand for recovery services increased through increased storms and flooding
Further review of the RCC disaster recovery plans — and the status of preparation and planning — would enable this risk to be re-assessed and re-rated.
Community and Social Planning
Public Health and Safety
Harm to lifestyle and general wellbeing as a result of increased midge or mosquito density
Further spatial and other desktop analysis of this issue would be helpful.
In particular, spatial data for mosquito populations could be correlated with waterways, regional ecosystems and storm tide and flooding overlays to determine the extent to which mosquito habitat is likely to alter under each of the three temporal scenarios.
These desktop assessments would help to better understand the collective consequences to RCC associated with altered mosquito distribution and density.
At this more detailed level, however, the issues would be better separated with individual assessments for each of the major species of mosquito or midge. These assessments would include spatial correlations (as above) but would also include consideration of the relative impact of each species on lifestyle, and the costs and logistics of control.
Community and Social Planning
Public Health and Safety
Public safety threatened through altered incidence of mosquito-borne infectious diseases (e.g. dengue fever, Ross River virus disease)
Further spatial and other desktop analysis of this issue would be helpful.
In particular, spatial data for mosquito populations could be correlated with waterways, regional ecosystems and storm tide and flooding overlays to determine the extent to which mosquito habitat is likely to alter under each of the three temporal scenarios. It would also be helpful to obtain the costs to council and state associated with dengue fever control in affected parts of northern Australia.
These desktop assessments would help to better understand the collective consequences to RCC for altered disease and mosquito distribution and density. At this more detailed level, however, the issues would be better separated with individual assessments for expanding mosquito distributions (further divided by species, as relevant), and for each of the three arbovirus diseases.
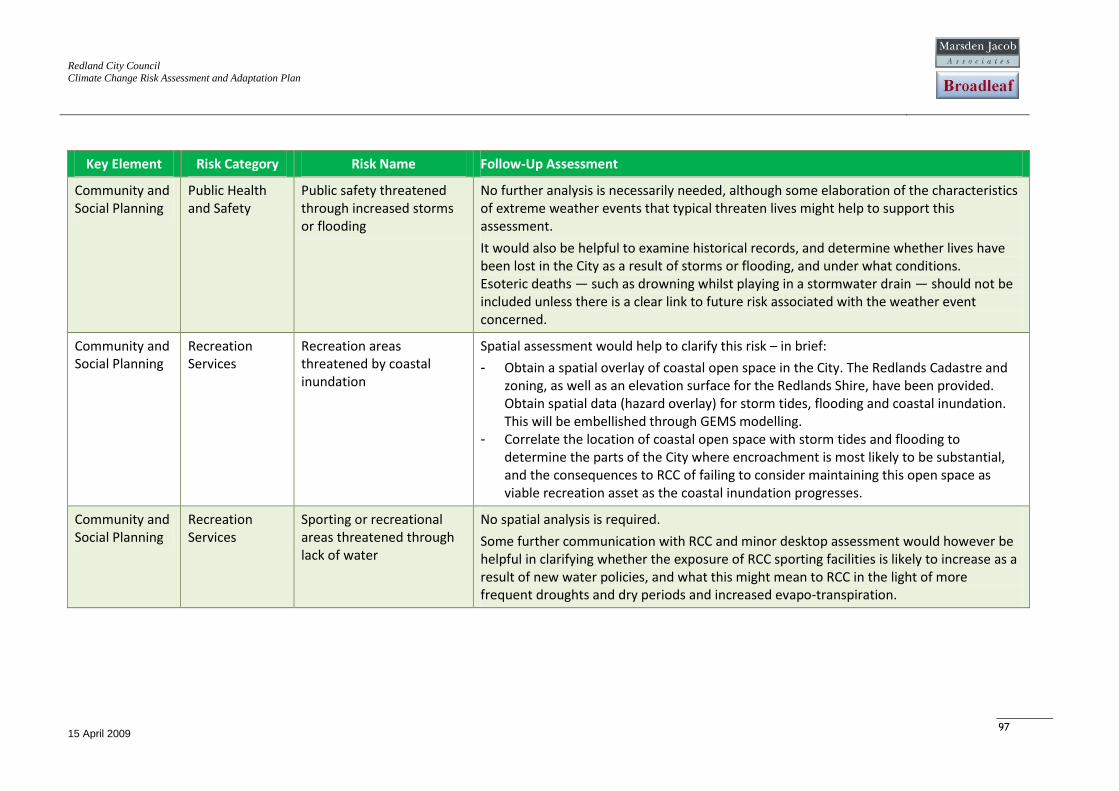
Redland City Council
Climate Change Risk Assessment and Adaptation Plan
15 April 2009
97
Key Element Risk Category Risk Name Follow-Up Assessment
Community and Social Planning
Public Health and Safety
Public safety threatened through increased storms or flooding
No further analysis is necessarily needed, although some elaboration of the characteristics of extreme weather events that typical threaten lives might help to support this assessment.
It would also be helpful to examine historical records, and determine whether lives have been lost in the City as a result of storms or flooding, and under what conditions. Esoteric deaths — such as drowning whilst playing in a stormwater drain — should not be included unless there is a clear link to future risk associated with the weather event concerned.
Community and Social Planning
Recreation Services
Recreation areas threatened by coastal inundation
Spatial assessment would help to clarify this risk – in brief:
- Obtain a spatial overlay of coastal open space in the City. The Redlands Cadastre and zoning, as well as an elevation surface for the Redlands Shire, have been provided. Obtain spatial data (hazard overlay) for storm tides, flooding and coastal inundation. This will be embellished through GEMS modelling.
- Correlate the location of coastal open space with storm tides and flooding to determine the parts of the City where encroachment is most likely to be substantial, and the consequences to RCC of failing to consider maintaining this open space as viable recreation asset as the coastal inundation progresses.
Community and Social Planning
Recreation Services
Sporting or recreational areas threatened through lack of water
No spatial analysis is required.
Some further communication with RCC and minor desktop assessment would however be helpful in clarifying whether the exposure of RCC sporting facilities is likely to increase as a result of new water policies, and what this might mean to RCC in the light of more frequent droughts and dry periods and increased evapo-transpiration.
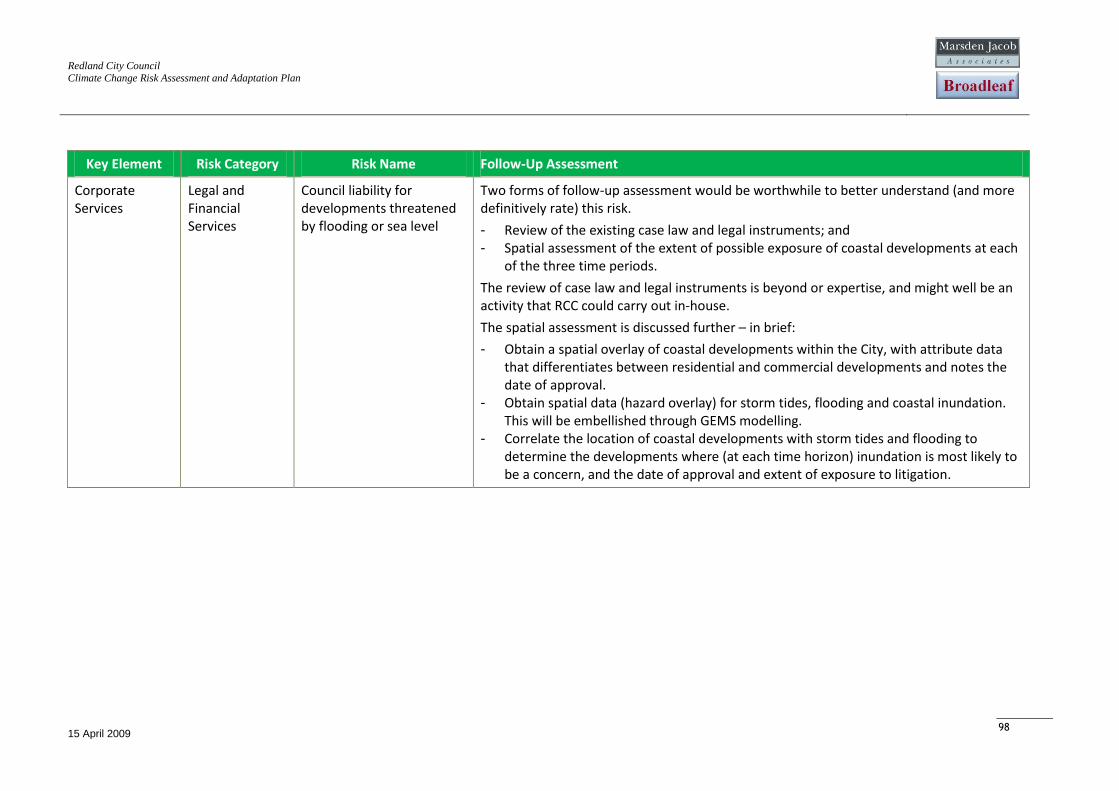
Redland City Council
Climate Change Risk Assessment and Adaptation Plan
15 April 2009
98
Key Element Risk Category Risk Name Follow-Up Assessment
Corporate Services
Legal and Financial Services
Council liability for developments threatened by flooding or sea level
Two forms of follow-up assessment would be worthwhile to better understand (and more definitively rate) this risk.
- Review of the existing case law and legal instruments; and - Spatial assessment of the extent of possible exposure of coastal developments at each
of the three time periods.
The review of case law and legal instruments is beyond or expertise, and might well be an activity that RCC could carry out in-house.
The spatial assessment is discussed further – in brief:
- Obtain a spatial overlay of coastal developments within the City, with attribute data that differentiates between residential and commercial developments and notes the date of approval.
- Obtain spatial data (hazard overlay) for storm tides, flooding and coastal inundation. This will be embellished through GEMS modelling.
- Correlate the location of coastal developments with storm tides and flooding to determine the developments where (at each time horizon) inundation is most likely to be a concern, and the date of approval and extent of exposure to litigation.
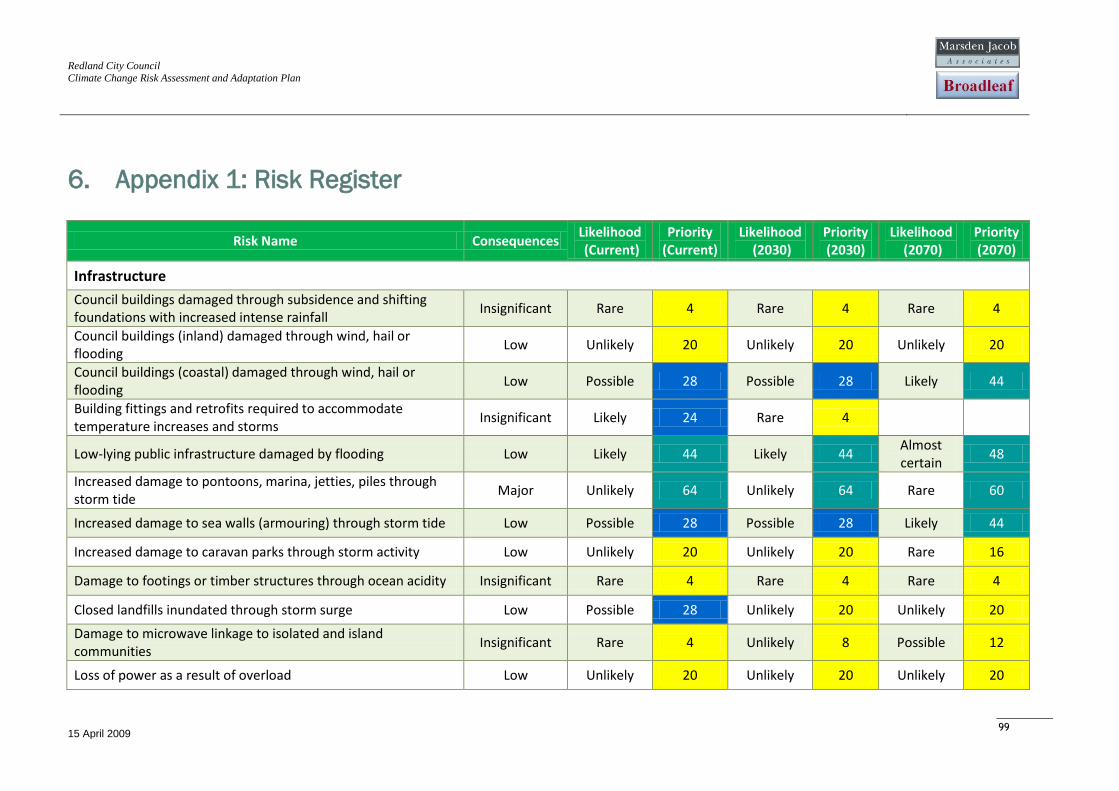
Redland City Council
Climate Change Risk Assessment and Adaptation Plan
15 April 2009
99
6. Appendix 1: Risk Register
Risk Name Consequences Likelihood (Current)
Priority (Current)
Likelihood (2030)
Priority (2030)
Likelihood (2070)
Priority (2070)
Infrastructure
Council buildings damaged through subsidence and shifting foundations with increased intense rainfall
Insignificant Rare 4 Rare 4 Rare 4
Council buildings (inland) damaged through wind, hail or flooding
Low Unlikely 20 Unlikely 20 Unlikely 20
Council buildings (coastal) damaged through wind, hail or flooding
Low Possible 28 Possible 28 Likely 44
Building fittings and retrofits required to accommodate temperature increases and storms
Insignificant Likely 24 Rare 4
Low-lying public infrastructure damaged by flooding Low Likely 44 Likely 44 Almost certain
48
Increased damage to pontoons, marina, jetties, piles through storm tide
Major Unlikely 64 Unlikely 64 Rare 60
Increased damage to sea walls (armouring) through storm tide Low Possible 28 Possible 28 Likely 44
Increased damage to caravan parks through storm activity Low Unlikely 20 Unlikely 20 Rare 16
Damage to footings or timber structures through ocean acidity Insignificant Rare 4 Rare 4 Rare 4
Closed landfills inundated through storm surge Low Possible 28 Unlikely 20 Unlikely 20
Damage to microwave linkage to isolated and island communities
Insignificant Rare 4 Unlikely 8 Possible 12
Loss of power as a result of overload Low Unlikely 20 Unlikely 20 Unlikely 20
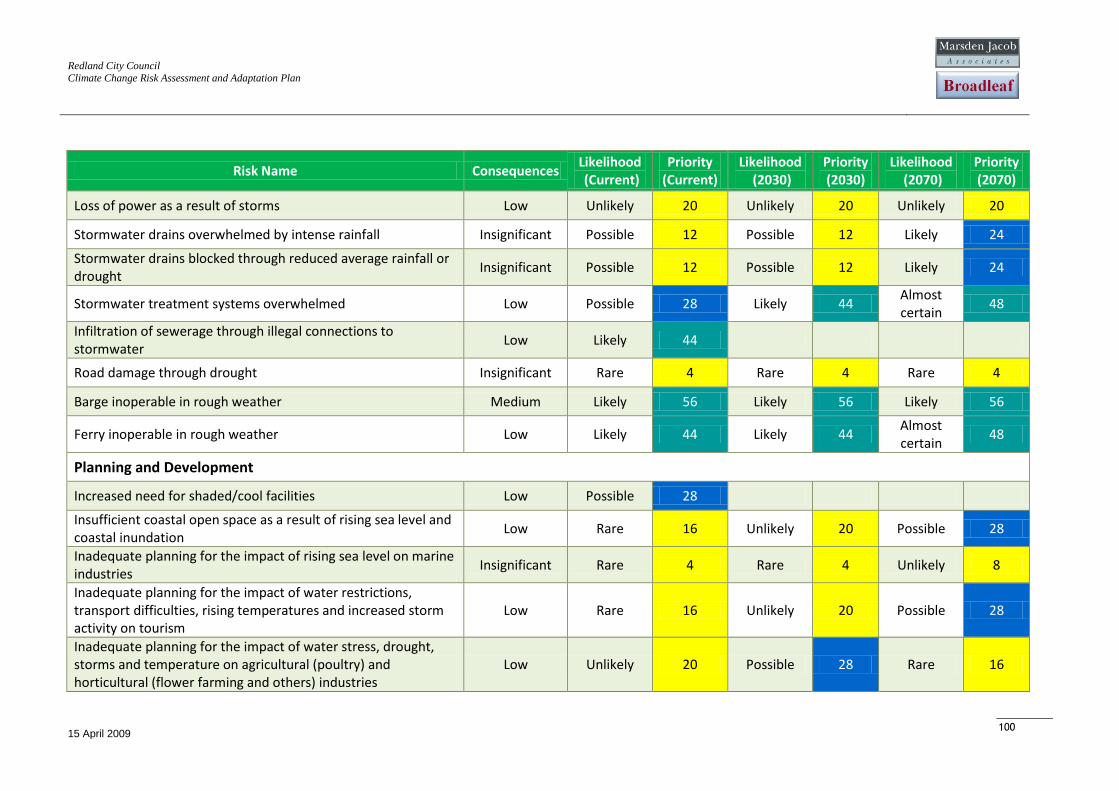
Redland City Council
Climate Change Risk Assessment and Adaptation Plan
15 April 2009
100
Risk Name Consequences Likelihood (Current)
Priority (Current)
Likelihood (2030)
Priority (2030)
Likelihood (2070)
Priority (2070)
Loss of power as a result of storms Low Unlikely 20 Unlikely 20 Unlikely 20
Stormwater drains overwhelmed by intense rainfall Insignificant Possible 12 Possible 12 Likely 24
Stormwater drains blocked through reduced average rainfall or drought
Insignificant Possible 12 Possible 12 Likely 24
Stormwater treatment systems overwhelmed Low Possible 28 Likely 44 Almost certain
48
Infiltration of sewerage through illegal connections to stormwater
Low Likely 44
Road damage through drought Insignificant Rare 4 Rare 4 Rare 4
Barge inoperable in rough weather Medium Likely 56 Likely 56 Likely 56
Ferry inoperable in rough weather Low Likely 44 Likely 44 Almost certain
48
Planning and Development
Increased need for shaded/cool facilities Low Possible 28
Insufficient coastal open space as a result of rising sea level and coastal inundation
Low Rare 16 Unlikely 20 Possible 28
Inadequate planning for the impact of rising sea level on marine industries
Insignificant Rare 4 Rare 4 Unlikely 8
Inadequate planning for the impact of water restrictions, transport difficulties, rising temperatures and increased storm activity on tourism
Low Rare 16 Unlikely 20 Possible 28
Inadequate planning for the impact of water stress, drought, storms and temperature on agricultural (poultry) and horticultural (flower farming and others) industries
Low Unlikely 20 Possible 28 Rare 16
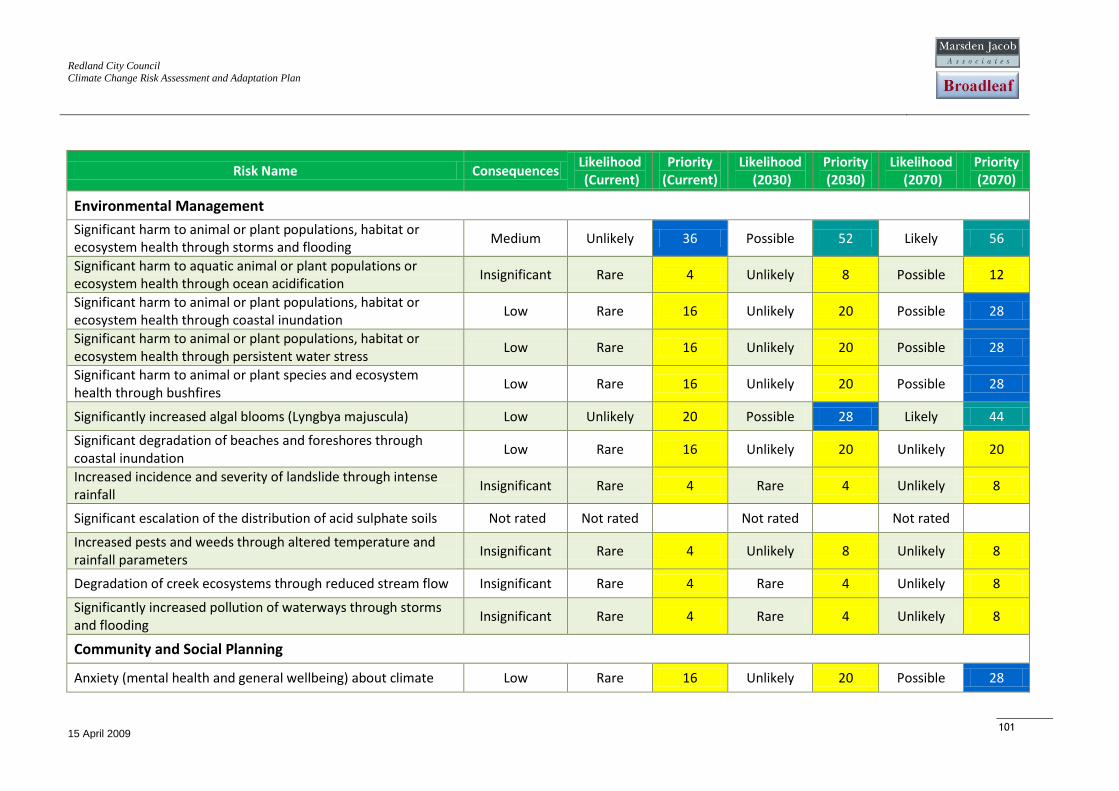
Redland City Council
Climate Change Risk Assessment and Adaptation Plan
15 April 2009
101
Risk Name Consequences Likelihood (Current)
Priority (Current)
Likelihood (2030)
Priority (2030)
Likelihood (2070)
Priority (2070)
Environmental Management
Significant harm to animal or plant populations, habitat or ecosystem health through storms and flooding
Medium Unlikely 36 Possible 52 Likely 56
Significant harm to aquatic animal or plant populations or ecosystem health through ocean acidification
Insignificant Rare 4 Unlikely 8 Possible 12
Significant harm to animal or plant populations, habitat or ecosystem health through coastal inundation
Low Rare 16 Unlikely 20 Possible 28
Significant harm to animal or plant populations, habitat or ecosystem health through persistent water stress
Low Rare 16 Unlikely 20 Possible 28
Significant harm to animal or plant species and ecosystem health through bushfires
Low Rare 16 Unlikely 20 Possible 28
Significantly increased algal blooms (Lyngbya majuscula) Low Unlikely 20 Possible 28 Likely 44
Significant degradation of beaches and foreshores through coastal inundation
Low Rare 16 Unlikely 20 Unlikely 20
Increased incidence and severity of landslide through intense rainfall
Insignificant Rare 4 Rare 4 Unlikely 8
Significant escalation of the distribution of acid sulphate soils Not rated Not rated
Not rated
Not rated
Increased pests and weeds through altered temperature and rainfall parameters
Insignificant Rare 4 Unlikely 8 Unlikely 8
Degradation of creek ecosystems through reduced stream flow Insignificant Rare 4 Rare 4 Unlikely 8
Significantly increased pollution of waterways through storms and flooding
Insignificant Rare 4 Rare 4 Unlikely 8
Community and Social Planning
Anxiety (mental health and general wellbeing) about climate Low Rare 16 Unlikely 20 Possible 28
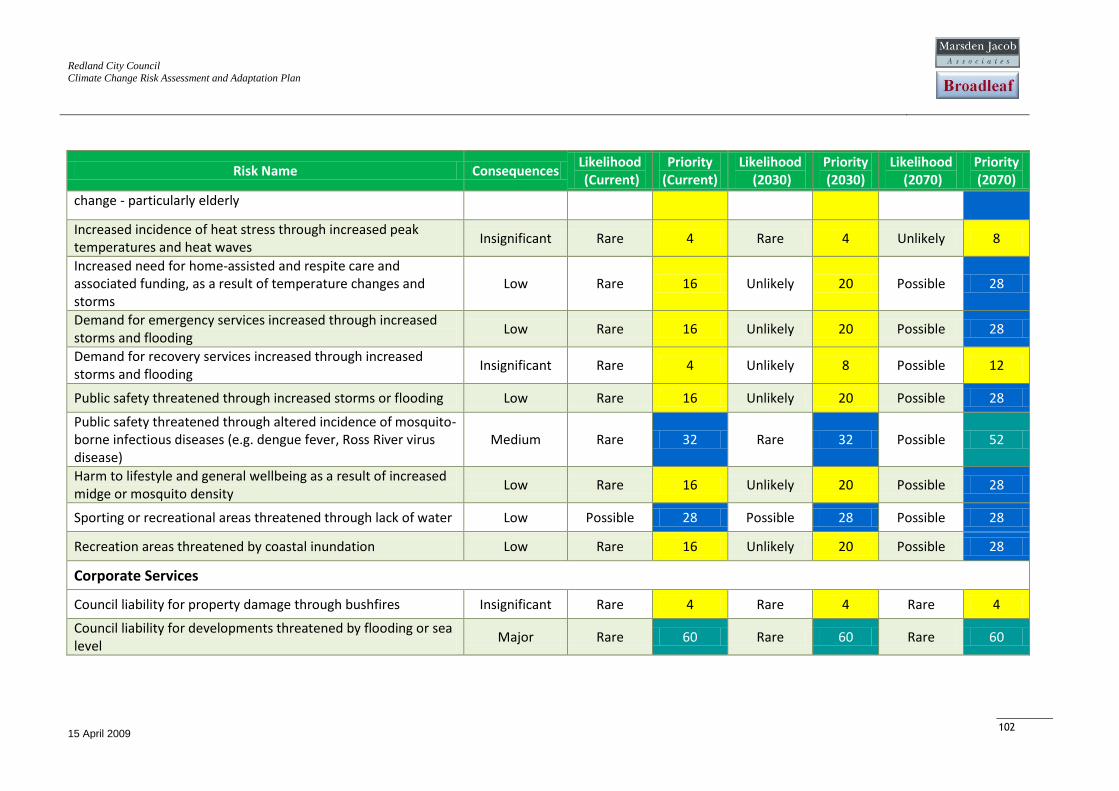
Redland City Council
Climate Change Risk Assessment and Adaptation Plan
15 April 2009
102
Risk Name Consequences Likelihood (Current)
Priority (Current)
Likelihood (2030)
Priority (2030)
Likelihood (2070)
Priority (2070)
change - particularly elderly
Increased incidence of heat stress through increased peak temperatures and heat waves
Insignificant Rare 4 Rare 4 Unlikely 8
Increased need for home-assisted and respite care and associated funding, as a result of temperature changes and storms
Low Rare 16 Unlikely 20 Possible 28
Demand for emergency services increased through increased storms and flooding
Low Rare 16 Unlikely 20 Possible 28
Demand for recovery services increased through increased storms and flooding
Insignificant Rare 4 Unlikely 8 Possible 12
Public safety threatened through increased storms or flooding Low Rare 16 Unlikely 20 Possible 28
Public safety threatened through altered incidence of mosquito-borne infectious diseases (e.g. dengue fever, Ross River virus disease)
Medium Rare 32 Rare 32 Possible 52
Harm to lifestyle and general wellbeing as a result of increased midge or mosquito density
Low Rare 16 Unlikely 20 Possible 28
Sporting or recreational areas threatened through lack of water Low Possible 28 Possible 28 Possible 28
Recreation areas threatened by coastal inundation Low Rare 16 Unlikely 20 Possible 28
Corporate Services
Council liability for property damage through bushfires Insignificant Rare 4 Rare 4 Rare 4
Council liability for developments threatened by flooding or sea level
Major Rare 60 Rare 60 Rare 60
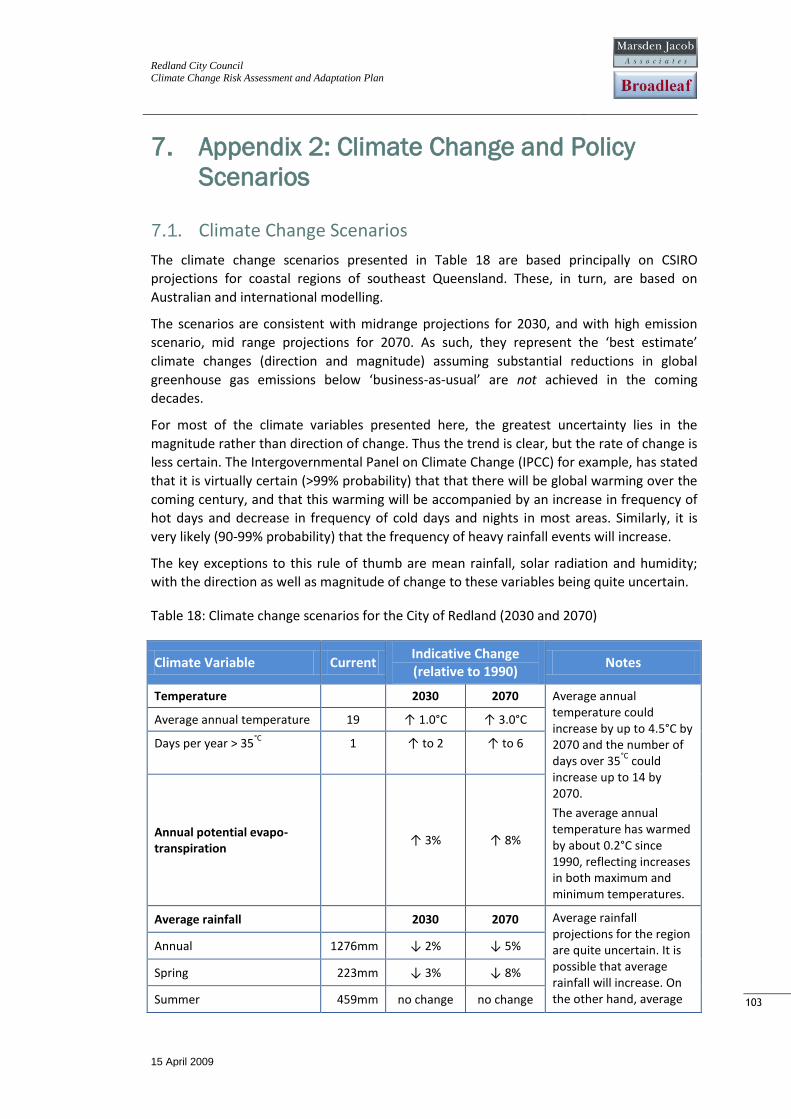
Redland City Council
Climate Change Risk Assessment and Adaptation Plan
15 April 2009
103
103
7. Appendix 2: Climate Change and Policy
Scenarios
7.1. Climate Change Scenarios
The climate change scenarios presented in Table 18 are based principally on CSIRO
projections for coastal regions of southeast Queensland. These, in turn, are based on
Australian and international modelling.
The scenarios are consistent with midrange projections for 2030, and with high emission
scenario, mid range projections for 2070. As such, they represent the ‘best estimate’
climate changes (direction and magnitude) assuming substantial reductions in global
greenhouse gas emissions below ‘business-as-usual’ are not achieved in the coming
decades.
For most of the climate variables presented here, the greatest uncertainty lies in the
magnitude rather than direction of change. Thus the trend is clear, but the rate of change is
less certain. The Intergovernmental Panel on Climate Change (IPCC) for example, has stated
that it is virtually certain (>99% probability) that that there will be global warming over the
coming century, and that this warming will be accompanied by an increase in frequency of
hot days and decrease in frequency of cold days and nights in most areas. Similarly, it is
very likely (90-99% probability) that the frequency of heavy rainfall events will increase.
The key exceptions to this rule of thumb are mean rainfall, solar radiation and humidity;
with the direction as well as magnitude of change to these variables being quite uncertain.
Table 18: Climate change scenarios for the City of Redland (2030 and 2070)
Climate Variable Current Indicative Change (relative to 1990)
Notes
Temperature 2030 2070 Average annual temperature could increase by up to 4.5°C by 2070 and the number of days over 35
°C could
increase up to 14 by 2070.
The average annual temperature has warmed by about 0.2°C since 1990, reflecting increases in both maximum and minimum temperatures.
Average annual temperature 19 ↑ 1.0°C ↑ 3.0°C
Days per year > 35°C
1 ↑ to 2 ↑ to 6
Annual potential evapo-transpiration
↑ 3% ↑ 8%
Average rainfall 2030 2070 Average rainfall projections for the region are quite uncertain. It is possible that average rainfall will increase. On the other hand, average
Annual 1276mm ↓ 2% ↓ 5%
Spring 223mm ↓ 3% ↓ 8%
Summer 459mm no change no change
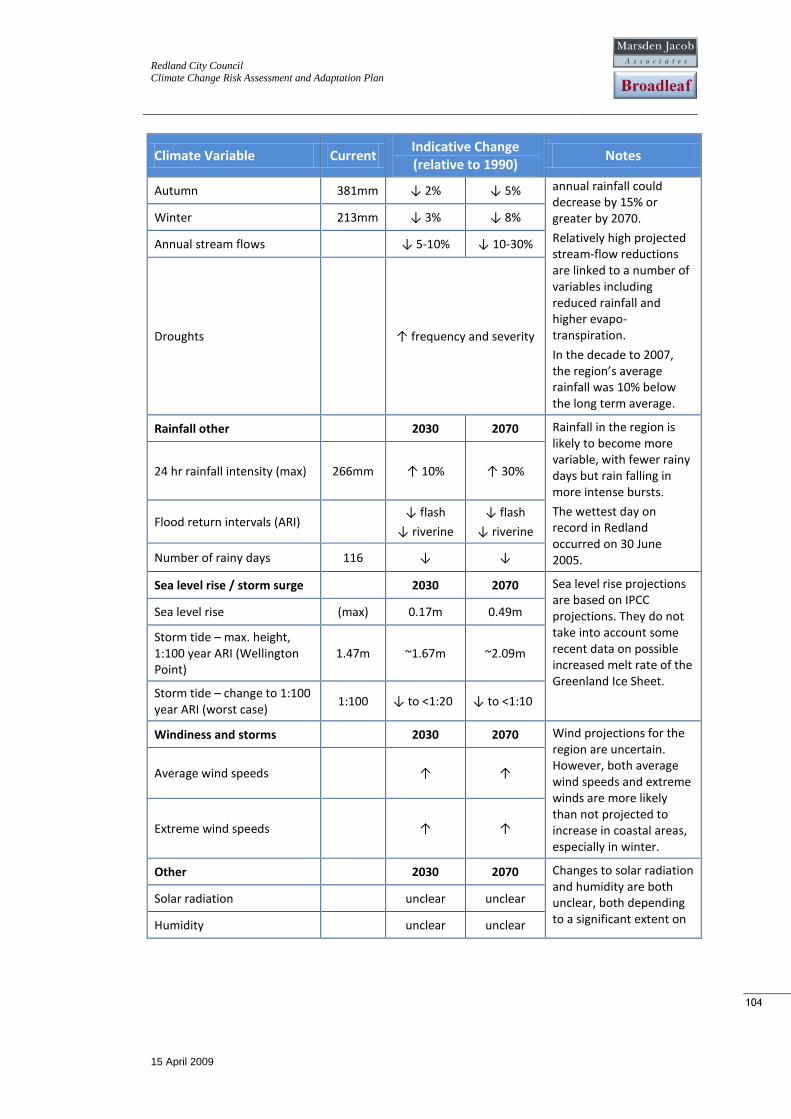
Redland City Council
Climate Change Risk Assessment and Adaptation Plan
15 April 2009
104
104
Climate Variable Current Indicative Change (relative to 1990)
Notes
Autumn 381mm ↓ 2% ↓ 5% annual rainfall could decrease by 15% or greater by 2070.
Relatively high projected stream-flow reductions are linked to a number of variables including reduced rainfall and higher evapo-transpiration.
In the decade to 2007, the region’s average rainfall was 10% below the long term average.
Winter 213mm ↓ 3% ↓ 8%
Annual stream flows ↓ 5-10% ↓ 10-30%
Droughts ↑ frequency and severity
Rainfall other 2030 2070 Rainfall in the region is likely to become more variable, with fewer rainy days but rain falling in more intense bursts.
The wettest day on record in Redland occurred on 30 June 2005.
24 hr rainfall intensity (max) 266mm ↑ 10% ↑ 30%
Flood return intervals (ARI) ↓ flash
↓ riverine
↓ flash
↓ riverine
Number of rainy days 116 ↓ ↓
Sea level rise / storm surge 2030 2070 Sea level rise projections are based on IPCC projections. They do not take into account some recent data on possible increased melt rate of the Greenland Ice Sheet.
Sea level rise (max) 0.17m 0.49m
Storm tide – max. height, 1:100 year ARI (Wellington Point)
1.47m ~1.67m ~2.09m
Storm tide – change to 1:100 year ARI (worst case)
1:100 ↓ to <1:20 ↓ to <1:10
Windiness and storms 2030 2070 Wind projections for the region are uncertain. However, both average wind speeds and extreme winds are more likely than not projected to increase in coastal areas, especially in winter.
Average wind speeds ↑ ↑
Extreme wind speeds ↑ ↑
Other 2030 2070 Changes to solar radiation and humidity are both unclear, both depending to a significant extent on
Solar radiation unclear unclear
Humidity unclear unclear
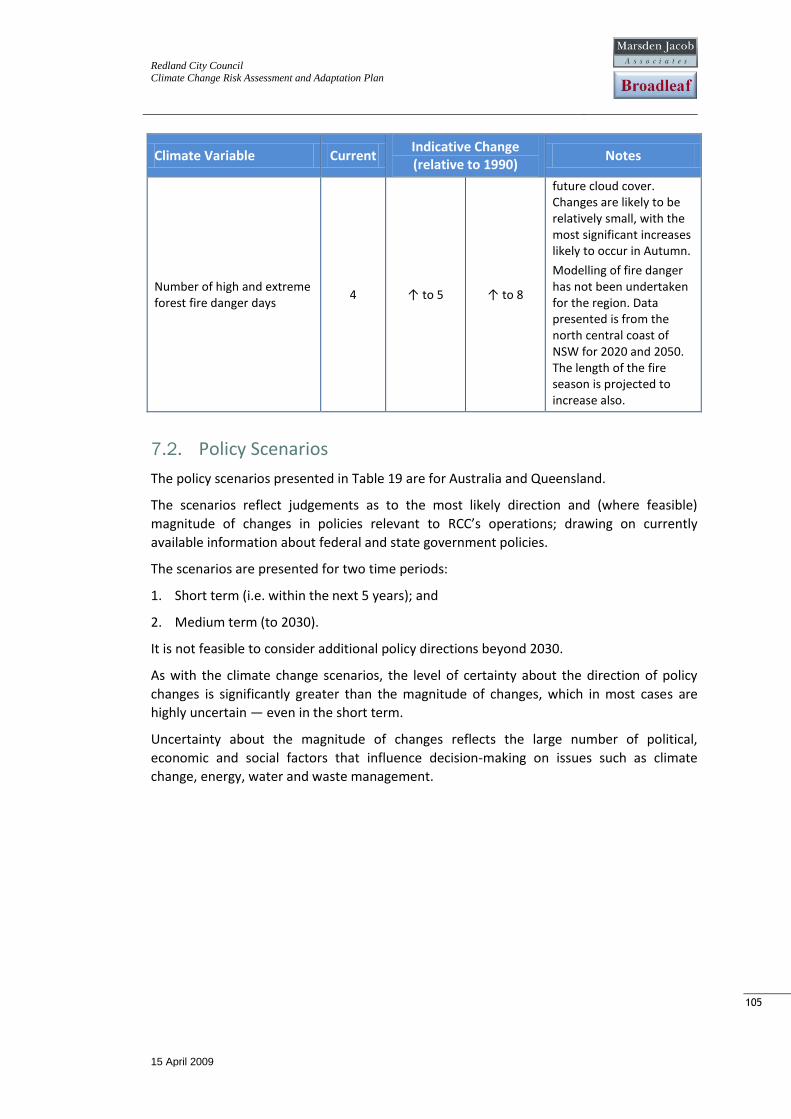
Redland City Council
Climate Change Risk Assessment and Adaptation Plan
15 April 2009
105
105
Climate Variable Current Indicative Change (relative to 1990)
Notes
Number of high and extreme forest fire danger days
4 ↑ to 5 ↑ to 8
future cloud cover. Changes are likely to be relatively small, with the most significant increases likely to occur in Autumn.
Modelling of fire danger has not been undertaken for the region. Data presented is from the north central coast of NSW for 2020 and 2050. The length of the fire season is projected to increase also.
7.2. Policy Scenarios
The policy scenarios presented in Table 19 are for Australia and Queensland.
The scenarios reflect judgements as to the most likely direction and (where feasible)
magnitude of changes in policies relevant to RCC’s operations; drawing on currently
available information about federal and state government policies.
The scenarios are presented for two time periods:
1. Short term (i.e. within the next 5 years); and
2. Medium term (to 2030).
It is not feasible to consider additional policy directions beyond 2030.
As with the climate change scenarios, the level of certainty about the direction of policy
changes is significantly greater than the magnitude of changes, which in most cases are
highly uncertain — even in the short term.
Uncertainty about the magnitude of changes reflects the large number of political,
economic and social factors that influence decision-making on issues such as climate
change, energy, water and waste management.
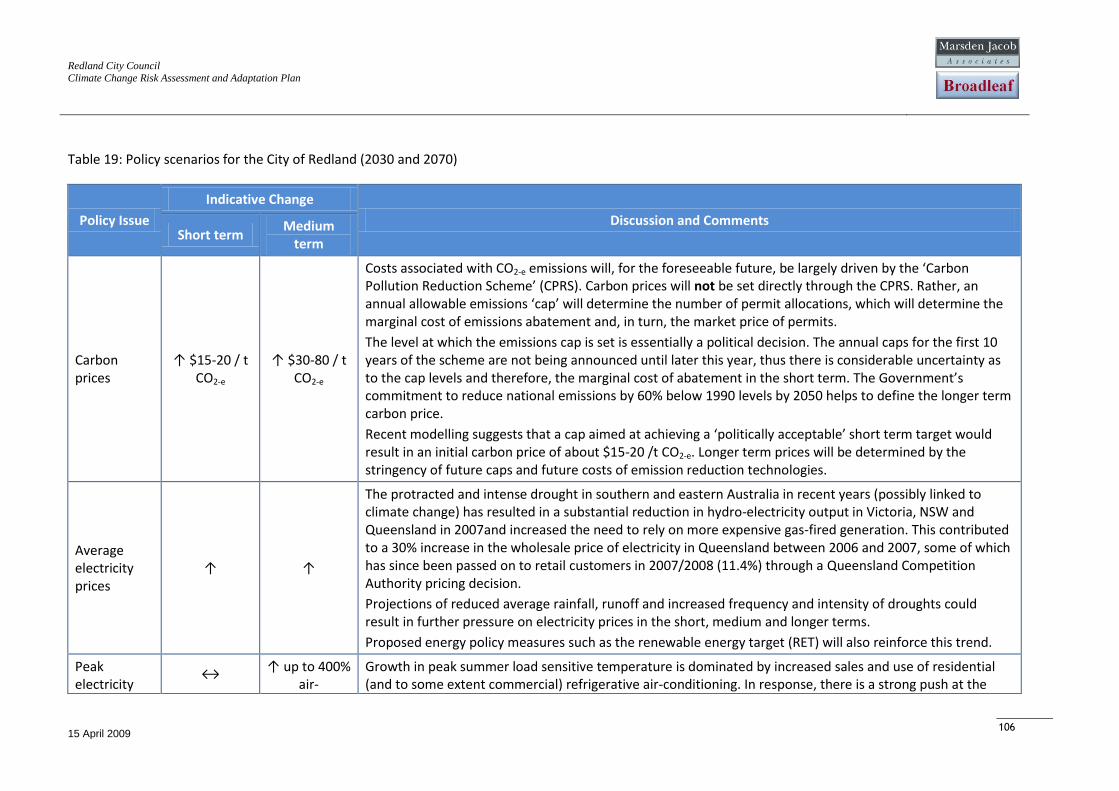
Redland City Council
Climate Change Risk Assessment and Adaptation Plan
15 April 2009
106
Table 19: Policy scenarios for the City of Redland (2030 and 2070)
Policy Issue
Indicative Change
Discussion and Comments Short term
Medium term
Carbon prices
↑ $15-20 / t CO2-e
↑ $30-80 / t CO2-e
Costs associated with CO2-e emissions will, for the foreseeable future, be largely driven by the ‘Carbon Pollution Reduction Scheme’ (CPRS). Carbon prices will not be set directly through the CPRS. Rather, an annual allowable emissions ‘cap’ will determine the number of permit allocations, which will determine the marginal cost of emissions abatement and, in turn, the market price of permits.
The level at which the emissions cap is set is essentially a political decision. The annual caps for the first 10 years of the scheme are not being announced until later this year, thus there is considerable uncertainty as to the cap levels and therefore, the marginal cost of abatement in the short term. The Government’s commitment to reduce national emissions by 60% below 1990 levels by 2050 helps to define the longer term carbon price.
Recent modelling suggests that a cap aimed at achieving a ‘politically acceptable’ short term target would result in an initial carbon price of about $15-20 /t CO2-e. Longer term prices will be determined by the stringency of future caps and future costs of emission reduction technologies.
Average electricity prices
↑ ↑
The protracted and intense drought in southern and eastern Australia in recent years (possibly linked to climate change) has resulted in a substantial reduction in hydro-electricity output in Victoria, NSW and Queensland in 2007and increased the need to rely on more expensive gas-fired generation. This contributed to a 30% increase in the wholesale price of electricity in Queensland between 2006 and 2007, some of which has since been passed on to retail customers in 2007/2008 (11.4%) through a Queensland Competition Authority pricing decision.
Projections of reduced average rainfall, runoff and increased frequency and intensity of droughts could result in further pressure on electricity prices in the short, medium and longer terms.
Proposed energy policy measures such as the renewable energy target (RET) will also reinforce this trend.
Peak electricity
↔ ↑ up to 400%
air-Growth in peak summer load sensitive temperature is dominated by increased sales and use of residential (and to some extent commercial) refrigerative air-conditioning. In response, there is a strong push at the
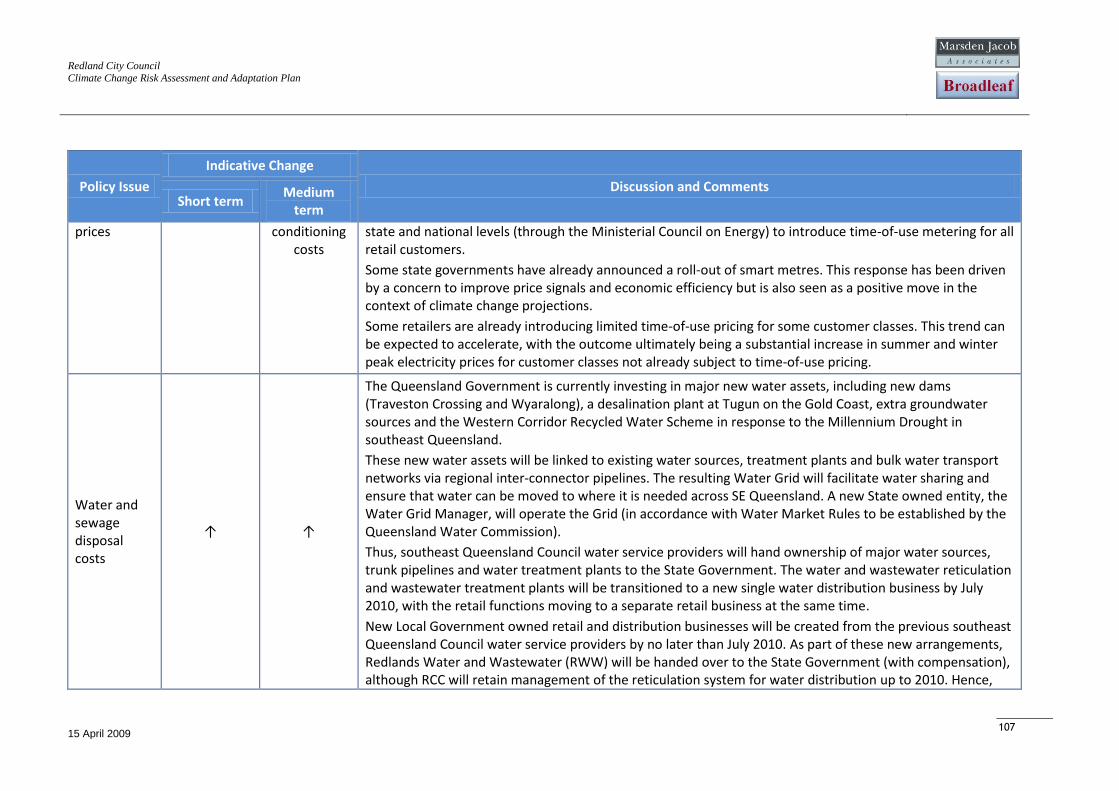
Redland City Council
Climate Change Risk Assessment and Adaptation Plan
15 April 2009
107
Policy Issue
Indicative Change
Discussion and Comments Short term
Medium term
prices conditioning costs
state and national levels (through the Ministerial Council on Energy) to introduce time-of-use metering for all retail customers.
Some state governments have already announced a roll-out of smart metres. This response has been driven by a concern to improve price signals and economic efficiency but is also seen as a positive move in the context of climate change projections.
Some retailers are already introducing limited time-of-use pricing for some customer classes. This trend can be expected to accelerate, with the outcome ultimately being a substantial increase in summer and winter peak electricity prices for customer classes not already subject to time-of-use pricing.
Water and sewage disposal costs
↑ ↑
The Queensland Government is currently investing in major new water assets, including new dams (Traveston Crossing and Wyaralong), a desalination plant at Tugun on the Gold Coast, extra groundwater sources and the Western Corridor Recycled Water Scheme in response to the Millennium Drought in southeast Queensland.
These new water assets will be linked to existing water sources, treatment plants and bulk water transport networks via regional inter-connector pipelines. The resulting Water Grid will facilitate water sharing and ensure that water can be moved to where it is needed across SE Queensland. A new State owned entity, the Water Grid Manager, will operate the Grid (in accordance with Water Market Rules to be established by the Queensland Water Commission).
Thus, southeast Queensland Council water service providers will hand ownership of major water sources, trunk pipelines and water treatment plants to the State Government. The water and wastewater reticulation and wastewater treatment plants will be transitioned to a new single water distribution business by July 2010, with the retail functions moving to a separate retail business at the same time.
New Local Government owned retail and distribution businesses will be created from the previous southeast Queensland Council water service providers by no later than July 2010. As part of these new arrangements, Redlands Water and Wastewater (RWW) will be handed over to the State Government (with compensation), although RCC will retain management of the reticulation system for water distribution up to 2010. Hence,
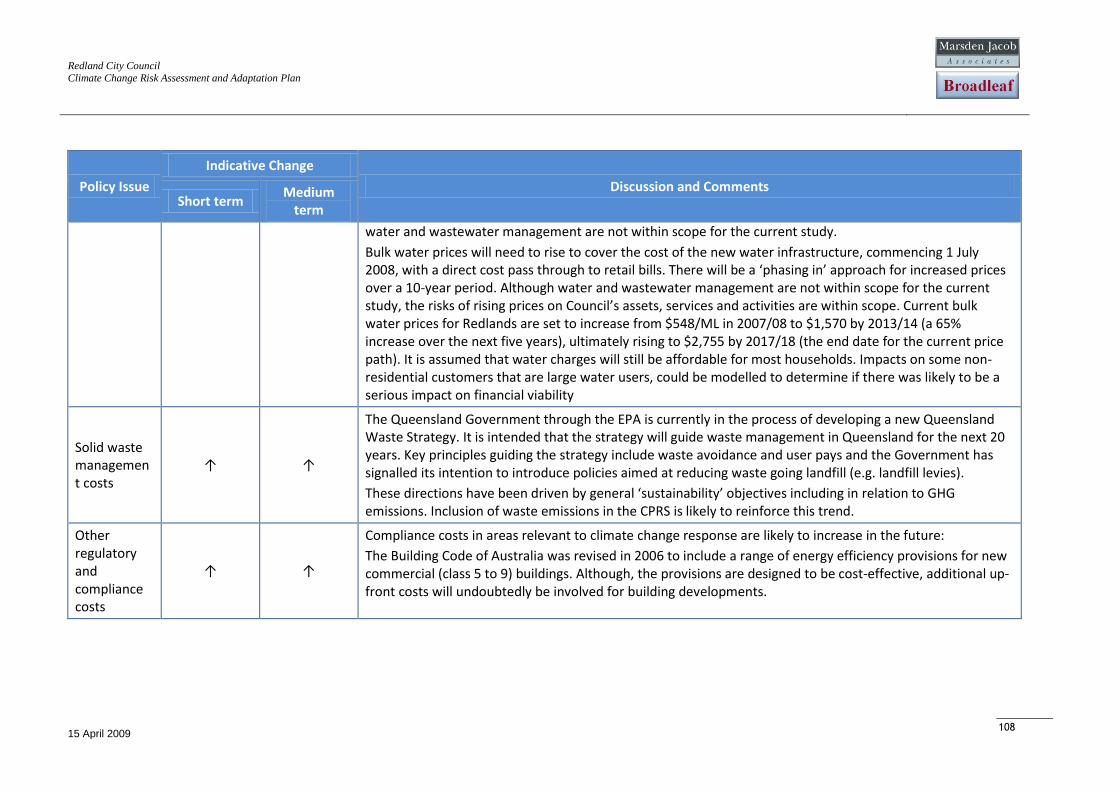
Redland City Council
Climate Change Risk Assessment and Adaptation Plan
15 April 2009
108
Policy Issue
Indicative Change
Discussion and Comments Short term
Medium term
water and wastewater management are not within scope for the current study.
Bulk water prices will need to rise to cover the cost of the new water infrastructure, commencing 1 July 2008, with a direct cost pass through to retail bills. There will be a ‘phasing in’ approach for increased prices over a 10-year period. Although water and wastewater management are not within scope for the current study, the risks of rising prices on Council’s assets, services and activities are within scope. Current bulk water prices for Redlands are set to increase from $548/ML in 2007/08 to $1,570 by 2013/14 (a 65% increase over the next five years), ultimately rising to $2,755 by 2017/18 (the end date for the current price path). It is assumed that water charges will still be affordable for most households. Impacts on some non-residential customers that are large water users, could be modelled to determine if there was likely to be a serious impact on financial viability
Solid waste management costs
↑ ↑
The Queensland Government through the EPA is currently in the process of developing a new Queensland Waste Strategy. It is intended that the strategy will guide waste management in Queensland for the next 20 years. Key principles guiding the strategy include waste avoidance and user pays and the Government has signalled its intention to introduce policies aimed at reducing waste going landfill (e.g. landfill levies).
These directions have been driven by general ‘sustainability’ objectives including in relation to GHG emissions. Inclusion of waste emissions in the CPRS is likely to reinforce this trend.
Other regulatory and compliance costs
↑ ↑
Compliance costs in areas relevant to climate change response are likely to increase in the future:
The Building Code of Australia was revised in 2006 to include a range of energy efficiency provisions for new commercial (class 5 to 9) buildings. Although, the provisions are designed to be cost-effective, additional up-front costs will undoubtedly be involved for building developments.
Redland City Council
Climate Change Risk Assessment and Adaptation Plan
15 April 2009
109
109
8. Appendix 3: Risk Workshop Participants
< List to follow >