climate change, public opinion and residential energy …
TRANSCRIPT

CLIMATE CHANGE, PUBLIC OPINION AND RESIDENTIAL ENERGY USE DO AMERICANS WALK THEIR ENVIRONMENTAL TALK?
A Thesis submitted to the Faculty of the
Graduate School of Arts and Sciences in partial fulfillment of the requirements for the
degree of Master of Public Policy
By
Janamarie K. Salocks
Washington, DC April 15, 2010

ii
CLIMATE CHANGE, PUBLIC OPINION AND RESIDENTIAL ENERGY USE DO AMERICANS WALK THEIR ENVIRONMENTAL TALK?
Janamarie K. Salocks, B.S.
Thesis Adviser: Dr. Daniel Hilliard
ABSTRACT
The scientific consensus is that climate change is real and has already begun;
moreover, it is the result of anthropogenic greenhouse gas emissions. Given the increasing
threat of climate change, what policies will slow the growth of greenhouse gas emissions?
To answer this question, it is imperative that policymakers understand the factors that
influence energy consumption. This paper analyzes the components of residential energy
consumption per capita to determine what factors, in turn, influence the production of
greenhouse gas emissions. Specifically, the paper analyzes the effect of publicly perceived
threat of climate change on residential consumption habits between 1980 and 2009. Results
demonstrate that the primary contributors to an individual’s residential energy consumption
are economic, including the residential price of electricity, and tax rebates for purchase of
energy efficient appliances and home weatherization. Americans’ perceived threat of
climate change does not play a statistically significant role in residential energy
consumption. So do Americans walk their environmental talk? The answer is no; not unless
it is cheaper for them to do so.

iii
Acknowledgments
Many thanks to Dr. Donna Ruane Morrison for her advisement in this thesis. Her analytical insight, constructive criticism and moral support were invaluable. Thanks also to Igor Kheyfets for his friendship and his advisement both in person and by email, even when out of the country on business. To the faculty and staff of GPPI, for creating an academic community that has provided me with the unique graduate experience I desired, and to all my GPPI peers from whom I have learned more about policy, life and friendship than I could have ever expected. Lastly, of course, a special thanks to my parents for their unfailing moral and academic support.

iv
TABLE OF CONTENTS
Abstract ii Acknowledgments iii Table of Contents iv List of Tables and Figures v Introduction 1 Background and Literature Review 3
Climate Science and Economics 3 Energy Consumption and Human Behavior 6 Public Opinion and Risk Perception 8
The Present Study 12 Hypotheses 13 Data and Methods 15
Data 15 Description of Variables 15
Dependent Variable 15 Independent Variable 18
Data Limitations 21
Analytical Methodology 23 Results and Analysis 24
Descriptive Results 24 Multivariate Results 25 Discussion and Policy Implications 27 Conclusions 30 References 32

v
LIST OF TABLES AND FIGURES Figure 1: Keeling Curve 4 Figure 2: Historical Impact of Temperature Increase on Sea Level and Snow Cover (IPCC) 5 Figure 3: Americans’ Top Priorities for 2009 12 Figure 4: Conceptual Model 13 Figure 5: Public Opinion, Before Adjustment and After Adjustment, 1980-2009 21 Figure 6: Natural Log of Residential Energy Consumption per Capita, 1980-2009 24 Table 1: Variable Descriptions 18 Table 2: Means and Standard Deviations of Variables Used in Analysis 21 Table 3: Unstandardized Regression Coefficients and Standard Errors for Models Predicting U.S. Residential Energy Consumption, 1980 to 2009 25

1
Introduction
The scientific consensus holds that climate change is real. Moreover, climate change is the
result of human activities. In 2007, the U.N. Intergovernmental Panel on Climate Change (IPCC)
issued a report stating that climate change is “unequivocal” (IPCC SPM, p.2), and that most of
the temperature increase is “very likely due to the observed increase in anthropogenic
greenhouse gas concentrations" (IPCC SPM, p.3). In a 2009 survey of climate scientists, 96.2%
of respondents agreed that the Earth’s mean global temperature had risen compared to pre-
1800 levels. Of these same scientists, 97.4% also responded that this temperature increase was
the result of human activities (Doran & Zimmerman, 2009).
Studies show that the American public has been more reluctant to accept climate change as
fact. Many studies show that public belief in, and concern about, climate change is volatile and
varies considerably year by year (Gallup, 2009). According to a 2010 Brookings Institution
study, in 2009 66% of the American public believed there was solid evidence the Earth’s
temperature had increased over the last four decades (Rabe and Borick, 2010). Compared to
the previous year, 72% of the public agreed with that statement, marking a decrease of 6
percentage points (Rabe and Borick, 2010). Public opinion data therefore shows year to year
inconsistencies regarding belief in and concern about global climate change.
In his Academy Award winning documentary, An Inconvenient Truth, former Vice-President
Al Gore comments that the reason climate change is inconvenient for the American public is
because “it means we are going to have to change the way we live our lives” (Gore, 2006). But
will we actually do so? Does American belief in, and concern about, climate change translate

2
into action? More specifically, do Americans voluntarily change their lifestyles to reduce their
carbon impact?
Using an Ordinary Least squares (OLS) regression model, this thesis tests the relationship
between perceived threat of climate change and residential energy consumption per capita.
My analysis utilizes time series data for the 30-year period ranging from 1980 to 2009. The
dependent variable is a national measure of residential primary energy consumption per capita,
which includes energy derived from fossil fuel and renewable energy sources. To analyze the
relationship between public opinion and actual energy use, residential energy consumption is
regressed on public worry of climate change. Several explanatory variables are also included in
the model, including residential electricity prices, federal energy policies and temperature
extremes. My hypothesis is that no significant relationship exists between perceived threat of
climate change and residential consumption of energy. Indeed, I expect that regardless of
Americans’ worry over climate change, they do not voluntarily reduce home energy
consumption—either by making energy efficient changes to their home, such as installing
Energy Star appliances, or powering their homes with energy derived from renewable sources
(Zeller, 2001).
To date, climate change and human behavior research has been broadly focused on macro
level economic and policy issues or qualitative behavioral analysis respectively. Past studies
have analyzed policy options for controlling greenhouse gas emissions (Aldy, 2009), and the
economic impacts of such policies on both national and individual sector productivity (Aldy,
2009). The relationship between perceived threat and human action—or inaction as the case

3
has been made regarding climate change—is also well documented (Sandman, 2009). Some
studies also analyze perceived risk (Ropeik, 2008), and the human motivators to deny and
ignore the existence of climate change (Wardekker, 2004). However, until now, no study
analyzes how public opinion of climate change alters residential energy consumption. This
research gap is important to fill because it highlights Americans’ perceived risk of climate
change and the extent to which Americans’ will voluntarily change their lifestyles to lessen their
carbon impact. This will help policymakers to better predict outcomes when constructing and
implementing future climate change policies.
Background and Literature Review
This analysis builds on existing research that examines the relationship between public
opinion and economic behavior as it relates to climate change. The body of literature
supporting this analysis can be broken down into three main categories: climate science and
economics, energy consumption and human behavior, and public opinion and perceived threat.
This analysis seeks to combine these bodies of research.
Climate Science and Economics
Climate change is the result of the historical increase in greenhouse gas emissions—
namely CO2—which traps heat in the Earth’s atmosphere and causes the “greenhouse
effect.” The burning of fossil fuels is identified as the largest component of anthropogenic
CO2 emissions and the greatest contributor to atmospheric CO2 (Canadell, 2007). The

4
concentration of atmospheric CO2 remained relatively constant until the Industrial
Revolution when rapid industrial growth lead global greenhouse gas emissions to grow 70%
between 1970 and 2004 (IPCC SPM, p.5). Figure 1 below illustrates the increase in
atmospheric CO2 concentration over the last 50 years (NOAA, 2009).
Figure 1: Keeling Curve
U.S. Department of Commerce, NOAA Mauna Loa Observatory, 2009
Under a “business-as-usual” scenario,1 atmospheric CO2 concentrations are
expected to increase at an even greater rate due to the projected growth of the global
1 In the field of climate economics, a business-as-usual scenario is defined by a GDP growth, rate interest
rate and inflation rate that continue at current levels. A business-as-usual scenario is also marked by continued
energy intensity of the market and no market shocks or new regulations.

5
economy and the projected increase in the market’s carbon intensity2 (Canadell, 2007).
According to the U.S. Climate Change Science Program, atmospheric CO2 concentrations
could increase between 30% and over 100% through the year 2100 (Energy Information
Administration, 2007). This trajectory of global average temperature and its
implications for sea level and snow cover are illustrated below in Figure 2.
Figure 2: Historical Impact of Temperature Increase on Sea Level and Snow Cover (IPCC)
IPCC, Summary for Policymakers, 2007
Most climate forecast models are bleak. Given the current growth rate of
greenhouse gas emissions, the IPCC predicts global average temperatures to rise
2 An economy’s energy intensity is defined by the ratio of energy consumption to the demand for services.
Stated differently, energy intensity refers to the degree that a nation’s economy is energy efficient.

6
between 1.1°C and 6.4°C by 2100 (IPCC, 2007). The predicted consequences of this
temperature increase is a rise in average sea levels of 20-60 centimeters, an increase in
the severity and frequency of natural disasters, an expanded range of vector-borne
diseases and decreased regional agricultural productivity and endangered species
habitat (IPCC, 2007).
Research documenting the scientific, economic and social implications of climate
change is quickly growing. Joseph Aldy and William Pizer are leading researchers in the
domestic and global economic implications of climate change. Their studies include an
analysis of America’s competitiveness in the global economy, comparison of policies to
reduce emission growth (Aldy & Pizer, 2009) and the economic impacts of such policies
on national and sectoral productivity (Aldy, 2009). Research by the World Resources
Institute also analyzes the implications of climate change policies on the domestic
manufacturing industry and United States global competitiveness (Houser et al., 2008).
Energy Consumption and Human Behavior
According to the Department of Energy’s Energy Information Administration, in
2008, the average American home used 11,040 kilowatt-hours of electricity per year, or
the equivalent of 920 kilowatt-hours per month (E.I.A., 2010). In British thermal units
(Btus)—the preferred unit of measurement in energy consumption—this translates into

7
37,670,043.63 Btus per year or the equivalent of 3,139,170.30 Btus per month.
Appliances account for 64.7% of home electricity use in the average 2001 American
home. Of these appliances, refrigerators consumed the most energy at 14% of home
electricity use and lighting consumed the second most at 9% (E.I.A., 2010). The average
American therefore uses 24,372,518.23 Btus each year to power home appliances.
Matthew Nisbet and Teresa Myers (2007) demonstrate in their research that
individual energy consumption is the product of many socioeconomic variables,
including age, salary, education and political affiliation, among others. On the national
level, some of the contributory macroeconomic factors are GDP per capita, income per
capita, and unemployment rate.
Some studies have analyzed micro-level contributors to residential energy
consumption. In a 2006 paper, Viscusi and Zeckhauser analyzed how consumer
willingness-to-pay for gas to reduce emissions changes as the cost of carbon increases
Viscusi & Zeckhauser, 2006). Related to this analysis is Zarnikau’s 2003 study which
highlights the difference between emotional and economic preference for renewable
energy and energy efficiency (Zarnikau, 2003). Matthew Nisbet has also been a leader
in the study of perceived threat of climate change and the communication of policy
ideas top-down. One of his many studies relating to public opinion of climate change
examines the socioeconomic and demographic contributors to household energy
consumption (Nisbet & Myers, 2007).

8
Public Opinion and Perceived Threat
There is a well-documented link between risk perception and public opinion,
both of which are central to understanding human action as it relates to climate change.
An individual’s perceived risk of climate change will influence their response in public
opinion surveys. Some studies report that on the subject of climate change, individuals
will subconsciously underestimate threat (Sandman, 2009), thus underestimating polling
results of the percentage of Americans concerned about climate change. This
psychological block on perceived risk to personal safety is called the “denial system” (de
Groot, 1967). In this phenomenon, individuals either don’t think environmental
pollution around is as bad as scientists, politicians and the media say it is, or are
generally aware but refuse to acknowledge it to avoid feeling compelled to take action
(de Groot, 1967). These human behaviors reinforce the status quo, which is to continue
environmentally destructive behavior that is the source of anthropogenic greenhouse
gas emissions. Another micro factor to public opinion and perceived threat of climate
change is perception of who is responsible for environmental remediation (Murch,
2001). Murch shows in his 2001 study that by and large, Americans view their
government as responsible for lowering greenhouse gas emissions and reducing the
threat of climate change (Murch, 2001).
Though evidence of global climate change appeared in the scientific literature as
early as the 1900’s (EPA, 2009), it wasn’t until the 1980’s that public awareness gained
momentum (Brown, 2008). Several studies document the increase in public concern of

9
environmental issues during the 1980’s (Nisbet & Myers, 2007; McAllister & Studlar,
1993). 1988 was a significant year in the development of public concern for climate
change following a series of droughts and James Hansen’s Congressional testimony that
climate change had begun (Bord, 1998). Public concern continued to grow following
these events, but eventually waned as rain and flooding made the problem appear less
severe (Bord, 1998). Some studies attribute changes in concern about climate change to
media attention surrounding global climate change (Nisbet & Myers, 2007). Research
shows that in years of drought, flooding, other natural disasters and extremely high or
low average temperatures, the public’s perceived risk of climate change increases
dramatically (Pew, 2009; The Independent, 2007). Conversely, when weather patterns
are relatively moderate or the country is facing crises of alternative natures (i.e. war,
pandemic, etc), perceived risk decreases. Some studies also cite environmental
catastrophes such Chernobyl and Three-Mile Island as drivers of public opinion (EIA,
2008).
A recent Gallup survey of perceived risk of climate change highlights an increase in
perceived risk during the Bush Administration years and a decrease since the
inauguration of President Barak Obama in January 2009 (Gallup, 2009). Gallup’s analysis
postulates that drops in perceived risk of climate change correlate with the election of
candidates who are perceived as more environmentally-conscious, while increases in
concern are due to administrations that are perceived as less environmentally-conscious
(Gallup, 2009). This relationship might explain the drop in concern for the environment
between 2008 and 2009 after the election of President Barack Obama (Gallup, 2009).

10
A 2009 Washington Post-ABC poll shows that 72% of Americans now believe that
global warming is real. Moreover, 55% of Americans believe the U.S. should curb its
greenhouse gas emissions even if other high emitting countries like China and India do
not reduce their emissions (Eiliperin, 2009). A recent Gallup poll also finds that 28% of
Americans report having made major changes in their lifestyles to protect the
environment (Gallup, 2009).
Unfortunately, there is a dearth of research on how public opinion and risk
perception influences environmental policy outcomes. Previous polling and academic
research regarding human behavior shows that the extent to which environmental
concern drives lifestyle changes is an issue of money, political affiliation and education.
(Zarnikau, 2002; Nisbet, 2007). Research also shows that most Americans believe that
the government is primarily responsible for addressing the threat of climate change,
over their own personal responsibility (Sandman, 2009). Consequently, most research
shows that the majority of Americans are willing to make only minor changes in their
lifestyles such as driving less and recycling more (Jones, 2008).
In their analysis of public opinion on climate change, Ian McAllister and Donely
Studlar show that the U.S. public ranks environmental issues in equal importance to
broader economic issues, such as GDP growth and unemployment (McAllister & Studlar,
1993). However, due to the lack of a perceived urgency relative to other environmental
issues, the public ranks climate change as the lowest environmental priority
(Leiserowitz, 2005). This same public ranking of the importance of addressing climate
change is evident among domestic and international policy issues. This is shown in

11
Figure 3 below. In their study, McAllister and Studlar further demonstrate the
disconnect that exists between the public’s awareness of, concern for, and knowledge
of the human activities that contribute to climate change (McAllister & Studlar, 1993).
Developing an improved understanding of the U.S. public’s knowledge of climate
change and how the public responds to perceived threat is therefore critical when
developing and implementing climate change policies. Indeed, U.S. policymakers must
anticipate how the public is likely to respond to new policies because their response will
likely determine the degree to which the policy is effective (Bord, et al, 1998). As
Anthony Leiserowitz says in his 2003 dissertation Global Warming and the Human Mind,
“public support or rejection of proposed climate policies will be greatly influenced by
the perceived risks of global warming.” This disparity between public awareness and
perception of environmental problems, and the knowledge of actions to ameliorate
such problems further supports the need for research to fill the information gap.
The strong positive link between public opinion and policymaking (Monroe, 1998)
also supports the need for this study and the importance of its results. In his article
“Public Opinion and Public Policy,” Alan Monroe shows that between 1960 and 1993,
policymakers have made decisions consistent with public opinion a majority of the time
(Monroe, 1998). Policymakers listen to their constituents and make policy decisions
according to public opinion. Understanding the relationship between public opinion and
human behavior is therefore a critical element of the policymaker’s decision-making
process.

12
Figure 3: Americans’ Top Priorities for 2009
Pew Research Center for People & the Press, 2009
The Present Study
The driving question of this research is whether and how climate change concerns shape
peoples’ choices about energy use and conservation. Drawing from existing literature, the
underlying conceptual model guiding this study posits that residential energy consumption is a
function of both macro and individual behavior factors. This model is illustrated in Figure 4
below. The macro factors consist of government incentives, income per capita and the
residential price of electricity. A factor that is not amenable to policy changes is the presence
of temperature extremes which influences energy use towards heating and cooling. The aim of

13
this research is to explore the relationship between residential energy consumption per capita
and percentage of the U.S. population somewhat or very concerned about climate change.
Figure 4: Conceptual Model
Hypotheses
I hypothesize that there is no significant relationship between concern about climate
change and residential energy consumption per capita. My hypothesis is based on the
overarching belief that Americans’ economic interests override any voluntary incentives
to reduce energy consumption, improve energy efficiency, or replace energy derived
Residential Energy
Consumption
Perceived Risk of Threat of Climate
Change (National public polls)
Income
per capita
Government incentives
(Energy Star, Energy
Policy Act)
Residential price
of electricity
Temperature Extremes
(highs, lows, windchill, etc)

14
from non-renewable sources with energy from renewable sources (Zeller, 2001). This
hypothesis is based on the following logic assumptions:
First, energy efficient appliances are generally more expensive than conventional
and older models of energy inefficient appliances (FTC, 2000). Living an energy efficient
lifestyle is more costly in the short run because it requires modern technologies that are
only available in newer appliance models. For lower-income Americans living paycheck
to paycheck, this energy-efficient lifestyle upgrade is frequently out of reach. The same
logic applies to Americans in apartment housing who do not have the authority to
upgrade to more energy-efficient appliances.
Second, polls ranking Americans’ national priorities consistently place climate
change as one of the lower if not the lowest priority (Pew, 2009). In comparison,
American’s generally prioritize the economy as one of the higher if not the highest
priorities. This ranking of priorities is shown in Figure 3. According to the Pew Research
Center for People & the Press, Americans’ greatest priorities in 2009 were strengthening
the economy and improving the job situation (Pew, 2009). The results of this survey
indicate that in 2009 and in similar years of economic recession, concern over climate
change is likely to be relatively low. This economy over environment prioritization is a
general phenomenon. Therefore, I believe that very little incentive exists in any year for
Americans to voluntarily expend additional resources to reduce their carbon footprint.
Finally, I believe that the vastness of global climate change leaves most Americans
feeling helpless to change the escalation of greenhouse gas emissions (Sandman, 2009).

15
Some researchers hypothesize that Americans are have cognitive dissonance
surrounding climate change (Sandman, 2009). The problem is so vast, that many
Americans view their individual effort as inconsequential (Sandman, 2009). It is
therefore not surprising that Americans would see any additional expenditure of their
time or money as negligible to combating the threat of global climate change.
Data and Methods
Data
This study compiled annual data from varying sources to examine the relationship
between perceived threat of climate change and residential energy consumption. The data
set is a pooled cross-sectional time series from 1980 to 2009.
Description of Variables
Dependent Variable
The dependent variable in this model is U.S. residential energy
consumption per capita. Primary residential energy consumption is used as the
measure of this variable because it does not include the electricity sales or
energy losses that do not correspond to direct energy consumption. This data is
sourced from the U.S. Department of Energy’s Energy Information
Administration (EIA), which releases this data in its Monthly Energy Reviews and
Annual Energy Reviews. By the EIA’s definition, primary energy consumption

16
“includes energy sources that are produced from other energy sources—e.g.,
coal coke from coal—only if their energy content has not already been included
as part of the original energy source. Thus, U.S. primary energy consumption
does include net imports of coal coke, but not the coal coke produced from
domestic coal” (D.O.E., 2010). Primary consumption in the residential sector is
measured by energy consumption from two sources: fossil fuel and renewable
energy. Fossil fuel sources include coal, natural gas and petroleum, while
renewable energy sources include geothermal, solar/photovoltaic and biomass.
Geothermal energy is defined as hot water or steam extracted from geothermal
reservoirs which can be used for geothermal heat pumps, water heating, or
electricity generation (D.O.E., 2010). Biomass energy is sourced from biomass
waste which the U.S. Department of Energy defines as “organic non-fossil
material of biological origin that is a byproduct or a discarded product. [This]
includes municipal solid waste from biogenic sources, landfill gas, sludge waste,
agricultural crop byproducts, straw, and other biomass solids, liquids, and gases;
but excludes wood and wood-derived fuels (including black liquor), biofuels
feedstock, biodiesel, and fuel ethanol (D.O.E., 2010).
Residential electricity sales and electrical system energy losses are not
included in the measure of primary energy consumption. If added, these
measures of energy consumption together would amount to total energy
consumption. The dependent variable is measured in billion British thermal

17
units (Btus)3. One Btu is equivalent to 0.29 kilowatt-hours, and yields between
1010 and 1070 Btus of energy—depending on quality—for each standard cubic
foot of natural gas burned.
I take the natural log of residential energy consumption per capita to
better visualize the effect of year-to-year incremental changes.
3 A British thermal unit (Btu) is the amount of energy needed to heat one pound of water one degree
Fahrenheit. When burned, 1 standard cubic foot of natural gas yields 1010 - 1070 Btus, depending on quality.

18
Independent Variables:
The measurements and sources of the independent and dependent
variables are listed in Table 1 below.
Table 1: Variable Descriptions
Variable Coding
Ln(Respercap) Continuous variable, measured as U.S. residential energy consumption per capita in billion British thermal units.
PercentWorry
Continuous variable, measured in percentage of U.S. population that is somewhat or very concerned about climate change or “the greenhouse gas effect” or thinks that air pollution will be a serious problem in the next 25-50 years.
(PercentWorry)2
Continuous variable, equaling the square of PercentWorry, measured in percentage of U.S. population that is somewhat or very concerned about climate change or “the greenhouse gas effect” or thinks that air pollution will be a serious problem in the next 25-50 years.
ResElecPrice
Continuous variable, the nationwide average price of residential electricity in $2000, sourced from the Department of Energy’s Energy Information Administration
EnergyPolicyAct Dummy variable, representing when the Energy Policy Act went into effect 1/1/2006, creating tax credits for energy efficient home appliances.
EnergyStar Dummy variable, representing the year that Energy Star appliances became available on the open market.
TempExtremes Interval-ratio variable, representing the annual counts nationwide of temperature extremes including extreme heat, extreme cold and windchill
Public concern regarding climate change is measured by collecting data from
several nationwide opinion polls. Polling data was taken from polling organizations
including Gallup, Yale University, Cambridge, Roper and the Program on International
Policy Attitudes (PIPA). Although there is some variance in the samples surveyed and
question(s) used by the different organizations, the data gathered from these polls and
19
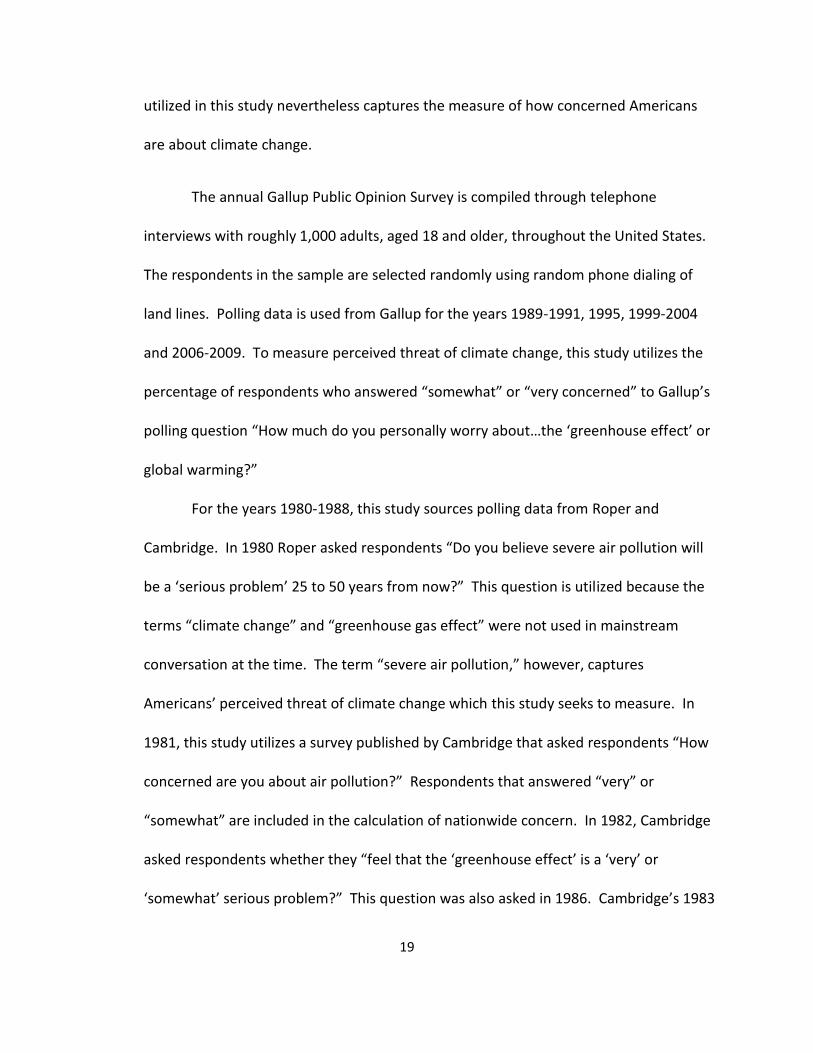
utilized in this study nevertheless captures the measure of how concerned Americans
are about climate change.
The annual Gallup Public Opinion Survey is compiled through telephone
interviews with roughly 1,000 adults, aged 18 and older, throughout the United States.
The respondents in the sample are selected randomly using random phone dialing of
land lines. Polling data is used from Gallup for the years 1989-1991, 1995, 1999-2004
and 2006-2009. To measure perceived threat of climate change, this study utilizes the
percentage of respondents who answered “somewhat” or “very concerned” to Gallup’s
polling question “How much do you personally worry about…the ‘greenhouse effect’ or
global warming?”
For the years 1980-1988, this study sources polling data from Roper and
Cambridge. In 1980 Roper asked respondents “Do you believe severe air pollution will
be a ‘serious problem’ 25 to 50 years from now?” This question is utilized because the
terms “climate change” and “greenhouse gas effect” were not used in mainstream
conversation at the time. The term “severe air pollution,” however, captures
Americans’ perceived threat of climate change which this study seeks to measure. In
1981, this study utilizes a survey published by Cambridge that asked respondents “How
concerned are you about air pollution?” Respondents that answered “very” or
“somewhat” are included in the calculation of nationwide concern. In 1982, Cambridge
asked respondents whether they “feel that the ‘greenhouse effect’ is a ‘very’ or
‘somewhat’ serious problem?” This question was also asked in 1986. Cambridge’s 1983

20
question asks respondents if they feel that the “overall quality of the environment
around here is worse than it was 5 years ago.” This question was also asked in 1987. In
1984, Roper asked respondents if they believe “the ‘greenhouse effect’ will be a ‘serious
problem’ 25 to 50 years from now.” This question was also asked among respondents in
1988. Though the questions vary in phraseology—significantly in the years 1983 and
1987—they nevertheless capture Americans’ concern about air pollution, the
environment and/or climate change and follow the same general trajectory or similar
questions.
The 3 missing data points between 1991 and 1998 are sourced from two
different studies. The 1998 study by Bord, Fisher and O’Connor in Climate Research
titled “Public perceptions of global warming: United States and international
perspectives” is the source of 1996 and 1998 polling data. The second study, compiled
by PIPA—the Project for International Policy Attitudes—in 2005, and is the source for
the 1999 polling data.
To smooth the trend in my variable measuring public opinion, I squared
“PercentWorry.” The graphs in Figure 5 exhibits public concern of climate change
before and after adjustment. All data are presented in population percentage terms.

21
Figure 5: Public Opinion, before adjustment and after adjustment, 1980-2009
Derived from Stata 10.1
Table 2 (below) shows the model’s descriptive statistics.
Table 2: Means and Standard Deviations of Variables Used in Analysis
Mean Standard Deviation
ln(Residential Energy Consumption per Capita) (billion Btus) 3.63 0.13
Percent U.S. Population Concerned about Climate Change 58.57 11.13
(Percent U.S. Population Concerned about Climate Change)² 3552.23 1215.13
Retail Residential Electricity Price (cents per kilowatt hour) 9.38 0.86
Energy Policy Act (lagged) (1=act was passed) 0.1 0.31
Energy Star (lagged) (1=appliances available to consumers) 0.59 0.5
Temperature Extremes (nationwide annual count of heat, cold and windchill) 145.37 159.92
Number of Observations 30
Note: means are computed using NSC sampling probability
Data Limitations
In conducting this analysis, it must be acknowledged that certain data limitations
exist that directly influence model results. The first of these limitations is that, due to
the relatively recent public awareness of climate change, polling data only exists for the

22
last 30 years. This results in 30 data points in the OLS regression model. The statistical
rule of thumb according to the Central Limit Theorem is that a study must have data
points equal to or greater than 30 to be normally-distributed and therefore internally
valid. The number of observations in this study is therefore just within the bounds of
statistical approval.
A second limitation to this analysis is the lack of continuous polling data from the
same source over the 30 year analysis period between 1980 and 2009. Rather, polling
data from different organizations is compiled to gather the 30-year observation data
points. Studies show that question phraseology, sample selection, and methods of
sampling and surveying can alter survey outcomes considerably. However, in spite of
this admitted variation, when the variable “PercentWorry” is squared, the variable
becomes much more normally-distributed, thus verifying its internal validity.
Other limitations outside the researcher’s control must be acknowledged as well.
For example, many factors that influence perceived threat of climate change are
without data or cannot be measured quantitatively. As a result, such factors could not
be included in this analysis. At the macro level, research suggests that mass media
heavily influences public opinion, particularly environmental issues (Murch, 2001). This
is because environmental issues are generally complex and therefore not understood by
mainstream America. As a result, media outlets such as magazines, newspapers and
television dominate any other sources of environmental information.

23
At the micro level, factors influencing concern over climate change include
personal information sources such as friends, co-workers and neighbors (Murch, 2001).
The influence of these factors cannot be measured and are therefore not utilized in this
analysis.
Analytical Methodology
My study uses OLS regression models to determine the relationship between
nationwide public opinion and individual residential energy consumption over time. OLS is
an appropriate estimation strategy because my dependent variable is continuous. One of
the assumptions underlying the use of OLS regression is that individual error terms across
observations are not correlated. With time series data however, there is often a risk of
violating this assumption. For example, measurement problems that exist in one period
may exist in subsequent or prior periods as well. When this occurs, the size of the standard
errors are underestimated causing regression coefficients to falsely appear to be statistically
significant. I conducted diagnostic tests of the presence of autocorrelation and discovered
the data had a second order correlation. Hence, I use a Newey-West correction in my
models estimation to remedy this problem.
The following is an outline of the OLS regression model explaining residential energy
consumption per capita. The natural log of the dependent variable is taken to better
demonstrate the incremental changes from year to year.
24
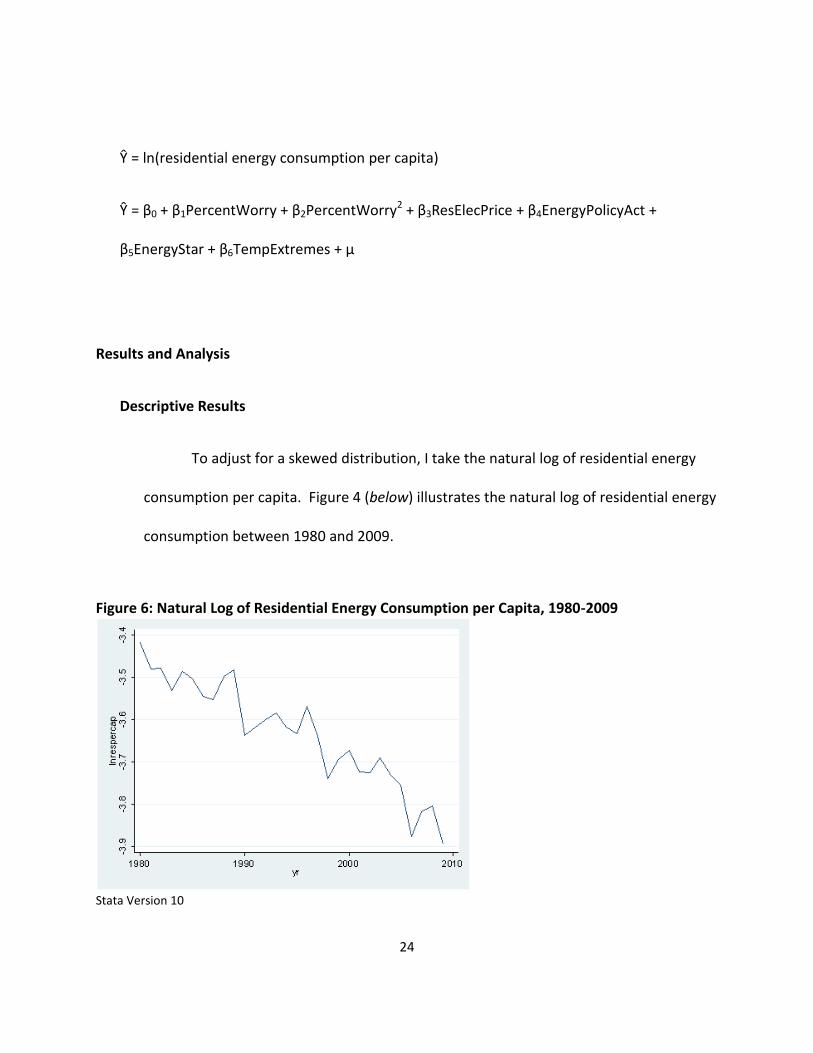
Ŷ = ln(residential energy consumption per capita)
Ŷ = β0 + β1PercentWorry + β2PercentWorry2 + β3ResElecPrice + β4EnergyPolicyAct +
β5EnergyStar + β6TempExtremes + μ
Results and Analysis
Descriptive Results
To adjust for a skewed distribution, I take the natural log of residential energy
consumption per capita. Figure 4 (below) illustrates the natural log of residential energy
consumption between 1980 and 2009.
Figure 6: Natural Log of Residential Energy Consumption per Capita, 1980-2009
Stata Version 10

25
Multivariate Results
Using a series of incremental models, we see the cumulative relationship between U.S.
residential energy consumption per capita and the following variables: percentage of the
population concerned about climate change, residential price of electricity, federal energy
policies and temperature extremes.
Table 3: Unstandardized Regression Coefficients and Standard Errors for Models Predicting U.S. Residential Energy Consumption Per Capita, 1980 to 2009
Model 1 Model 2 Model 3 Model 4 Model 5 Model 6
Constant -3.51 (0.10)
-2.87 (0.28)
-4.40 (0.33)
-4.50 (0.19)
-4.31 (0.34)
-4.35 (0.33)
Percent of Americans Concerned about Climate Change
-0.00 (0.00)
-0.03 (0.01)
-0.01 (0.01)
-0.00 (0.00)
-0.00 (0.01)
-0.00 (0.00)
(Percent of Americans Concerned about Climate Change)²
0.00 (0.00)
0.00 (0.00)
0.00 (0.00)
0.00 (0.00)
0.00 (0.00)
Retail Residential Electricity Price (cents per kilowatt hour)
0.11 (0.02)
0.10 (0.00)
0.08 (0.02)
0.09 (0.02)
Energy Policy Act (lagged) (1= act was passed)
-0.21 (0.03)
-0.19 (0.05)
-0.20 (0.05)
Availability of Energy Star appliances (lagged) (1= available to consumers)
-0.03 (0.06)
-0.04 (0.07)
Nationwide Temperature Extremes (annual count)
0.00 (0.00)
F value 1.40 3.38 17.07 93.80 96.95 77.71
Probability > F 0.25 0.05 0.00 0.00 0.00 0.00
*Results reflect an estimation for autocorrelation within the time series.
**Author developed dataset from polls from Roper, Cambridge, Gallup, Yale University and the Program on International Policy Attitudes; energy data from the Department of Energy's Energy Information Agency; and temperature extremes from the National Oceanic and Atmospheric Administration's National Climactic Data Center

26
In Model 1, where I enter only the main effect of the population percentage that is
somewhat or very concerned about climate change, I found a statistically significant
negative effect. A single point increase in the percentage of the population concerned
about climate change results in a decrease in residential energy consumption of
0.002078 billion Btus or 20,708,000 Btus. The fit of this model is very poor, as shown by
the low F-value, which is not considered significant at any conventional level.
In Model 2 I add the squared term of the population percentage concerned about
climate change to account for non-linearity within the variable. Once the squared term
is included, both variables become statistically significant and the model’s overall
goodness of fit is significant at 95% confidence. Here, a 1 point increase in the
percentage of the U.S. population concerned about climate change corresponds to a
decrease in residential energy consumption by 0.0271242 billion Btus or 27,124,200
Btus. As I look across the multivariate table, I see that as more variables are added to
the model, the model’s goodness of fit as measured by its F-value continues to increase.
The relationship between residential energy consumption per capita and the nationwide
average of retail residential electricity prices in cents per kilowatt hour is positive
throughout each model. However, as additional explanatory values are added, this
positive relationship decreases and its significance increases.
In the 4th and 5th models I add the impact of federal energy policies that create tax
credits for purchase of residential energy efficiency appliance. Here I see that the

27
coefficients on the percentage of the population concerned about climate change—both
singular and squared—lose their statistical significance. Note that the models including
these federal energy policies have negative coefficients, showing a negative relationship
with residential energy consumption per capita. In Model 5, the presence of the Energy
Policy Act and the availability of Energy Star appliances is correlated with a decrease in
residential energy consumption per capita of 0.1931251 billion Btus and 0.0333726
billion Btu’s respectively (or 193,125,100 Btu’s and 33,372,600 Btus).
One final question in this multivariate analysis is whether the presence of
temperature extremes—such as extreme heat, cold or windchill—influenced residential
energy consumption per capita. Model 6 shows that the regression coefficient on
temperature extremes is very small and not statistically significant. The impact of
extreme temperatures is therefore negligible.
Discussion and Policy Implications
The results of this analysis are, in one sense, clear, and in another, varied. Clearly,
public opinion on the perceived threat of climate change does not play a significant role in
residential energy consumption per capita. Alternatively, while economic and political
conditions do influence energy consumption, they do so only in specific circumstances. For
example, the regression results of this analysis show that passage of the Energy Policy Act in
2005 is significantly correlated with residential energy consumption. The availability of

28
Energy Star appliances in 1992, however, did not prove significantly correlated. These
results are surprising in one sense because the two laws both created tax credits for the
purchase of energy efficient home appliances. However, it is reasonable to assume that
due the overall increase in public concern over climate change between 1992 and 2005,
changing attitudes are the principle reason why the Energy Policy Act was more influential
in decreasing residential energy consumption per capita than the availability of Energy Star®
and other more energy efficient appliances.
This analysis finds no significant correlation between residential energy consumption
per capita and percentage of the population concerned about climate change. While the
overall results are inconclusive, the findings nonetheless support the theory that individual
beliefs and perception of risk do not translate into action. This explains why voluntary
measures of carbon reduction in the residential sector are ineffective.
This analysis sheds light on how the federal government can influence consumer
behavior through federal policies. Policies that lower the retail cost of energy efficient
appliances make them more desirable for purchase. Because Energy Star® appliances
require one large up-front cost, less wealthy consumers will be less inclined to purchase
them though they will result in a net savings in energy and money in the long run. An up-
front rebate or tax credit would lower the initial up-front cost, thereby making the cost of
an energy efficient appliance comparable to traditional appliances.
The analysis also shows why past federal policies—such as the introduction of Energy
Star® appliances in 1992—have been ineffective in curbing residential energy consumption.
29
Though Energy Star® appliances became available in 1992, tax credits for the purchase of
energy-efficient appliances and home weatherization weren’t available to consumers until
2006. As a result, the initial cost of a new energy efficient appliance was still greater than a
conventional appliance, even though the long term operating costs were lower. This could
possibly explain why the coefficient on the variable EnergyStar is not significantly correlated
with residential energy consumption per capita, while the coefficient on the Energy Policy
Act is significantly negatively correlated.
Though the results of this research explain a great deal about perception of threat,
human behavior and energy policy, it only reinforces the need for further research. The
results of this research could be augmented in several ways. First, as years pass, more and
more data polling regarding publicly perceived threat of climate change will be available. By
adding data points to this time series analysis, a supplemental analysis will have stronger
internal validity and more precisely explain the relationship between public opinion on
climate change and residential energy consumption. Second, data measuring the influence
of media coverage of climate change would add considerably to this study as a potential
contributor to human behavior. Gallup polls during the 1990’s and early 21st century have
already measured the extent to which the public believes the media exaggerates the threat
of climate change; more data measuring this variable would explain changes in residential
energy consumption. Lastly, the premise of this research should be applied to other sectors
of the economy such as the commercial sector, the industrial sector and the energy
production sector. By understanding the factors that influence energy consumption within

30
each sector, policymakers can further influence anthropogenic production of greenhouse
gas emissions.
Conclusions
This analysis reveals that, on the whole, residential energy consumption is primarily the
result of economic incentives. Energy policies that offer rebates or tax incentives for purchase
of energy efficient appliances will lead to a decrease in an individual’s residential energy
consumption. We can therefore assume that future energy and climate change policies that
offer more aggressive rebates and tax incentives would augment the size of this consumption
decrease.
Furthermore, as expected, public concern about climate change is not a significant factor in
residential energy consumption. Public concern about climate change—as measured by polling
surveys—varies significantly from year to year. When compared to the slow and steady decline
in residential energy consumption per capita between 1980 and 2009, it is clear that there is no
correlation. This is evident in both the regression model and a simple eyeball comparison of
the graphs of the two variables.
Do Americans walk their environmental talk? On the whole, the results of this analysis
point to “no.” Americans’ perception of threat and their public opinion of climate change does
not translate into action based on feelings alone. Americans need more than an emotional
incentive to voluntarily change their energy consumption habits. Therefore, to gain the support
of the public, policymakers must frame future energy and climate change policies as

31
pocketbook issues. In the end, the results of this analysis prove that above the voices of all
other incentives, money speaks the loudest.
32
References
Aldy, J.E. & Pizer, W.A. (2009). The Competitiveness Impacts of Climate Change Mitigation Policies. Pew Center on Global Climate Change. Bord, Richard J., Anne Fisher and Robert E. O’Connor (1998). Public perceptions of global warming: United States and international perspectives. Climate Science, Vol. 11, pages 75-84 Brown, Courtney (2008). Public Opinion on Climate Change: The Roles of Risk Perception and Scientific Knowledge in Presenting Passivity. (Master’s Thesis, Georgetown Public Policy Institute, Georgetown University). Canadel, J. G., C. Le Quere, M. R. Raupach, C. B. Field, E. T. Buitenhuis, P. Ciais, T. J. Conway, N. P. Gillett, R. A. Houghton and G. Marland (2007). Contributions to accelerating atmospheric CO2 growth from economic activity, carbon intensity, and efficiency of natural sinks. Proceeedings of the National Academy of Sciences, Vol. 104, (Issue 24), pages 18866-18870. Clayton, Mark (2006, December 4). “Greener, cleaner…and competitive?” The Christian Science Monitor. de Groot, Ido (1967) Trends in Public Attitudes toward Air Pollution. Journal of the Air Pollution Control Association, Volume 17, pages 679-681. Doyle, Leonard (2007, June 29). Extreme weather helps US wake up to climate change. The Independent (London). Fourth Edition. Doran, Peter and Maggie Kendall (2009). Examining the Scientific Consensus on Climate Change. Eos Transactions American Geophysical Union, Vol. 90, No. 3, pages 22-23. Dunlap, Riley E. and Angela G. Mertig (1992). American Environmentalism: The U.S. Environmental Movement 1970-1990. Taylor & Francis New York, Inc. Eilperin, Juliet (2009, November 24). Washington Post: Poll: More Americans Growing Skeptical of Global Warming. http://www.americansecurityproject.org/content/media/clips/2009/washington-post-poll-more-americans-growing-skeptical-of-global-warming/ EPA (2009). U.S. Greenhouse Gas Inventory Report, Executive Summary. www.epa.gov/climatechange/emissions/downloads09/GHG2007-ES-508.pdf Federal Trade Commission (2000, June). How to Buy an Energy-Efficient Home Appliance. http://www.ftc.gov/bcp/edu/pubs/consumer/homes/rea07.shtm

33
Houser, T. et al. (2008). Leveling the Carbon Playing Field: International Competition and U.S. Climate Policy Design. Congressional Policy Brief. Washington, DC. Intergovernmental Panel on Climate Change, Fourth Working Group (2007). Climate Change 2007 Synthesis Report. Core Writing Team, Pachauri, R.K. and Reisinger, A. (Eds.). Leiserowitz, Anthony (2003). Global Warming and the Human Mind. (Dissertation). Leiserowitz, Anthony (2005). Communicating the Risks of Global Warming: American Risk Perceptions, Affective Images and Interpretive Communities (Dissertation Research). Mauna Loa Observatory (2009). Concentration of Carbon Dioxide. http://www.mlo.noaa.gov/programs/coop/scripps/co2/co2.html McAllister, Ian and Studlar, Donely. (1993) Research Notes: Trends in Public Opinion on the Environment in Australia. International Journal of Public Opinion Research, Vol 5, (No. 4) Mendelssohn, Robert, Dinar, Ariel & Wilson, Larry (2006). The distributional impact of climate change on rich and poor countries. Environment and Development Economics, Volume 11. Cambridge University Press, pages 159-178. Monroe, Alan D. (1998, Spring) Public Opinion and Public Policy, 1980-1993. Public Opinion Quarterly, Vol. 62, (No. 1) Oxford University Press, page 6-28 Murch, Arvin W. (2001). Public Concern for Environmental Pollution. Duke University. Nisbet, Matthew C. (2009, March-April). Communicating Climate Change: Why Frames Matter for Public Engagement.” Environment magazine. Nisbet, Matthew C. & Myers, Teresa (2007). The Polls—Trends: Twenty Years of Public Opinion about Global Warming. Public Opinion Quarterly, Vol. 71 (Issue 3) page 444. OMB Watch (2006). Regulation and Competitiveness (Regulatory Policy Issue Brief). Washington, DC. Pelham, Brett W. (2009, April 24). Views on Global Warming Relate to Energy Efficiency. Gallup Organization. Pew Center for People & the Press (2009). Environment, Immigration, Health Care Slip Down the List: Economy, Jobs Trump all other Policy Priorities in 2009. Washington, DC.

34
Rabe, Barry G. and Christopher P. Borick (2010). The Climate of Belief: American Public Opinion on Climate Change. Issues in Governance Studies, No. 31. The Brookings Institution. Reiss, Peter C. & White, Matthew W. (2008, Autumn) What changes energy consumption? Prices and public pressures. The RAND Journal of Economics, Vol. 39 (No. 3) Pages 636-663. Sandman, Peter M. (2009). Climate Change Risk Communication: The Problem of Psychological Denial. http://www.psandman.com/col/climate.htm Smith, Eric R. A. N. (2002). Energy, the Environment and Public Opinion. CITY: Rowman & Littlefield Publishers, Inc. Stern, N. (2006). Stern Review on the Economics of Climate Change Zarnikau, Jay (2003). Consumer demand for ‘green power’ and energy efficiency. Energy Policy, Volume 31, page 1661-1672. Zeller, Tom (2001, May 20). Ideas & Trends; Save the Environment! (And Turn Up the Air Conditioner.) The New York Times.