climate change -- local action fo r global result s global change institute, presentation materials,...
TRANSCRIPT

Aspen Global Change Institute, Presentation Materials, July 1999
International Council for Local Environmental Initiatives Cities for Climate Protection
Climate Change -- Local Action forGlobal Results
Presentation Slides, March 1999 Ralph Torrie, Torrie Smith Associates and
Deputy Director, ICLEI Cities for Climate Protection
17/15/99 1Page 1
Campaign
Ralph Torrie Suite 302, 255 Centrum Boulevard
Orleans, Ontario, Canada K1E 3V8 Tel 613-824-3045 Fax 613-824-3297
Email: [email protected] www.torriesmith.com

Aspen Global Change Institute, Presentation Materials, July 1999
Three Key Premises
� A deep and lasting transition to a low carbon future cannot be achieved without the active engagement of of local governments. Local governments largely determine the level of greenhouse gas emissions in the society. The phrase “local government” is used in its broadest sense here -- cities, towns, school and hospital boards, universities and other large institutions, etc.
� The pursuit of emission reduction and other greenhouse gas mitigation strategies brings multiple benefits to the community and complements other community objectives for environmental improvement, economic development, public health and enhanced livability.
� There is a huge variation in the level and pattern of emissions and mitigation opportunities from one locality to the next -- LOCAL action plans for greenhouse gas mitigation are necessary for success at the national level. This in turn underscores the need for capacity at the local authority level to develop and implement such strategies.
A Quick Look at the Greenhouse
� Strong Scientific Consensus We Have a Serious Problem � Large Gap Between Required Emission Reductions and
Current Commitments � Energy-Related Carbon Dioxide is By Far the Most Important
Anthropogenic Source of Global Warming,, Methane a Distant Second
� In the Short Term, Barriers to Progress Neither Technical Nor Economic
� International and National Regulatory Constraints Are Coming, Sooner or Later
Page 2227/15/99
Aspen Global Change Institute, Presentation Materials, July 1999
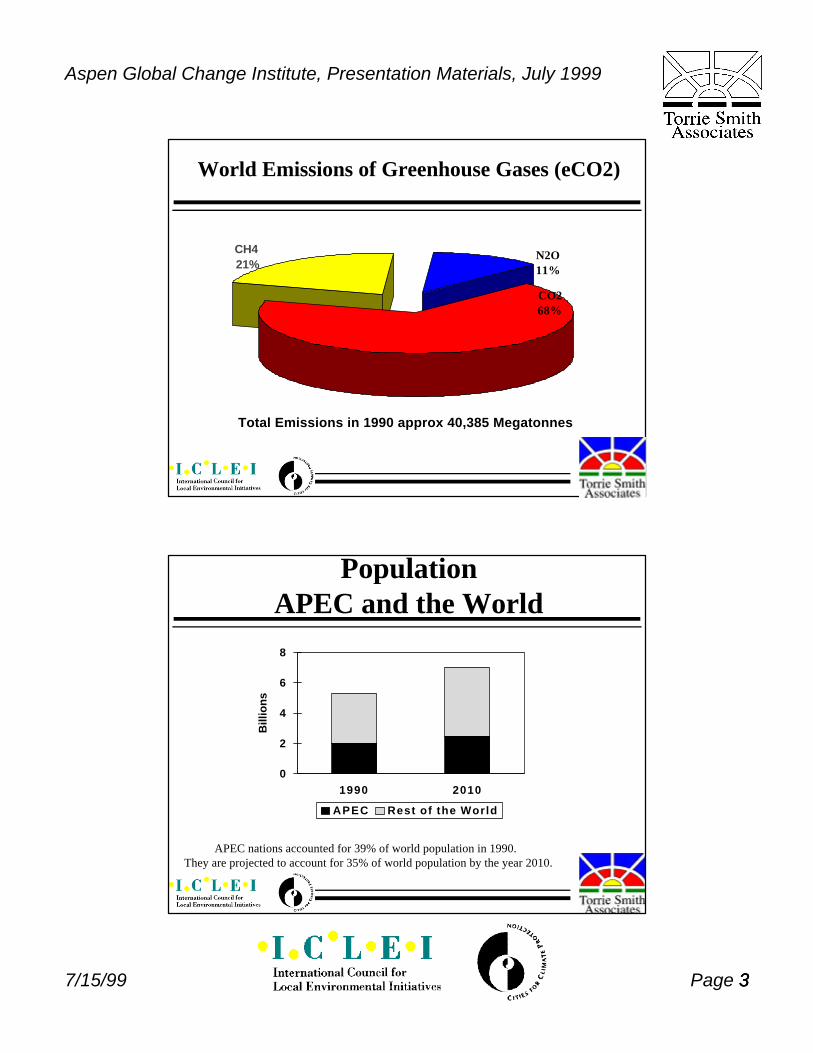
World Emissions of Greenhouse Gases (eCO2)
CH4 N2O 11%
CO2 68%
21%
Total Emissions in 1990 approx 40,385 Megatonnes
37/15/99 3Page 3
Population APEC and the World
0
2
4
6
8
1990 2010
Bill
ion
s
APEC Rest of the World
APEC nations accounted for 39% of world population in 1990. They are projected to account for 35% of world population by the year 2010.

Primary Energy APEC and the World
0
100
200
300
400
500
600
1990 2010
PJ (
Th
ou
san
ds)
APEC Rest of the World
APEC nations accounted for 44% of world primary energy use in 1990. They are projected to account for 51% of world primary energy use by the year 2010.
World Anthropogenic Greenhouse Gas Emissions
0
10
20
30
40
50
60
1990 2010
eC
O 2 (
millio
ns k
t)
CO2 emissions from fossil fuel combustion accounted for 55% of world anthropogenic greenhouse gas emissions in 1990. It is forecast to account for
59% of world greenhouse gas emissoins by the year 2010.
Aspen Global Change Institute, Presentation Materials, July 1999
47/15/99 4Page 4
Aspen Global Change Institute, Presentation Materials, July 1999
0% 20% 40% 60% 80% 100% 120%
Singapore
Hong Kong
Australia
New Zealand
United States
Canada
Chile
Japan
Mexico
Brunei Darussalam
Philippines
Korea, Rep
Malaysia
China
Indonesia
Thailand
Papua New Guinea
Taipei
APEC
1955 2015
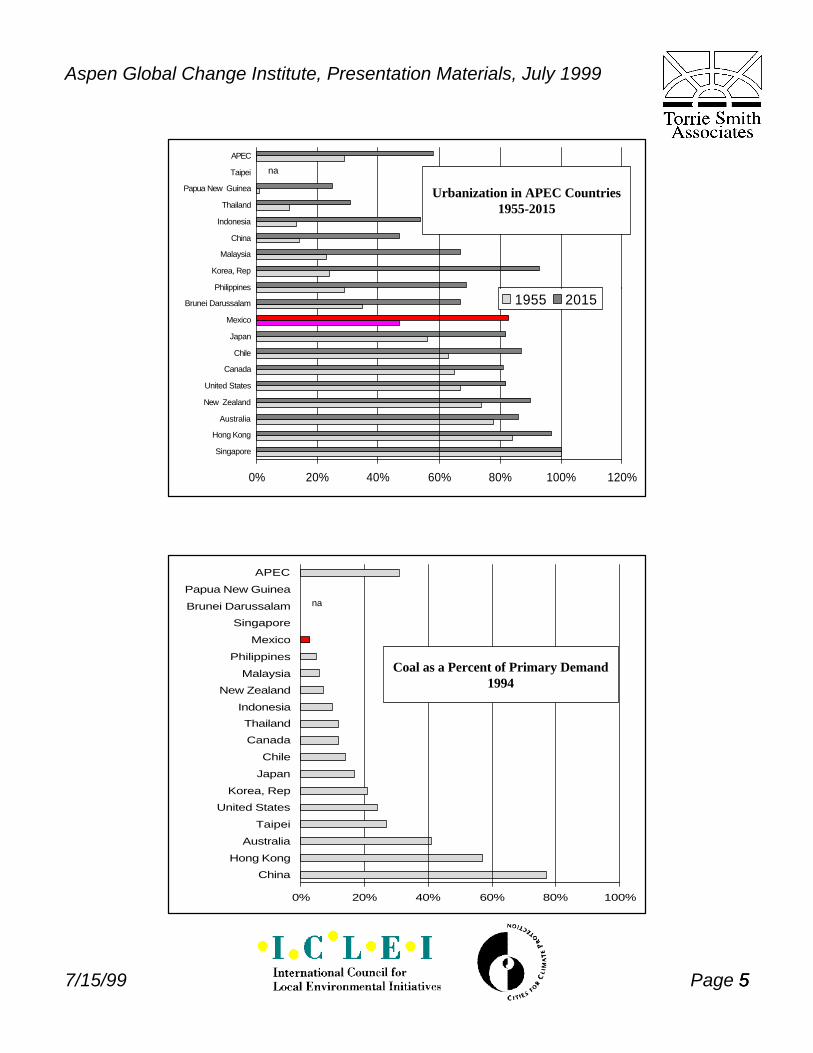
na
Urbanization in APEC Countries 1955-2015
0% 20% 40% 60% 80% 100%
China
Hong Kong
Australia
Taipei
United States
Korea, Rep
Japan
Chile
Canada
Thailand
Indonesia
New Zealand
Malaysia
Philippines
Mexico
Singapore
Brunei Darussalam
Papua New Guinea
APEC
Coal as a Percent of Primary Demand 1994
na
Page 5557/15/99

Aspen Global Change Institute, Presentation Materials, July 1999
0 20 40 60 80
Canada
United States
Japan
Australia
New Zealand
Korea, Rep
Brunei Darussalam
Hong Kong
Chile
Taipei
Singapore
Mexico
Malaysia
China
Thailand
Indonesia
Philippines
Papua New Guinea
APEC
GJ/Capita
Per Capita Residential/Commercial Energy - 1994na
0 20 40 60 80 100
United States
Canada
Australia
New Zealand
Japan
Korea, Rep
Taipei
Hong Kong
Mexico
Singapore
Malaysia
Chile
Thailand
Indonesia
Philippines
China
Papua New Guinea
Brunei Darussalam
APEC
GJ/Capita
na
na Per Capita Transportation
Energy - 1994
Page 6667/15/99

Aspen Global Change Institute, Presentation Materials, July 1999
7/15/99
na
Gas and Electricity as a Share of Final Demand - 1994
APEC
Papua New Guinea
China
Chile
Korea, Rep
Philippines
Thailand
Indonesia
Taipei
Malaysia
Mexico
Japan
Brunei Darussalam
Australia
New Zealand
United States
Hong Kong
Canada
Singapore
0% 10% 20% 30% 40% 50% 60% 70%
Gas Electricity
APEC
Papua New Guinea
Brunei Darussalam
Mexico
China
Canada
Chile
Korea, Rep
Indonesia
United States
Australia
Thailand
Taipei
Malaysia
Philippines
New Zealand
Japan
Singapore
Hong Kong
na na
Energy Productivity -- GDP/Unit of Final Demand - 1980-1993
0 50 100 150 200 250 300 350 400
millions 1987US$/PJ in 1993
1980 1993
77Page 7

Aspen Global Change Institute, Presentation Materials, July 1999
Per capita CO2 Emissions (Energy) in Miami, Florida (Dade County) in 1988, By Source and by Sector
(Total 11.56 tonnes eCO2/capita)
0.00
1.00
2.00
3.00
4.00
5.00
6.00
Residential Comm Bldgs Transport Industry
To
nn
es e
CO
2 p
er c
apit
a
Electrcity Nat Gas Oil Fuels Coal
Per capita Greenhouse Gas Emissions in Denver,Colorado, 1988, By Source and by Sector
(Total 22.26 tonnes eCO2/capita)
To
nn
es e
CO
2 p
er c
apit
a
10 9 8 7 6 5 4 3 2 1 0
Residential Comm Bldgs Transport Industry
87/15/99 8Page 8
Electrcity Nat Gas Oil Fuels

Aspen Global Change Institute, Presentation Materials, July 1999
Per capita CO2 Emissions (Energy) in Portland,Oregon, 1988, By Source and by Sector
(Total 9.04 tonnes eCO2/capita) T
on
nes
eC
O2
per
cap
ita
7.00
6.00
5.00
4.00
3.00
2.00
1.00
0.00
Residential Comm Bldgs Transport Industry
Electrcity Nat Gas Oil Fuels
97/15/99 9Page 9
Per capita Greenhouse Gas Emissions in Toronto, 1990, By Source and by Sector
(Total 12.23 tonnes eCO2/capita)
0
0.5
1
1.5
2
2.5
3
3.5
4
Residential Comm Bldgs Transport Industry Waste
To
nn
es e
CO
2 p
er c
apit
a
Electrcity Nat Gas Oil Fuels

Aspen Global Change Institute, Presentation Materials, July 1999
Per capita CO2 Emissions (Energy) in Hannover, Germany, 1988, By Source and by Sector
(Total 10.63 tonnes eCO2/capita)
0
0.5
1
1.5
2
2.5
3
3.5
Residential Comm Bldgs Transport Industry
To
nn
es e
CO
2 p
er c
apit
a
District Heat Electrcity Nat Gas Oil Fuels Coal
Per capita CO2 Emissions (Energy) in Helsinki, Finland, 1988, By Source and by Sector
(Total 8.31 tonnes eCO2/capita)
0
0.5
1
1.5
2
2.5
3
3.5
Residential Comm Bldgs Transport Industry
To
nn
es e
CO
2 p
er c
apit
a
District Heating Electrcity Nat Gas Oil Fuels
Page 1011007/15/99

Per capita CO2 Emissions (Energy) in Copenhagen, Denmark, 1988, By Source and by Sector
(Total 7.52 tonnes eCO2/capita)
0 0.5
1 1.5
2
2.5 3
3.5 4
4.5
Residential Comm Bldgs Transport Industry
To
nn
es e
CO
2 p
er c
apit
a
Emissions Trends, Toronto vs Canada
0
20
40
60
80
100
120
140
1990 = 100
Toronto Canada High Canada Low
Toronto’s 20% Target �
1990 1995 2005 Projection
Canada High and Canada Low are projections of emissions by Environment Canada
Aspen Global Change Institute, Presentation Materials, July 1999
Oil FuelsDistrict Heat Electrcity Nat Gas
117/15/99 11Page 11

Aspen Global Change Institute, Presentation Materials, July 1999
Local governments influence emissions and the scope for emission reductions through their direct and indirect control and influence over such items as:
– Local roads, including traffic management and parking
– Transportation other than roads, including public transit, cycling, pedestrian infrastructure
– Recreational and cultural facilities, community heritage, park lands and green space
– Policing, the safety and protection of people and property
– Social welfare assistance and services
– Business and economic development
– Planning, operation, ownership and policy direction of public transit
– The pattern of public and private investment in the community
– The determination of urban form through zoning and land use regulation
Page 1211227/15/99

Aspen Global Change Institute, Presentation Materials, July 1999
And the list continues...
– Regulation and planning of land use and the built environment, including residential and commercial buildings, site layout
– Storm sewers and drainage infrastructure
– Aspects of environmental and public health and safety
– Solid waste management, recycling and landfill facilities
– Firefighting and prevention capability
– Water supply and sewage treatment infrastructure
– Their own use of fuels and electricity
– Ownership, control of energy utilities
Greenhouse Gas Reduction Strategies YieldMultiple Benefits
� Local Air Quality Improvement � Financial Savings � Job Creation � Local Economic Development � Strategic Partnerships � Sustainable Development
Page 1311337/15/99

Aspen Global Change Institute, Presentation Materials, July 1999
Strategic Principles for Sustainable Cities
� Ecological Integrity � Anticipate and Prevent � Human Welfare � Social Justice � Self-Determination � Negotiate “Outward”
Design Guides for Sustainable UrbanEnergy
� An Energy Demand Focus � Efficiency � Renewable Energy Resources � Environmentally Benign � Least Cost � Diversity, Flexibility, Resilience � Equitable � Socially Benign
147/15/99 14Page 14
Aspen Global Change Institute, Presentation Materials, July 1999
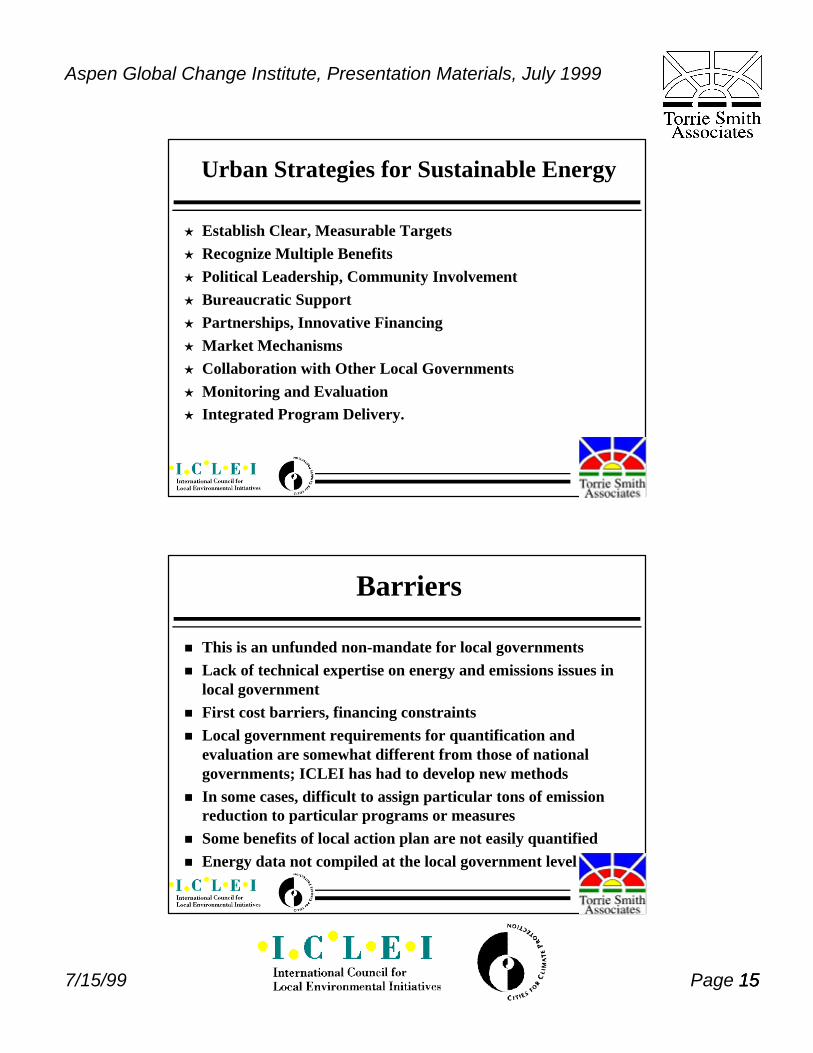
Urban Strategies for Sustainable Energy
� Establish Clear, Measurable Targets � Recognize Multiple Benefits � Political Leadership, Community Involvement � Bureaucratic Support � Partnerships, Innovative Financing � Market Mechanisms � Collaboration with Other Local Governments � Monitoring and Evaluation � Integrated Program Delivery.
Barriers
� This is an unfunded non-mandate for local governments � Lack of technical expertise on energy and emissions issues in
local government � First cost barriers, financing constraints � Local government requirements for quantification and
evaluation are somewhat different from those of national governments; ICLEI has had to develop new methods
� In some cases, difficult to assign particular tons of emission reduction to particular programs or measures
� Some benefits of local action plan are not easily quantified � Energy data not compiled at the local government level
Page 1511557/15/99

Aspen Global Change Institute, Presentation Materials, July 1999
Cities for Climate Protection Campaign
� International network of cities committed to strategic local action on climate change
� As of December 1998, 260 members representing over 175 million people from 41 nations, and accounting for 7% of global CO2 emissions
� Active national campaigns in United States, Canada, Australia; strong membership and regional activity in Europe; growing interest from developing country towns and cities
Cities for Climate Protection
� Encouragement of and support for local governments working to reduce greenhouse gas emissions and air pollution through local actions
� Development of methods and tools to support local government action
� Facilitation of local government representation in national and international policy forums (series of summit meetings including Berlin, Saitama, New York)
Page 1611667/15/99

Aspen Global Change Institute, Presentation Materials, July 1999
CCP Membership Requirements
� A local government resolution adopted by the council or appropriate bureaucratic authority
� Commitment to meeting FIVE KEY MILESTONES 1 Emissions analysis, for both community and in-house
operations for selected base year
2 Forecast emissions for the target year
3 Establish an emissions reduction target
4 Evaluate measures, develop local action plan, obtain approval
5 Implement Policies and Measures, Track Progress
Quantification
� CCP has been a performance based campaign, from the outset
� Quantification of emissions and emission reductions is a required element for campaign participation
� ICLEI and the member cities of CCP are developing methods and standards for local government emission reduction quantification, monitoring and evaluation
Page 1711777/15/99

Aspen Global Change Institute, Presentation Materials, July 1999
Analytical and Data Issues
� Inventory Vs. Measure Evaluation
� Physical Boundary -- City Vs. Metro
� Which Gases? Which Emissions?
� Special Case of Electricity
� Data Trackability Vs. Data Quality
� Bottom Up Vs. Top Down
� How Much Detail is Enough?
Quantification in the Cities for ClimateProtection Campaign I
� A detailed protocol for quantification of emissions and emission reductions has been developed and is being applied in the CCP campaign
� The protocol is embedded in software that has been developed for the CCP to quantify emissions and emission reduction measures
� Scope includes both in-house emissions from local government operations and emissions from the community at large
Page 1811887/15/99

Aspen Global Change Institute, Presentation Materials, July 1999
Quantification in the Cities for ClimateProtection Campaign - II
� All Kyoto gases included, but focus is on CO2 from energy and methane from organic waste
� Electricity emissions tracked on an end use basis
� Methane commitment method used to supplement “waste in place” approach to methane emissions
� Standardized bottom-up approach to transportation sector based on simple five factor formula -- trips, trip lengths, vehicle efficiency, vehicle occupancy, emissions per unit of fuel
Greenhouse Gas Mitigation and QuantificationFramework -- Design Guidelines
� User requirements come first.
� Pragmatic -- the “so what” test rules. Stick to what matters most.
� Flexible -- diversity of users with different levels of resources and data.
� Reproducible -- tracking and evaluation. Use existing databases.
� Standardized -- common methods, protocols.
� Integrated -- co-benefits, air pollutants, paybacks.
Page 1911997/15/99

Aspen Global Change Institute, Presentation Materials, July 1999
Greenhouse Gas Emissions Software -- the Need
� A tool for comprehensive, strategic planning
� NOT a tool for detailed analysis of building energy systems or electricity DSM measures or any other specific type of measure
� Compiles information about emissions and emission reductions from all sources in a single framework to facilitate target-oriented strategic planning for emission reductions
Objectives of the CCP Software
� To help members of the Cities for Climate Protection Campaign develop their local action plans and monitor emission reduction progress. To empower local governments to contribute to national GHG emission reduction targets.
� To quantify the financial savings, criterion air pollutant reductions and other co-benefits of greenhouse gas emission reduction strategies
� By standardizing methods and conventions, to facilitate the sharing of information, expertise and resources among local governments
Page 2022007/15/99
Aspen Global Change Institute, Presentation Materials, July 1999
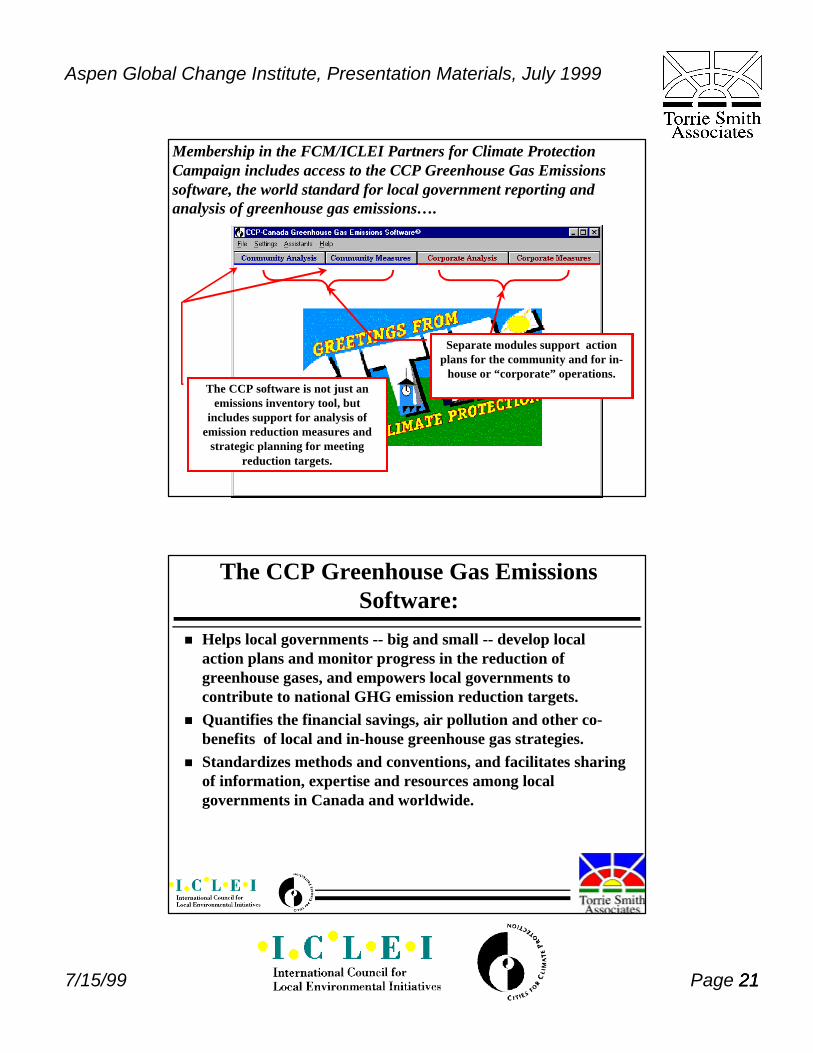
Membership in the FCM/ICLEI Partners for Climate Protection Campaign includes access to the CCP Greenhouse Gas Emissions software, the world standard for local government reporting and analysis of greenhouse gas emissions….
The CCP software is not just an emissions inventory tool, but
includes support for analysis of emission reduction measures and
strategic planning for meeting reduction targets.
Separate modules support action plans for the community and for in
house or “corporate” operations.
The CCP Greenhouse Gas EmissionsSoftware:
� Helps local governments -- big and small -- develop local action plans and monitor progress in the reduction of greenhouse gases, and empowers local governments to contribute to national GHG emission reduction targets.
� Quantifies the financial savings, air pollution and other cobenefits of local and in-house greenhouse gas strategies.
� Standardizes methods and conventions, and facilitates sharing of information, expertise and resources among local governments in Canada and worldwide.
Page 2122117/15/99

Aspen Global Change Institute, Presentation Materials, July 1999
User friendly, Windows “point and click” format…
Automatic energy unit selection and conversions
Quick emissions inventory organized by key sectors, including carbon dioxide
from fuels and electricity, methane from waste, and other GHG gases.
Over 40,000 words of illustrated Hypertext
Help files
Greenhouse gas emissions
automatically computed and
displayed.
Corporate modules track emissions and emission reductions for key sources from local government operations -- buildings, vehicles,
streetlights, water pumping and sewage treatment plants, waste, and “other”.
Throughout software,
emissions from electricity
automatically reflect provincial
electricity mix.
Corporate modules
track energy costs.
Page 2222227/15/99

Measures “calculators”prompt the user for the
data necessary to quantifyemission reductions...
Aspen Global Change Institute, Presentation Materials, July 1999
Generic emission reduction measures are defined, which the user customizes with local data...
Multiple assistants and step-by-step
guides in the Help files make
quantification of emission reduction
measures easy...
Summary and Detailed Reports are Pre-formatted and Ready to Print...
Your town’s name and
province appear here
Summary of emissions of
greenhouse gases and energy,
including percent contributions from
each sector
All reports can be exported to
spreadsheets and graphics programs
Page 2322337/15/99

Aspen Global Change Institute, Presentation Materials, July 1999
One of several pre-formatted reports, this one summarizing total emission reductions and
savings from all measures in the local action plan.
Measures Summary Reports include comparison
of base year emissions, forecast emissions, target
level emissions, and impact of local action plan.
Many more features…..
� Tracks air pollution benefits from measures in local action plan
� Waste module includes the greenhouse gas benefits of waste reduction, recycling, and composting measures
� Detailed reports on measures include energy savings, emission reductions, financial payback, analysis of measure’s contribution to your target
� All the elements of the Partners for Climate Protection Campaign milestone process are supported -- emissions inventories, target setting, forecasting, and quantification of emission reduction measures
Page 2422447/15/99

Aspen Global Change Institute, Presentation Materials, July 1999
CCP Software -- Status
� In the United States, in use by more than 50 cities participating in Cities for Climate Protection Campaign.
� In Australia, selected by the Commonwealth government as official software for Australian local governments.
� In Canada, being used by Federation of Canadian Municipalities and ICLEI’s Partners for Climate Protection Campaign for local government action on climate change.
� In Europe, in use by individual cities, with a U.K. and European editions under development for release in 1999.
� Pilot testing underway in Mexico and the Philippines to prepare version for application in developing country cities.
CCP Software -- Development Plans
� To continue to establish the CCP protocol and software as an international standard for local government GHG analysis.
� To enhance the analysis of co-benefits of GHG reduction strategies, especially air pollutant reductions and job creation impacts of measures.
� To develop a version for group use that will support nested inventories in metropolitan areas where several local governments are working together.
� Enhanced reporting features. � Expanded, Hyper-linked help files with additional default
data, surrogates, technical documentation.
Page 2522557/15/99

Aspen Global Change Institute, Presentation Materials, July 1999
A Closer Look at Transportation
� Gas consumption has been nearly steady, but its about to rise
� Transit ridership down, almost everywhere
� Origin-destination matrix has changed much faster than models and databases
� Much urban form innovation taking place, but too little tracking of environmental results
� Vehicle fuel efficiency deteriorating
Some More Observations
� Market mechanisms have a role, but understand behaviour � Integrated transport planning seems inadequate response � This is an urban design problem; the “transportation
problem” cannot be solved in isolation � Technical fix (more efficient technology, cleaner fuels) is
critical in short term, but inadequate response in long term. � Addressing the demand side is critical -- number of trips,
length of trips, vehicle occupancy. Need to think in terms of “mobility efficiency” or “mobility productivity” like we think of labour or energy productivity.
Page 2622667/15/99

Aspen Global Change Institute, Presentation Materials, July 1999
The Transportation Web
DEMAND FOR ACCESS, DERIVED DEMAND FOR MOBILITY
(Number and length of person-trips)
TRANSPORTATION INFRASTRUCTURE
INVESTMENT (roads and bridges,
bikeways, pedestrian infrastructure, transit
faciliteis, etc.)
VEHICLE AND FUEL TECHNOLOGY
(vehicle fuel efficiency, alternative fuels)
TRANSPORTATION SYSTEM OPERATION (How the system is managed, given a particular demand for mobility, transportation infrastructure, vehicle fleet and fuel
depedence. Everything from driver behaviour to traffic management, parking prices and transit fare ande
scheduling policies and practices).
Local Government Spheres of Influence
� Zoning and Land Use Regulations
� Trip Reduction Measures/Ordinances
� Investment in roadways, transit, pedestrian and bicycle infrastructures
� Operation of roadways, transit
� Parking policies
� Municipal fleets
� Vehicle efficiency and emission standards and programs
Page 2722777/15/99
Potential of Local Government Influence to Impact FactorVMT Factors Vehicle/Fuel Factors
Spheres of LocalGovernmentInfluence
No. ofTrips
Lengthof Trips
No. ofPeople perVehicle
Energyper VMT
Emissionsper Unit ofEnergy
Land Use/Zoning Strong Strong
Trip Making Strong Weak Strong
Roadway InfrastructureInvestment Strong
Traffic Management Strong Moderate Weak
Transit SystemInfrastructure Strong Weak Strong
Pedestrian & BicycleInfrastructure Strong Strong
ParkingPolicies/Pricing Strong Weak
Transit SystemOperations, Pricing Strong Strong Strong
Vehicle Efficiency &Maintenance Strong Strong
Aspen Global Change Institute, Presentation Materials, July 1999
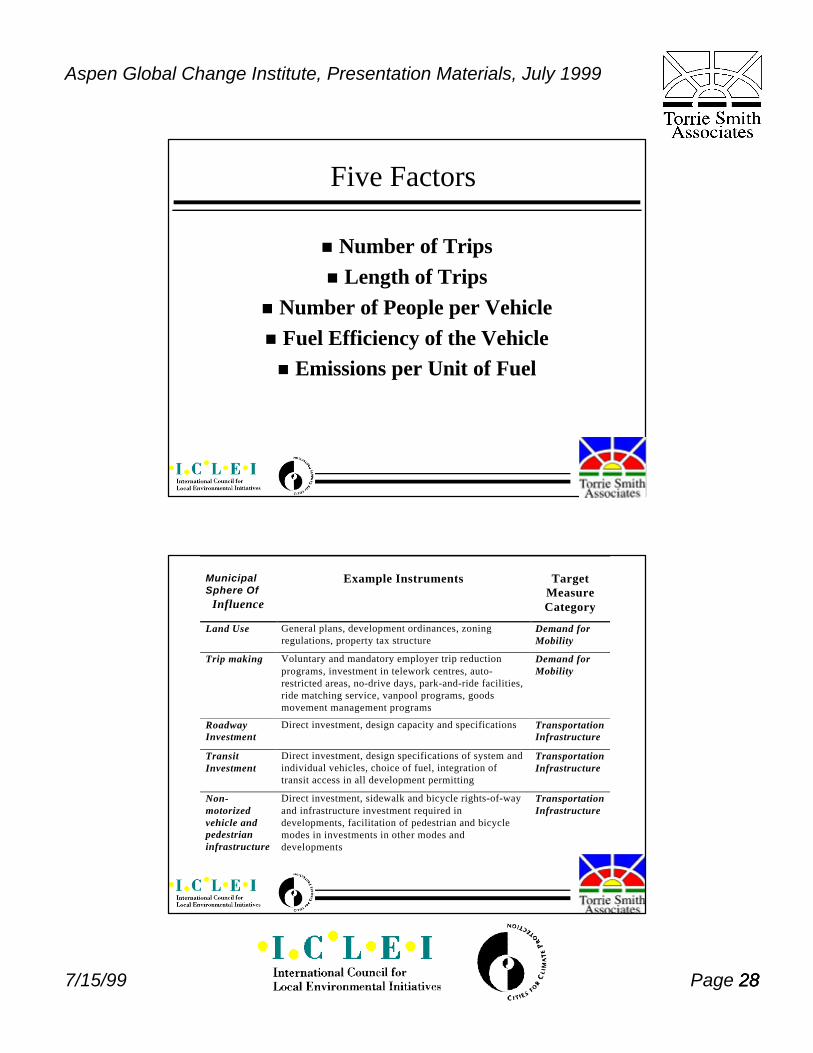
Five Factors
� Number of Trips � Length of Trips
� Number of People per Vehicle � Fuel Efficiency of the Vehicle � Emissions per Unit of Fuel
Municipal Sphere Of
Influence
Example Instruments Target Measure Category
Land Use General plans, development ordinances, zoning regulations, property tax structure
Demand for Mobility
Trip making Voluntary and mandatory employer trip reduction programs, investment in telework centres, auto-restricted areas, no-drive days, park-and-ride facilities, ride matching service, vanpool programs, goods movement management programs
Demand for Mobility
Roadway Investment
Direct investment, design capacity and specifications Transportation Infrastructure
Transit Investment
Direct investment, design specifications of system and individual vehicles, choice of fuel, integration of transit access in all development permitting
Transportation Infrastructure
Non-motorized vehicle and pedestrian infrastructure
Direct investment, sidewalk and bicycle rights-of-way and infrastructure investment required in developments, facilitation of pedestrian and bicycle modes in investments in other modes and developments
Transportation Infrastructure
Page 2822887/15/99

Aspen Global Change Institute, Presentation Materials, July 1999
M u n i c i p a l E x a m p l e I n s t r u m e n t s T a r g e t S p h e r e o f M e a s u r e I n f l u e n c e C a t e g o r y
L a n d U s e G e n e r a l p l a n s , d e v e l o p m e n t o r d i n a n c e s , z o n i n g D e m a n d f o r r e g u l a t i o n s , p r o p e r t y t a x s t r u c t u r e M ob i l i t y
T r i p m a k i n g V o l u n t a r y a n d m a n d a t o r y e m p l o y e r t r i p r e d u c t i o n D e m a n d f o r p r o g r a m s , i n v e s t m e n t i n t e l e w o r k c e n t r e s , a u t o - M ob i l i t y r e s t r i c t e d a r e a s , n o - d r i v e d a y s , p a r k - a n d - r i d e f a c i l i t i e s , r i d e m a t c h i n g s e r v i c e , v a n p o o l p r o g r a m s , g o o d s m o v e m e n t m a n a g e m e n t p r o g r a m s
R o a d w a y D i r e c t i n v e s t m e n t , d e s i g n c a p a c i t y a n d s p e c i f i c a t i o n s T r a n s p o r t a t i o n I n v e s t m e n t I n f r a s t r u c t u r e
T r a n s i t D i r e c t i n v e s t m e n t , d e s i g n s p e c i f i c a t i o n s o f s y s t e m a n d T r a n s p o r t a t i o n I n v e s t m e n t i n d i v i d u a l v e h i c l e s , c h o i c e o f f u e l , i n t e g r a t i o n o f I n f r a s t r u c t u r e
t r a n s i t a c c e s s i n a l l d e v e l o p m e n t p e r m i t t i ng
N o n - D i r e c t i n v e s t m e n t , s i d e w a l k a n d b i c y c l e r i g h t s - o f - w a y T r a n s p o r t a t i o n m o t o r i z e d a n d i n f r a s t r u c t u r e i n v e s t m e n t r e q u i r e d i n I n f r a s t r u c t u r e v e h i c l e a n d d e v e l o p m e n t s , f a c i l i t a t i o n o f p e d e s t r i a n a n d b i c y c l e p e d e s t r i a n m o d e s i n i n v e s t m e n t s i n o t h e r m o d e s a n d i n f r a s t r u c t u r e d e v e l o p m e n t s
Municipal Example Instruments Target Sphere of Measure Influence Category
Roadway Computerized traffic management for maximum Transportation operations average speeds, high occupancy vehicle lanes, System
maintenance and repair of roadways, traffic calming Operation and smoothing, road pricing, peak pricing, ramp metering, off-peak goods delivery bylaws
Transit Fare integration, schedule improvement and Transportation system coordination, facilitation of intermodal transfer, System operations transit priority lanes and rights-of-way, integrated Operation
use of taxis in transit operations Parking Control supply and/or pricing of parking in Demand for
downtown core, parking taxes and “cash out” Mobility programs
297/15/99 29Page 29

Aspen Global Change Institute, Presentation Materials, July 1999
Municipal Example Instruments Target Sphere of Measure Influence Category
Municipal Coordinated scheduling of vehicle use, downsizing of Transportation Fleet fleet, matching vehicles to tasks System Operations Operation
Vehicle Fuel Mandatory vehicle maintenance programs, specified Vehicle/Fuel Efficiency levels of zero emission vehicles in total on-road fleet, and fuel economy standards, feebate schemes, alternative Emissions fuel infrastructure investment, driver education
programs, anti-idling bylaws, buybacks of older vehicles
Potential of Local Government Influence to Impact Factor VMT Factors Vehicle/Fuel Factors
Spheres of Local Government Influence
No. of Trips
Length of Trips
No. of People per Vehicle
Energy per VMT
Emissions per Unit of Energy
Land Use/Zoning Strong Strong Trip Making Strong Weak Strong Roadway Infrastructure Investment
Strong
Traffic Management Strong Moderate Weak Transit System Infrastructure
Strong Weak Strong
Pedestrian & Bicycle Infrastructure
Strong Strong
Parking Policies/Pricing
Strong Weak
Transit System Operations, Pricing
Strong Strong Strong
Vehicle Efficiency & Maintenance
Strong Strong
Page 3033007/15/99

Aspen Global Change Institute, Presentation Materials, July 1999
Some Observations
� Gas consumption has been nearly steady, but its about to rise
� Transit ridership down, almost everywhere
� Origin-destination matrix has changed much faster than models and databases
� Much urban form innovation taking place, but too little tracking of environmental results
� Vehicle fuel efficiency deteriorating
Some More Observations
� Alternative fuels overemphasized
� Market mechanisms have a role, but understand behaviour
� Integrated transport planning seems inadequate response
� This is an urban design problem; the “transportation problem” cannot be solved in isolation
Page 3133117/15/99
Aspen Global Change Institute, Presentation Materials, July 1999
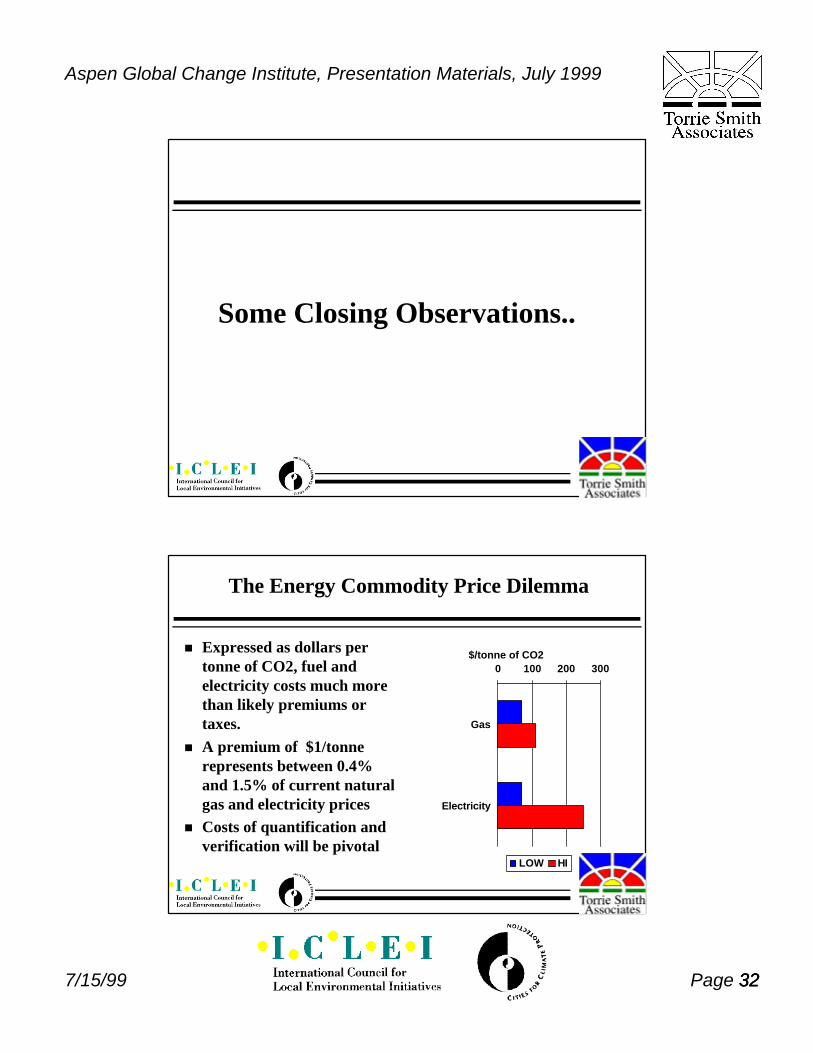
Some Closing Observations..
The Energy Commodity Price Dilemma
$/tonne of CO2 0 100 200 300
Gas
Electricity
LOW HI
� Expressed as dollars per tonne of CO2, fuel and electricity costs much more than likely premiums or taxes.
� A premium of $1/tonne represents between 0.4% and 1.5% of current natural gas and electricity prices
� Costs of quantification and verification will be pivotal
Page 3233227/15/99

Aspen Global Change Institute, Presentation Materials, July 1999
Emission Reductions Vs. Rate of Return
0
5
10
15
20
25
30
0%
Energy savings, and therefore emission reductions, rise very steeply as the discounted rate of return drops below 20%
Public investment can be used to move the effort up the curve
�
En
erg
y S
avin
gs
�
10% 20% 30% 40% 50%
Rate of Return
One Problem -- Two Perspectives
Steady As She Goes � Risk is doing too much, too soon � Scientific evidence not strong
enough yet -- “no smoking gun” � Mitigation will reduce welfare,
damage economy � Unilateral action will damage
nation’s competitiveness � Global emissions will increase if
rich countries impose binding emission reduction targets
Mitigate Now � Risk is doing too little, too late � Scientific consensus justifies
invoking precautionary principle � Mitigation is key to sustaining the
economy � Economies that act first will be
global winners in 21st century � Rich countries should stabilize
emissions soon, absolute reductions in medium term
Page 3333337/15/99

Aspen Global Change Institute, Presentation Materials, July 1999
One Problem, Two Perspectives
Steady As She Goes � No binding targets or timetables;
no caps on absolute emissions � Voluntary actions only, let the
market fix it � There is significant cost effective
potential for lowering emission intensity of economy; let the market get it, playing field “works for us”
� Led by coal, petroleum and energy intensive industries, followed by government action
Mitigate Now � Binding targets and timetables;
the cap is the whole point � Market mechanisms yes, but
voluntarism no � 20-30% reduction in emission
intensity of the economy is cost effective, even without valuing environmental externalities, but uneven playing field blocks it
� Led by environmentalists, climate scientists, followed by government rhetoric
Page 3433447/15/99