climate change and health profile report calaveras county document library/chprs... · climate...
TRANSCRIPT

Climate Change and Health Profile Report Calaveras County
February 2017
This report was supported by the Centers for Disease Control and Prevention (CDC) Cooperative Agreement 5UE1EH001052 and the California Department of Public Health ndash Office of Health Equity Its contents are solely the responsibility of the authors and do not necessarily represent the official views of the CDC
Authors Neil Maizlish Dorette English Jacqueline Chan Kathy Dervin Paul English
Graphics Lauren Wohl Design Evaluation Mary Anne Morgan GIS Support David Ozer
Suggested citation Maizlish N English D Chan J Dervin K English P Climate Change and Health Profile Report Calaveras County Sacramento CA Office of Health Equity California Department of Public Health 2017
Office of Health Equity California Department of Public Health 850 Marina Bay Parkway Richmond CA 94804 calbracecdphcagov
This report incorporates information from several state agencies and their contractors whose work included the following disclaimers This information is being made available for informational purposes only Users of this information agree by their use to hold blameless the State of California and its respective officers employees agents contractors and subcontractors for any liability associated with its use in any form This work shall not be used to assess actual coastal hazards insurance requirements or property values and specifically shall not be used in lieu of Flood Insurance Studies and Flood Insurance Rate Maps issued by the Federal Emergency Management Agency (FEMA) Some California counties may have more geographically refined data on climate risks than those presented in this report
TABLE OF CONTENTS
Message from CDPH Director Dr Karen Smith i
Acknowledgementsii
Introduction1
Background 2
What is climate change 2
How does climate change impact climate and weather 2
What are the climate projections for the North Sierra Region4
What are the climate projections for Calaveras County 6
Projected Temperature Changes in Calaveras County 6
Current Fire Hazard Severity Zones in Calaveras County 7
Projected Wildfire Acreage in Calaveras County 9
Overview of climate change and health impacts 10
Extreme Weather-Related Injury Displacement and Mental Health 10
Health Impacts of Heat 11
Health Impacts of Drought 11
Vector Borne Illness and Food Insecurity 11
Sea Level Rise Mold and Indoor Air Quality 11
Socioeconomic Disruption 12
Which population subgroups are most vulnerable 13
What are the health status health inequities and population vulnerabilities in
Calaveras County 14
Selected public health strategies and action steps for climate change 18
Resources20
References 21
Appendices 23
Appendix 1 How are future changes in climate predicted 23
Appendix 2 Public health impacts of climate change in California 24
Appendix 3 Indicator data sources 27
MESSAGE FROM CALIFORNIA DEPARTMENT OF PUBLIC HEALTH DIRECTOR DR KAREN SMITH I am pleased to present Climate Change and Health Profile reports for each of the counties in California The reports provide climate change projections for counties and identify vulnerabilities and assets to support local adaptation planning for climate change The Climate Change and Health Profile reports are the first in a series of CalBRACE materials being developed by the CDPH Office of Health Equity to foster mobilization to prevent and reduce injury and disease related to climate change
As we continue building capacity to address climate change we are also aligning CDPHrsquos work with the Governorrsquos Executive Order B-30-15 which specifically addresses the need for climate adaptation and ldquoactions [that] should protect the statersquos most vulnerable populationsrdquo The mission of the Office of Health Equity is to achieve the highest level of health and mental health for all people with special attention focused on those who have experienced socioeconomic disadvantage and historical injustice These reports focus resources on planning to protect those most vulnerable to the health impacts of climate change We are also working with others in California to achieve emissions reduction targets in order to slow further climate changes These steps further our goal of becoming the healthiest state in the nation
Each California county will experience the health impacts of climate change uniquely The CDPH Office of Health Equityrsquos CalBRACE project provides tools and resources to counties so that they can prioritize and adopt climate change adaptation and preparation strategies that fit their communities and geographies
Climate change challenges our commitment to achieve equity in health and wellbeing in California as it deepens the need to take actions that reduce vulnerabilities and increase resilience to climate change in our communities Faced with this challenge we approach climate change planning as an opportunity to improve living conditions and social determinants of health so that we can improve health equity and address climate change These reports are one component of a comprehensive approach to creating healthy equitable communities and building resilience to climate change impacts I hope that these reports provide you with information you can apply as you join me in this effort to protect our communities from the preventable health impacts of climate change
Sincerely
Karen Smith MD MPH CDPH Director and State Public Health Officer
i
ACKNOWLEDGEMENTS The authors appreciate the review and contributions provided by many people including
Steven Davis Jane Horton and Arie Manangan Federal Centers for Disease Control and Prevention (CDC)
Abe Doherty Ocean Protection Council and California Natural Resources Agency
Matthew Heberger Pacific Institute
David Sapsis and Chris Keithley California Department of Forestry and Fire (CAL FIRE)
Leroy Westerling University of California Merced
California Department of Public Health Contributors Dulce Bustamante Office of Health Equity
Rickie Cleere Office of Health Equity
Solange Gould Office of Health Equity
Linda Helland Office of Health Equity
Sumi Hoshiko Environmental Health Investigations Branch (EHIB)
Melissa Ibarra Office of Health Equity
Rob Lipton Office of Health Equity
Meredith Milet Office of Health Equity
Frank Molina Office of Health Equity
Eva Weinstein Office of Heatlh Equity
We also thank the many reviewers from county health departments who provided valuable feedback about local conditions and the challenges and opportunities that exist for them to take action to address health and climate change The local health departments are the vital link to promote public health prevention and wellness in communities cities and neighborhoods
Our work was informed and enriched by the teams from the staff of the CDC Climate-Ready States and Cities Initiativersquos program Building Resilience Against Climate Effects (BRACE) grantee states and cities collaboratives and communities of practice
Cover photo credits California Fire Siege 2007 California Department of Forestry and Fire Protection (CAL FIRE) Jeff Poskanzer California King Tides Project - Open Source and California Division of Occupational Safety and Health (CalOSHA)
ii
INTRODUCTION Through legislation and Governorrsquos Executive Orders the State of California has mobilized to meet the challenges and opportunities posed by climate change The overall strategy is embodied in reducing carbon emissions promoting readiness for climate impacts and conducting research to provide the best available science to guide our actions In the course of this work technical documents strategies and planning guidance have been produced by state agencies including the California Department of Public Health (CDPH)
The Climate Change and Health Profile Report seeks to provide a county-level summary of information on current and projected risks from climate change and potential health impacts This report represents a synthesis of information on climate change and health for California communities based on recently published reports of state agencies and other public data
We have compiled and edited this wealth of information from technical documents and created a report accessible to public health professionals and their partners in state regional and local government the private sector and community-based organizations We also highlight the public health dimensions of climate change along with its environmental impacts
The content of this report was guided by a cooperative agreement between CDPH and the CDC Climate-Ready States and Cities Initiativersquos program Building Resilience Against Climate Effects (BRACE) The goals of BRACE are to assist state health departments to build capacity for climate and health adaptation planning This includes
using the best available climate science to project likely climate impacts identifying climate-related health risks and populations vulnerable to these impacts assessing the added burden of disease and injury that climate change may cause identifying appropriate interventions planning more resilient communities and evaluating to improve the planning effort Communities with economic environmental and social disadvantages are likely to bear disproportionate health impacts of climate change
This Climate Change and Health Profile Report is intended to inform empower and nurture collaboration that seeks to protect and enhance the health and well-being of all California residents
This report is part of a suite of tools that is being developed by the California Department of Public Health to support local regional and statewide efforts of the public health sector to build healthy equitable resilient and adaptive communities ready to meet the challenges of climate change
Along with a county-level climate change and health vulnerability assessment and state guidance documents such as Preparing California for Extreme Heat Guidance and Recommendations the profile provides a knowledge base for taking informed action to address climate change
1
BACKGROUND What is climate change
iStock
An overwhelming consensus of scientists now warns that this climate change is due to human activities
Modern life has entailed the burning of coal natural gas petroleum and other fossil fuels in our power plants factories businesses farms homes and cars Key byproducts of energy production and consumption are carbon dioxide methane and other pollutants These gases are called greenhouse or heat trapping gases because as they mix in the atmosphere they create a barrier that stops heat produced by the sun from escaping the Earthrsquos surface
The changing climate is evident from observations of increased global average air and ocean temperatures widespread melting of snow and ice and rising global average sea level rise1 The average carbon dioxide concentration in the atmosphere topped 400 parts per
million (ppm) in 2013 which far exceeds the range experienced over the last 650000 years12
An overwhelming consensus of scientists now warns that climate change is due to human activities This consensus extends to warning that if we do not curb our current carbon emissions the increase in the planetrsquos temperature will cause significant harm to natural systems and threaten our health and very existence1
Efforts to reduce carbon emissions called mitigation are imperative Because of the longevity of atmospheric carbon dioxide the increased levels already present will continue to cause climate impacts such as sea level rise and atmospheric warming that cannot be reversed3 Adaptation is the term used to describe the measures we take to prepare for and respond to these inevitable climate changes
How does climate change impact climate and weather Changes in atmospheric and ocean temperatures affect the general behavior of Earthrsquos water including how the atmosphere holds water vapor as it warms
2
Along with the timing amount and the manner in which the water circulates (ie the hydrologic cycle) or covers the Earth are all part of what defines our climate and weather
Weather can be thought of as the short-term variability of local daily temperature precipitation (ie rain snow) wind and events like storms (hurricanes tornados etc) throughout a year Climate can be thought of as the general pattern on a larger geographic area and time scale usually in the span of decades
California is unique in the United States and has a Mediterranean type of climate with a distinct dry season (May to October) and wet season (November to April)
which is modified by proximity to the coast or mountains and variable elevation
The future amount of carbon emitted into the Earthrsquos atmosphere has two broad drivers
the dependence of economic growth on fossil fuels and
the growth of the worldrsquos population14
Based on the different combinations of economic development strategies and population growth scientists have constructed formal scenarios4 of future carbon emissions during the 21st century and predicted the associated climate impacts compared to a 1990 baseline4 In an optimistic scenario in which world economies become much less dependent on fossil fuels and the world population levels off after 20501 the average global temperature is predicted to increase by 18degC (32deg F)
In a pessimistic scenario in which we continue to emit greenhouse gases on the same current trajectory climate models predict a 34deg C (61deg F) increase This scenario is based on the assumption that the world continues its path of fossil fuel-intensive economic development and that the world population increases during the 21st century
On the backdrop of gradually increasing temperatures and sea levels these climate models also predict an increase in the frequency and intensity of extreme weather events such as hurricanes floods and droughts1 More information about climate models is described in Appendix 1
3
WHAT ARE THE CLIMATE PROJECTIONS FOR NORTH SIERRA REGION
The impact of climate change in California varies across the state due to diversity in biophysical setting climate and jurisdictional characteristics The California Adaptation Planning Guide organized the state into climate impact regions based on county boundaries in combination with projected climate impacts existing environmental settings socioeconomic factors and regional designations and organizations5 See Figure 1 for a map of climate impact regions
Figure 1 California Climate Impact Regions designated in the California Climate Adaptation Planning Guide5 Sources California Natural Resource Agency
4
Table 1 summarizes Cal-Adapt projections for the North Sierra Region and is intended to identify the major types of changes projected for the region Regional projections may differ from county level projections
Table 1 Summary of Cal-Adapt Climate Projections for the North Sierra Region5
Temperature Change 1990-2100
January increase in average temperatures of 25degF to 4degF by 2050 and 6degF to 7degF by 2100 The largest changes are observed in the southern part of the region July increase in average temperatures of 4degF to 5degF by 2050 and 0degF by the end of the century with the greatest change in the northern part of the region (Modeled high temperatures high carbon emissions scenario)
Precipitation
Precipitation decline is projected throughout the region The amount of decrease varies from 3 to 5 inches by 2050 and 6 inches to more than 10 inches by 2100 with the larger rainfall reductions projected for the southern portions of the region (CCSM3 climate model high carbon emissions scenario)
Heat Wave
Heat waves are defined as five consecutive days over 83degF to 97degF depending on location By 2050 the number of heat waves per year is expected to increase by two A dramatic increase in annual heat waves is expected by 2100 8 to 10 more per year
Snowpack
Snowpack levels are projected to decline dramatically in many portions of the region In southern portions of the region a decline of nearly 15 inches in snowpack levels and a more than 60 percent drop is projected by 2090 (CCSM3 climate model high emissions scenario)
Wildfire Risk Wildfire risk is projected to increase in a range of 11 to 105 times throughout the region with the highest risks expected in the northern and southern parts of the
RANGES
region (GFDL model high carbon emissions scenario)
Source Public Interest Energy Research 2011 Cal-Adapt6 (httpcal-adaptorg)
5
WHAT ARE THE CLIMATE PROJECTIONS FOR CALAVERAS COUNTY Projected Temperature Changes in Calaveras County
Overall temperatures are expected to rise substantially throughout this century During the next few decades scenarios project average temperature to rise between 1degF and 23degF in California6 The projected temperature increases begin to diverge at mid-century so that by the
end of the century the temperature increases projected in the higher emissions scenario are approximately twice as high as those projected in the lower emissions scenario Figure 2 shows the projected temperature changes in 2099 scenarios for Calaveras County6
Figure 2 Projected changes in annual average temperature in future carbon emissions scenariosCalaveras County 20996
6
Current Fire Hazard Severity Zones in Calaveras County While all of California is subject to some degree of fire hazard there are specific features that make some areas more hazardous7 Figure 3 visualizes current fire hazard severity zones in Calaveras County
Fire Hazard Severity Zones (FHSZ) were developed using a computer model7 They predict the physical damage a fire is likely to cause based on the factors that influence fire likelihood and behavior7 Many factors are considered such as fire history existing and potential fuel (natural vegetation) flame length blowing embers terrain and typical weather for the area78
Fire Hazard Severity Zones are categorized into three categories
Moderate Wildland areas supporting areas of typically low fire frequency and relatively modest fire behavior or developedurbanized areas with a very high density of non-burnable surfaces (including roadways irrigated lawnparks and low total vegetation cover (lt30) that is highly fragmented and low in flammability)8
High Wildland areas supporting medium- to high-hazard fire behavior and roughly average burn probabilities or developedurbanized areas with moderate vegetation cover and more limited non-burnable cover Vegetation cover typically ranges from 30-50 and is only partially fragmented 8
Very High Wildland areas supporting high to extreme fire behavior resulting from climax fuels typified by well-developed surface-fuel profiles (eg mature chaparral) or forested systems where crown fire is likely or developedurban areas typically with high vegetation density (gt70 cover) and associated high fuel continuity This allows for flames to spread over much of the area impeded only by isolated non-burnable areas8
The FHSZ rating system is more completely described at httpfrapfirecagovprojectshazardfhsz_review_inst ructionsv1_3bpdf
7
Figure 3 Current Fire Hazard Severity Zones (FHSZ) Calaveras County 20078 Note Map includes only state and local responsibility areas
8
Projected Wildfire Acreage in Calaveras County Periodic natural fire is an important ecosystem disturbance Uncontrolled wildfires however can be extremely damaging to communities and ecosystems Fire can promote vegetation and wildlife diversity release nutrients into the soil and eliminate heavy accumulation of underbrush that can fuel catastrophic fires
The map below (Figure 4) displays the projected increase or decrease in potential area burned based on projections of the Coupled Global Climate Model (version 3) for the high carbon emissions scenario in 20856 The bar graphs to the right of the map in Figure 4 illustrate the
projected time trend over the 21st century for both the high and low emissions scenarios Please note that these data are modeled solely on climate projections and do not take landscape and fuel sources into account The projections of acreage burned are expressed in terms of the relative increase or decrease (greater or less than 1) from a 2010 baseline for fires that consume at least 490 acres The 2010 baseline reflects historic data from 1980-1989 and trends through 2010 Data on the number of fires and the acreage burned are described later in this report
9
Figure 4 Relative increase in wildfire acreage in future carbon emission scenarios Calaveras County6
OVERVIEW OF CLIMATE CHANGE AND HEALTH IMPACTS Researchers have examined the pathways in which increased temperatures and hydrologic extremes can impact health and generally recognize three main pathways direct exposures indirect exposures and socioeconomic disruption (Figure 5)9 Based on the review of weather-related natural disasters and historical patterns1011 and scientific judgment public health researchers have suggested the nature and direction of health
ts912 harms or benefi
Extreme Weather-Related Injury Displacement and M ental Health Extreme weather events (storms flooding) cause fatal and nonfatal injuries from drowning being struck by objects fire explosions electrocution or exposure to toxic materials A widespread weather-related natural disaster may destroy or ruin housing schools and businesses and cause temporary or permanent displacement Individuals and families may experience post-traumatic stress depression and increased risk of suicide1314
Figure 5 Impact of Climate Change on Human Health
Source Federal Centers for Disease Control and Prevention
10
Health Impacts of Heat Increased temperatures manifested as heat waves and sustained high heat days directly harm human health through heat-related illnesses (mild heat stress to fatal heat stroke) and the exacerbation of pre-existing conditions in the medically fragile chronically ill and vulnerable1516 Increased heat also intensifies the photochemical reactions that produce smog and ground level ozone and fine particulates (PM25) which contribute to and exacerbate respiratory disease in children and adults Increased heat and carbon dioxide enhance the growth of plants that produce pollen which are associated with allergies Increased temperatures add to the heat load of buildings in urban areas and exacerbate existing urban heat islands adding to the risk of high ambient temperatures
Health Impacts of Drought Lack of moisture already at a severe level in California due to a current multi-year drought and decades of fuel accumulation from historical forestry and fire suppression practices increases the risk of wildfires17 Devastating wildfires like the Rim Fire of 2013 impact watersheds and increase the risk of landslides or mudslides and sediment in run-off that reduce water quality In addition to fire-related injuries local and regional transport of smoke ash and fine particles increases respiratory and cardiovascular risks
Increasing temperatures and changes in precipitation may lead to intensified drought conditions18 Drought decreases the availability and quality of water for humans This includes reduced water levels to fight
wildfires Drought may increase exposure to health hazards including wildfires dust storms extreme heat events flash flooding degraded water quality and reduced water quantity19 Dust storms associated with drought conditions have been associated with increased incidents of Valley fever a fungal pathogen19
Vector-borne Illnesses Climatic changes alter the range biogeography and growth of microbes and the vectors of food water and vector-borne illnesses19 This includes the changes in aquatic environments that could increase harmful algal blooms and lead to increases in foodborne and waterborne illnesses18
Food Insecurity Climate change is expected to have global impacts on food production and distribution systems19 This can cause food prices to increase which makes food less affordable and increases food insecurity obesity and malnutrition in economically constrained households19
Sea Level Rise Mold and Indoor Air Quality Through sea level rise salt water may intrude into coastal aquifers thus reducing quality and quantity of water supply Coastal erosion can contribute to the loss of recreational venues and pose a variety of hazards to infrastructure and public safety Water intrusion into buildings can result in mold contamination leading to indoor air quality problems19
11
Socioeconomic Disruption Widespread social and economic disruption includes damage to the infrastructure for the delivery of health services and for general economic well-being Health care facilities water treatment plants and roads for emergency responders and transportation for health care personnel can be damaged in climate-related extreme weather events Increased burden of disease and injury will test the surge capacity of health care facilities Economic disruption can lead to income loss income insecurity food insecurity housing insecurity and mental health problems which in turn may increase substance abuse suicide2021 and other health problems
Energy production and distribution is also threatened by heat and wildfires through loss of efficiency generating capacity and fires disrupting transmission lines Californias ports that provide the gateway to goods for California national and international markets are at risk from sea level rise and coastal storms
12
WHICH POPULATION SUBGROUPS ARE MOST VULNERABLE All Californians are vulnerable to the health impacts of climate change Even if one is fortunate to live work study or play in a place without direct contact with wildfires flooding or sea level rise no one can entirely avoid excessive heat or the indirect effects of extreme weather events The table in Appendix 2 summarizes the populations more vulnerable to the health impacts of climate change
Based on medical reviews of individuals who died during heat waves and other extreme weather events those who are particularly vulnerable to the direct effects of climate change include the very old and very young individuals who have chronic medical conditions and psychiatric illness people taking multiple medications people without means for evacuation (no access to public transit or private cars) people who are socially isolated medically fragile people and people living in institutions14 Acclimatization to heat may help reduce risks from heat waves in the healthy general population but may not be sufficient to protect those with underlying medical conditions
A much larger part of the population is vulnerable to intermediate or socioeconomic factors such as preexisting physical and mental health conditions cultural or physical isolation occupations involving outside or high risk work a precarious socioeconomic status or lack of social cohesion and collective efficacy Collective efficacy factors include effective action to plan and coordinate the preparation response and recovery to climate threats17
The underlying burden of disease and injury accounted for by the social determinants of health22 considers the economic service and built environments in which people live work learn and play23 Climate change magnifies existing health disparities Disadvantaged populations such as those with low education experiencing racial segregation low social support poverty and income inequality face disproportionate climate-related health burden24
Community resilience refers to actions taken by individuals neighborhoods organizations and multiple sectors of government to resist and overcome obstacles and to promptly recover from climate threats In the short term this may include traditional elements of public health preparedness and community development However in the long term this may include actions to broadly promote population health and decrease the number of people with physical and mental conditions rooted in the social determinants of health
Health inequities based on raceethnicity income geography (urbanrural) are widespread today in California23 Even without climate change demographic changes already underway will increase the size of vulnerable populations in California in the coming decades The population is aging and the share of individuals aged 65 or more years will increase from 13 percent in 2010 to 19 percent in 205025 In many California communities racial and ethnic minorities constitute the majority of residents
13
WHAT ARE THE HEALTH STATUS HEALTH INEQUITIES AND POPULATION VULNERABILITIES IN CALAVERAS COUNTY Climate change impacts the health and well-being of Californians Estimates for health status health inequities and population vulnerabilities are summarized in Figures 6 and 7 In some cases where data are sparse data are pooled for Alpine Amador Calaveras Inyo Mariposa Mono and Tuolumne counties (Eastern Counties)
There is a broad range of environmental hazards attributed to climate change including heat waves wildfires and wildfire smoke air pollution sea level rise and inland flooding
All Californians are at risk from extreme heat In 2010 approximately 85 (38649 residents) of the countyrsquos population lived in fire hazard zones of moderate to very high severity From 1980 to 1989 (a pre-climate change baseline) 66 wildfires at least 490 acres in size consumed a total of 369363 acres in the North Sierra Region
Climate change affects the social and environmental drivers of health outcomes The effects of climate change can exacerbate existing health conditions and compound the risks of adverse health outcomes The age-adjusted death rate which takes into account the effect of the populationrsquos age distribution is a basic indicator of the health status of communities In 2010 the age-adjusted death rate in Calaveras County was lower than the state average Disparities in death rates among raceethnicity groups highlight how certain populations disproportionately experience health impacts Within the county the highest death rate occurred among Whites
and the lowest death rate occurred among HispanicsLatinos
In 2012 nearly 38 of adults (pooled for the Eastern Counties) reported one or more chronic health conditions including heart disease diabetes asthma severe mental stress or high blood pressure In 2012 11 of adults reported having been diagnosed with asthma (pooled for Alpine Amador Calaveras Inyo Mariposa Mono and Tuolumne counties) In 2012 approximately 19 of adults were obese (pooled for Alpine Amador Calaveras Inyo Mariposa Mono and Tuolumne counties statewide average was 25) In 2012 nearly 18 of residents aged 5 years and older had a mental or physical disability (statewide average was 10)
In 2005-2010 there was an annual average of 13 heat-related emergency room visits and an age-adjusted rate of 28 emergency room visits per 100000 persons (the statewide age-adjusted rate was 10 emergency room visits per 100000 persons)
Among climate-vulnerable groups in 2010 were 1992 children under the age of 5 years and 9565 adults aged 65 years and older In 2010 there were approximately 493 people living in nursing homes dormitories and other group quarters where institutional authorities would need to provide transportation in the event of emergencies
Social and demographic factors and inequities affect individual and community vulnerability to the health impacts of climate change In 2010 1 of households
14
(166) did not have a household member 14 years or older who spoke English proficiently (called linguistically isolated statewide average was 10)
In 2010 approximately 9 of adults aged 25 years and older had less than a high school education (statewide average was 19) In 2010 8 of the population had incomes below the poverty level (the statewide average was 14)
Sixteen percent of households paid 50 or more of their annual income on rent or a home mortgage (statewide average was 22) In 2012 approximately 36 (pooled for Alpine Amador Calaveras Inyo Mariposa Mono and Tuolumne counties) of low-income residents reported they did not have reliable access to a sufficient amount of affordable nutritious food (called food insecurity statewide average was 42)
In 2010 Calaveras County had approximately 1656 outdoor workers whose occupation increased their risk of heat illness In 2010 roughly three percent of households did not own a vehicle that could be used for evacuation (statewide average was 8)
In 2009 approximately 20 of households were estimated to lack air conditioning a strategy to counter adverse effects of heat (statewide average was 36) In 2011 tree canopy which provides shade and other environmental benefits was present on 31 of the countyrsquos land area (statewide average was 8)
Social capital is embedded in social relationships and networks and refers to the existence of trust and mutual aid among the members of society2627 These relationships are important in building resilience when confronted with extreme climates27
There is evidence that populations with higher levels of political participation also have greater social capital2829 Sixty-eight percent of registered voters voted in the 2010 general election (statewide average was 58)
Natural disasters worsened by climate change increase the displacement of victims which in turn increases population densities and tensions over resources30 31 Violent crime also increases during heat events32
Safe neighborhoods that are free of crime and violence are an integral component of healthy neighborhoods and community resilience In 2010 Calaveras County experienced approximately 2 violent crimes per 1000 residents (statewide rate was 4 per 1000 residents)
These findings highlight specific populations that are most susceptible to health risks as well as the social determinants of health and adaptive capacity that contributes to resilience or conversely intensifies the impacts from climate change
15
Figure 6 Profile of Health Outcomes and Inequities Social Vulnerabilities and Climate Risks Calaveras County
Health Outcomes
2010 Age-Adjusted Death Rate10000
Total
HispanicLatino
White
California
Multiple Chronic Conditions in Adults (N) 2011-12dagger
Total
California
Adults Ever Diagnosed with Asthma (N) 2011-12dagger
Total
California
Annual heat related ER vists100000 2005-10
Adult obesity (N) 2011-12dagger
Living with a disability (N) 2008-12
Number Rate or Percent
233143
60
57
69
64
434
19
402
63763 38
12394876 44
19000 11
145143000
13 28
27000 19
8008 18
Groups with less than 20 observations are not presented dagger Pooled for Alpine Amador Calaveras Inyo Mariposa Mono and Tuolumne counties
16
Figure 7 Profile of Health Outcomes and Inequities Social Vulnerabilities and Climate Risks Calaveras County
Social Vulnerabilities Living in rural areas
Children aged 0-4 years
Adults aged 65 years and older
Linguistically isolated households
Adults educated less than high school
Poverty rate total
Households rentmortgage ge50 of income
Outdoor workers
Households that do not own a car
Food insecurity among low-income residents
Violent crimes per 1000
Voted in 2010 general election
Nursing facilities prisons college dorms
Households with air conditioning
Census tract average area with tree canopy Climate Risks
Population in high risk wildfire area 2010
Number Rate or Percent
75 4
34370
1992
9565 21
166 1
3150 9
3818 8
3005 16
1656 9
649 3
14000 36
93 2
68
493 1
80
19534
19514
31
38649 85 Pooled for Alpine Amador Calaveras Inyo Mariposa Mono and Tuolumne counties
f d d d b d d
Data sources for indicators in Figures 6 and 7 are described in Appendix 3
17
SELECTED PUBLIC HEALTH STRATEGIES AND ACTIONS FOR ADAPTING TO CLIMATE CHANGE Findings from this report describe climate risks in Calaveras County and highlight certain populations who are most susceptible to health risks from current and future climate change exposures Some of the changes due to climate change will occur over the long term but broad shifts in our weather can be seen now and will result in many direct and indirect health risks
Coping with a changing climate presents opportunities for local health departments and partners to consider policies actions and infrastructure design that will not just protect the public from climate change threats but also establish health equity resiliency and sustainability A critical step for building resilience is to improve capacity of communities to prepare respond and recover from
climate-related health risks Steps need to be taken to ensure that the most vulnerable populations have access to information services and resources to prepare and respond to climate risks
The goal of public health adaptation strategies is to minimize the negative health impacts of climate change A selection of the near-term and long-term strategies and actions steps for adapting to climate change are outlined in Table 2 These include community education and engagement public health workforce development identification of co-benefits bolstering existing functions of public health preparedness and surveillance multi-sectorial partnership building and research
Table 2 Selected public health strategies and action steps for adapting to climate change33
18
STRATEGIES NEAR-TERM ACTIONS LONG-TERM TERM ACTIONS
1 Promote community resilience to climate change to reduce vulnerability
bull Promote healthy built environments bull Identify and reduce health vulnerabilities
bull Improve food security and quality
bull Promote food sustainability bull Reduce heat islands bull Support social and community engagement
bull Promote increased access to health care
2 Educate empower and engage California residents organizations and businesses to reduce
bull Educational outreach campaign tying into existing efforts
bull Specific outreach to vulnerable
bull Proactive social marketing campaign
vulnerability through mitigation and adaptation
populations
3 Identify and promote mitigation and adaptation strategies with public health co-benefits
bull Identify and prioritize strategies with public health co-benefits
4 Establish improve and maintain mechanisms for robust rapid surveillance of environmental conditions climate-related illness vulnerabilities protective factors and adaptive capacities
bull Monitor outcomes (state and local) bull Convert to electronic surveillance systems to improve disease reporting management and surveillance
bull Develop existing environmental contaminant biomonitoring
bull Maintain and upgrade water accessibility information
bull Improve heat warning systems
5 Improve and sustain public health preparedness and emergency response
bull CDPH and local health departments should refine existing preparedness plans and conduct exercises
6 Work in multi-sectoral partnerships (local regional state and federal)
bull Expand training and education to build collaborative capacity
7 Conduct applied research to enable enhanced promotion and protection of human health
bull Vulnerability assessments bull Research collaboration bull Assess local impacts on health
8 Implement policy changes at local regional and national levels
bull Policy collaboration with stakeholders bull Occupational safety standards
bull Model policies and training bull Public engagement
9 Identify develop and maintain adequate funding for implementation of public health adaptation strategy
bull Identify and develop funding mechanisms
bull Develop funding mechanismsAB32 for education and research
19
Source California Natural Resources Agency33 (httpresourcescagovdocsclimateStatewide_Adaptation_Strategypdf)
RESOURCES This report brought together recently published technical information from state-sponsored research and planning documents including
California Climate Change Adaptation Planning Guide 2012 httpresourcescagovclimatesafeguardingadaptation_policy_guide
Safeguarding California Reducing Climate Risk 2014 httpresourcescagovdocsclimateFinal_Safeguarding_CA_Plan_July_31_2014pdf
California Climate Adaptation Strategy 2009 httpresourcescagovdocsclimateStatewide_Adaptation_Strategypdf
Cal-Adapt Exploring Californias Climate Change Research httpcal-adaptorg
Preparing California for Extreme Heat Guidance and Recommendations httpwwwclimatechangecagovclimate_action_teamreportsPreparing_California_for_Extreme_Heatpdf
For more information and resources for climate change adaptation and public health planning please visit
CDPH CalBRACE web page httpwwwcdphcagovprogramsPagesCalBRACEaspx
CDPH Climate Change and Health Team web page httpswwwcdphcagovprogramsPagesClimateChangeaspx
CDC BRACE web page httpwwwcdcgovclimateandhealthdefaulthtm
The Impacts of Climate Change on Human Health in the United States A Scientific Assessment 2016 httpshealth2016globalchangegov
Urban Heat Island Index for California httpcalepacagovUrbanHeatMapsdefaulthtm
20
REFERENCES 1 Solomon S Qin D Manning M Chen Z Marquis M Averyt KB
et al Climate Change 2007 The Physical Science Basis Working Group I Contribution to the Fourth Assessment Report of the Intergovernmental Panel on Climate Change (IPCC) N ew York C ambridge University Press 2007245
2 Earth System Research Laboratory Trends in Atmospheric Carbon Dioxide Up-to-date weekly average CO2 at Mauna Loa Boulder CO National Oceanic amp Atmospheric Administration 2014
3 Solomon S Plattner G Knutti R Friedlingstein P Irreversible climate change due to carbon dioxide emissions Proceedings of the National Academy of Sciences 2009106(6)1704-1709
4 Taylor KE Stouffer RJ Meehl GA An overview of CMIP5 and the experiment design Bull Amer Meteor Soc 2012doi101175BAMS-D-11-000941
5 California Emergency Management Agency California Natural Resources Agency California Adaptation Planning Guide Understanding Regional Characteristics July 2012
6 Public Interest Energy Research (PIER) Program Cal-Adapt Exploring Californias Climate Change Research Sacramento California Energy Commission 2011 httpcal-adaptorg Accessed June 2 2012
7 California Department of Forestry and Fire Protection (CAL FIRE) Office of the State Fire Marshall Fact Sheet Californiarsquos Fire Hazard Severity Zones California Department of Forestry and Fire Protection May 2007
8 California Department of Forestry and Fire Protection (CAL FIRE) Fire and Resource Assessment Program httpfrapcdfcagov
9 Confalonieri U Menne B R Akhtar R Ebi K Hauengue M Kovats R et al Human Health Climate Change 2007 Impacts Adaptation and Vulnerability Contribution of Working Group II to the Fourth Assessment Report of the Intergovernmental Panel on Climate Change Cambridge UK Cambridge University Press 2007
10 Borden KA Cutter SL Spatial patterns of natural hazards mortality in the United States Int J Health Geographics 2008764-77
11 Knowlton K Rotkin-Ellman M Geballe L Max W Solomon G Six climate changendashrelated events in the United States accounted for about $14 billion in lost lives and health costs Health Affairs 2011302167-2176
12 Haines A Patz P Health effects of climate change JAMA 200429199-103
13 Gray S Long-term health effects of flooding J Public Health 200830353-354
14 Ahern M Kovats R Wilkinson P Few R Matthies F Global health impacts of floods epidemiologic evidence Epidemiol Rev 20052736-46
15 Bouchama A Dehbi M Mohamed G Matthies F Shoukri M Menne B Prognostic factors in heat wavendashrelated deaths a meta-analysis Arch Intern Med 20071672170-2176
16 Basu R Ostro B A multicounty analysis identifying the populations vulnerable to mortality associated with high ambient temperature in California Am J Epid 2008DOI 101093ajekwn170
17 Westerling AL Bryant BP Climate change and wildfire in California Climatic Change 200887 (Suppl 1)s231-s249
21
18 Melillo JM Richmond T Yohe (Eds) Climate Change Impacts in the United States The Third National Climate Assessment US Global Change Research Program 841 pp 2014 doi107930J0Z31WJ2
19 Luber G Knowlton K Balbus J Frumkin H Hayden M Hess J McGeehin M Sheats N Backer L Beard CB Ebi KL Maibach E Ostfeld RS Wiedinmyer C Zielinski-Gutieacuterrez W Ziska L Ch 9 Human Health Climate Change Impacts in the United States The Third National Climate Assessment US Global Change Research Program 220-256 2014 dio 107930J0PN93H5
20 Kessler RC Borges G Walters EE Prevalence of and Risk Factors for Lifetime Suicide Attempts in the National Comorbidity Survey Arch Gen Psychiatry 1999 56(7) 617-626
21 Hawton K Sutton L Haw C Sinclair J Deeks JJ Schizophrenia and suicide systematic review of risk factors The British Journal of Psychiatry 2005 187 (1) 9-20
22 Galea S Tracy M Hoggatt K Dimaggio C Karpati A Estimated deaths attributable to social factors in the United States A m J Public Health 2011101(8)1456-1465
23 Portait of Promise The California Statewide Plan to Promote Health and Mental Health Equity California Department of Public Health Office of Health Equity Sacramento CA 2015
24 Shonkoff SB Morello-Frosch R Pastor M Sadd J The climate gap environmental health and equity implications of climate change and mitigation policies in California ndash a review of the literature C limate Change 2011109(1)485-503
25 Peck C Logan J Maizlish N Van Court J The Burden of Chronic Disease and Injury California Sacramento CA California Department of Public Health 2013 (httpwwwcdphcagovprogramsDocumentsBurdenRe portOnline2004-04-13pdf)
26 Dynes RR Social capital dealing with community emergencies Homeland Security Affairs 20062(2)1-26
27 Kawachi I Social capital and community effects on population and individual health Ann N Y Acad Sci 1999 896 120-130
28 Braveman PA Egerter S Woolf SH Marks JS When do we know enough to recommend action on the social determinants of health Am J Prev Med 2011 (40)1S1 S 58-S66
29 Gilbert KL Quinn SC Goodman RM Butler J Wallace J A meta-analysis of social capital and health a case for needed research J Health Psychol 2013 18(11) 1385-1399
30 Rudolph L Gould S Berko J Climate Change Health and Equity Opportunities for Action Oakland CA Public Health Institute 2015
31 Reuveny R Climate change-induced migration and violent conflict Political Geography 2007 26 (6) 656-673
32 Ranson M Crime weather and climate change Journal of Environmental Economics and Management 2014 67(3) 274-302
33 2009 California Climate Adaptation Strategy A Report to the Governor of the State of California in Response to Executive Order S-13-2008 California Natural Resources Agency 2009
34 Gould S Dervin K Climate Action for Health Integrating Public Health Into Climate Action Planning California Department of Public Health February 2012
35 California Climate Change Center Public Health-Related Impacts of Climate Change in California March 2006 Retrieved January 8 2012 httpwwwenergycagov2005publicationsCEC-500-2005-197CEC-500-2005-197-SFpdf
36 Karl TR Melillo JM Peterson TC (Eds) Global Climate Change Impacts in the United States New York NY Cambridge University Press 2009 89-98
37 Centers for Disease Control and Prevention Climate and Health Program R etrieved January 8 2017 from httpswwwcdcgovclimateandhealtheffectsdefaultht m
22
APPENDIX 1 HOW ARE FUTURE CHANGES IN CLIMATE PREDICTED Scientists use historical weather data and mathematical models to describe historical trends and to predict the impacts of global warming3 Historical data show that on average sea levels are already rising primarily from the expansion of water1 Historical data also show that in the past century average temperatures are increasing polar ice and glaciers are melting at increased rates and snow pack in mountains is diminishing compared to time periods in which human-generated carbon emissions were relatively small1
Climate models are computer simulation over time of the Earthrsquos atmosphere and oceans taking into account solar radiation surface reflection circulating air masses and wind heat stored in oceans sea ice evaporation from land surfaces and green plants cloud cover and other factors A key input to climate projection models is the current and projected amount of carbon dioxide and other greenhouse gases emitted into the atmosphere
The future amount of carbon emitted into the Earthrsquos atmosphere has two broad drivers
the dependence of economic growth on fossil fuels and
the growth of the worldrsquos population
Based on the different combinations of economic development strategies and population growth scientists have constructed formal scenarios4 of future carbon emissions during the 21st century and predicted their associated climate impacts compared to a 1990 baseline6
The average global temperature is predicted to increase by 18degC (32deg F) for an optimistic scenario called B1 in which world economies become much less dependent on fossil fuels and the world population levels off after 20501 In a pessimistic scenario called A2 climate models predict a 34deg C (61deg F) increase based on the assumption that the world continues its path of fossil fuel intensive economic development and that the world population increases during the 21st century
On the backdrop of gradually increasing temperatures and sea levels the climate models also predict an increase in the frequency and intensity of extreme weather events such as hurricanes floods and droughts1 Using these global climate models as a starting point the Scripps Institution of Oceanography at the University of California San Diego has further refined climate impacts in California to 12 km grids (7 by 7 miles)6 This allows California communities to have local data to inform climate adaptation planning
23
APPENDIX 2 PUBLIC HEALTH IMPACTS OF CLIMATE CHANGE IN CALIFORNIA CLIMATE CHANGE
EXPOSURES HEALTH IMPACTS POPULATIONS MOST AFFECTED
Extreme Heat bull Premature death bull Cardiovascular stress and failure bull Heat-related illnesses such as heat stroke heat exhaustion and kidney stones
bull Elderly
bull Children
bull Diabetics
bull Low-income
bull Urban residents
bull People with respiratory diseases
bull Agricultural workers
bull Those active outdoors
Poor Air Quality Air Pollution
bull Increased asthma allergies chronic obstructive pulmonary disease (COPD) and other cardiovascular and respiratory diseases
bull Children
bull Elderly
bull People with respiratory diseases
bull Low income
bull Those active outdoors
24
CLIMATE CHANGE EXPOSURES HEALTH IMPACTS POPULATIONS MOST
AFFECTED
Wildfires bull Injuries and death from burns and smoke inhalation bull Eye and respiratory illnesses due to air pollution bull Exacerbation of asthma allergies chronic obstructive pulmonary disease (COPD) and other cardiovascular and respiratory diseases
bull Risk from erosion and land slippage after wildfires bull Displacement and loss of homes
bull People with respiratory diseases
Severe Weather Extreme Rainfall Floods Water Issues
bull Population displacement loss of home and livelihood bull Coastal residents and residents in flood-prone areas
bull Elderly
bull Children
bull Low income
bull Death from drowning bull Injuries bull Damage to potable water wastewater and irrigation systems resulting in decrease in qualityquantity of water supply and disruption to agriculture
bull Water- and food-borne diseases from sewage overflow
Increased average bull Cardiovascular disease bull Children temperature
bull Increased number and range of bull Vector-borne disease such as West Nile virus malaria Hantavirus or plague
bull Water-borne disease such as cholera and E coli bull Food-borne disease such as salmonella poisoning bull Harmful algal blooms causing skin disease and poisoning bull Allergies caused by pollen and rashes from plants such as poison ivy or stinging nettle
bull Vulnerability to wildfires and air pollution
bull Elderly bull Agricultural workers bull Those active outdoors bull People with respiratory disease
bull People with acute allergies
25
CLIMATE CHANGE EXPOSURES HEALTH IMPACTS POPULATIONS MOST
AFFECTED
Agricultural Changes bull Changing patterns and yields of crops pests and weed species resulting in higher prices for food and food insecurity hunger and malnutrition
bull Changes in agricultureforestry leading to lost or displaced jobs and unemployment
bull Agricultural workers bull Rural communities bull Low income bull Elderly bull Children
Drought bull Hunger and malnutrition caused by disruption in food and water supply increased cost and conflict over food and water
bull Food- and water-borne disease bull Emergence of new contagious and vector-borne disease
bull Low income bull Elderly bull Children
All Impacts Mental Health Disorders bull All populations bull Low income bull Health care staff
(eg depression anxiety Post-Traumatic Stress Disorder substance abuse and other conditions) caused by bull Disruption displacement and migration bull Loss of home lives and livelihood Health Care Impacts bull Increased rates of illness and disease emergency room use and related costs borne by employers health plans and residents
bull Damage to health facilities
Sources Climate Action for Health Integrating Public Health Into Climate Action Planning California Department of Public Health34 Public Health-Related Impacts of Climate Change in California A Report From California Climate Change Center35 Global Climate Change Impacts in the United States Cambridge University Press36 Centers for Disease Control and Prevention Climate and Health Program37
26
APPENDIX 3 DATA SOURCES
27
DATA SOURCE INDICATOR
1 California Department of Forestry and Fire Protection (CalFIRE) Fire and bull Population in a high-risk wildfire area Resource Assessment Program httpfrapcdfcagov
2 Center for Health Statistics and Informatics Vital Statistics Query System Sacramento CA California Department of Public Health 2004 wwwappscdphcagovvsqdefaultasp
bull Age-Adjusted Death Rate 10000 with raceethnicity stratification
3 Environmental Health Tracking Program Heat-Related Illness Data Query Options Environmental Health Investigations Branch California Department of Public Health Richmond CA
bull Annual heat-related ER visits 100000
(httpwwwehiborgpagejsppage_key=913)
4 Federal Bureau of Investigation Uniform Crime Reports DS Washington DC US Department of Justice Federal Bureau of Investigation 2011 httpswwwfbigovabout-uscjisucrucr
bull Violent crimes per 1000
Level Rise on the California Coast Oakland CA Pacific Institute 2009
counties)
Residential Appliance Saturation Survey Oakland CA KEMA Inc 2009
Commission 2011 httpcal-adaptorg
5 Heberger M Cooley H Herrera P Gleick P Moore E The Impacts of Sea
httpwwwpacinstorgwp-contentuploads201302exec_sum11pdf
bull Population in 100-year flood prone area (for coastal counties)
bull Population in 100-year flood area and 55rdquo of sea level rise (for coastal
6 Palmgren C Stevens N Goldberg M Barnes R Rothkin K California bull Households with air conditioning
7 Public Interest Energy Research (PIER) Program Cal-adapt Exploring Californias Climate Change Research Sacramento California Energy
bull Historical record of wildfires and acres consumed
8 UCLA Center for Health Policy Research California Health Interview bull Multiple chronic conditions in adults Survey Los Angeles CA UCLA Center for Health Policy Research 2009 bull Adults ever-diagnosed with asthma
bull Food insecurity (low income residents) httpwwwchisuclaedumaindefaultasppage=dac (multiple chronic conditions asthma food insecurity (lt200 poverty)
bull Adult obesity
9 US Census Bureau American Community Survey or SF1 file (Living with bull Living with disability (Age 5 and older) disability living in rural areas population aged lt 5 years and gt65 years living alone linguistically isolated poverty rate housing cost burden outdoor workers group quarters) DS Washington DC US Census
bull Living in rural areas bull Children aged 0-4 years
Bureau 2012 httpfactfinder2censusgov bull Adults aged 65 years and older bull Linguistically isolated households bull Poverty rate total bull Households rentmortgage gt50 of income
bull Outdoor workers bull Households that do not own a car bull Nursing facilities prisons college dorms bull Adults with less than a high school education
10 US Environmental Protection Agency National Land Cover Data httpwwwepagovmrlcnlcd-2001html Accessed March 24 2011
bull Census tract average area with tree canopy
11 Southern California Association of Governments (SCAG) Metropolitan Transportation Commission (MTC) Sacramento Council of Governments (SACOG) and population data from the US Census Bureau
bull Residents within frac12 mile from frequent transit stop
12 Statewide Database University of California Berkeley Law Center for Research California Secretary of State Elections Division Reports of Registration California Department of Finance Demographic Unit
bull Registered voters whogeneral election
voted in 2010
28
- Introduction
-
- Background
-
- What is climate change
-
- How does climate change impact climate and weather
-
- The impact of climate change in California varies across the state due to diversity in biophysical setting climate and jurisdictional characteristics The California Adaptation Planning Guide organized the state into climate impact regions based on
-
- Overview of Climate Change and Health Impacts
- Extreme Weather-Related Injury Displacement and Mental Health
- Health Impacts of Heat
- Health Impacts of Drought
- Vector-borne Illnesses
- Food Insecurity
- Sea Level Rise Mold and Indoor Air Quality
- Socioeconomic Disruption
-
- Which Population Subgroups are Most Vulnerable
- What are the Health Status Health Inequities and Population Vulnerabilities in Calaveras County
- Selected Public Health Strategies and Actions for Adapting to Climate Change
-
- Findings from this report describe climate risks in Calaveras County and highlight certain populations who are most susceptible to health risks from current and future climate change exposures Some of the changes due to climate change will occur over
-
- Resources
- References
- 32 Ranson M Crime weather and climate change Journal of Environmental Economics and Management 2014 67(3) 274-302
- Appendix 2 Public Health Impacts of Climate Change in California
- Appendix 3 Data Sources
-
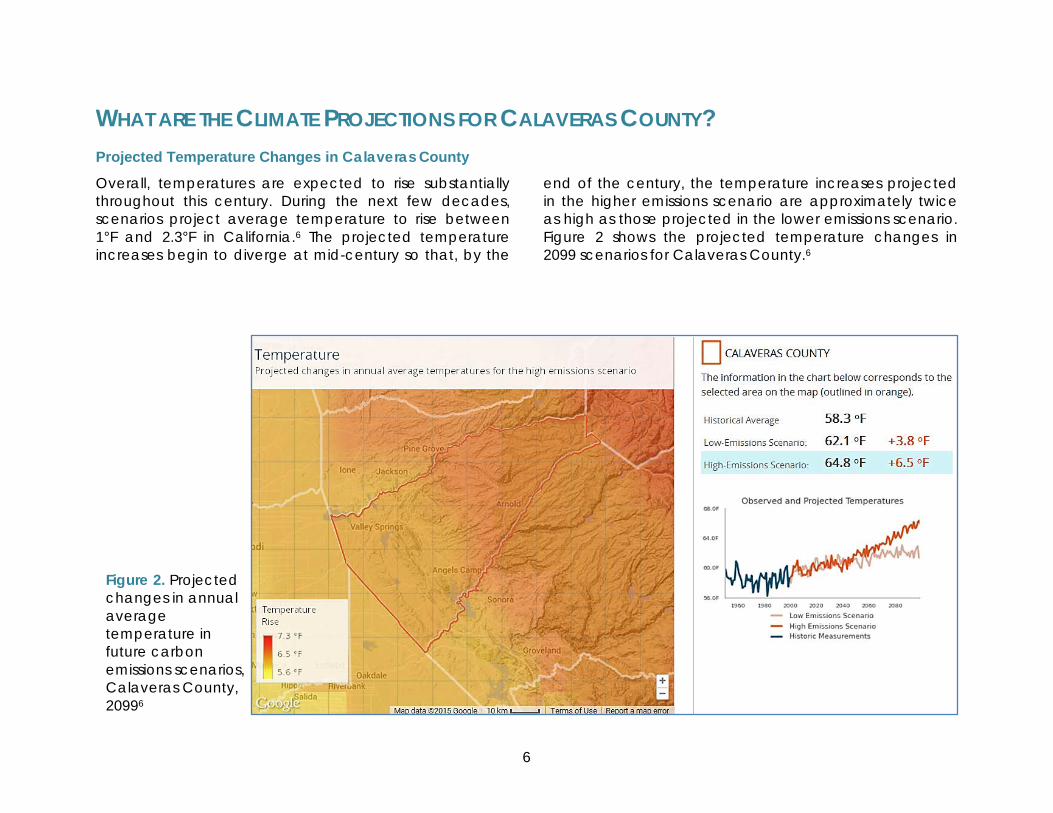
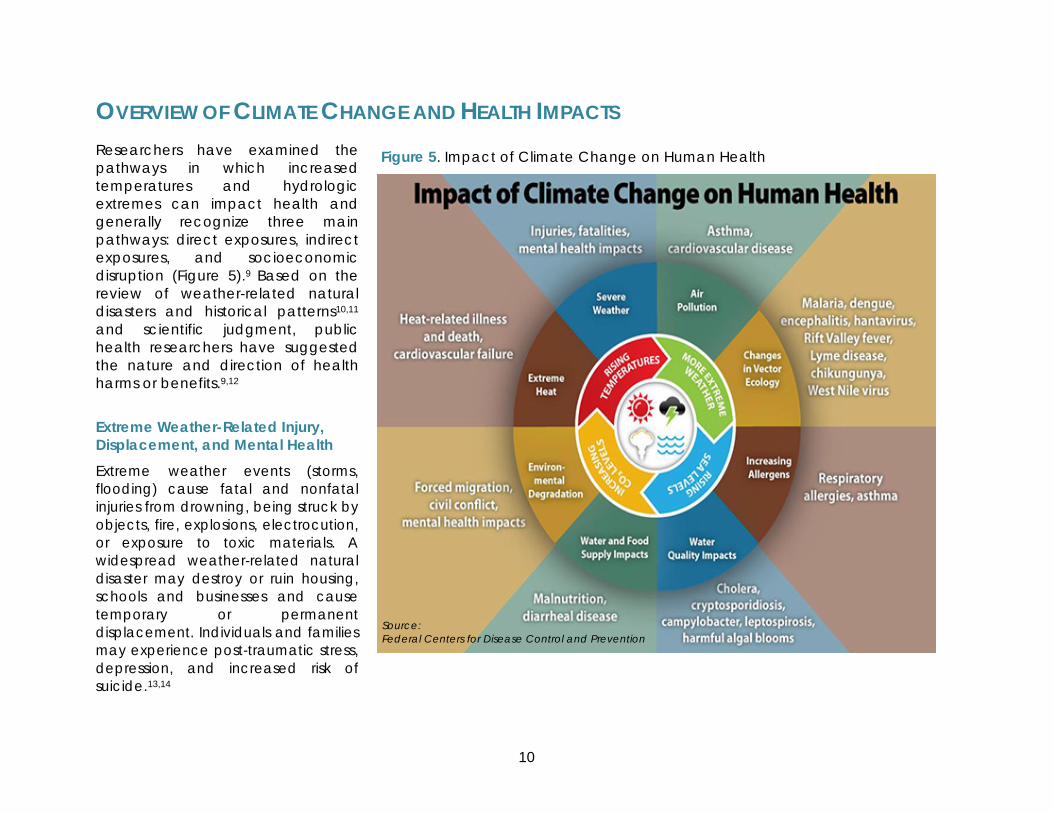
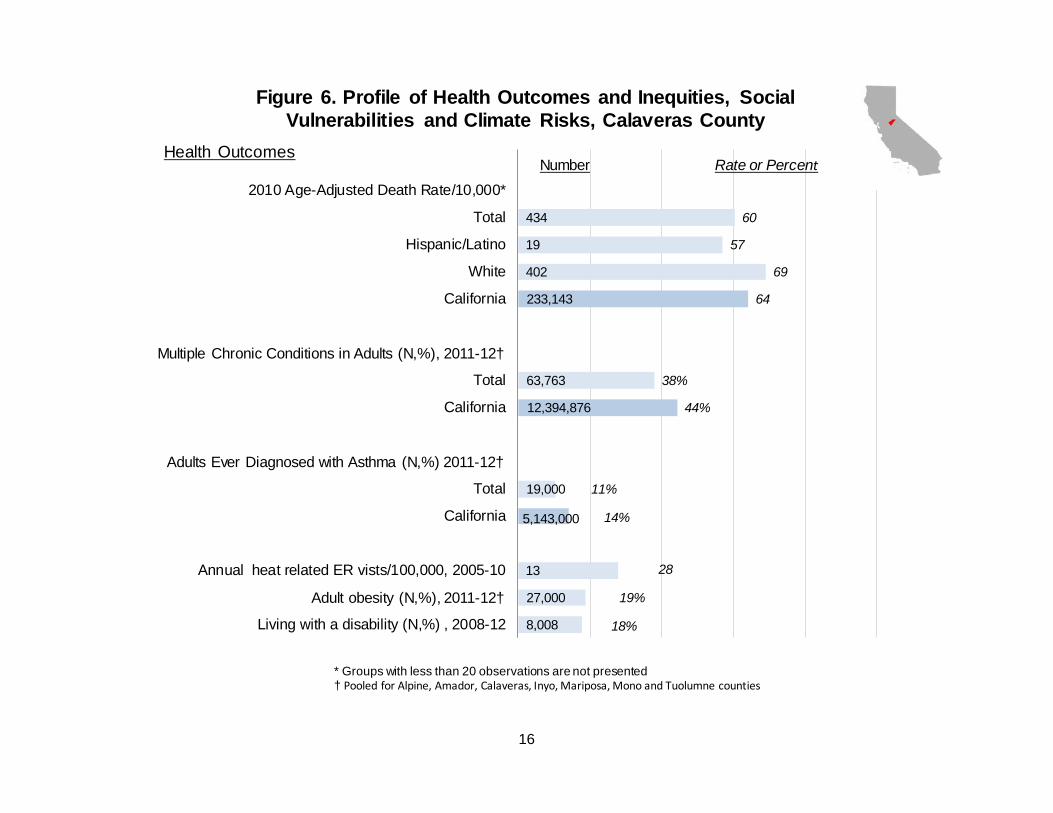

CLIMATE CHANGE EXPOSURES HEALTH IMPACTS POPULATIONS MOST
AFFECTED
Agricultural Changes bull Changing patterns and yields of crops pests and weed species resulting in higher prices for food and food insecurity hunger and malnutrition
bull Changes in agricultureforestry leading to lost or displaced jobs and unemployment
bull Agricultural workers bull Rural communities bull Low income bull Elderly bull Children
Drought bull Hunger and malnutrition caused by disruption in food and water supply increased cost and conflict over food and water
bull Food- and water-borne disease bull Emergence of new contagious and vector-borne disease
bull Low income bull Elderly bull Children
All Impacts Mental Health Disorders bull All populations bull Low income bull Health care staff
(eg depression anxiety Post-Traumatic Stress Disorder substance abuse and other conditions) caused by bull Disruption displacement and migration bull Loss of home lives and livelihood Health Care Impacts bull Increased rates of illness and disease emergency room use and related costs borne by employers health plans and residents
bull Damage to health facilities
Sources Climate Action for Health Integrating Public Health Into Climate Action Planning California Department of Public Health34 Public Health-Related Impacts of Climate Change in California A Report From California Climate Change Center35 Global Climate Change Impacts in the United States Cambridge University Press36 Centers for Disease Control and Prevention Climate and Health Program37
26
APPENDIX 3 DATA SOURCES
27
DATA SOURCE INDICATOR
1 California Department of Forestry and Fire Protection (CalFIRE) Fire and bull Population in a high-risk wildfire area Resource Assessment Program httpfrapcdfcagov
2 Center for Health Statistics and Informatics Vital Statistics Query System Sacramento CA California Department of Public Health 2004 wwwappscdphcagovvsqdefaultasp
bull Age-Adjusted Death Rate 10000 with raceethnicity stratification
3 Environmental Health Tracking Program Heat-Related Illness Data Query Options Environmental Health Investigations Branch California Department of Public Health Richmond CA
bull Annual heat-related ER visits 100000
(httpwwwehiborgpagejsppage_key=913)
4 Federal Bureau of Investigation Uniform Crime Reports DS Washington DC US Department of Justice Federal Bureau of Investigation 2011 httpswwwfbigovabout-uscjisucrucr
bull Violent crimes per 1000
Level Rise on the California Coast Oakland CA Pacific Institute 2009
counties)
Residential Appliance Saturation Survey Oakland CA KEMA Inc 2009
Commission 2011 httpcal-adaptorg
5 Heberger M Cooley H Herrera P Gleick P Moore E The Impacts of Sea
httpwwwpacinstorgwp-contentuploads201302exec_sum11pdf
bull Population in 100-year flood prone area (for coastal counties)
bull Population in 100-year flood area and 55rdquo of sea level rise (for coastal
6 Palmgren C Stevens N Goldberg M Barnes R Rothkin K California bull Households with air conditioning
7 Public Interest Energy Research (PIER) Program Cal-adapt Exploring Californias Climate Change Research Sacramento California Energy
bull Historical record of wildfires and acres consumed
8 UCLA Center for Health Policy Research California Health Interview bull Multiple chronic conditions in adults Survey Los Angeles CA UCLA Center for Health Policy Research 2009 bull Adults ever-diagnosed with asthma
bull Food insecurity (low income residents) httpwwwchisuclaedumaindefaultasppage=dac (multiple chronic conditions asthma food insecurity (lt200 poverty)
bull Adult obesity
9 US Census Bureau American Community Survey or SF1 file (Living with bull Living with disability (Age 5 and older) disability living in rural areas population aged lt 5 years and gt65 years living alone linguistically isolated poverty rate housing cost burden outdoor workers group quarters) DS Washington DC US Census
bull Living in rural areas bull Children aged 0-4 years
Bureau 2012 httpfactfinder2censusgov bull Adults aged 65 years and older bull Linguistically isolated households bull Poverty rate total bull Households rentmortgage gt50 of income
bull Outdoor workers bull Households that do not own a car bull Nursing facilities prisons college dorms bull Adults with less than a high school education
10 US Environmental Protection Agency National Land Cover Data httpwwwepagovmrlcnlcd-2001html Accessed March 24 2011
bull Census tract average area with tree canopy
11 Southern California Association of Governments (SCAG) Metropolitan Transportation Commission (MTC) Sacramento Council of Governments (SACOG) and population data from the US Census Bureau
bull Residents within frac12 mile from frequent transit stop
12 Statewide Database University of California Berkeley Law Center for Research California Secretary of State Elections Division Reports of Registration California Department of Finance Demographic Unit
bull Registered voters whogeneral election
voted in 2010
28
- Introduction
-
- Background
-
- What is climate change
-
- How does climate change impact climate and weather
-
- The impact of climate change in California varies across the state due to diversity in biophysical setting climate and jurisdictional characteristics The California Adaptation Planning Guide organized the state into climate impact regions based on
-
- Overview of Climate Change and Health Impacts
- Extreme Weather-Related Injury Displacement and Mental Health
- Health Impacts of Heat
- Health Impacts of Drought
- Vector-borne Illnesses
- Food Insecurity
- Sea Level Rise Mold and Indoor Air Quality
- Socioeconomic Disruption
-
- Which Population Subgroups are Most Vulnerable
- What are the Health Status Health Inequities and Population Vulnerabilities in Calaveras County
- Selected Public Health Strategies and Actions for Adapting to Climate Change
-
- Findings from this report describe climate risks in Calaveras County and highlight certain populations who are most susceptible to health risks from current and future climate change exposures Some of the changes due to climate change will occur over
-
- Resources
- References
- 32 Ranson M Crime weather and climate change Journal of Environmental Economics and Management 2014 67(3) 274-302
- Appendix 2 Public Health Impacts of Climate Change in California
- Appendix 3 Data Sources
-