climate change: an inter-disciplinary approach to problem...
TRANSCRIPT

Climate Change: An Inter-disciplinary Approach to Problem Solving
(AOSS 480 // NRE 480) Richard B. Rood
Cell: 301-526-8572 2525 Space Research Building (North Campus)
[email protected] http://aoss.engin.umich.edu/people/rbrood
Winter 2015
January 20, 2015

Class Information and News
• Ctools site: AOSS_SNRE_480_001_W15
– Record of course
• Rood’s Class MediaWiki Site – http://climateknowledge.org/classes/index.php/Climate_Change:_The_Move_to_Action
• A tumbler site to help me remember – http://openclimate.tumblr.com/

Resources and Recommended Reading
• Radiative Balance – Radiative Forcing of Climate Change:
Expanding the Concept and Addressing Uncertainties (2005) Board on Atmospheric Sciences and Climate (BASC) Chapter 1
• http://www.nap.edu/books/0309095069/html
• From class website – Executive Summary – Chapter 1: Radiative Forcing

Outline: Class 4, Winter 2015
• Definition and focus on “systems” – In the language of science – In the language of problem solving
• Earth-Sun system • Role of the Atmosphere
– Fundamental role of greenhouse gases – Other greenhouse gases of high importance
• Past behavior • Carbon dioxide budget

Scientific Investigation
OBSERVATIONS THEORY
EXPERIMENT
Knowledge Generation Reduction Disciplinary
Problem Solving Unification Integration
(perhaps not unique)
Break into pieces à “granules”

Problem Solving Brings Focus to System
• System (Dictionary Definitions): – a set of connected things or parts forming a
complex whole – a set of interacting or interdependent
components forming an integrated whole – has: Structure, Behavior, Interconnection
• Systems Engineering: study, understanding (analysis), design, management of systems

Systems, Scientific Method and Earth’s Climate
• First steps in studying system – Defining the system – Breaking down the system to allow
understanding • We will use principles of scientific
investigation to break down into pieces. – Observations – Theory … Draw a Picture – Prediction – Evaluation

Sun-Earth System
SUN: ENERGY, HEAT EARTH: ABSORBS ENERGY
EARTH: EMITS ENERGY TO SPACE à BALANCE

Sun-Earth System
CO2 is making the blanket thicker
SUN EARTH
EARTH: EMITS ENERGY TO SPACE à BALANCE
PLACE AN INSULATING
BLANKET AROUND EARTH
FOCUS ON WHAT IS
HAPPENING AT THE
SURFACE

But the Earth’s surface temperature is observed to be, on average, about 15 C (~59 F).
The sun-earth system (What is the balance at the surface of Earth?)
SUN
Earth
If we do an accounting of energy: If the Earth did NOT have an atmosphere, then, the temperature at the surface of the Earth would be about -18 C ( ~ 0 F).
Earth and its warmth
• That in the absence of the atmosphere the temperature would be about -18 C or 0 F is hugely important

Greenhouse gases (GHG)
• Earth's most abundant greenhouse gases – water vapor (H2O) – carbon dioxide (CO2) – methane (CH4) – nitrous oxide (N2O), commonly known as "laughing gas" – ozone (O3) – chlorofluorocarbons (CFCs)
• Ranked by their contribution to the greenhouse effect, the most important ones are: – water vapor, which contributes 36–70% – carbon dioxide, which contributes 9–26% – methane, which contributes 4–9% – ozone, which contributes 3–7%
• What are the atmospheric lifetimes of the GHGs?

Some attributes to hold in mind
• We are increasing CO2 – there is a lot of it and it is easy to release. We like fire.
• There is an immense amount of water on Earth and it cycles between its different phases.
• There is a lot of methane on Earth. • Nitrous oxide is wrapped up in agriculture
and fertilizers. • Manufacturing makes very potent
greenhouse gases.

Increase of Atmospheric Carbon Dioxide (CO2)
Data and more information
Primary increase comes from burning fossil fuels – coal, oil, natural gas

Web links to some CO2 data
• NOAA/ESRL Global Monitoring Division – Carbon Cycle Greenhouse Gas – Mauna Loa Carbon Dioxide
• Carbon Dioxide Information Analysis Center – Recent Greenhouse Gas Concentrations
• NOAA/PMEL CO2 and Ocean

Let’s look to the past
• This is called “paleoclimatology.”
– NOAA’s Paleoclimatology Branch • Ice Core Portal • Vostok Data
– Petit, Nature, 1999
– Koshland Science Museum

Bubbles of gas trapped in layers of ice give a measure of temperature and carbon dioxide
350,000 years of Surface Temperature and Carbon
Dioxide (CO2) at Vostok, Antarctica ice
cores
Ø During this period, temperature and CO2 are closely related to each other
Ø Times of low temperature have glaciers, ice ages (CO2 <~ 200 ppm)
Ø Times of high temperature associated with CO2 of < 300 ppm
This has been extended back to > 700,000 years

Bubbles of gas trapped in layers of ice give a measure of temperature and carbon dioxide
350,000 years of Surface Temperature and Carbon
Dioxide (CO2) at Vostok, Antarctica ice
cores
Ø During this period, temperature and CO2 are closely related to each other
Ø It’s been about 20,000 years since the end of the last ice age
Ø There has been less than 10,000 years of history “recorded” by humans (and it has been relatively warm)

So what are we worried about?
350,000 years of Surface Temperature and Carbon
Dioxide (CO2) at Vostok, Antarctica ice
cores
Ø Carbon dioxide is, because of our emissions, much higher than ever experienced by human kind Ø Temperature is expected to follow
Ø New regimes of climate behavior? Ø Humans are adapted to current climate behavior.
Ø The change is expected to happen rapidly (10 -100 years, not 1000’s)
CO2 2010
CO2 2100
390 ppm
460 ppm

Are we saving civilization?
350,000 years of Surface Temperature and Carbon
Dioxide (CO2) at Vostok, Antarctica ice
cores
Ø If the normal pattern were to continue, without additional carbon dioxide, what would we expect?
CO2 2005
CO2 2100
360 ppm
460 ppm

We have gone through those figures fast
• But, but, but, !!!!!!!! Whoa … • The carbon dioxide and temperature sometimes
DO NOT seem perfectly related. In the past the temperature increase started before the carbon dioxide increase.
• It’s pretty clear that an ice age is on the way. The climate is clearly periodic, and there is nothing we can do about it.

Global cooling?
Why do we think that our predictions today are more robust than these predictions from the 1970s?

From the Ice Core Data: Questions?
• We see a relationship between carbon dioxide (CO2) and Temperature (T) – What is the cause and effect? – Why do we bounce between these two regimes? – Dynamic equilibrium?
• Are these oscillations caused by something “external”? – Are there other parameters or attributes which are
correlated with this behavior? • What is different from the stock market, where
“past behavior does not indicate future performance?”

Let’s Look at the past 1000 years
• We have more sources of observations. • We have better observations. • We have public records and literature and
natural history.

Let’s look at just the last 1000 years
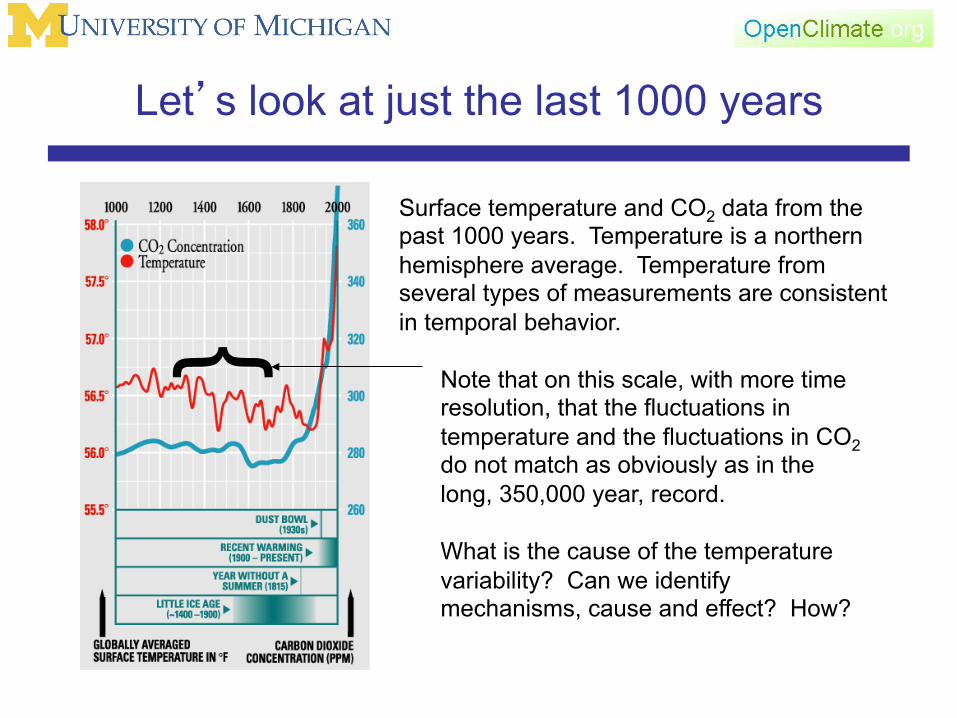
Surface temperature and CO2 data from the past 1000 years. Temperature is a northern hemisphere average. Temperature from several types of measurements are consistent in temporal behavior.
q Medieval warm period
q “Little ice age”
q Temperature starts to follow CO2 as CO2 increases beyond approximately 300 ppm, the value seen in the previous graph as the upper range of variability in the past 350,000 years.
Let’s look at just the last 1000 years
Surface temperature and CO2 data from the past 1000 years. Temperature is a northern hemisphere average. Temperature from several types of measurements are consistent in temporal behavior.
Note that on this scale, with more time resolution, that the fluctuations in temperature and the fluctuations in CO2 do not match as obviously as in the long, 350,000 year, record. What is the cause of the temperature variability? Can we identify mechanisms, cause and effect? How?
{

What do we see from the past 1000 years
• On shorter time scales the CO2 and T are not as cleanly related.
• Periods on noted warmth and coolness are separated by changes in average temperature of only 0.5 F.
• Changes of average temperature on this scale seem to matter to people. – Regional changes, extremes?
• Recent changes in both T and CO2 are unprecedented in the past several hundred thousands of years. – And the last 10,000 years, which is when humans have thrived in
the way that we have thrived.

Increase of Atmospheric Carbon Dioxide (CO2)
Data and more information
Primary increase comes from burning fossil fuels – coal, oil, natural gas

What about the CO2 increase?
CO2 now
Concept of “stabilization”
Stabilization as we have thought about it in the past may not be possible.

Carbon dioxide budget

What are the mechanisms for production
and loss of CO2?
Important things in this
figure.

What are the mechanisms for production
and loss of CO2?
Enormous amount of
carbon dioxide in the
ocean.

What are the mechanisms for production
and loss of CO2?
Exchange of carbon dioxide
between atmosphere and ocean
ocean.
-2

What are the mechanisms for production
and loss of CO2?
Large amount of
carbon dioxide in the “soil” and
plants

What are the mechanisms for production
and loss of CO2?
Exchange of carbon dioxide
between atmosphere and “land.”
-1

What are the mechanisms for production
and loss of CO2?
Large amount of
carbon dioxide in
coal, oil, gas

What are the mechanisms for production
and loss of CO2?
Movement of carbon
dioxide by burning
+5.5
Millions of
Years
Hundreds of Years

What are the mechanisms for production
and loss of CO2?
Movement of carbon
dioxide by land use changes
+1

Were you counting?
• Net sources into the atmosphere
• Net removal from the atmosphere
5.5 + 1 = 6.5
2+1 = 3

Another view of CO2 increase
Global Carbon Project

CO2 from 2012 to 2013
Global Carbon Project

Carbon and Oceanic Exchange

Carbon and Terrestrial Exchange

Summary: Class 4, Winter 2015
• Basic system for framing Earth’s climate is planet that is warmed by the Sun and that cools to space and reaches a balance.
• The presence of the atmosphere means that energy is held near the Earth’s surface. – Keeping Earth’s surface warmer than it would
be if the energy was not stored – About 58 F rather than 0 F

Summary: Class 4, Winter 2015
• Water exists in solid, liquid and gas (vapor). – Water and its phase changes represent energy
• Study of past climate reveals variability – Ice – Greenhouse gases – Temperature – Influence on humans – Influence on types of life in general

Summary: Class 4, Winter 2015
• Humans are NOT required for carbon dioxide variability.
• CO2 is increasing in the atmosphere and ocean. – This time it is humans altering the geology of Earth – Anthropocene
• For the climate problem CO2 in the environment is increasing. It takes a long time for it to be removed, there is a lot of cycling between atmosphere, ocean and land. – What happens if ocean gets warmer?
• In ocean transfer of CO2 between CO2 and calcium carbonate and carbonic acid leads to acidification.

Outline: Class 4, Winter 2015
• Definition and focus on “systems” – In the language of science – In the language of problem solving
• Earth-Sun system • Role of the Atmosphere
– Fundamental role of greenhouse gases – Other greenhouse gases of high importance
• Past behavior • Carbon dioxide budget