climate change adaptation plan - moncton
TRANSCRIPT

Climate ChangeAdaptation and Flood Management Strategy
Aussi disponible en français
June 2013

i
Forward
In April 2010, the Cities of Moncton and Dieppe, and the Town of Riverview were
selected to participate in the Regional Adaptation Collaborative (RAC) program, which
is a cost-shared federal program developed to identify and reduce risks posed by
climate change. Under this program, each region of Canada is developing solutions for
region-specific issues related to climate change.
The results of this study, which was completed by AMEC, were presented to Moncton
City Council in the fall of 2012. In response, Moncton City Council resolved to undertake
a climate change adaptation plan and flood management strategy by June 2013.
While efforts to reduce global warming remain important, there is no doubt that our
climate is changing. While the City remains committed to reducing its carbon footprint,
there is now both the opportunity and the need to anticipate and adapt to our
changing climate as well.
This document was prepared by the City’s corporate Climate Change Action
Committee (CCAC). The CCAC is committed to working with Moncton City Council, the
community at large, and our partners at the regional, provincial and federal levels to
better understand the implications of climate change and to take action on adaptation
strategies, so that the Moncton community and region will continue on a path of
resiliency and prosperity.
Jacques Dubé, City Manager
Chair, Corporate Climate Change Action Committee
June, 2013

ii
City of Moncton Corporate Climate Change Action Committee (2013):
Project Management Group:
Jacques Dubé, City Manager (Chair)
Jack MacDonald, General Manager, Engineering and Environmental Services
Catherine Dallaire, General Manager, Corporate Services
Don MacLellan, General Manager, Community Safety Services
John Martin, CFO, General Manager, Finance and Administrative Services
Stephen Trueman, General Manager, Legal and Legislative Services
Maurice Belliveau, General Manager, Economic Development and Events
Rod Higgins, General Manager, Parks & Leisure Services
Laurann Hanson, General Manager, Human Resources
Technical Advisory Group:
Sébastien Arcand, Senior Planner, Urban Planning
Eric Arsenault, Moncton Fire Department Chief
Elaine Aucoin, Director, Environmental Planning and Management, Engineering and
Environmental Services
Bill Budd, Director, Urban Planning
Ginny Cosgrove, Corporate Analyst, Strategic Initiatives
Claude Despres, Director, Strategic Initiatives
John Gillis, Senior Real Estate Officer
Gregg Houser, Deputy Treasurer Controller, Finance and Administrative Services
Michelle McAloon, Landscape Project Coordinator, Parks & Leisure Services
Don Morehouse, Director, Public Works and Utilities, Engineering and Environmental
Services
Alcide Richard, Director, Design/Construction, Engineering and Environmental Services
Randy Richard, Senior Building Inspector, Building Inspections
Kevin Silliker, Director, Economic Development
Sherry Sparks, Director, Building Inspections
Stephane Thibodeau, Transportation and Parking Coordinator, Engineering and
Environmental Services
Paul Thomson, Director, Corporate Communications
0
City of Moncton
Climate Change Adaptation Plan and
Flood Management Strategy
Forward
Table of Contents
1 Introduction ............................................................................................................................. 1
2 Developing Moncton’s Climate Change Adaptation Plan .......................................... 2
3 Climate Change Trends ....................................................................................................... 4
3.1 Temperature and Precipitation ................................................................................ 4
3.2 Sea Level Rise ............................................................................................................... 4
3.3 Extreme Weather Events ............................................................................................ 7
4 Flood Risk Assessment ......................................................................................................... 8
4.1 AMEC Study Findings .................................................................................................. 8
4.2 CCAC Flood Scenario Assessments ........................................................................ 9
4.3 Proposed Strategy for Reducing Flood Risk ......................................................... 21
4.4 Addressing Flood Risk Outside the Scope of the AMEC Study ......................... 25
5 Assessment of Other Climate Trends .............................................................................. 26
5.1 Warmer Average Temperatures & Extreme Heat Days .................................... 26
5.2 Other Extreme Weather Events .............................................................................. 29
6 Conclusions/Recommendations ..................................................................................... 31

1
1 Introduction
In April 2010, the Cities of Moncton and Dieppe and the
Town of Riverview were selected to participate in a
Regional Adaptation Collaborative (RAC) program, a
cost-shared federal program developed to identify and
reduce the impacts posed by climate changei.
Through this partnership, a technical study, prepared by
AMEC Earth and Environmental, was produced to help
identify climate change trends and what these trends
mean for our regionii. The AMEC report recognized that in
eastern Canada, a main hazard associated with climate
change is the increased risk of higher intensity and more
frequent storm events, and increased risk of flooding.
In October, 2012, the results of the RAC project were
presented to Moncton City Council. Recognizing its
importance, City Council requested that staff develop an
action plan and flood management strategy by June
2013, based on the recommendations of the AMEC study.
Since the RAC program was first initiated, communities
across Canada have become increasingly engaged in
how climate change will impact their community and
what steps can be taken to adapt to our changing
climate. The importance of adaptation action has been
echoed by the federal government, which has indicated
that Climate Change Action Plans (CCAPs), which include
climate change adaptation strategies, will be required in
most provinces to access Gas Tax fundingiii .
As a result of increased attention to climate change at all
levels, there is a growing amount of information and
resources available to assist communities in addressing this
important issue. With climate change adaptation
strategies, communities have the opportunity to reduce
risks and strengthen community resiliency and adaptation
capacity.
What is Climate Change?
The term ‘climate change’ refers
to “the warming of the earth’s
atmosphere and oceans, in
addition to an increase in the
natural variability of the climate”. (Municipal Climate Change Action
Plan Guidebook, Canada-Nova
Scotia Infrastructure Secretariat,
2011)
Climate change trends indicate
that in the future, we are more
likely to experience:
o warmer temperatures
o increasing amounts of
precipitation
o greater UV exposure;
o sea level rise (higher tides);
o stronger winds, storm surges
o more frequent storm events;
and
o more frequent ‘extreme
weather events' such as heat
waves, droughts, and heavy
precipitation in the form of
rain, snow or ice storms,
coupled with strong winds.
What is Climate Change
Adaptation?
Climate change adaptation is
about taking actions that will
help to reduce the impacts
associated with anticipated
climate change trends, events
and hazards. It is also about
taking advantage of new
opportunities that may be
created as a result of climate
change.

2
2 Developing Moncton’s Climate Change Adaptation Plan
This Plan was developed in order to:
1. Better understand the potential risks related to climate change, particularly
with respect to more frequent and intense (or extreme) weather events, in
conjunction with higher tides in the future;
2. Consider the potential impacts of climate change on City of Moncton
operations, including essential services, infrastructure, facilities and assets;
3. Begin understanding the potential impacts of climate change on the
community at large, from a social, cultural, economic and environmental
perspective;
4. Identify the types of climate change adaptation strategies and actions that
will help to manage and reduce risks associated with climate change; and
5. Identify ways in which to increase the adaptive capacity of the Corporation
and the community at large.
While this work focused primarily on the potential impacts and vulnerability with
respect to flooding risk, the team also considered other potential climate change
hazards including heat wave/drought, forest fire, cold wave, ice storm and
severe winter storm conditions.
A Risk Management Approach
Managing the risks of climate change involves understanding how our climate is
anticipated to change over time, as well as the probability that a serious climate
related event is likely to occur.
The team relied upon two key sources of data:
The Climate Change Adaptation Measures for Greater Moncton Area, New
Brunswick report, prepared by AMEC Earth and Environmental (2011). A key
strength of this report is well-researched and documented forecast for a 1:100
year storm in the tri-community area, factoring in climate change trends for
rainfall and tide levels.
New Brunswick Climate Futures data provided by the Atlantic Climate
Adaptations Solutions Association (ACASA),
http://atlanticadaptation.ca/acasa/.
In the fall of 2012, the City of Moncton purchased rights to use emergency
management software developed by the Canadian technology company
Sentinel (http://www.sentinelsystems.ca/). This software offers a risk assessment
tool that was developed with the participation of Public Safety officials and is
used by emergency planners in the development of emergency response plans.
In addition to furthering the work of the City’s Emergency Preparedness Plan, the
team used this tool to scope potential climate change related impacts and to
better understand the nature of climate change risk for the City.

3
The team identified many actions that the City of Moncton can take to reduce
risk. These actions were reviewed and further prioritized within a Climate Change
Flood Management Action schedule.
Figure1. Climate Change Adaptation Planning
In developing this plan, the Climate Change Action Committee was conscious of
the internal, corporate nature of this exercise. A key short- term recommendation
in the Plan is to share the findings of the team’s work with a wide range of
stakeholder groups and with the community at large, and to engage in a much
broader discussion regarding climate change and adaptation strategies at the
community level.
Much like the results of the AMEC Study, the results of the team’s risk assessment
work are not based on certainty and involved having to make a number of
assumptions. These assumptions are documented in the Plan, and should be
reviewed and updated as new information becomes available through
additional research and greater consultation with the community at large.
Analyze how local climate will change
Scope Potential Hazards /Impacts
Assess Risks and Opportunities
Prepare Adaptation Plan (proposed adaptation actions & strategies)
Adopt, Implement, Monitor & Review Adaptation Plan
4
3 Climate Change Trends
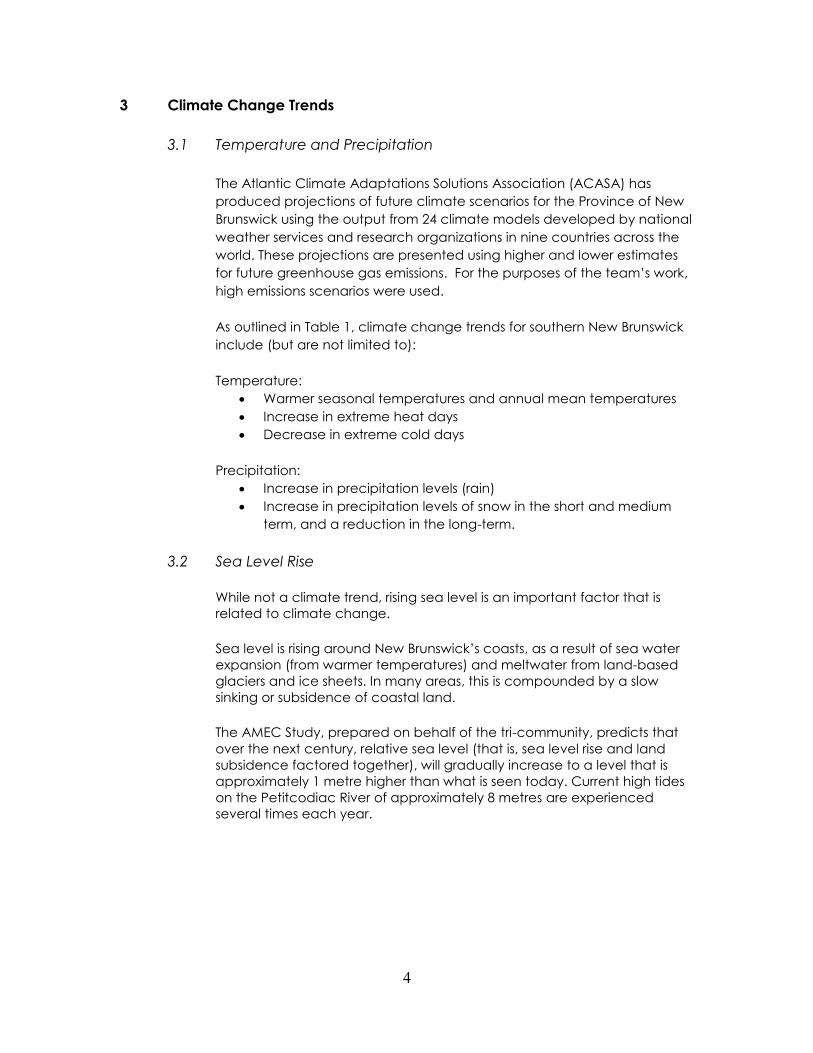
3.1 Temperature and Precipitation
The Atlantic Climate Adaptations Solutions Association (ACASA) has
produced projections of future climate scenarios for the Province of New
Brunswick using the output from 24 climate models developed by national
weather services and research organizations in nine countries across the
world. These projections are presented using higher and lower estimates
for future greenhouse gas emissions. For the purposes of the team’s work,
high emissions scenarios were used.
As outlined in Table 1, climate change trends for southern New Brunswick
include (but are not limited to):
Temperature:
Warmer seasonal temperatures and annual mean temperatures
Increase in extreme heat days
Decrease in extreme cold days
Precipitation:
Increase in precipitation levels (rain)
Increase in precipitation levels of snow in the short and medium
term, and a reduction in the long-term.
3.2 Sea Level Rise
While not a climate trend, rising sea level is an important factor that is
related to climate change.
Sea level is rising around New Brunswick’s coasts, as a result of sea water
expansion (from warmer temperatures) and meltwater from land-based
glaciers and ice sheets. In many areas, this is compounded by a slow
sinking or subsidence of coastal land.
The AMEC Study, prepared on behalf of the tri-community, predicts that
over the next century, relative sea level (that is, sea level rise and land
subsidence factored together), will gradually increase to a level that is
approximately 1 metre higher than what is seen today. Current high tides
on the Petitcodiac River of approximately 8 metres are experienced
several times each year.

5
Table 1. New Brunswick Climate Futures (ACASA), 2013 – Southern New Brunswick Climate
Change Forecast (High emissions scenario; temperatures in Celsius; precipitation in
millimeters)
Climate Change
Trends
Baseline Short-term
forecast
Medium-term
forecast
Long-term
forecast
1971-
2000
2011-2040 2041-2070 2071-2100
Mean Temperature
Annual
5.3 – 6.1 6.4 - 7.2 8.2 – 9.1 9.1 – 10.0
Mean Temperature
Spring
3.8 – 4.6 4.1 – 5.1 5.1 – 6.1 6.8 – 7.4
Mean Temperature
Summer
17.3 – 17.8 18.3 – 19.3 18.9 – 19.9 21.1 – 22.0
Annual Number of Days
with Maximum
Temperature greater
than 30 degrees C
4 - 5 8 - 11 10 – 20 26 – 40
Mean Temperature
Autumn
7.4 – 8.7 8.1 – 9.1 8.7 – 9.9 11.2 – 12.3
Mean Temperature
Winter
-8.5 - -6.4 -7.7 - -5.1 -5.5 - -3.7 -3.7 - -1.9
Annual Number of Days
with Maximum
Temperature less than -
10 degrees C
8 - 14 6 - 12 5 - 9 1 – 3
Annual Total
Precipitation
1175 - 1241 1157 - 1217 1180-1231 1231 - 1282
Annual Spring
Precipitation
286 - 306 294 – 317 306 – 327 317 - 335
Annual Summer
Precipitation
270 – 283 267 – 279 269 - 282 279 - 291
Annual Autumn
Precipitation
301 - 325 282 - 309 291 - 309 301 - 325
Annual Winter
Precipitation
306 – 348 323 - 373 330 - 366 348 – 380
Total Annual Rain Days 122 - 132 132 - 142 138 - 150 142 - 153
Total Annual Snow Days 45 - 57 51 - 61 53 - 61 39 - 48
Table 2. AMEC Study Results: Anticipated Relative Sea Level Rise over Time
Year Relative Sea Level Estimate 2025 13 +/- 3 cm
2055 42 +/- 12 cm
2085 80 +/- 28 cm
2100 100 +/- 38 cm

6
Figure 2. Mean Temperature Scenarios for New Brunswick (ACASA) By the 2080s,
mean temperatures are predicted to increase by around 3-3.5 degrees C. This will mean
that northern areas of the province will have a temperature climate similar to that in
southern New Brunswick today, while southern areas will become as warm as it is currently
is in parts of southern Ontario.

7
3.3 Extreme Weather Events
There is also increasing evidence that Canada is experiencing a greater
number of extreme weather events, including heat waves, droughts,
storm surges and heavy precipitation.
As detailed in Figure 3, Public Safety Canada has kept records of
significant natural disasters for over a century in a Canadian Disasters
Database. Since the 1970’s, there have been an increasing proportion of
weather related disasters (cold waves, droughts, floods,
hail/thunderstorms, heat waves, hurricanes/typhoons, avalanches, storms
(storm surges, freezing rain, winter storms), tornados and wildfires). A similar
increase in frequency however was not noted with respect to geophysical
related disasters (earthquakes, landslides and tsunamis).
Figure 3. The Frequency of weather related vs. Geophysical Disasters in Canada
Source: Public Safety Canada (PSC) Canadian Disaster Database (CDD) iv.
Climate change is expected to affect the frequency, severity and
duration of such events. In the future, it is expected that we may
experience:
more extreme heat waves and fewer extreme cold snaps;
more heavy rains and related storm events (hailstorms,
thunderstorms, hurricanes);
more droughts;
more intense winter storms;
more changes in atmospheric circulation which could influence
storm tracks and rainfall distribution; and
large storm surge events.
8
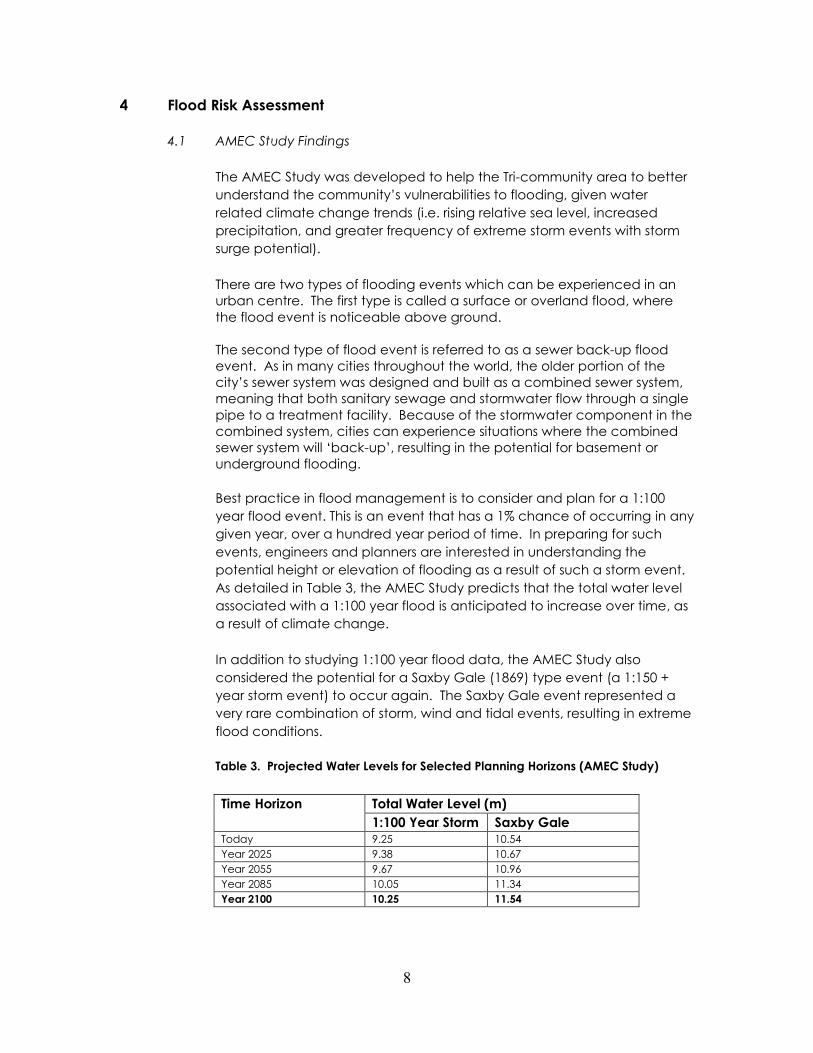
4 Flood Risk Assessment
4.1 AMEC Study Findings
The AMEC Study was developed to help the Tri-community area to better
understand the community’s vulnerabilities to flooding, given water
related climate change trends (i.e. rising relative sea level, increased
precipitation, and greater frequency of extreme storm events with storm
surge potential).
There are two types of flooding events which can be experienced in an
urban centre. The first type is called a surface or overland flood, where
the flood event is noticeable above ground.
The second type of flood event is referred to as a sewer back-up flood
event. As in many cities throughout the world, the older portion of the
city’s sewer system was designed and built as a combined sewer system,
meaning that both sanitary sewage and stormwater flow through a single
pipe to a treatment facility. Because of the stormwater component in the
combined system, cities can experience situations where the combined
sewer system will ‘back-up’, resulting in the potential for basement or
underground flooding.
Best practice in flood management is to consider and plan for a 1:100
year flood event. This is an event that has a 1% chance of occurring in any
given year, over a hundred year period of time. In preparing for such
events, engineers and planners are interested in understanding the
potential height or elevation of flooding as a result of such a storm event.
As detailed in Table 3, the AMEC Study predicts that the total water level
associated with a 1:100 year flood is anticipated to increase over time, as
a result of climate change.
In addition to studying 1:100 year flood data, the AMEC Study also
considered the potential for a Saxby Gale (1869) type event (a 1:150 +
year storm event) to occur again. The Saxby Gale event represented a
very rare combination of storm, wind and tidal events, resulting in extreme
flood conditions.
Table 3. Projected Water Levels for Selected Planning Horizons (AMEC Study)
Time Horizon Total Water Level (m)
1:100 Year Storm Saxby Gale Today 9.25 10.54
Year 2025 9.38 10.67
Year 2055 9.67 10.96
Year 2085 10.05 11.34
Year 2100 10.25 11.54

9
4.2 CCAC Flood Scenario Assessments
Based on the findings of the AMEC report, the CCAC team assessed four
types or potential flood scenarios for the City of Moncton, as detailed in
Table 4.
Table 4. CCAC Flood Assessment Scenario Descriptions
Scenario
Name
Flood
Elevation
(Geodetic)
Description/Significance Likelihood
of
occurrence
today
(Rating by
CCAC) Scenario 1
High-Tide Event
(2013)
8 m Currently, the City experiences an 8
metre high tide, 2-3 times each year.
While very little surface flooding will
occur under this scenario, should the
city experience rainfall at the same
time as a high-tide, there is potential
for sewer back-up flooding to occur.
This scenario does not factor in
climate change trends.
Almost certain
Scenario 2
1:100 Year Storm
Event (2013)
9.3 m This scenario considers a 9.3m storm
event. This type of event represents
the current 1:100 year flood scenario
that is used to plan and design the
city’s major infrastructure. This
scenario does not factor in climate
change trends.
Likely to
Unlikely
Scenario 3
1:100 Year Storm
Event (with
Climate Change
to year 2100)
10.3 m This scenario considers a 1:100 year
storm event factoring in climate
change trends to the year 2100. This
scenario coincidentally comes close
to the elevation of the Saxby Gale
flood if it were to reoccur today (10.5
m). Current Zoning provisions require
that new habitable floors be
constructed to address a 10.2 m
potential flood elevation.
Unlikely in 2013
Likely in 2100
Scenario 4
Saxby Gale Event
(with Climate
Change to year
2100)
11.5 m This scenario considers the scenario of
a Saxby Gale type event occurring in
Year 2100 factoring in climate
change.
Rare
In assessing vulnerability to flooding, the team considered both:
the probability for a flood event to occur (either sewer-back up
flooding or surface flooding); and
the severity of the impacts likely to be experienced as a result of the
flood event.

10
Two main tools were used to assist with its assessment:
1. Each scenario was developed and studied by the CCAC through the
use of an integrated GIS (Geographic Information Systems) mapping
product, which allowed the team to overlay various flood scenarios
on a variety of mapping data layers (transportation, essential
infrastructure, civic facilities, parks & open space, land use and zoning
layers, etc…).
2. The team used Sentinel emergency management software to
generate risk profiles for each scenario, based on a detailed
assessment of both probability and potential impact.
In assessing the probability of each type of flood scenario, the team
considered:
whether the event occurs regularly in the community or is
considered a chronic concern;
the extent to which the event has been observed in the past (and
how far into the past the event took place); and
the extent to which there is evidence suggesting that the event will
take place in the future (and how soon the event is likely to take
place).
Through the use of the AMEC Study and the Sentinel approach, a range
of potential flood related impacts were studied for each scenario (See
Table 5). Considerations included:
duration of the impact;
geographical extent of the impact;
extent to which the community is generally vulnerable or sensitive
to the impact;
magnitude of the impact from a socio-economic standpoint;
extent to which the impact can be mitigated or reversed; and
extent to which communication systems are impacted.
A detailed summary of the team exercise is included in Appendix 3.

11
Table 5. Potential Impacts Related to Flooding Events
Potential
impact
Description
Water levels the effects of rises in water levels rendering parts of the
community inaccessible or isolating certain sectors, or causing
damage to built infrastructure, business or homes;
Storm surge effects of storm surges (causing water to pile up higher than the
ordinary sea level)
Erosion erosion of river and stream banks (leading to an undermining of
transportation and other built structures);
Fires fires that might threaten people and/or important installations or
critical infrastructure;
Pollution (soil-
water)
temporary, long-term or permanent contamination of the soil or
water (e.g. hazardous materials);
Water/Sewer
Contamination
or when the sewage system gets backs up;
Large
Infrastructure
infrastructure such as bridges, dams, power generating stations
and electrical transmission towers, etc…
Emergency
Services
loss, degradation or reduction in emergency services, including
the 911 system, fire, police, ambulance and hospitals.
Essential
Services
including power, water, sewage, telecommunications, IT, and
potential impacts on health and economy of community
Major
Transportation
links
airports
Food/Water
Security
effects on ability to transport, protect and secure food/water
during and after a flood event
Roads or
Route Denial
effects on road links and rail system during and after an event
Structures effects on structures (public and private), both temporary and
long-term

12
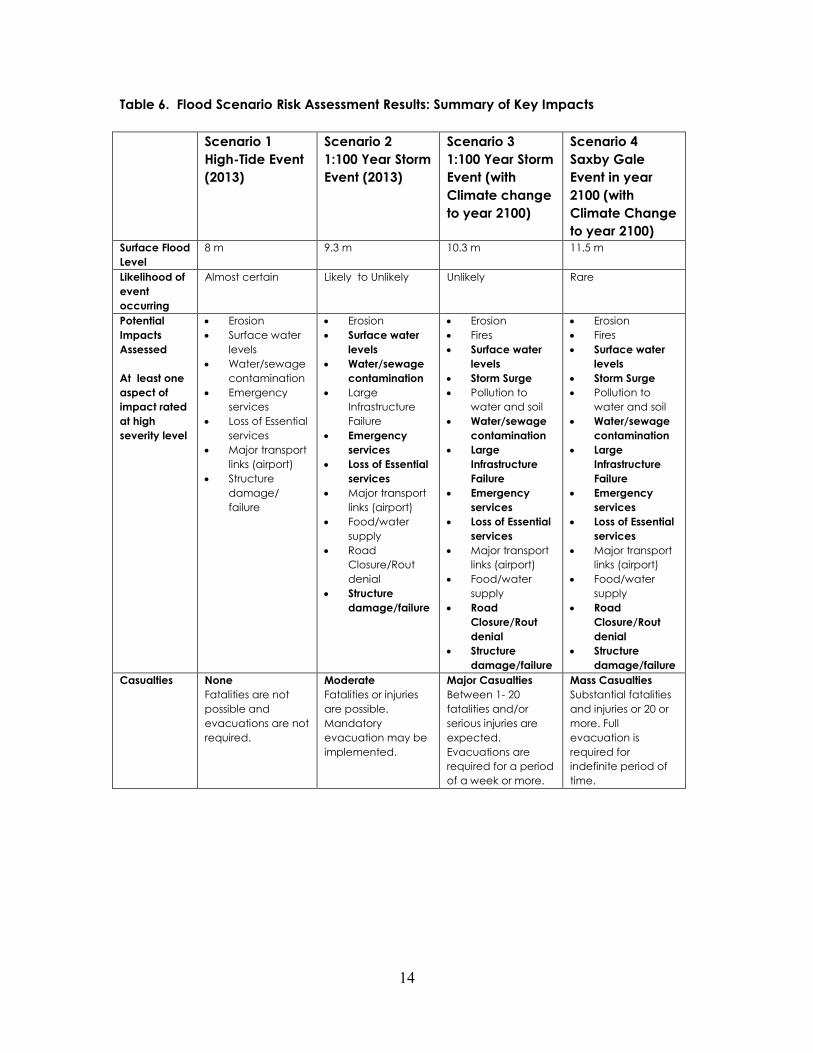
Table 6 presents a summary of the risk assessment exercise, and the types
of impacts that were deemed to be more important in each scenario.
The overall risk profiles for each scenario are illustrated in figure 3.
Scenario 1: High-Tide Event (2013)
This first scenario describes a situation where the City is experiencing 2013
high-tide levels.
As illustrated on Map 1, surface flooding in this scenario is limited to the
very low-lying parts of the city (areas below an 8 metre geodetic
elevation). Most of this land is undeveloped and as such, the potential
effects from surface flooding on structures, property and assets are very
limited.
The main risks created by this scenario relate to potential sewer-back up
or basement related flooding. Because of the combined nature of the
sewage system, there is potential for a sewer-back up event to occur
during a rainfall event at high tide. The rainfall event need not be very
large for such an effect to be created at high tide. Without proper
protection for existing buildings in areas affected by a sewer-back-up,
there is increased risk of basement flooding, resulting in potential damage
to structures.
While the effects of erosion on the banks of rivers, lakes and streams in
Moncton were considered to be relatively low in this scenario, it was
noted that erosion is a type of phenomenon which cannot be easily
reversed. Monitoring is therefore recommended.
Overall, this scenario received the highest probability rating of all four
flood scenarios and the lowest overall severity rating. While the city as a
whole may not necessarily feel the impact of this type of scenario,
individual homeowners and businesses experiencing a sewer back-up will.
It is also important to note that this scenario does not factor in the climate
trend for sea level rise. As sea levels rise over time, a greater number of
properties in the city will be at risk of overland flooding as well as sewer
back-up and related property damage.
The risks associated with sewer-back up can be effectively reduced
through the installation of back-water valves.

Wheeler Blvd
McLaughlin Dr
Trans Canada Highway
Shediac Rd
Berry Mills Rd Killam Dr
Salisbury R
d
Lewisville Rd
Assomption
Champlain St
HIllsborough Rd
Coverdale Rd
Petitcodiac River
Hall's Creek
Jonathan Creek
Gunningsville Bridgenot affected
Causewaynot affected
Humphrey's Brook
Salisbury
Mountain Rd
Wheeler Blvd
Main St
Morton Ave
St George St
Mountain Rd
Veterans Highway
Elmwo
od D
r
Vaughan Harvey Blvd
1Kilometers
Map 1
This map was developed on basis of projectedtide levels contained in the report by AMECEarth and & Environmental for the AtlanticCanada Adaptation Solutions Associationentitled Climate Change Adaptation Measuresfor Greater Moncton Area, New Brunswick (theAMEC report). As such, map details are inrelation to expected tide levels and floodingelevations located next to the Petitcodiac Riverand its tributaries, and do not address areasoutside the zone of tidal influence.
Waterway
Surface Flooding
Affected Streets
Potential Sewer Back-up
Municipal Boundary
Scenario 1: High-Tide Event (2013)8 m Flood Elevation
14
Table 6. Flood Scenario Risk Assessment Results: Summary of Key Impacts
Scenario 1
High-Tide Event
(2013)
Scenario 2
1:100 Year Storm
Event (2013)
Scenario 3
1:100 Year Storm
Event (with
Climate change
to year 2100)
Scenario 4
Saxby Gale
Event in year
2100 (with
Climate Change
to year 2100) Surface Flood
Level
8 m 9.3 m 10.3 m 11.5 m
Likelihood of
event
occurring
Almost certain Likely to Unlikely Unlikely Rare
Potential
Impacts
Assessed
At least one
aspect of
impact rated
at high
severity level
Erosion
Surface water
levels
Water/sewage
contamination
Emergency
services
Loss of Essential
services
Major transport
links (airport)
Structure
damage/
failure
Erosion
Surface water
levels
Water/sewage
contamination
Large
Infrastructure
Failure
Emergency
services
Loss of Essential
services
Major transport
links (airport)
Food/water
supply
Road
Closure/Rout
denial
Structure
damage/failure
Erosion
Fires
Surface water
levels
Storm Surge
Pollution to
water and soil
Water/sewage
contamination
Large
Infrastructure
Failure
Emergency
services
Loss of Essential
services
Major transport
links (airport)
Food/water
supply
Road
Closure/Rout
denial
Structure
damage/failure
Erosion
Fires
Surface water
levels
Storm Surge
Pollution to
water and soil
Water/sewage
contamination
Large
Infrastructure
Failure
Emergency
services
Loss of Essential
services
Major transport
links (airport)
Food/water
supply
Road
Closure/Rout
denial
Structure
damage/failure
Casualties None
Fatalities are not
possible and
evacuations are not
required.
Moderate
Fatalities or injuries
are possible.
Mandatory
evacuation may be
implemented.
Major Casualties
Between 1- 20
fatalities and/or
serious injuries are
expected.
Evacuations are
required for a period
of a week or more.
Mass Casualties
Substantial fatalities
and injuries or 20 or
more. Full
evacuation is
required for
indefinite period of
time.

15
Scenario 1:
High-Tide Event (2013) Scenario 2:
1:100 Year Storm Event (2013) at any
point now or in the future
Scenario 3: 1:100 Year Storm Event
(with Climate Change to year 2100) Scenario 4: Saxby Gale Event
(with Climate Change to year 2100)
Figure 3. Flood Risk Assessment Profiles (Sentinel), completed by CCAC team, April, 2013
16
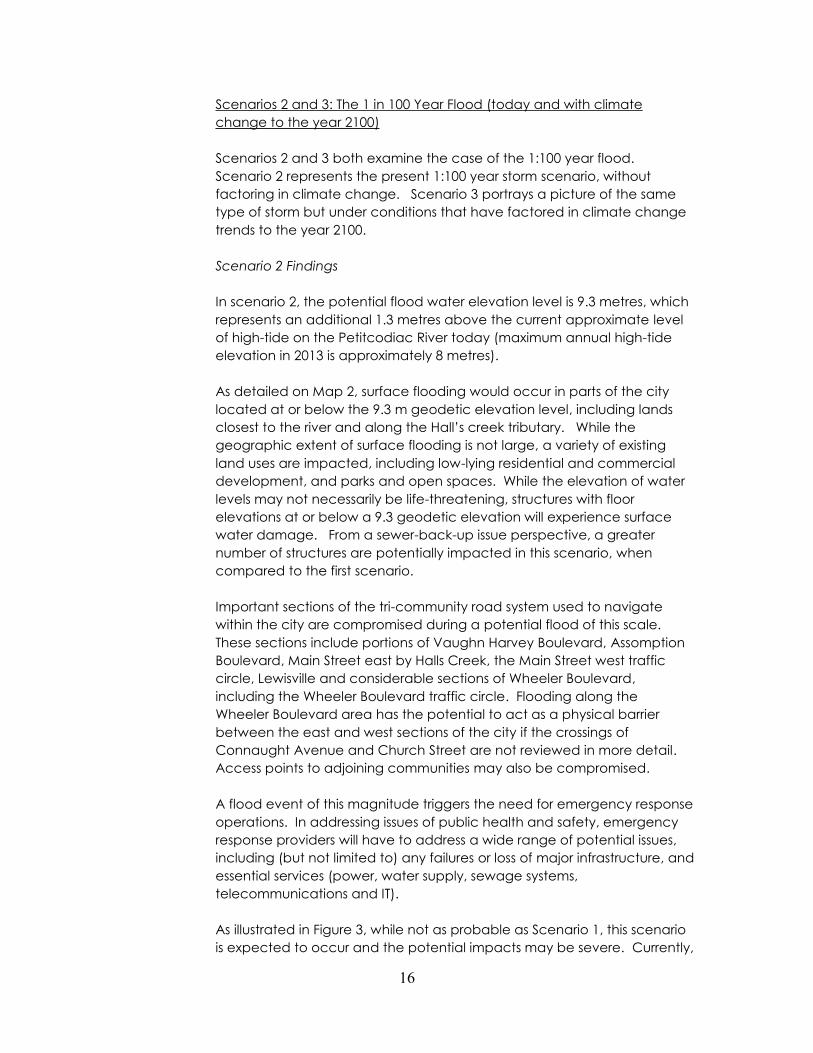
Scenarios 2 and 3: The 1 in 100 Year Flood (today and with climate
change to the year 2100)
Scenarios 2 and 3 both examine the case of the 1:100 year flood.
Scenario 2 represents the present 1:100 year storm scenario, without
factoring in climate change. Scenario 3 portrays a picture of the same
type of storm but under conditions that have factored in climate change
trends to the year 2100.
Scenario 2 Findings
In scenario 2, the potential flood water elevation level is 9.3 metres, which
represents an additional 1.3 metres above the current approximate level
of high-tide on the Petitcodiac River today (maximum annual high-tide
elevation in 2013 is approximately 8 metres).
As detailed on Map 2, surface flooding would occur in parts of the city
located at or below the 9.3 m geodetic elevation level, including lands
closest to the river and along the Hall’s creek tributary. While the
geographic extent of surface flooding is not large, a variety of existing
land uses are impacted, including low-lying residential and commercial
development, and parks and open spaces. While the elevation of water
levels may not necessarily be life-threatening, structures with floor
elevations at or below a 9.3 geodetic elevation will experience surface
water damage. From a sewer-back-up issue perspective, a greater
number of structures are potentially impacted in this scenario, when
compared to the first scenario.
Important sections of the tri-community road system used to navigate
within the city are compromised during a potential flood of this scale.
These sections include portions of Vaughn Harvey Boulevard, Assomption
Boulevard, Main Street east by Halls Creek, the Main Street west traffic
circle, Lewisville and considerable sections of Wheeler Boulevard,
including the Wheeler Boulevard traffic circle. Flooding along the
Wheeler Boulevard area has the potential to act as a physical barrier
between the east and west sections of the city if the crossings of
Connaught Avenue and Church Street are not reviewed in more detail.
Access points to adjoining communities may also be compromised.
A flood event of this magnitude triggers the need for emergency response
operations. In addressing issues of public health and safety, emergency
response providers will have to address a wide range of potential issues,
including (but not limited to) any failures or loss of major infrastructure, and
essential services (power, water supply, sewage systems,
telecommunications and IT).
As illustrated in Figure 3, while not as probable as Scenario 1, this scenario
is expected to occur and the potential impacts may be severe. Currently,

Wheeler Blvd
McLaughlin Dr
Trans Canada Highway
Shediac Rd
Berry Mills Rd Killam Dr
Salisbury R
d
Lewisville Rd
Assomption
Champlain St
HIllsborough Rd
Coverdale Rd
Petitcodiac River
Hall's Creek
Jonathan Creek
Gunningsville Bridgenot affected
Causewaynot affected
Humphrey's Brook
Salisbury
Mountain Rd
Wheeler Blvd
Main St
Morton Ave
St George St
Mountain Rd
Veterans Highway
Elmwo
od D
r
Vaughan Harvey Blvd
Map 2
This map was developed on basis of projected tidelevels contained in the report by AMEC Earth and &Environmental for the Atlantic Canada AdaptationSolutions Association entitled Climate ChangeAdaptation Measures for Greater Moncton Area,New Brunswick (the AMEC report). As such, mapdetails are in relation to expected tide levels andflooding elevations located next to the PetitcodiacRiver and its tributaries, and do not address areasoutside the zone of tidal influence. 1
Kilometers
Waterway
Surface Flooding
Affected Streets
Potential Sewer Back-up
Municipal Boundary
Scenario 2: 1:100 Year Storm Event (2013)9.3 m Flood Elevation
18
new city infrastructure is planned with this major storm scenario in mind.
More vulnerable, are the city’s established buildings, infrastructure and
assets that were built many years ago, under different specifications and
standards.
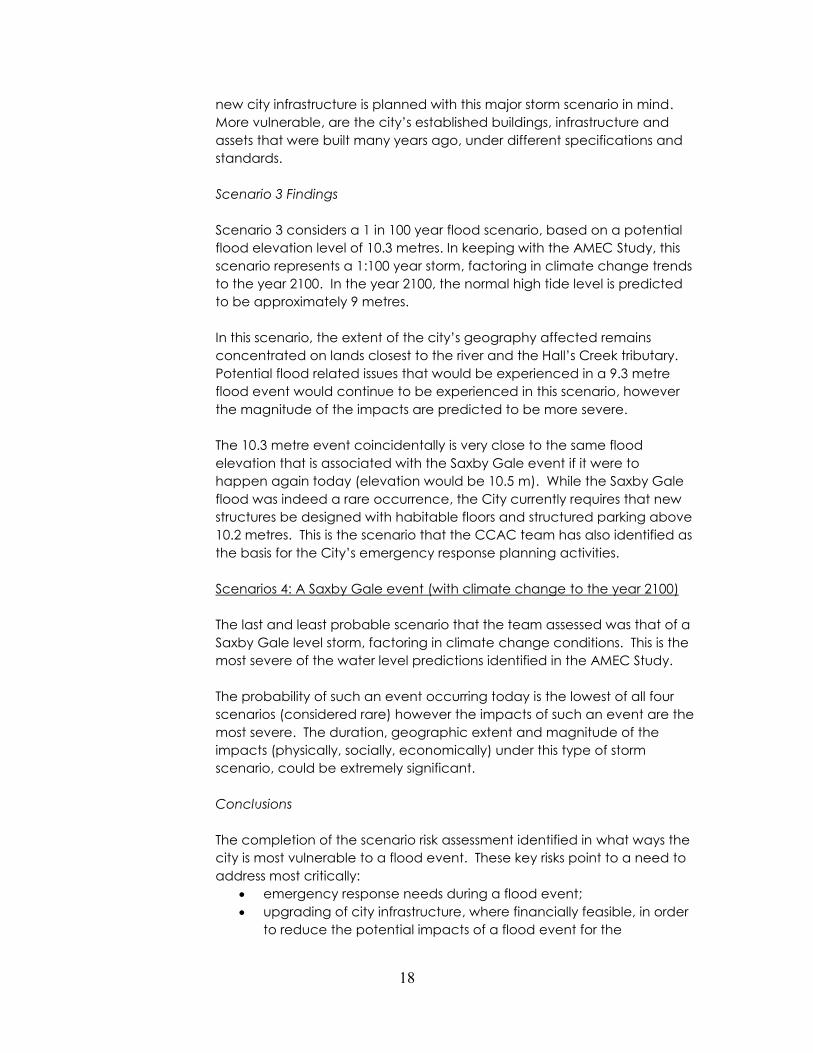
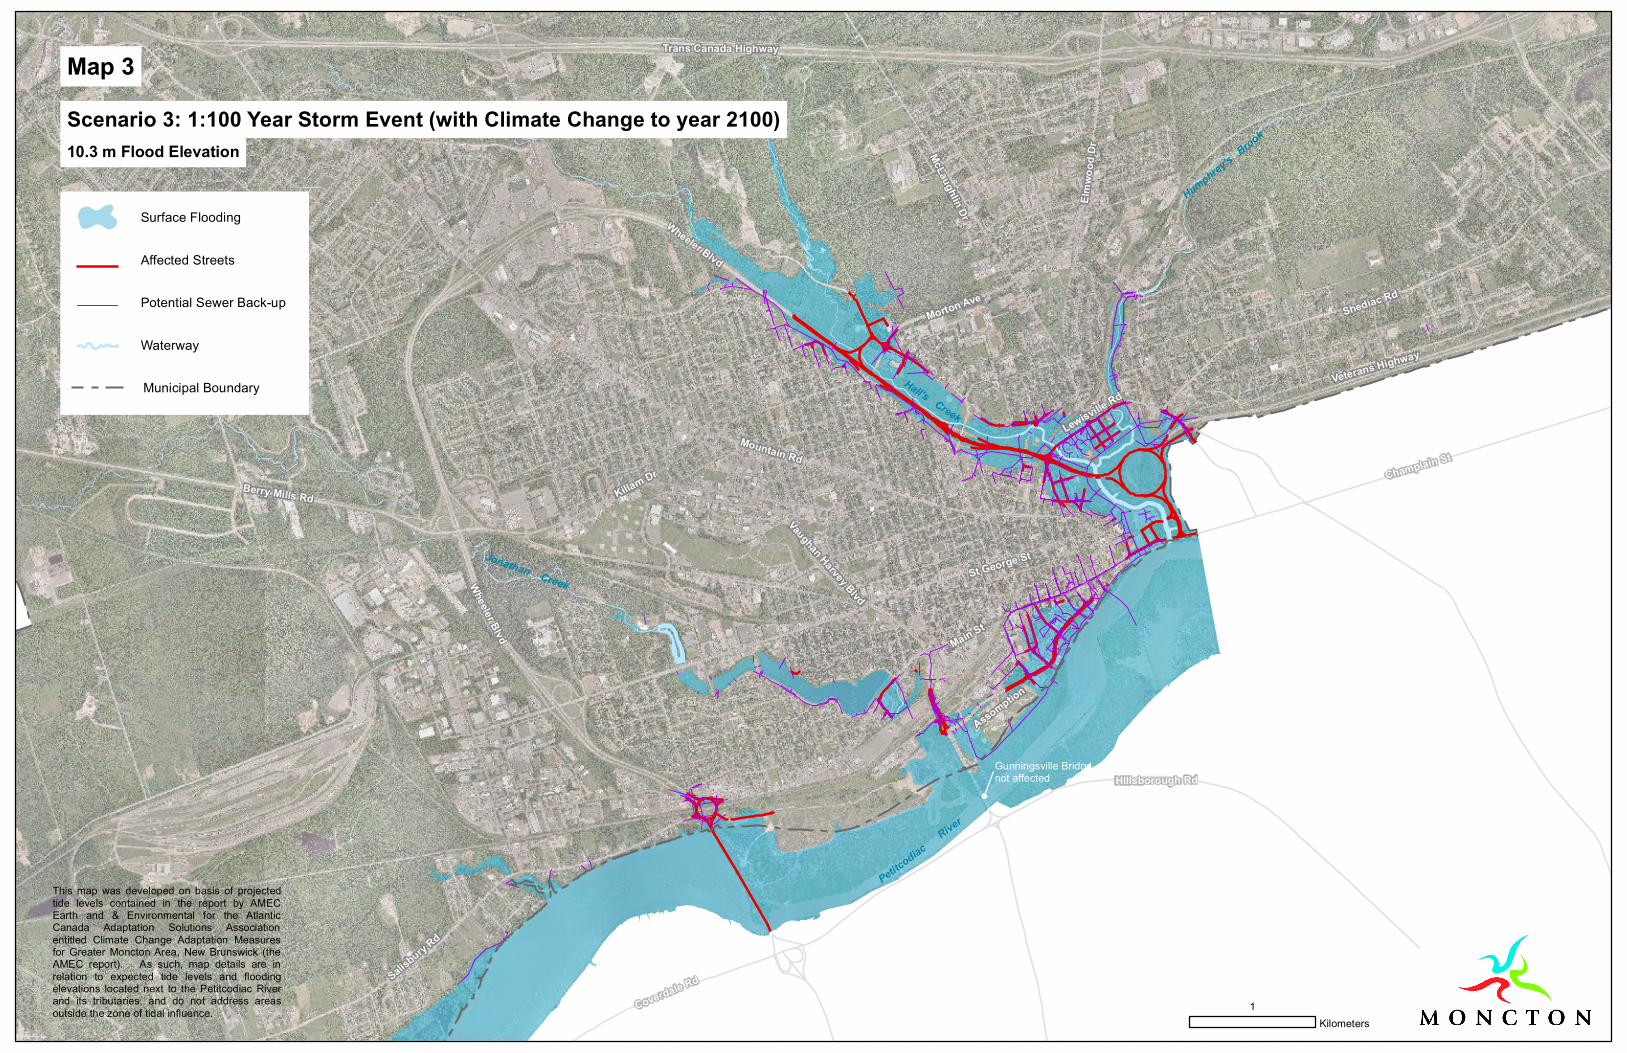
Scenario 3 Findings
Scenario 3 considers a 1 in 100 year flood scenario, based on a potential
flood elevation level of 10.3 metres. In keeping with the AMEC Study, this
scenario represents a 1:100 year storm, factoring in climate change trends
to the year 2100. In the year 2100, the normal high tide level is predicted
to be approximately 9 metres.
In this scenario, the extent of the city’s geography affected remains
concentrated on lands closest to the river and the Hall’s Creek tributary.
Potential flood related issues that would be experienced in a 9.3 metre
flood event would continue to be experienced in this scenario, however
the magnitude of the impacts are predicted to be more severe.
The 10.3 metre event coincidentally is very close to the same flood
elevation that is associated with the Saxby Gale event if it were to
happen again today (elevation would be 10.5 m). While the Saxby Gale
flood was indeed a rare occurrence, the City currently requires that new
structures be designed with habitable floors and structured parking above
10.2 metres. This is the scenario that the CCAC team has also identified as
the basis for the City’s emergency response planning activities.
Scenarios 4: A Saxby Gale event (with climate change to the year 2100)
The last and least probable scenario that the team assessed was that of a
Saxby Gale level storm, factoring in climate change conditions. This is the
most severe of the water level predictions identified in the AMEC Study.
The probability of such an event occurring today is the lowest of all four
scenarios (considered rare) however the impacts of such an event are the
most severe. The duration, geographic extent and magnitude of the
impacts (physically, socially, economically) under this type of storm
scenario, could be extremely significant.
Conclusions
The completion of the scenario risk assessment identified in what ways the
city is most vulnerable to a flood event. These key risks point to a need to
address most critically:
emergency response needs during a flood event;
upgrading of city infrastructure, where financially feasible, in order
to reduce the potential impacts of a flood event for the
Wheeler Blvd
McLaughlin Dr
Trans Canada Highway
Shediac Rd
Berry Mills Rd Killam Dr
Salisbury R
d
Lewisville Rd
Assomption
Champlain St
HIllsborough Rd
Coverdale Rd
Petitcodiac River
Hall's Creek
Jonathan Creek
Gunningsville Bridgenot affected
Humphrey's Brook
Salisbury
Mountain Rd
Wheeler Blvd
Main St
Morton Ave
St George St
Mountain Rd
Veterans Highway
Elmwo
od D
r
Vaughan Harvey Blvd
Map 3
This map was developed on basis of projectedtide levels contained in the report by AMECEarth and & Environmental for the AtlanticCanada Adaptation Solutions Associationentitled Climate Change Adaptation Measuresfor Greater Moncton Area, New Brunswick (theAMEC report). As such, map details are inrelation to expected tide levels and floodingelevations located next to the Petitcodiac Riverand its tributaries, and do not address areasoutside the zone of tidal influence. 1
Kilometers
Waterway
Surface Flooding
Affected Streets
Potential Sewer Back-up
Municipal Boundary
Scenario 3: 1:100 Year Storm Event (with Climate Change to year 2100)10.3 m Flood Elevation

Wheeler Blvd
McLaughlin Dr
Trans Canada Highway
Shediac Rd
Berry Mills Rd Killam Dr
Salisbury R
d
Lewisville Rd
Assomption
Champlain St
HIllsborough Rd
Coverdale Rd
Petitcodiac River
Hall's Creek
Jonathan Creek
Gunningsville Bridgenot affected
Humphrey's Brook
Salisbury
Mountain Rd
Wheeler Blvd
Main St
Morton Ave
St George St
Mountain Rd
Veterans Highway
Elmwo
od D
r
Vaughan Harvey Blvd
Map 4
This map was developed on basis of projectedtide levels contained in the report by AMECEarth and & Environmental for the AtlanticCanada Adaptation Solutions Associationentitled Climate Change Adaptation Measuresfor Greater Moncton Area, New Brunswick (theAMEC report). As such, map details are inrelation to expected tide levels and floodingelevations located next to the Petitcodiac Riverand its tributaries, and do not address areasoutside the zone of tidal influence. 1
Kilometers
Scenario 4: Saxby Gale Event (with Climate Change to year 2100) 11.5 m Flood Elevation
Waterway
Surface Flooding
Affected Streets
Potential Sewer Back-up
Municipal Boundary
21
community and to protect the integrity of the city’s system of
infrastructure and assets
reducing potential impacts on existing private and public
buildings, structures and assets and mitigating potential impacts
for new constructions in flood risk areas;
reducing potential impacts related to sewer-back-ups, including
property damage; and
financial and other options or strategies for restoration/recovery of
private and public infrastructure, structures and assets following a
major flood event.
The completion of the risk assessment also pointed to the need for the City
to reach out to the key stakeholders and the community at large in
education, consultation and partnerships.
4.3 Proposed Strategy for Reducing Flood Risk
A comprehensive flood management strategy and action plan is
proposed to provide a strategic approach to flood risk reduction. The
strategy is based on the completion of the following key steps:
1. Completion of Major Storm/Hurricane/Flood Emergency Response
Plan
While the City currently has in place an All Hazards Emergency
Measures Plan, there is a need to develop a hazard specific plan to
address the type of flooding scenarios examined by the CCAC, and in
particular the 10.5 metre flood scenario. It is anticipated that such a
plan will be developed by the summer of 2013.
In support of this hazard specific plan , there is a need to carry out
more detailed investigations in regards to the vulnerability of essential
services, major infrastructure and the overall transportation system.
While initial consultation with key stakeholders has begun, further
consultation activities will play an important role in finalizing the plan.
Once in place, it will be important to communicate the plan to the
community at large.
2. Community Engagement (Education, Consultation and Partnerships)
There are a number of important ways in which community education,
consultation and partnerships can assist to reduce and address the
potential impacts of flooding. Important stakeholders include:
The City of Dieppe and Town of Riverview
Provincial agencies
External essential service providers

22
Downtown and neighbourhood organizations (social, cultural,
economic and environmental)
Targeted landowners in flood risk areas
The community at large
Given the relative newness of the AMEC Study results and available
climate change information, community engagement is seen as a
top priority, only second to the development of an EMO Plan. It is
important to begin discussions with our partners in the community in
order to refine and improve upon the overall adaptation strategy.
3. Research, Planning and Priority Setting
The team identified an important need to carry out further research
and planning activities in order to verify and confirm potential risks
and establish clearer priorities and direction for land use and
infrastructure in flood prone parts of the city. Studies include:
An Urban Forest Management Plan to strengthen overall
health and resiliency of City’s Urban Forest;
Heritage and civic properties assessment in flood prone areas;
Best practice stormwater and flood plain management;
Development of a city-wide stormwater strategy through the
completion of Sewer System Review/Master Plan Studies and
Area Structure Plans (e.g. Neighbourhood Plans); and
Further assessment of potential infrastructure at risk.
4. Adaptation Policies and Regulations
Updating policies and regulations to reflect climate change trends is
an important component of the proposed strategy. A number of
policy proposals will be presented to City Council in 2013 in
conjunction with the Plan Moncton project. Proposed changes
include:
zero-net stormwater policies and regulations that help to
reduce stormwater run-off volumes;
new minimum floor elevation requirements for habitable space
and structured parking associated with new buildings (an
increase in elevation from 10.2 m to 10.5 m);
additional landscaping provisions which will assist in containing
storm-water run-off (e.g. parking lot design, street trees);and
increased development setbacks from watercourses to 30
metres (Zoning By-law amendment).
Further to the adoption of zero-net policies, it is recommended that
stormwater design standards and specifications be updated in 2013
to reflect the 10.5 metre flood scenario, as recommended by the
AMEC study.

23
The strategy also calls for the development of further municipal plan
policy and zoning regulation to help guide future land use decisions in
flood prone areas. Such regulation will first require considerable
research and community consultation prior to finalization.
5. Physical Adaptation
Both the City and the community have a role to play in physical
adaptation.
With the adoption of updated regulations to reflect climate change,
the City is able to ensure that new infrastructure is designed to address
a 10.5 metre flood scenario, as recommended by the AMEC Study.
Based on the completion of more detailed studies, higher priority
climate change related infrastructure upgrades will also be
completed.
Adaptation measures which property owners/developers will be asked
to participate in include the construction of new habitable floor levels
and indoor parking at flood resistant elevations (10.5 m).
For existing structures with floor elevations below 10.5 metres, until such
time as the City has adopted further floodplain policy and regulation,
owners are permitted to renovate and add on to an existing structure
at an elevation that is at least the same habitable floor level as what is
currently in place. To ensure that property owners are well-informed in
regards to potential flood risk at the building permit stage, it is
proposed that an acknowledgement form be used explaining the
potential for flood risk under 10.5 metres.
While no specific regulation is in place, developers will also be
encouraged to locate essential services (e.g. electrical boxes) at
elevations above 10.5 metres.
Another important physical adaptation is the installation of back-
water valves. Mandatory for all new construction, the challenge for
the City will be to encourage the installation of these valves in existing
homes. To serve as an incentive, the City should continue to offer a
back-water valve rebate to existing home owners.
6. Monitoring
Climate change trends will continue to evolve over time. There is a
continual need to update and reflect on any environmental changes
being seen on the ground.
Monitoring of existing infrastructure and facilities and assets relative to
climate change is also recommended.

24
7. Funding
Funding climate change adaptation is a key consideration.
Recommendations include:
A yearly assessment of external Climate Change adaptation
funding options;
Continued funding of the back-water valve replacement
program (100 valves per year);
Capital budget adjustment to anticipate increased
stormwater management requirements (i.e. implementation of
zero-net policy & increased maintenance of stormwater
infrastructure such as ponds);and
Yearly adjustments to proposed capital budget for Climate
Change Adaptation related items, based on recommendation
of Climate Change Action Committee and available external
grants.
8. Oversight & Ongoing Updates
The establishment of the Climate Change Action Committee ensures
that climate change effects are considered by every department of
the City. It is recommended that this Committee remain in place to
provide oversight and further direction to the implementation of the
flood management strategy, including yearly updates and reporting
to City Council and the community at large.

25
4.4 Addressing Flood Risk Outside the Scope of the AMEC Study
The flood scenario assessments and mapping contained in this report
were developed on the basis of projected tide levels contained in the
report by AMEC Earth and & Environmental for the Atlantic Canada
Adaptation Solutions Association entitled Climate Change Adaptation
Measures for Greater Moncton Area, New Brunswick (the AMEC report).
As such, the comments, flooding scenario assessment and mapping
contained in this report are based on the expected tide levels and
flooding elevations predicted in the AMEC report. While the flood risk
assessments scenarios and mapping contained in this report are more
detailed for the areas located next to the Petitcodiac River and its
tributaries, a detailed study of risk assessment outside the zone of tidal
influence does not form part of this report.
To minimize the impacts of potential flooding generally, all Moncton
residents and businesses are encouraged to protect their homes and
properties by reviewing and implementing best practices outlined in the
following documents contained on the City of Moncton website:
The Homeowner’s guide to Flood Protection; and
Protect you home from basement flooding (City of
Moncton Backwater Valve Incentive and Grant Programs).
26
5 Assessment of Other Climate Change Trends
While a main interest in the development of this report was to consider the
potential impacts of climate change on flood risk in the city of Moncton,
the CCAC team also considered that climate change trends may also
have other implications for the City, in both the positive and negative
sense of the word.
The purpose of this section is to begin to scope a variety of possible
benefits and challenges that other aspects of climate change may bring.
In the course of further community consultation and discussion, it is hoped
that the ideas presented here will be further refined and developed into
additional action plan considerations for the City.
5.1 Warmer Average Temperatures & Extreme Heat Days
Climate change is anticipated to bring warmer average temperatures to
our region in the future. It is anticipated that our region will likely
experience the kind of heat that is more typically experienced in southern
Ontario today (ACASA, 2013). A key factor related to warmer
temperatures is an increase in the number of extreme heat days.
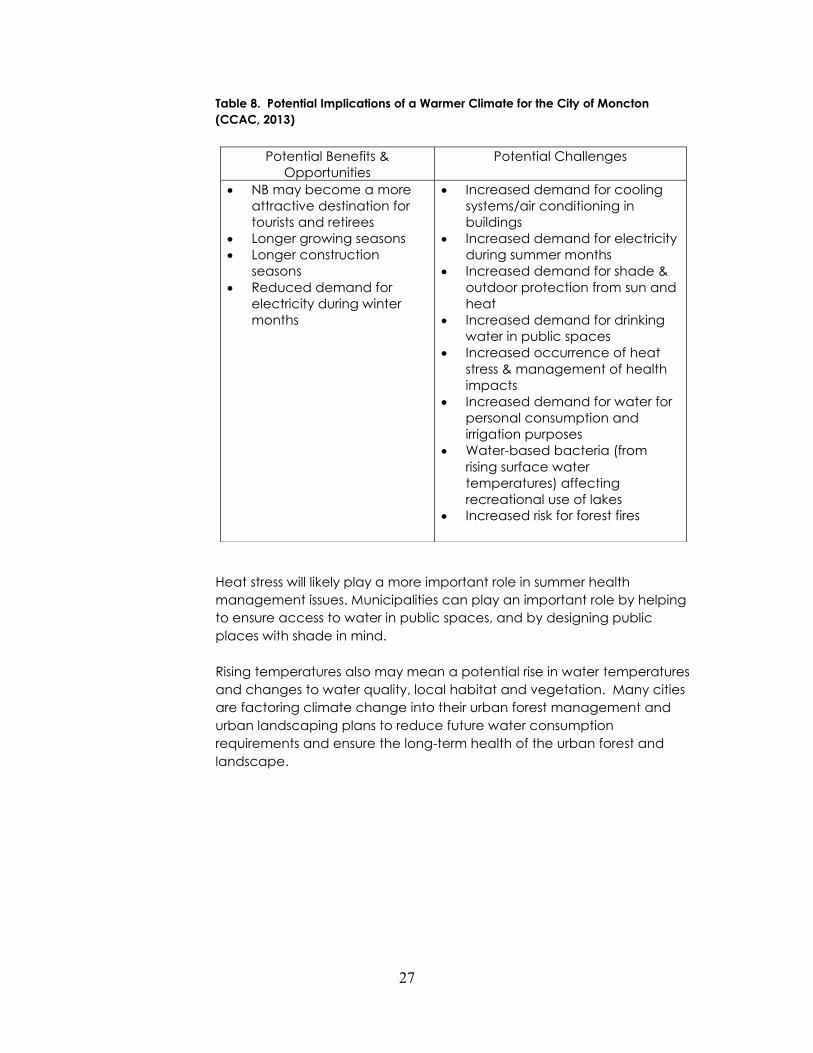
As outlined in Table 8, there are both potential benefits and challenges
associated with a warmer city. Warmer weather may create new
opportunities for tourism and recreation in our region and offer an easier
winter perhaps for retirees. However, warmer average weather is also
associated with more heat days (above 30 degrees Celsius).
In other parts of the country such as Ontario, communities are paying
close attention to the ways in which municipalities can help their
community to remain liveable during hotter summer periods. Cities such
as Windsor are studying the ‘heat island effect’ that is created as a result
of hard asphalt surfaces (e.g. roads, parking lots, rooftops) to better
understand how to reduce this particular effect. Other cities are revisiting
how buildings and homes are designed to offer cooler spaces, both inside
and out. Demand for electricity may rise during summer months, so any
design features which naturally cool buildings and outdoor spaces will be
greatly appreciated.
27
Table 8. Potential Implications of a Warmer Climate for the City of Moncton
(CCAC, 2013)
Heat stress will likely play a more important role in summer health
management issues. Municipalities can play an important role by helping
to ensure access to water in public spaces, and by designing public
places with shade in mind.
Rising temperatures also may mean a potential rise in water temperatures
and changes to water quality, local habitat and vegetation. Many cities
are factoring climate change into their urban forest management and
urban landscaping plans to reduce future water consumption
requirements and ensure the long-term health of the urban forest and
landscape.
Potential Benefits &
Opportunities
Potential Challenges
NB may become a more
attractive destination for
tourists and retirees
Longer growing seasons
Longer construction
seasons
Reduced demand for
electricity during winter
months
Increased demand for cooling
systems/air conditioning in
buildings
Increased demand for electricity
during summer months
Increased demand for shade &
outdoor protection from sun and
heat
Increased demand for drinking
water in public spaces
Increased occurrence of heat
stress & management of health
impacts
Increased demand for water for
personal consumption and
irrigation purposes
Water-based bacteria (from
rising surface water
temperatures) affecting
recreational use of lakes
Increased risk for forest fires

28
Figure 4. Annual Number of Days with Maximum Temperature greater than 30 degrees C
is the average number of days per year when the temperature exceeds this threshold.
Also known as hot days. The number of hot days increases everywhere in the future
climate scenarios. The increase is dramatic by the latter part of the century. By this time
most central areas of the province will have more days over 30 degrees C than locations
in extreme southwestern Ontario (such as Windsor) do today.

29
5.2 Other Extreme Weather Events
Through the use of the Sentinel software, the CCAC considered the general
vulnerability of the City to following types of extreme weather events:
Heat Wave/Drought
Forest Fires
Cold Wave
Ice Storm
Severe Winter Storm
As outlined in Table 9, while the probability of each of these events occurring is
likely or almost certain, the scope of potential impacts are more limited than in
the case a flood hazard. Nevertheless, the results remind us that events such as
heat waves will likely occur more frequently in the future.
From an emergency services perspective, such exercises are an important
opportunity to consider and test the All Hazards Plan that the City now has in
place to ensure that it will respond well to these types of scenarios. More hazard
specific planning to any one of these events may be useful to complete in the
future.
Table 9. Climate Change Risk Assessment Results: Summary of Key Impacts
Heat Wave/
Drought
Forest Fire Cold
Wave
Ice Storm Severe Winter
Storm Likelihood of
event
occurring
Almost certain-
Likely
Almost certain-
likely
Likely Likely Almost certain
Potential
Impacts
Assessed
At least one
aspect of
impact
rated at
medium
severity level
At least one
aspect of
impact rated
at high
severity level
Fires
Loss of animal
habitat
Pollution/ Air
Impacts
Degradation/
loss of
emergency
services
Loss of
essential
services
Fires
Loss of animal
habitat
Pollution/ Air
Impacts
Degradation/
loss of
emergency
services
Loss of
essential
services
Road
closure/route
denial
Structure
failure
Loss of
essential
services (e.g.
power)
Degradation/
loss of
emergency
services
Loss of
essential
services (e.g.
power)
Road
Closure/Route
Denial
Structure
failure
Degradation/ loss of
emergency services
Loss of essential
services
Road Closure/ Route
Denial
Structure failure
Casualties Low
Moderate
Low
Low
Low

30
Figure 5 Other Hazard Assessment Profiles (Sentinel), completed by CCAC team, April, 2013
Ice Storm
Cold Wave
Heat Wave/Drought Forest Fire
Winter Storm
Cold Wave

31
6 Conclusions/Recommendations
The City of Moncton has taken a significant step in preparing this corporate
climate change adaptation plan. Of particular importance is the proposed flood
management strategy, which provides a course of action for the City to embark
on, in order to help reduce potential impacts in the city. Factoring in climate
change trends in flood management will help to ensure that measures carried
out today will more properly address flood management needs well into the
future.
This report highlights the need for the City to reach out to key stakeholders and
the community at large, with respect to flood management, as well as in respect
to climate change generally. There is a need to continue to scope, confirm and
update the ideas presented in this document, as our understanding of climate
change develops over the coming years.
32
Appendix 1
Glossary Adaptation: any activity that reduces the negative impact of climate change, while
taking advantage of new opportunities that may be presented as a result of climate
change.
Adaptive Capacity: The collective of capabilities, resources and institutions of a country
or region to implement effective adaptation measures.
Climate Change: Any long-term change in the “average weather” that a given region
experiences. Average weather may include average temperature, precipitation and
wind patterns. It involves changes in the variability or average state of the atmosphere
over durations ranging from decades to millions of years. These changes can be caused
by dynamic processes on Earth (ocean processes, volcanoes), external forces including
variations in sunlight intensity, and more recently by human activities.
Climate Change Mitigation: Implementing policies and/or introducing technological
change and substitution that reduce greenhouse gas emissions and enhance sinks.
Climate Scenario: A plausible and often simplified representation of the future climate,
based on a consistent set of climatological relationships and assumptions, typically
constructed for explicit use as input to climate change impact models. A “climate
change scenario” is the difference between a climate scenario and the current climate.
Extreme Weather Event: An extreme weather event refers to meteorological conditions
that are rare for a particular place and/or time, such as an intense storm or heat wave.
An extreme climate event is an unusual average over time of a number of weather
events, for example heavy rainfall over a season resulting in floods.
Greenhouse Effect: Greenhouse gases effectively absorb thermal infrared radiation,
emitted by the Earth’s surface, by the atmosphere itself due to the same gases, and by
clouds. Atmospheric radiation is emitted to all sides, including downward to the Earth’s
surface. Thus, greenhouse gases trap heat within the surface-troposphere system. This is
called the greenhouse effect.
Greenhouse Gases (GHGs): Gases present in the atmosphere which reduce the Earth’s
loss of heat into space and therefore contribute to increases in global temperatures
through the ‘greenhouse effect’. Greenhouse gases are essential in maintaining the
temperature of the Earth, however, an excess of greenhouse gases can raise the
temperature of the planet. Greenhouse gases include carbon dioxide (CO2), methane
(CH4), nitrous oxide (N20), sulfur hexafluoride (SF6), perflurocarbons (PCF’s) and
hydrofluorocarbons (HFC’s).
Planned Adaptation: Adaptation that is the result of a deliberate policy decision, based
on an awareness that conditions have changed or are about to change and that action
is required to return to, maintain, or achieve a desired state.
Resilience: The ability of a social or ecological system to absorb disturbances while
retaining the same basic structure and ways of functioning, the capacity for self-
organization, and the capacity to adapt to stress and change.

33
Retrofitting: Retrofitting means to install new or modified parts or equipment, or undertake
structural modifications, to existing infrastructure that were either not available or not
considered necessary at the time of construction. The purpose of retrofitting in the
context of climate change is generally to ensure that existing infrastructure meets new
design specifications that may be required under altered climate conditions.
Risk: A combination of the likelihood (probability of occurrence) and the consequences
of an adverse event (e.g. climate-related hazard).
Risk management: A systematic approach to setting the best course of action under
uncertainty, by applying management policies, procedures and practices to the tasks of
analysing, evaluating, controlling and communicating about risk issues.
Sea level rise: An increase in the mean level of the ocean. Seal levels can rise at a global
level through an increase in the volume of the world’s oceans or at a local level due to
ocean rise or land level subsidence.
Storm surge: Generally used to refer to a temporary increase, at a particular locality, in
the height of the sea due to extreme meteorological conditions (low atmospheric
pressure and/or strong winds). The storm surge is defined as being the excess above the
level expected from the tidal variation alone at that time and place. Negative storm
surges also occur and can present significant problems for navigation.
Vulnerability: The degree to which a system is susceptible to, and unable to cope with
adverse effects of climate change. Vulnerability is a function of the character,
magnitude, and rate of climate change and variation to which a system is exposed, its
sensitivity, and its adaptive capacity.
Weather: The state of the atmosphere at a given time and place, in terms of
temperature, air pressure, humidity, wind, cloudiness and precipitation. The term weather
is used mostly for conditions over short periods of time.

34
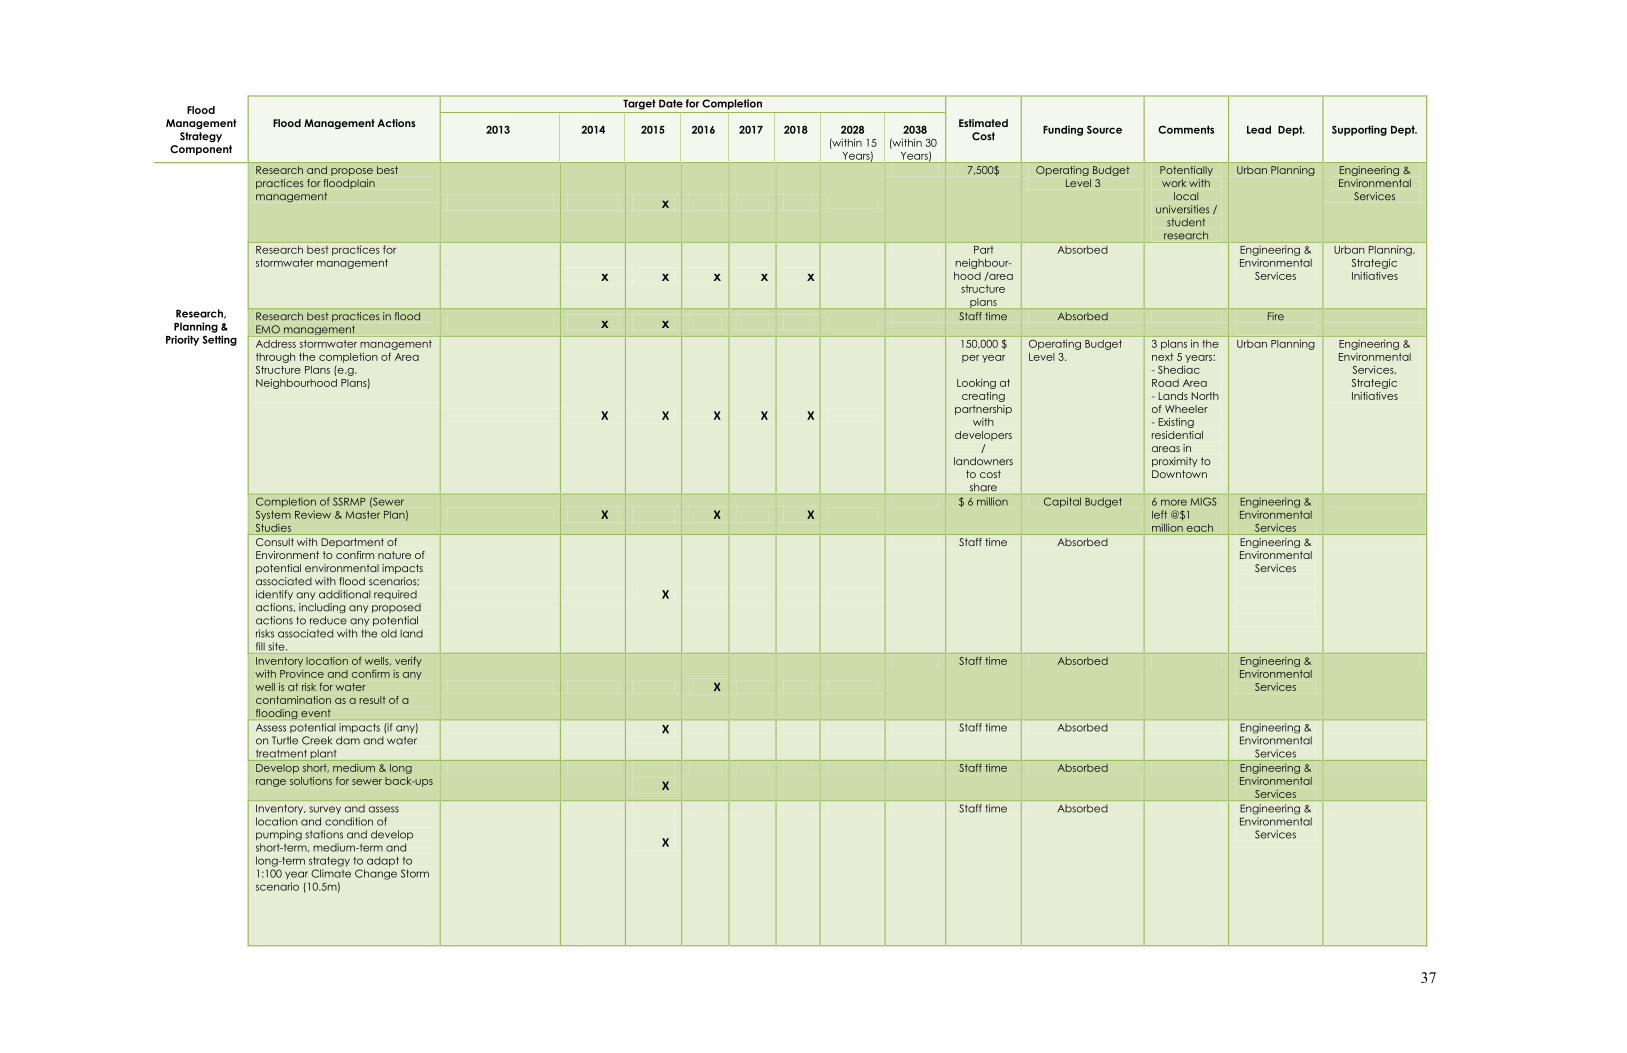
Appendix 2 Climate Change Adaptation and Flood Management Strategy:
Action Plan Schedule
35
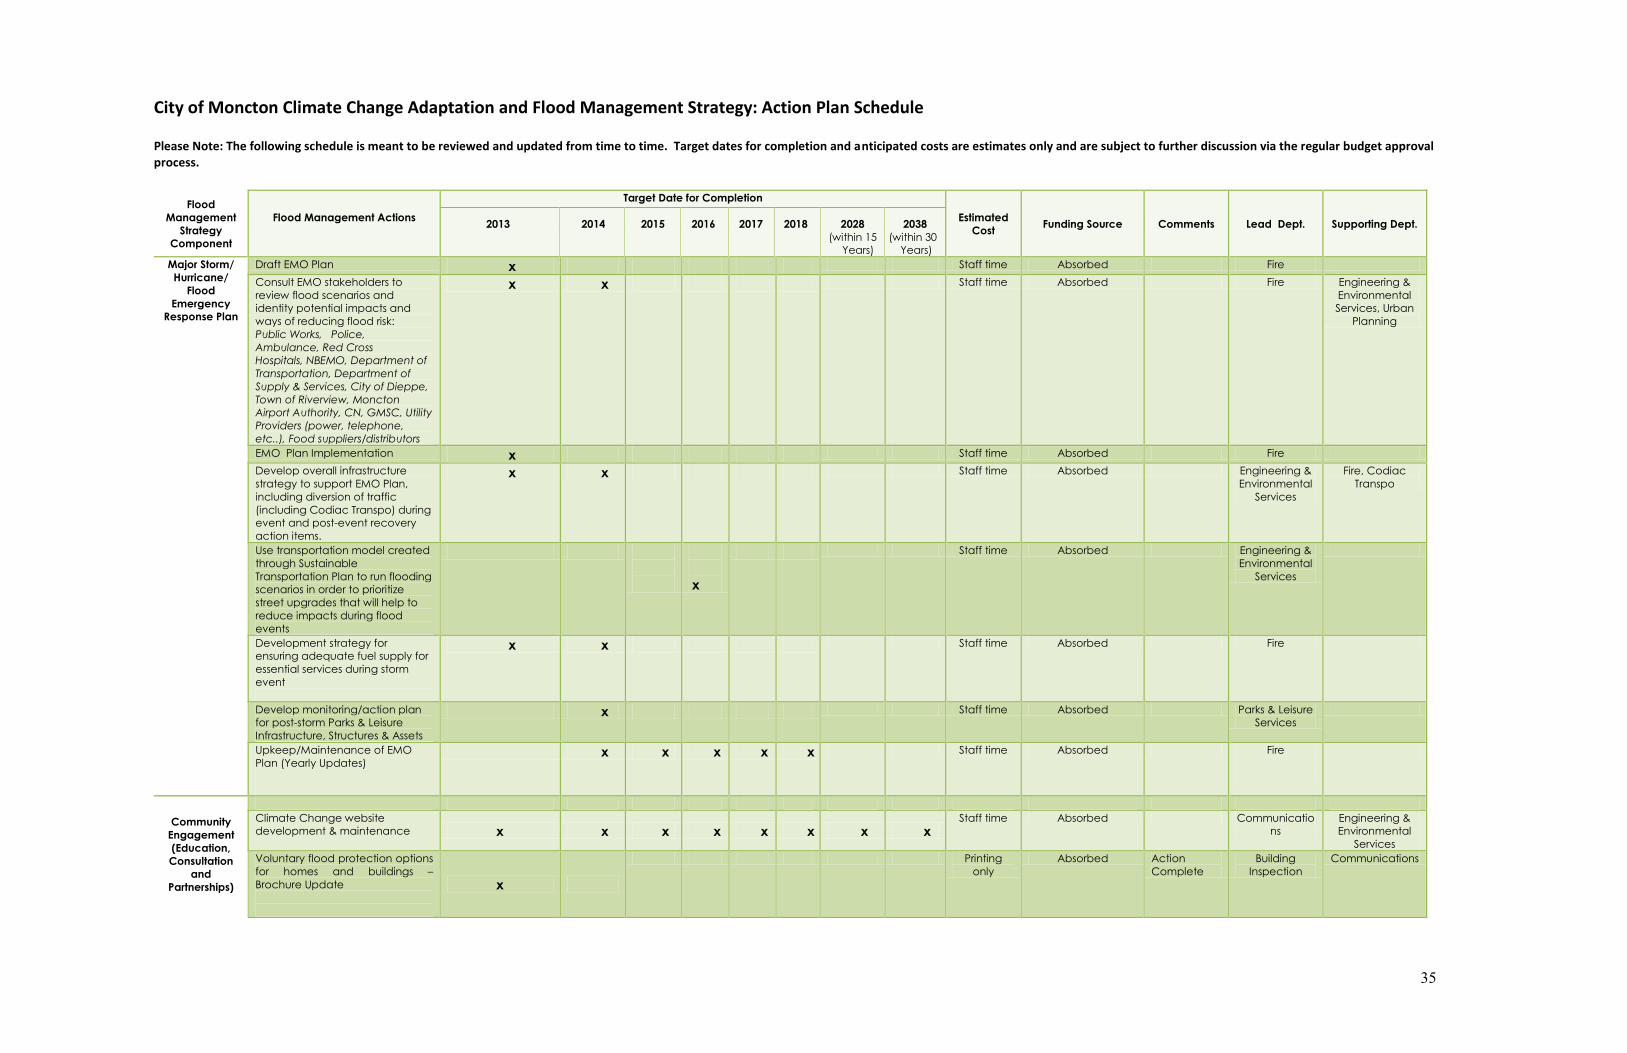
City of Moncton Climate Change Adaptation and Flood Management Strategy: Action Plan Schedule
Please Note: The following schedule is meant to be reviewed and updated from time to time. Target dates for completion and anticipated costs are estimates only and are subject to further discussion via the regular budget approval process.
Flood
Management
Strategy
Component
Flood Management Actions
Target Date for Completion
2013 2014 2015 2016 2017 2018 2028 2038
(within 15 (within 30
Years) Years)
Estimated
Cost Funding Source Comments Lead Dept. Supporting Dept.
Major Storm/
Hurricane/
Flood
Emergency
Response Plan
Draft EMO Plan x Staff time Absorbed Fire
Consult EMO stakeholders to
review flood scenarios and
identity potential impacts and
ways of reducing flood risk:
Public Works, Police,
Ambulance, Red Cross
Hospitals, NBEMO, Department of
Transportation, Department of
Supply & Services, City of Dieppe,
Town of Riverview, Moncton
Airport Authority, CN, GMSC, Utility
Providers (power, telephone,
etc..), Food suppliers/distributors
x x Staff time Absorbed Fire Engineering &
Environmental
Services, Urban
Planning
EMO Plan Implementation x Staff time Absorbed Fire
Develop overall infrastructure
strategy to support EMO Plan,
including diversion of traffic
(including Codiac Transpo) during
event and post-event recovery
action items.
x x Staff time Absorbed Engineering &
Environmental
Services
Fire, Codiac
Transpo
Use transportation model created
through Sustainable
Transportation Plan to run flooding
scenarios in order to prioritize
street upgrades that will help to
reduce impacts during flood
events
x
Staff time Absorbed Engineering &
Environmental
Services
Development strategy for
ensuring adequate fuel supply for
essential services during storm
event
x x Staff time Absorbed Fire
Develop monitoring/action plan
for post-storm Parks & Leisure
Infrastructure, Structures & Assets
x Staff time Absorbed Parks & Leisure
Services
Upkeep/Maintenance of EMO
Plan (Yearly Updates)
x x x x x Staff time Absorbed Fire
Community
Engagement
(Education,
Consultation
and
Partnerships)
Climate Change website
development & maintenance x x x x x x x x
Staff time Absorbed Communicatio
ns
Engineering &
Environmental
Services
Voluntary flood protection options
for homes and buildings –
Brochure Update
x
Printing
only
Absorbed Action
Complete
Building
Inspection
Communications

36
Flood
Management
Strategy
Component
Flood Management Actions
Target Date for Completion
2013 2014 2015 2016 2017 2018 2028 2038
(within 15 (within 30
Years) Years)
Estimated
Cost Funding Source Comments Lead Dept. Supporting Dept.
Community
Engagement
(Education,
Consultation
and
Partnerships
Public consultation regarding
emergency preparedness for a
major storm/flood event x
Staff time Absorbed Fire Communications
Inform public about sewer-back-
up risks & available options for
reducing risk x x x x x x x
Staff time Absorbed Engineering &
Environmental
Services
Building
Inspections,
Legal,
Communications
Communication program with
property owners/businesses
associated with hazardous
materials in flood prone areas
x
Staff time Absorbed Fire Communications
Engineering &
Environmental
Services
Education on need to protect
stream banks with healthy riparian
buffer areas x x x x x x x x
Staff time Absorbed Parks & Leisure
Services
Communications
Engineering &
Environmental
Services
Ongoing consultation and
assistance to development
industry stakeholders in making
informed investment decisions
within floodprone areas
x x x x x x x x
Staff time Absorbed Economic
Development
Review flood scenarios with
Department of Transportation to
identify any potential Provincial
infrastructure at risk (e.g. bridges)
that are located in the City of
Moncton and identify proposed
actions
x x
Staff time Absorbed Engineering &
Environmental
Services, Fire
Review flood scenarios with
Department of Supply & Services
to identify Provincial facilities
(located in the City of Moncton)
at risk and proposed actions
x x
Staff time Absorbed Engineering &
Environmental
Services, Fire
Review flood scenarios with
GMSC to identify any potential
infrastructure at risk and proposed
actions
x
Staff time Absorbed Engineering &
Environmental
Services, Fire
Meet with cities of Dieppe and
Riverview to review results of
flood risk analysis for Moncton and
exchange insights regarding flood
risk management
x
Staff time Absorbed Climate
Change Action
Committee
Meet with utility providers
(telephone, gas, power) to
identify utilities at risk (including
electrical substations) and
proposed actions
x x
Staff time Absorbed Engineering &
Environmental
Services, Fire
Research,
Planning &
Priority Setting
Develop Urban Forest
Management Plan to identify risks
and strengthen overall health and
resiliency of City’s Urban Forest
x
$250,000
Operating Budget
Level 3
Issue RFP for
consultant to
assess tree
infrastructure
Parks & Leisure
Services
Engineering &
Environmental
Services (Urban
Forester)
Assess risks to Heritage properties
in flood prone and develop
adaptation strategies if required x
Staff time Absorbed Building
Inspection
(Heritage
Officer)
Urban Planning
Assess risks to civic facilities in
flood prone and develop
adaptation strategies if required x x
Staff time Absorbed Parks & Leisure
Services
Building
Inspection
37
Flood
Management
Strategy
Component
Flood Management Actions
Target Date for Completion
2013 2014 2015 2016 2017 2018 2028 2038
(within 15 (within 30
Years) Years)
Estimated
Cost Funding Source Comments Lead Dept. Supporting Dept.
Research,
Planning &
Priority Setting
Research and propose best
practices for floodplain
management x
7,500$ Operating Budget
Level 3
Potentially
work with
local
universities /
student
research
Urban Planning Engineering &
Environmental
Services
Research best practices for
stormwater management
x x x x x
Part
neighbour-
hood /area
structure
plans
Absorbed Engineering &
Environmental
Services
Urban Planning,
Strategic
Initiatives
Research best practices in flood
EMO management x x
Staff time Absorbed Fire
Address stormwater management
through the completion of Area
Structure Plans (e.g.
Neighbourhood Plans)
X X X X X
150,000 $
per year
Looking at
creating
partnership
with
developers
/
landowners
to cost
share
Operating Budget
Level 3.
3 plans in the
next 5 years:
- Shediac
Road Area
- Lands North
of Wheeler
- Existing
residential
areas in
proximity to
Downtown
Urban Planning Engineering &
Environmental
Services,
Strategic
Initiatives
Completion of SSRMP (Sewer
System Review & Master Plan)
Studies
X X X
$ 6 million Capital Budget 6 more MIGS
left @$1
million each
Engineering &
Environmental
Services
Consult with Department of
Environment to confirm nature of
potential environmental impacts
associated with flood scenarios;
identify any additional required
actions, including any proposed
actions to reduce any potential
risks associated with the old land
fill site.
X
Staff time Absorbed Engineering &
Environmental
Services
Inventory location of wells, verify
with Province and confirm is any
well is at risk for water
contamination as a result of a
flooding event
X
Staff time Absorbed Engineering &
Environmental
Services
Assess potential impacts (if any)
on Turtle Creek dam and water
treatment plant
X Staff time Absorbed Engineering &
Environmental
Services
Develop short, medium & long
range solutions for sewer back-ups
X
Staff time Absorbed Engineering &
Environmental
Services
Inventory, survey and assess
location and condition of
pumping stations and develop
short-term, medium-term and
long-term strategy to adapt to
1:100 year Climate Change Storm
scenario (10.5m)
X
Staff time Absorbed Engineering &
Environmental
Services

38
Flood
Management
Strategy
Component
Flood Management Actions
Target Date for Completion
2013 2014 2015 2016 2017 2018 2028 2038
(within 15 (within 30
Years) Years)
Estimated
Cost Funding Source Comments Lead Dept. Supporting Dept.
Research,
Planning &
Priority Setting
Use transportation model created
through Sustainable
Transportation Plan to run flooding
scenarios in order to prioritize
street upgrades that will help to
reduce impacts during flood
events
X X $100,000 Operating Budget
Level 3
Engineering &
Environmental
Services
Plan new transportation,
infrastructure and essential
services to meet 1:100 year
Climate Change Storm scenario
(10.5m)
X
X
Staff time Absorbed Engineering &
Environmental
Services
Research regarding external
funding options for climate
change adaptation
X X X X X X X X Staff time Absorbed Finance Climate Change
Action
Committee (all
Depts.)
Adaptation
Policies &
Regulations
Adopt zero-net stormwater
policies and regulations in order to
reduce the quantity of stormwater
run-off - PlanMoncton
X X $15,000 Operating Budget
Level 3
Communi-
cation
strategy and
“how to”
guide to help
developers
understand
zero-net
Urban Planning
Engineering &
Environmental
Services,
Corporate
Communications
Update Design Criteria Manual to
address rainfall intensities for year
2100
X Staff time Absorbed Engineering &
Environmental
Services
Update design criteria and
specifications for new
infrastructure design to reflect
data based on 1:100 year Climate
Change Storm scenario (10.5m)
X Staff time Absorbed Engineering &
Environmental
Services
Adopt new minimum floor
elevation requirements for
habitable space and structured
parking associated with new
buildings (Zoning By-law
amendment) - PlanMoncton
X Staff time Absorbed Urban Planning
Adopt additional landscaping
provisions in the Zoning By-law
which will assist in containing
storm-water run-off (e.g. parking
lot design, street trees)
X Staff time Absorbed Urban Planning
Adopt increased development
setbacks from watercourses to 30
metres (Zoning By-law
amendment) – PlanMoncton
X Staff time Absorbed Urban Planning
Adopt further Municipal Plan
floodplain policies & Zoning-By-
law regulations through continued
best practice research and
community consultation.
X X 25,000$
(over 2
years)
Operating Budget
Level 3
Urban Planning
Corporate
Communications
Develop/adopt LfPP (Land for
public purposes) policies to
prevent parks and trails from
being situated in higher risk areas
X X Urban Planning Parks & Leisure
Services

39
Flood
Management
Strategy
Component
Flood Management Actions
Target Date for Completion
2013 2014 2015 2016 2017 2018 2028 2038
(within 15 (within 30
Years) Years)
Estimated
Cost Funding Source Comments Lead Dept. Supporting Dept.
Adaptation
Policies &
Regulations
Reassessment of standards &
regulations as required
X Staff time Absorbed Climate
Change Action
Committee
Physical
Adaptation
Measures
(City)
Adjust design criteria, where
appropriate, to ensure potential
climate change impacts (1:100
year Climate Change Storm
scenario (10.5m)) are considered
for new road construction
X X X X X X X Staff time Absorbed In
conjunction
with ongoing
capital works
program
Engineering &
Environmental
Services
Adjust design criteria to ensure
that potential climate change
impacts are considered in
construction of new sewer
infrastructure
X X X X X X X Staff time Absorbed In
conjunction
with ongoing
capital works
program
Engineering &
Environmental
Services
Raise elevations of mechanical &
electrical equipment in existing
pumping stations to address 1:100
year Climate Change Storm
scenario (10.5m)
X Staff time Absorbed In
conjunction
with ongoing
capital works
program
Engineering &
Environmental
Services
Consider locating and
constructing new trails at higher
elevations to meet 1:100 year
Climate Change Storm Model
(10.5m)
X X Staff time Absorbed In
conjunction
with ongoing
capital works
program
Parks & Leisure
Services
Consider climate change impacts
during the redesign/construction
of existing street infrastructure
identified as a priority (following
the completion of transportation
modelling assessment)
X Staff time Absorbed In
conjunction
with ongoing
capital works
program
Engineering &
Environmental
Services
Consider climate change impacts
during the redesign/construction
of other infrastructure
X X X X X X X Staff time Absorbed In
conjunction
with ongoing
capital works
program
Engineering &
Environmental
Services
Intensive tree planting program x x x x x x x $100,000
per year
Operating Budget
Level 3
Based on
planting of
900-1000
trees per
year (in
addition to
existing
planting
program)
Parks & Leisure
Services
Physical
Adaptation
Measures
(Community)
New buildings constructed with
habitable floors and structured
parking above 10.5m
x x x x x x x x No
Cost
Urban
Planning;
Building
Inspection
Ensure proper installation of Back-
water valves
x x x x x x x x Staff time Absorbed All new
buildings
Building
Inspection

40
Flood
Management
Strategy
Component
Flood Management Actions
Target Date for Completion
2013 2014 2015 2016 2017 2018 2028 2038
(within 15 (within 30
Years) Years)
Estimated
Cost Funding Source Comments Lead Dept. Supporting Dept.
Physical
Adaptation
Measures
(Community)
Inform public of properties
situated on sites with a geodetic
elevation of less than 10.5 of
potential flood risks through the
use of a acknowledgement form
(to be implemented at time of
building permit application).
Provide suggestions for voluntary
flood adaptation measures,
including mechanical and
electrical systems located above
10.5m
X X X X X X X X Staff time Absorbed Urban
Planning,
Building
Inspection,
Legal
Climate
Change
Environmental
Monitoring
Review of Climate Change Trends X X X X X X X X Staff time Absorbed Ongoing
every year
Engineering &
Environmental
Services
Review erosion rates along river,
streams and lakes, especially in
areas where erosion may
compromise the stability of
existing roads, culverts or buildings
X
X
X
X
X
X
X
X
Staff time Absorbed Ongoing
every year
Engineering &
Environmental
Services
Monitor water quality associated
with old land fill site
X X X X X X X X Staff time Absorbed Ongoing
every year
Engineering &
Environmental
Services
Monitor/inventory hazardous
material sites
Staff time Absorbed Fire Engineering &
Environmental
Services
Monitoring &
Maintenance
of Infrastructure
Ongoing review, maintenance &
monitoring of water distribution
system
X X X X X X X X Staff time Absorbed Engineering &
Environmental
Services
Maintain folded all-way stop-signs
at signalized intersections
X X X X X X X X Staff time Absorbed Engineering &
Environmental
Services
Funding
Yearly assessment of external
Climate Change adaptation
funding options
X X X X X X X X Staff time Absorbed Finance Climate Change
Action
Committee (All
Depts.)
Back-water valve installment
program, including the continued
development and promotion of
this program
x x x x x x X X $265,000
(2013-2018)
($15,000 in
2013,
$50,000 in
subsequent
years)
General Utility 50/50
Operating budget
$15,000
budgeted in
2013, after
which no
funds are
budgeted
As per 100
valves per
year with a
$500 rebate.
Engineering &
Environmental
Services
Building
Inspection,
Finance
Adjust capital budgets to
anticipate increased stormwater
management requirements (i.e.
implementation of zero-net policy
& increased maintenance of
stormwater infrastructure such as
ponds)
X X X X X X X X Staff time Absorbed Engineering &
Environmental
Services
Finance
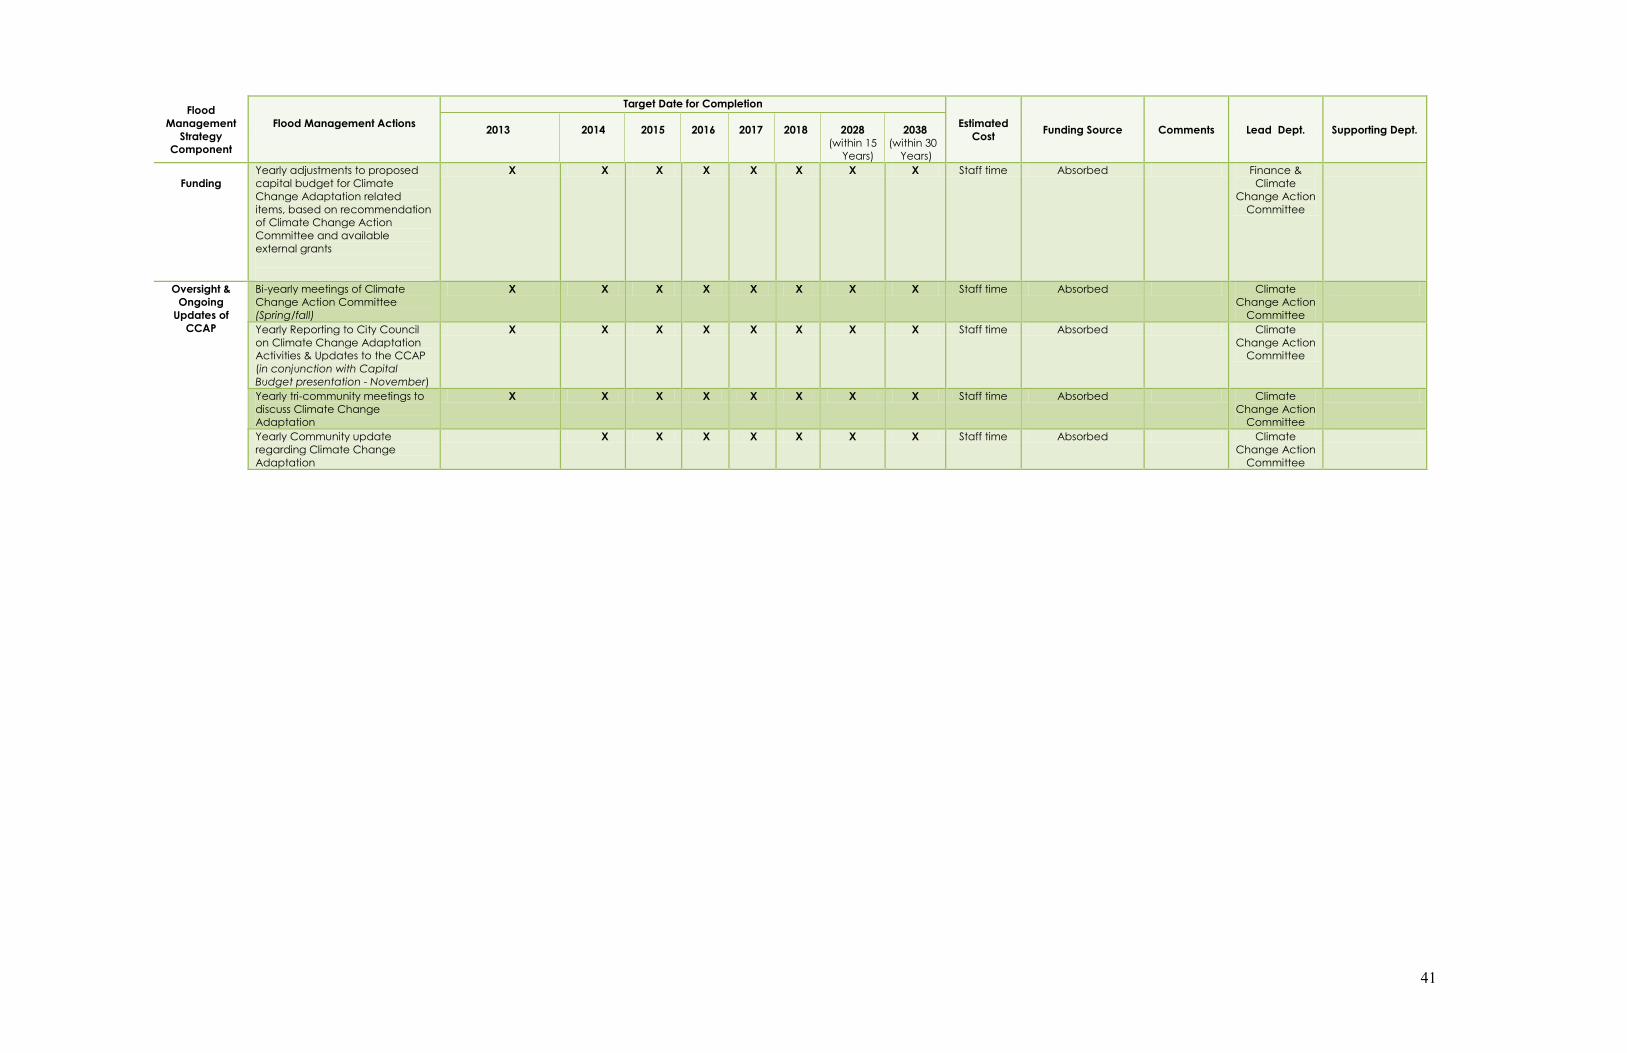
41
Flood
Management
Strategy
Component
Flood Management Actions
Target Date for Completion
2013 2014 2015 2016 2017 2018 2028 2038
(within 15 (within 30
Years) Years)
Estimated
Cost Funding Source Comments Lead Dept. Supporting Dept.
Funding
Yearly adjustments to proposed
capital budget for Climate
Change Adaptation related
items, based on recommendation
of Climate Change Action
Committee and available
external grants
X X X X X X X X Staff time Absorbed Finance &
Climate
Change Action
Committee
Oversight &
Ongoing
Updates of
CCAP
Bi-yearly meetings of Climate
Change Action Committee
(Spring/fall)
X X X X X X X X Staff time Absorbed Climate
Change Action
Committee
Yearly Reporting to City Council
on Climate Change Adaptation
Activities & Updates to the CCAP
(in conjunction with Capital
Budget presentation - November)
X X X X X X X X Staff time Absorbed Climate
Change Action
Committee
Yearly tri-community meetings to
discuss Climate Change
Adaptation
X X X X X X X X Staff time Absorbed Climate
Change Action
Committee
Yearly Community update
regarding Climate Change
Adaptation
X X X X X X X Staff time Absorbed Climate
Change Action
Committee
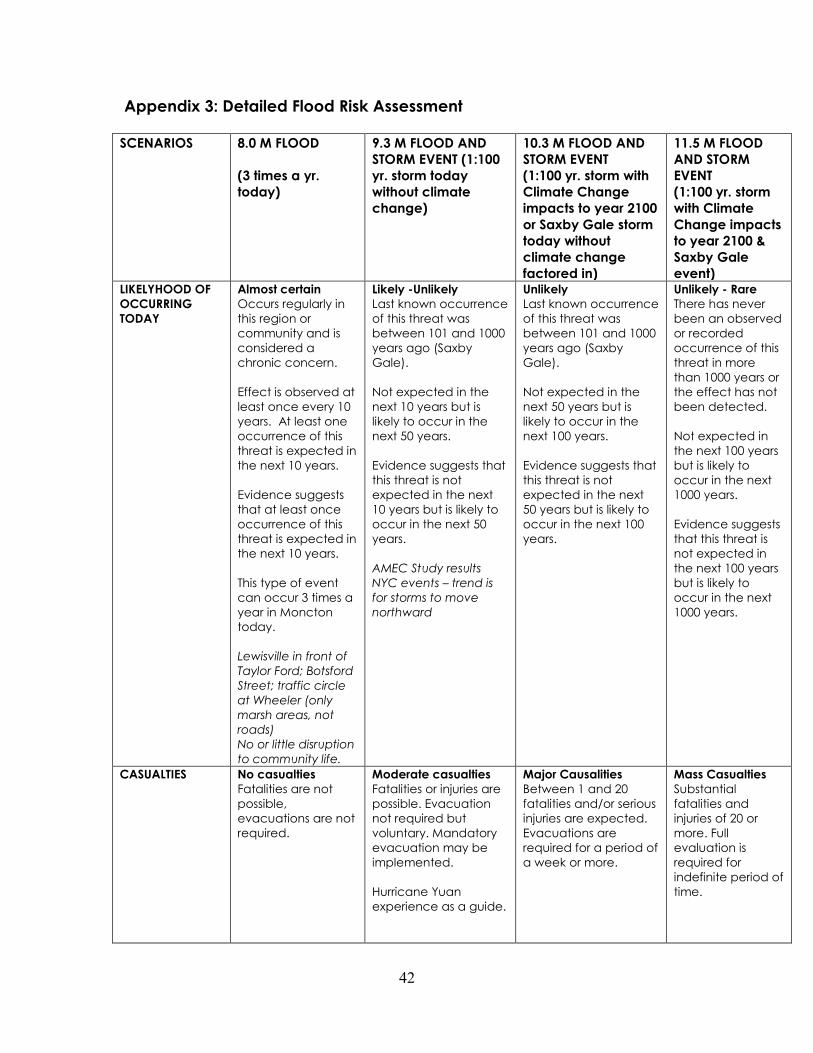
42
Appendix 3: Detailed Flood Risk Assessment SCENARIOS 8.0 M FLOOD
(3 times a yr.
today)
9.3 M FLOOD AND
STORM EVENT (1:100
yr. storm today
without climate
change)
10.3 M FLOOD AND
STORM EVENT
(1:100 yr. storm with
Climate Change
impacts to year 2100
or Saxby Gale storm
today without
climate change
factored in)
11.5 M FLOOD
AND STORM
EVENT
(1:100 yr. storm
with Climate
Change impacts
to year 2100 &
Saxby Gale
event) LIKELYHOOD OF
OCCURRING
TODAY
Almost certain
Occurs regularly in
this region or
community and is
considered a
chronic concern.
Effect is observed at
least once every 10
years. At least one
occurrence of this
threat is expected in
the next 10 years.
Evidence suggests
that at least once
occurrence of this
threat is expected in
the next 10 years.
This type of event
can occur 3 times a
year in Moncton
today.
Lewisville in front of
Taylor Ford; Botsford
Street; traffic circle
at Wheeler (only
marsh areas, not
roads)
No or little disruption
to community life.
Likely -Unlikely
Last known occurrence
of this threat was
between 101 and 1000
years ago (Saxby
Gale).
Not expected in the
next 10 years but is
likely to occur in the
next 50 years.
Evidence suggests that
this threat is not
expected in the next
10 years but is likely to
occur in the next 50
years.
AMEC Study results
NYC events – trend is
for storms to move
northward
Unlikely
Last known occurrence
of this threat was
between 101 and 1000
years ago (Saxby
Gale).
Not expected in the
next 50 years but is
likely to occur in the
next 100 years.
Evidence suggests that
this threat is not
expected in the next
50 years but is likely to
occur in the next 100
years.
Unlikely - Rare
There has never
been an observed
or recorded
occurrence of this
threat in more
than 1000 years or
the effect has not
been detected.
Not expected in
the next 100 years
but is likely to
occur in the next
1000 years.
Evidence suggests
that this threat is
not expected in
the next 100 years
but is likely to
occur in the next
1000 years.
CASUALTIES No casualties
Fatalities are not
possible,
evacuations are not
required.
Moderate casualties
Fatalities or injuries are
possible. Evacuation
not required but
voluntary. Mandatory
evacuation may be
implemented.
Hurricane Yuan
experience as a guide.
Major Causalities
Between 1 and 20
fatalities and/or serious
injuries are expected.
Evacuations are
required for a period of
a week or more.
Mass Casualties
Substantial
fatalities and
injuries of 20 or
more. Full
evaluation is
required for
indefinite period of
time.

43
IMPACTS: EROSION
Erosion is a geomorphological phenomenon which can lead to undermining of transportation and other built
structures Potential impacts noted by TAG:
1. Trail network along riverbank and key streams potentially
impacted
2. Riprap is in place along riverbanks which helps to mitigate but
will need to be strengthened over time
3. Valuable roads could be undermined by erosion due to culvert
crossings (e.g. St. George Blvd., Milner Rd., Westbrook Circle,
Salisbury Road)
4. Stability of buildings (public and private) can be undermined
by erosion activity along riverbank as well as banks adjacent to
Wheeler corridor (Bathurst Street area)
5. Risks associated with erosion rise over time
Proposed solutions to reduce potential impacts:
1. Wider setbacks from streams and buildings (Zoning By-
law) – proposed 30m setback in proposed Zoning By-
law.
2. Construction and location of new trails to factor in
potential for erosion
3. Construction and reconstruction of roads to factor in
potential for erosion in vulnerable locations
4. Erosion monitoring program of erosion rates along
riverbank and areas at risk
5. Develop communications program to educate public
on need to retain banks in good conditions (i.e. leave
vegetation intact, etc…) Scenario 8m 9.3m 10.3m 11.5m
Duration Low
Effect causes disruption to normal
community life for several weeks or
less.
Low
Effect causes disruption to
normal community life for
several weeks or less.
Medium
Effect causes disruption
to normal community life
for several months.
High
Effect causes disruption to
normal community life for
more than a year.
Geographic
Extent
Low
Effect occurs over a localized area
within the region or community.
Effect is considered to have an
area of influence which is limited to
the footprint of the effect or its
immediate vicinity.
Low
Effect occurs over a
localized area within the
region or community. Effect
is considered to have an
area of influence which is
limited to the footprint of
the effect or its immediate
vicinity.
Low
Effect occurs over a
localized area within the
region or community.
Effect is considered to
have an area of
influence which is limited
to the footprint of the
effect or its immediate
vicinity.
Medium
Effect occurs over a portion
of the region or community.
The effect is considered to
have an area of influence
which is limited to a portion of
the geographic area.
Regional
Sensitivity
Low
The nature of this region or
community’s economy, culture or
environment do NOT make it
particularly sensitive or vulnerable
to this effect.
Medium
The nature of this region or
community’s economy,
culture or environment
make it moderately
sensitive or vulnerable to
this effect. Some regional
characteristics are
vulnerable but do not
exacerbate the effect.
Medium
The nature of this region
or community’s
economy, culture or
environment make it
moderately sensitive or
vulnerable to this effect.
Some regional
characteristics are
vulnerable but do not
exacerbate the effect.
High
The nature of this region of
community’s economy,
culture or environment make
it atypically sensitive or
vulnerable to this effect.
Some regional characteristics
could exacerbate the
negative consequences of
the effect.
Magnitude Low
Effect has the potential to cause
localized socio-economic impacts.
Medium
Effect has potential to
impact a portion of the
local population and could
trigger detectable socio-
economic disruption.
Medium
Effect has potential to
impact a portion of the
local population and
could trigger detectable
socio-economic
disruption.
High
Effect has the potential to
impact the local population
as a whole and triggering
major socio-economic
change that is outside the
range of normal variability.
Reversibility Medium
Negative impacts caused by this
effect can be reversed within 2
years with some government
restoration efforts or over a longer
period of time without government
intervention.
Medium
Negative impacts caused
by this effect can be
reversed within 2 years with
some government
restoration efforts or over a
longer period of time
without government
intervention.
Medium
Negative impacts caused
by this effect can be
reversed within 2 years
with some government
restoration efforts or over
a longer period of time
without government
intervention.
High
Negative impacts caused by
this effect are irreversible or
only reversible over an
extended period of time with
major government restoration
efforts.
Communications Low
Short term or no disruption of ICT
and/or communications or
disruption over isolated, non-
sensitive areas.
Low
Short term or no disruption
of ICT and/or
communications or
disruption over isolated,
non-sensitive areas.
Low
Short term or no disruption
of ICT and/or
communications or
disruption over isolated,
non-sensitive areas.
Medium
Moderate disruption, denial or
corruption of ICT and/or
communications over
portions of region or
community where service is
restored within 7 days.
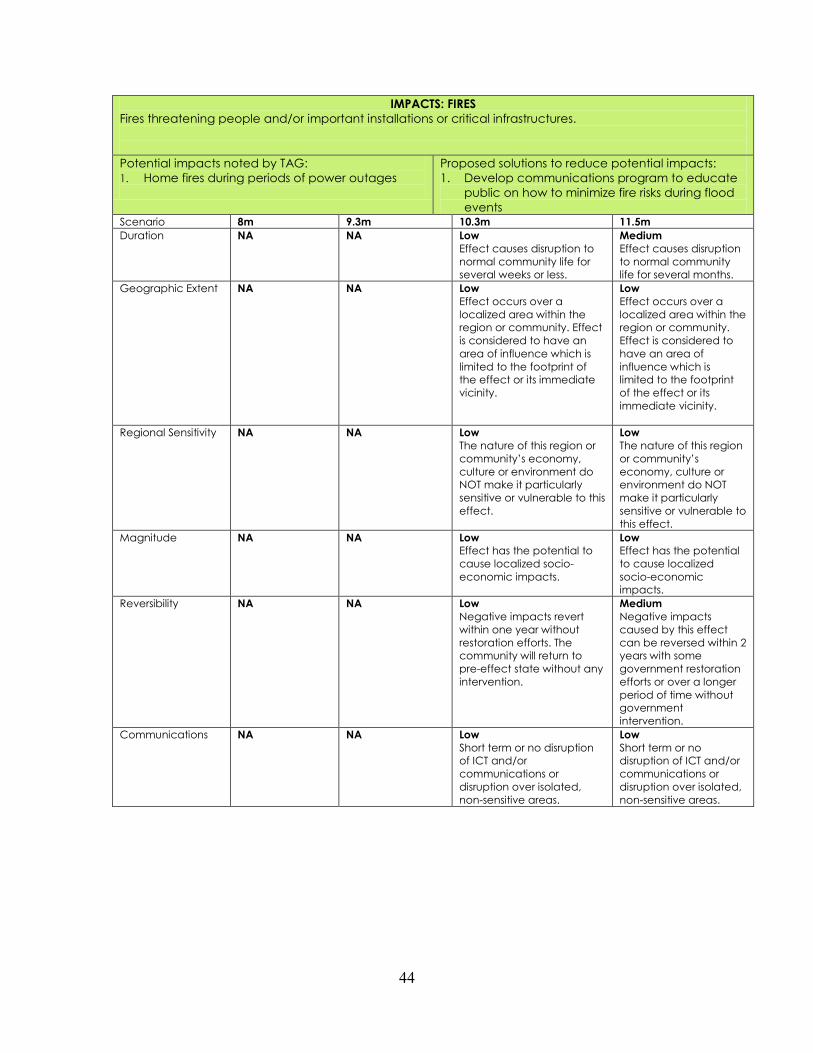
44
IMPACTS: FIRES
Fires threatening people and/or important installations or critical infrastructures.
Potential impacts noted by TAG:
1. Home fires during periods of power outages
Proposed solutions to reduce potential impacts:
1. Develop communications program to educate
public on how to minimize fire risks during flood
events Scenario 8m 9.3m 10.3m 11.5m
Duration NA NA Low
Effect causes disruption to
normal community life for
several weeks or less.
Medium
Effect causes disruption
to normal community
life for several months.
Geographic Extent NA NA Low
Effect occurs over a
localized area within the
region or community. Effect
is considered to have an
area of influence which is
limited to the footprint of
the effect or its immediate
vicinity.
Low
Effect occurs over a
localized area within the
region or community.
Effect is considered to
have an area of
influence which is
limited to the footprint
of the effect or its
immediate vicinity.
Regional Sensitivity NA NA Low
The nature of this region or
community’s economy,
culture or environment do
NOT make it particularly
sensitive or vulnerable to this
effect.
Low
The nature of this region
or community’s
economy, culture or
environment do NOT
make it particularly
sensitive or vulnerable to
this effect.
Magnitude NA NA Low
Effect has the potential to
cause localized socio-
economic impacts.
Low
Effect has the potential
to cause localized
socio-economic
impacts.
Reversibility NA NA Low
Negative impacts revert
within one year without
restoration efforts. The
community will return to
pre-effect state without any
intervention.
Medium
Negative impacts
caused by this effect
can be reversed within 2
years with some
government restoration
efforts or over a longer
period of time without
government
intervention.
Communications NA NA Low
Short term or no disruption
of ICT and/or
communications or
disruption over isolated,
non-sensitive areas.
Low
Short term or no
disruption of ICT and/or
communications or
disruption over isolated,
non-sensitive areas.

45
IMPACTS: FLOODING (Surface Flooding)
The effects of rises in water levels rendering parts of the community inaccessible or isolating certain sectors. Damage
to built infrastructure, business and dwellings is common.
Potential impacts noted by TAG: 1. Areas within the 8-11.5 m zone with
development on the ground or land use
opportunities in place ; Lewisville Rd area,
area east of Botsford to river Downtown -
parking lots, superstore area, Vision lands
2. Existing development – Backwater valve
issues; potential flooding at 1st floor or
possible second floor levels - property
damage…
3. While impacts grow with each scenario, the
biggest difference in impacts is experienced
between 8m and 9.3m scenario. Depending
on the location of a building / property and
its use, the impact could be severe.
4. Future development - areas within the 8-11.5
m zone with land use opportunities in place ;
Lewisville Rd area, area east of Botsford,
Downtown - parking lots, superstore
area,Vision lands
5. Potential damage or limited access to areas
of high public value
a. East End Boys & Girls Club pool;
b. sportsfields,
c. riverfront,
d. Heritage properties (95 Foundry, 40
Waterloo, 1 Factory and a few
properties located on Main Street)
e. Centennial Park beach ; Most
properties are located on higher
elevations (10 to 12m) which would
correspond to a 1:100 recurring
period in the year 2100
f. tree canopy
g. Rabbit Brook Trail,
h. Hall's Creek Trail,
i. Crowley Farm Rd.;
j. Salisbury RD Nature Park;
k. Mapleton Park
l. Main Plaza area (east Main Street
near Jones Lake)
6. Damage to existing tree cover during storm
events - without a tree management
program in place, additional risk is created
for damage to trees
7. Increased costs for stormwater management
8. Community sensitivity - affects development
decisions and risk management decisions for
landowners in flood prone areas
Proposed solutions to reduce potential impacts: EMO
1. EMO Plan - Engineering to work closely with the EMO team to address infrastructure
flood related issues
Parks
2. Mapping of urban tree canopy and data management system for public trees (GIS) ;
urban forest management plan; Monitor, structurally prune or remove trees at risk as
required
3. Develop a monitoring/ action plan for post storm parks & leisure infrastructure failure
4. Place new park and trail infrastructure at higher elevations
5. Develop LFPP (Land for Public Purposes) planning policies to prevent trails from being
situated in at risk locations
Zero net – reducing quantity of run-off
6. Additional landscaping/tree planting provisions (e.g. parking lot design)
7. Implementation of zero net policy – (Municipal Plan, Zoning By-law, Development
Standards)
Land Use in Flood prone areas:
8. Proposed 10.5m minimum habitable floor elevation in proposed Zoning By-law.
9. Resources (Urban Planning) - Developing new Municipal Plan policies and zoning
overlay regulation resources Need to develop a strategy on how to "handle" lands in
the most at risk areas;
10. Further review of how other jurisdiction are using overlay zoning; Need to better
understand the legal / financial implications
a. Existing buildings/uses and non-conformity
b. Urban design issues in the downtown
c. Land owner consultation
d. Draft new provisions for flood overlay zone
e. Inform land owners of potential risk / mitigate flood risk for new
development.
11. Heritage properties to be addressed under the overlay zoning regulations…may need
to create specific policies for heritage properties - may need to consult with heritage
staff and heritage board
Infrastructure design:
12. Design new infrastructure using recommended elevations and IDF curves - New IDF
curves to form basis of future design - Update design criteria manual and subdivision
guidelines
13. Retrofitting of existing sewer system - If completed in a systematic, planned advance
manner, the impact is likely minor. If completed as a reaction, the costs are likely
moderate or severe
14. As the City implements climate adaptation measures and/or policies such as zero net
increase (which means retention ponds). The City will need to increase operating
budgets and or capital budget to operate and eventually rebuild these facilities. -
Spread potential costs over several years via setting up of reserves, establishing
borrowing authority over several years and implementing infrastructure changes
required as new construction is performed now rather than retrofit in the future of
same areas.
15. Consider what other cities have done to address the stormwater management,
identify the priorities and related risks and inform stakeholders of such risks
16. Allow for higher flood elevations in future planning of transportation and essential
services
17. Discuss climate change impacts within context of Transportation Master Plan
Public Engagement/Communication
18. Economic development staff to stay informed of future environmental risks associated
with downtown development; Communicate and share current information with
developers as proposals are received for development in flood zone areas; Continue
to liaise with other City departments as a resource and channel of communication for
the development community;
19. Inform land owners of potential risk / mitigate flood risk for new development – waiver
form – public consultation processes in conjunction with development of new
floodplain policy-by-laws.

46
IMPACTS: FLOODING (Surface Flooding)
The effects of rises in water levels rendering parts of the community inaccessible or isolating certain sectors.
Damage to built infrastructure, business and dwellings is common. Risk Assessment
Scenarios
8m 9.3m 10.3m 11.5m
Duration Low
Effect causes disruption
to normal community
life for several weeks or
less.
Medium
Effect causes disruption to
normal community life for
several months.
High
Effect causes disruption
to normal community life
for more than 1 year.
High
Effect causes disruption to normal
community life for more than 1
year.
Geographic Extent Low
Effect occurs over a
localized area within
the region or
community. Effect is
considered to have an
area of influence which
is limited to the footprint
of the effect or its
immediate vicinity.
Medium
Effect occurs over a portion
of the region or community.
The effect is considered to
have an area of influence
which is limited to a portion of
the geographic area.
High
Effect occurs over an
extensive area within your
region or community. The
effect is considered to
have an area of
influence extending over
a large geographic area,
perhaps beyond the
community or region.
High
Effect occurs over an extensive
area within your region or
community. The effect is
considered to have an area of
influence extending over a large
geographic area, perhaps
beyond the community or region.
Regional Sensitivity Low
The nature of this region
or community’s
economy, culture or
environment do NOT
make it particularly
sensitive or vulnerable
to this effect.
High
The nature of this region of
community’s economy,
culture or environment make
it atypically sensitive or
vulnerable to this effect.
Some regional characteristics
could exacerbate the
negative consequences of
the effect.
High
The nature of this region
of community’s
economy, culture or
environment make it
atypically sensitive or
vulnerable to this effect.
Some regional
characteristics could
exacerbate the negative
consequences of the
effect.
High
The nature of this region of
community’s economy, culture or
environment make it atypically
sensitive or vulnerable to this
effect. Some regional
characteristics could exacerbate
the negative consequences of
the effect.
Magnitude Low
Effect has the potential
to cause localized
socio-economic
impacts.
Medium
Effect has the potential to
impact a portion of the local
population and could trigger
detectable socio-economic
disruption.
High
Effect has the potential to
impact the local
population as a whole
and triggering major
socio-economic change
that is outside the range
of normal variability.
High
Effect has the potential to impact
the local population as a whole
and triggering major socio-
economic change that is outside
the range of normal variability.
Reversibility Low
Negative impacts
revert within one year
without restoration
efforts. The community
will return to pre-effect
state without any
intervention.
Medium
Negative impacts caused by
this effect can be reversed
within 2 years with some
government restoration efforts
or over a longer period of
time without government
intervention.
High
Negative impacts caused
by this effect are
irreversible or only
reversible over an
extended period of time
with major government
restoration efforts.
High
Negative impacts caused by this
effect are irreversible or only
reversible over an extended
period of time with major
government restoration efforts.
Communications Low
Short term or no
disruption of ICT and/or
communications or
disruption over isolated,
non-sensitive areas.
Low
Short term or no disruption of
ICT and/or communications
or disruption over isolated,
non-sensitive areas.
Low
Short term or no disruption
of ICT and/or
communications or
disruption over isolated,
non-sensitive areas.
Low
Short term or no disruption of ICT
and/or communications or
disruption over isolated, non-
sensitive areas.

47
IMPACTS: POLLUTION/WATER/SOIL IMPACTS
Temporary, long-term or permanent contamination of the soil and/or water. Potential impacts noted by TAG:
1. Gas stations within 9.3m – design standards help to
mitigate risk
2. Land fill site protected by riprap and filtrated by
wetland – loss of wetland will result in more direct
seepage into river
3. Water/combined sewer pollution is assumed to be
diluted
4. Pollution will travel down river, however
pollution/debris will also be deposited from areas
downstream as well.
5. Buildings with chemical storage within surface flood
risk areas
6. Should verify if any transformers can be flooded as
these may contain oil which may escape in
environment causing concerns
7. Older Substations and transformer pads used less
environmentally friendly oils
Proposed solutions to reduce potential impacts:
1. Consultation with DoE to confirm nature of environmental
impacts and any proposed actions which can help mitigate
impacts
2. Ongoing monitoring of water quality levels associated with landfill
site – Study this area in greater detail
3. Ensure hazardous materials are stored in a safe location -
Ongoing monitoring and inventory of hazardous material sites,
with priority to locations within flood prone areas - Identify storage
areas and make modifications if necessary
4. Provide additional funding for the backwater valve replacement
program
5. Communication program with property owners/businesses
dealing with hazardous materials in vulnerable areas
6. Consult with NB Power to regarding potential impacts related to
rupturing of transformer pads and potential release of hazardous
oils
Scenario 8m 9.3m 10.3m 11.5m Duration NA NA Low
Effect causes disruption to
normal community life for
several weeks or less.
Medium
Effect causes disruption to normal
community life for several
months.
Geographic Extent NA NA Low
Effect occurs over a
localized area within the
region or community.
Effect is considered to
have an area of influence
which is limited to the
footprint of the effect or
its immediate vicinity.
Medium
Effect occurs over a portion of
the region or community. The
effect is considered to have an
area of influence which is limited
to a portion of the geographic
area.
Regional Sensitivity NA NA Low
The nature of this region or
community’s economy,
culture or environment do
NOT make it particularly
sensitive or vulnerable to
this effect.
Medium
The nature of this region or
community’s economy, culture or
environment make it moderately
sensitive or vulnerable to this
effect. Some regional
characteristics are vulnerable but
do not exacerbate the effect.
Magnitude NA NA Low
Effect has the potential to
cause localized socio-
economic impacts.
Medium
Effect has the potential to impact
a portion of the local population
and could trigger detectable
socio-economic disruption.
Reversibility NA NA Low
Negative impacts revert
within one year without
restoration efforts. The
community will return to
pre-effect state without
any intervention.
Medium
Negative impacts caused by this
effect can be reversed within 2
years with some government
restoration efforts or over a longer
period of time without
government intervention.
Communications NA NA Low
Short term or no disruption
of ICT and/or
communications or
disruption over isolated,
non-sensitive areas.
Low
Short term or no disruption of ICT
and/or communications or
disruption over isolated, non-
sensitive areas.

48
IMPACTS: Storm Surge
Storm surge is an offshore rise of water typically associated with a tropical cyclone. Storm surge is caused primarily
by high winds pushing on the ocean’s surface. The wind causes the water to pile up higher than the ordinary sea
level.
Potential Impacts Noted by TAG
1. Same types of impacts as flooding
Proposed solutions to reduce potential impacts
2. Same solutions as in flooding
Scenario 8m 9.3m 10.3m 10.5m Duration NA NA High
Effect causes disruption to
normal community life for
more than 1 year.
High
Effect causes disruption to
normal community life for
more than 1 year.
Geographic Extent NA NA High
Effect occurs over an
extensive area within your
region or community. The
effect is considered to have
an area of influence
extending over a large
geographic area, perhaps
beyond the community or
region.
High
Effect occurs over an
extensive area within your
region or community. The
effect is considered to
have an area of influence
extending over a large
geographic area,
perhaps beyond the
community or region.
Regional Sensitivity NA NA High
The nature of this region of
community’s economy,
culture or environment make
it atypically sensitive or
vulnerable to this effect. Some
regional characteristics could
exacerbate the negative
consequences of the effect.
High
The nature of this region of
community’s economy,
culture or environment
make it atypically
sensitive or vulnerable to
this effect. Some regional
characteristics could
exacerbate the negative
consequences of the
effect.
Magnitude NA NA High
Effect has the potential to
impact the local population
as a whole and triggering
major socio-economic
change that is outside the
range of normal variability.
High
Effect has the potential to
impact the local
population as a whole
and triggering major
socio-economic change
that is outside the range
of normal variability.
Reversibility NA NA High
Negative impacts caused by
this effect are irreversible or
only reversible over an
extended period of time with
major government restoration
efforts.
High
Negative impacts caused
by this effect are
irreversible or only
reversible over an
extended period of time
with major government
restoration efforts.
Communications NA NA Low
Short term or no disruption of
ICT and/or communications
or disruption over isolated,
non-sensitive areas.
Low
Short term or no disruption
of ICT and/or
communications or
disruption over isolated,
non-sensitive areas.

49
IMPACTS: Water/Sewage Contamination
The contamination of water supplies by the sewage or when the sewage system backs up. Potential impacts noted by TAG: 1. Urban water supply – no serious impacts noted; only potential issue could be a
water main break – distribution issues, as opposed to issues with
reservoir/treatment plant functionality – dam built to 1:100 yr. flood.
2. Areas where the wells are located and elevations are below 10.5m are
vulnerable by salt water intrusion or surface water intrusion
3. Sewer back up are the key issue for basements under elevation 10.5m (in 8m
storm); 11.5m (in 9.3m storm); 12.5 (in 10.3m storm) and 13.5(in 11.5m storm)
4. Without a backwater valve, basements are vulnerable to sewer back-up
impacts; important to keep in mind that 8m regular high tide today is 9m in the
future
5. Downtown is vulnerable as well as system will surcharge, so combined flows will
exit manhole (particularly during rain event) – the fix for this is not readily
available.
6. Issue is not just mess to clean-up but also fact that toilets are not functional until
system is restored. Means that businesses, restaurants, homes, facilities are not
fully functional during the event.
7. U de M affected in 9.3m scenario in terms of access to facilities, functionality,
then clean-up required.
8. High sensitivity due to nature of combined system
9. Clean up can take months, because of the extent of damage created
Proposed solutions to mitigate potential impacts
1. Add known well locations to maps , verify that
all wells are identified with Province;
2. Confirm whether any particular well locations
are at risk and if so, what type of mitigative
measures may assist;
3. Ongoing maintenance/monitoring of water
distribution system;
4. Confirmation of structural strength of any
bridges that support water distribution lines
(with DoT);
5. Assess risks associated with sewer back-ups
and develop adaptive measures short medium
and long range strategies;
6. Review locations for proposed combined
sewer overflow pumping stations – share info
with GMSC;
7. Raise elevations of mechanical and electrical
equipment in pumping stations above
projected flood level (10.5 m) Scenario 8m 9.3m 10.3m 11.5m
Duration Low
Effect causes disruption
to normal community life
for several weeks or less.
Medium
Effect causes disruption to
normal community life for
several months.
Medium
Effect causes disruption to
normal community life for
several months.
High
Effect causes disruption to
normal community life for more
than 1 year.
Geographic
Extent
Low
Effect occurs over a
localized area within the
region or community.
Effect is considered to
have an area of
influence which is limited
to the footprint of the
effect or its immediate
vicinity.
Medium
Effect occurs over a portion of
the region or community. The
effect is considered to have an
area of influence which is
limited to a portion of the
geographic area.
Medium
Effect occurs over a portion
of the region or community.
The effect is considered to
have an area of influence
which is limited to a portion of
the geographic area.
High
Effect occurs over an extensive
area within your region or
community. The effect is
considered to have an area of
influence extending over a
large geographic area,
perhaps beyond the
community or region.
Regional
Sensitivity
Medium
The nature of this region
or community’s
economy, culture or
environment make it
moderately sensitive or
vulnerable to this effect.
Some regional
characteristics are
vulnerable but do not
exacerbate the effect.
High
The nature of this region of
community’s economy, culture
or environment make it
atypically sensitive or vulnerable
to this effect. Some regional
characteristics could
exacerbate the negative
consequences of the effect.
High
The nature of this region of
community’s economy,
culture or environment make
it atypically sensitive or
vulnerable to this effect.
Some regional characteristics
could exacerbate the
negative consequences of
the effect.
High
The nature of this region of
community’s economy, culture
or environment make it
atypically sensitive or vulnerable
to this effect. Some regional
characteristics could
exacerbate the negative
consequences of the effect.
Magnitude Medium
Effect has the potential to
impact a portion of the
local population and
could trigger detectable
socio-economic
disruption.
Medium
Effect has the potential to
impact a portion of the local
population and could trigger
detectable socio-economic
disruption.
Medium
Effect has the potential to
impact a portion of the local
population and could trigger
detectable socio-economic
disruption.
High
Effect has the potential to
impact the local population as
a whole and triggering major
socio-economic change that is
outside the range of normal
variability.
Reversibility Low
Negative impacts revert
within one year without
restoration efforts. The
community will return to
pre-effect state without
any intervention.
Medium
Negative impacts caused by
this effect can be reversed
within 2 years with some
government restoration efforts
or over a longer period of time
without government
intervention.
Medium
Negative impacts caused by
this effect can be reversed
within 2 years with some
government restoration efforts
or over a longer period of
time without government
intervention.
High
Negative impacts caused by
this effect are irreversible or only
reversible over an extended
period of time with major
government restoration efforts.
Communicat
ions
Low
Short term or no disruption
of ICT and/or
communications or
disruption over isolated,
non-sensitive areas.
Low
Short term or no disruption of ICT
and/or communications or
disruption over isolated, non-
sensitive areas.
Low
Short term or no disruption of
ICT and/or communications
or disruption over isolated,
non-sensitive areas.
Low
Short term or no disruption of ICT
and/or communications or
disruption over isolated, non-
sensitive areas.
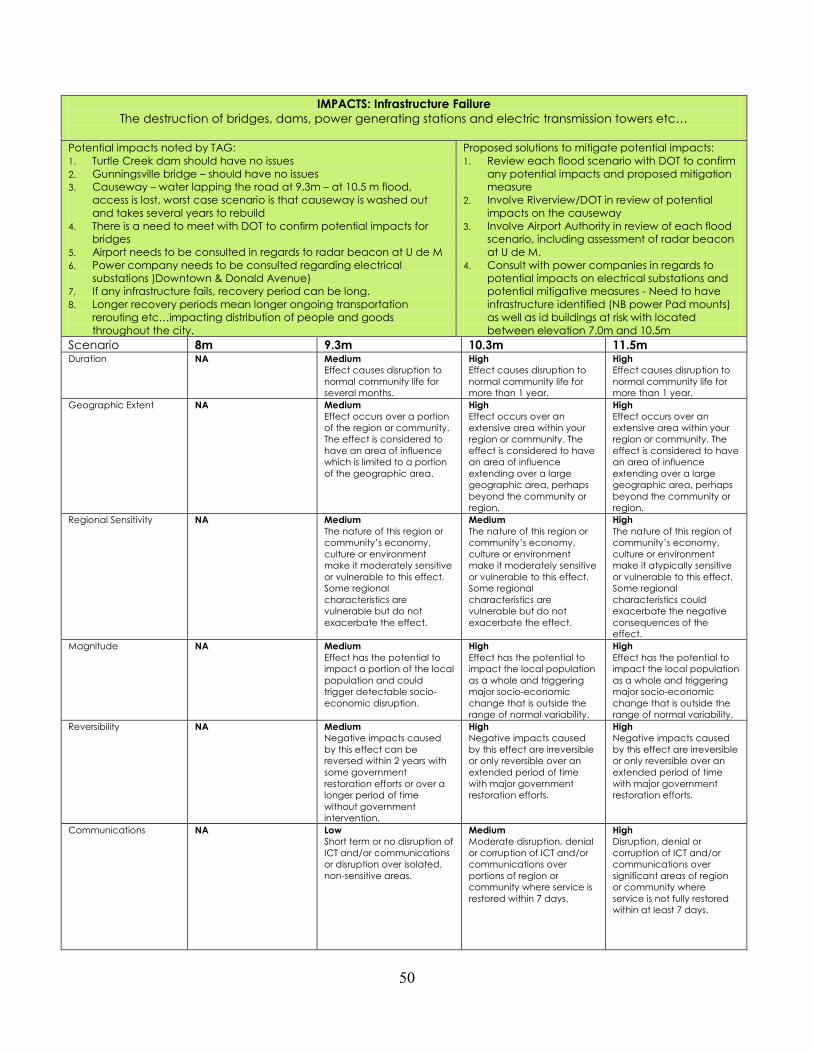
50
IMPACTS: Infrastructure Failure
The destruction of bridges, dams, power generating stations and electric transmission towers etc…
Potential impacts noted by TAG:
1. Turtle Creek dam should have no issues
2. Gunningsville bridge – should have no issues
3. Causeway – water lapping the road at 9.3m – at 10.5 m flood,
access is lost, worst case scenario is that causeway is washed out
and takes several years to rebuild
4. There is a need to meet with DOT to confirm potential impacts for
bridges
5. Airport needs to be consulted in regards to radar beacon at U de M
6. Power company needs to be consulted regarding electrical
substations )Downtown & Donald Avenue)
7. If any infrastructure fails, recovery period can be long.
8. Longer recovery periods mean longer ongoing transportation
rerouting etc…impacting distribution of people and goods
throughout the city.
Proposed solutions to mitigate potential impacts:
1. Review each flood scenario with DOT to confirm
any potential impacts and proposed mitigation
measure
2. Involve Riverview/DOT in review of potential
impacts on the causeway
3. Involve Airport Authority in review of each flood
scenario, including assessment of radar beacon
at U de M.
4. Consult with power companies in regards to
potential impacts on electrical substations and
potential mitigative measures - Need to have
infrastructure identified (NB power Pad mounts)
as well as id buildings at risk with located
between elevation 7.0m and 10.5m
Scenario 8m 9.3m 10.3m 11.5m Duration NA Medium
Effect causes disruption to
normal community life for
several months.
High
Effect causes disruption to
normal community life for
more than 1 year.
High
Effect causes disruption to
normal community life for
more than 1 year.
Geographic Extent NA Medium
Effect occurs over a portion
of the region or community.
The effect is considered to
have an area of influence
which is limited to a portion
of the geographic area.
High
Effect occurs over an
extensive area within your
region or community. The
effect is considered to have
an area of influence
extending over a large
geographic area, perhaps
beyond the community or
region.
High
Effect occurs over an
extensive area within your
region or community. The
effect is considered to have
an area of influence
extending over a large
geographic area, perhaps
beyond the community or
region.
Regional Sensitivity NA Medium
The nature of this region or
community’s economy,
culture or environment
make it moderately sensitive
or vulnerable to this effect.
Some regional
characteristics are
vulnerable but do not
exacerbate the effect.
Medium
The nature of this region or
community’s economy,
culture or environment
make it moderately sensitive
or vulnerable to this effect.
Some regional
characteristics are
vulnerable but do not
exacerbate the effect.
High
The nature of this region of
community’s economy,
culture or environment
make it atypically sensitive
or vulnerable to this effect.
Some regional
characteristics could
exacerbate the negative
consequences of the
effect.
Magnitude NA Medium
Effect has the potential to
impact a portion of the local
population and could
trigger detectable socio-
economic disruption.
High
Effect has the potential to
impact the local population
as a whole and triggering
major socio-economic
change that is outside the
range of normal variability.
High
Effect has the potential to
impact the local population
as a whole and triggering
major socio-economic
change that is outside the
range of normal variability.
Reversibility NA Medium
Negative impacts caused
by this effect can be
reversed within 2 years with
some government
restoration efforts or over a
longer period of time
without government
intervention.
High
Negative impacts caused
by this effect are irreversible
or only reversible over an
extended period of time
with major government
restoration efforts.
High
Negative impacts caused
by this effect are irreversible
or only reversible over an
extended period of time
with major government
restoration efforts.
Communications NA Low
Short term or no disruption of
ICT and/or communications
or disruption over isolated,
non-sensitive areas.
Medium
Moderate disruption, denial
or corruption of ICT and/or
communications over
portions of region or
community where service is
restored within 7 days.
High
Disruption, denial or
corruption of ICT and/or
communications over
significant areas of region
or community where
service is not fully restored
within at least 7 days.
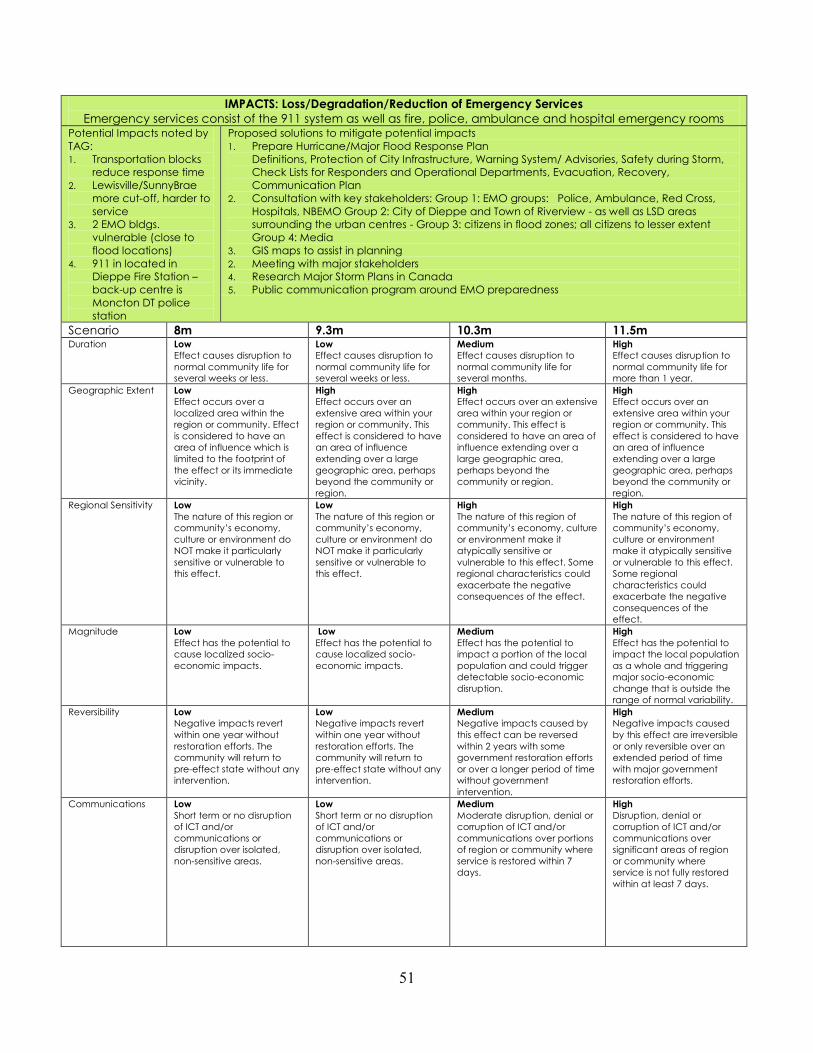
51
IMPACTS: Loss/Degradation/Reduction of Emergency Services
Emergency services consist of the 911 system as well as fire, police, ambulance and hospital emergency rooms Potential Impacts noted by
TAG:
1. Transportation blocks
reduce response time
2. Lewisville/SunnyBrae
more cut-off, harder to
service
3. 2 EMO bldgs.
vulnerable (close to
flood locations)
4. 911 in located in
Dieppe Fire Station –
back-up centre is
Moncton DT police
station
Proposed solutions to mitigate potential impacts
1. Prepare Hurricane/Major Flood Response Plan
Definitions, Protection of City Infrastructure, Warning System/ Advisories, Safety during Storm,
Check Lists for Responders and Operational Departments, Evacuation, Recovery,
Communication Plan
2. Consultation with key stakeholders: Group 1: EMO groups: Police, Ambulance, Red Cross,
Hospitals, NBEMO Group 2: City of Dieppe and Town of Riverview - as well as LSD areas
surrounding the urban centres - Group 3: citizens in flood zones; all citizens to lesser extent
Group 4: Media
3. GIS maps to assist in planning
2. Meeting with major stakeholders
4. Research Major Storm Plans in Canada
5. Public communication program around EMO preparedness
Scenario 8m 9.3m 10.3m 11.5m Duration Low
Effect causes disruption to
normal community life for
several weeks or less.
Low
Effect causes disruption to
normal community life for
several weeks or less.
Medium
Effect causes disruption to
normal community life for
several months.
High
Effect causes disruption to
normal community life for
more than 1 year.
Geographic Extent Low
Effect occurs over a
localized area within the
region or community. Effect
is considered to have an
area of influence which is
limited to the footprint of
the effect or its immediate
vicinity.
High
Effect occurs over an
extensive area within your
region or community. This
effect is considered to have
an area of influence
extending over a large
geographic area, perhaps
beyond the community or
region.
High
Effect occurs over an extensive
area within your region or
community. This effect is
considered to have an area of
influence extending over a
large geographic area,
perhaps beyond the
community or region.
High
Effect occurs over an
extensive area within your
region or community. This
effect is considered to have
an area of influence
extending over a large
geographic area, perhaps
beyond the community or
region.
Regional Sensitivity Low
The nature of this region or
community’s economy,
culture or environment do
NOT make it particularly
sensitive or vulnerable to
this effect.
Low
The nature of this region or
community’s economy,
culture or environment do
NOT make it particularly
sensitive or vulnerable to
this effect.
High
The nature of this region of
community’s economy, culture
or environment make it
atypically sensitive or
vulnerable to this effect. Some
regional characteristics could
exacerbate the negative
consequences of the effect.
High
The nature of this region of
community’s economy,
culture or environment
make it atypically sensitive
or vulnerable to this effect.
Some regional
characteristics could
exacerbate the negative
consequences of the
effect.
Magnitude Low
Effect has the potential to
cause localized socio-
economic impacts.
Low
Effect has the potential to
cause localized socio-
economic impacts.
Medium
Effect has the potential to
impact a portion of the local
population and could trigger
detectable socio-economic
disruption.
High
Effect has the potential to
impact the local population
as a whole and triggering
major socio-economic
change that is outside the
range of normal variability.
Reversibility Low
Negative impacts revert
within one year without
restoration efforts. The
community will return to
pre-effect state without any
intervention.
Low
Negative impacts revert
within one year without
restoration efforts. The
community will return to
pre-effect state without any
intervention.
Medium
Negative impacts caused by
this effect can be reversed
within 2 years with some
government restoration efforts
or over a longer period of time
without government
intervention.
High
Negative impacts caused
by this effect are irreversible
or only reversible over an
extended period of time
with major government
restoration efforts.
Communications Low
Short term or no disruption
of ICT and/or
communications or
disruption over isolated,
non-sensitive areas.
Low
Short term or no disruption
of ICT and/or
communications or
disruption over isolated,
non-sensitive areas.
Medium
Moderate disruption, denial or
corruption of ICT and/or
communications over portions
of region or community where
service is restored within 7
days.
High
Disruption, denial or
corruption of ICT and/or
communications over
significant areas of region
or community where
service is not fully restored
within at least 7 days.
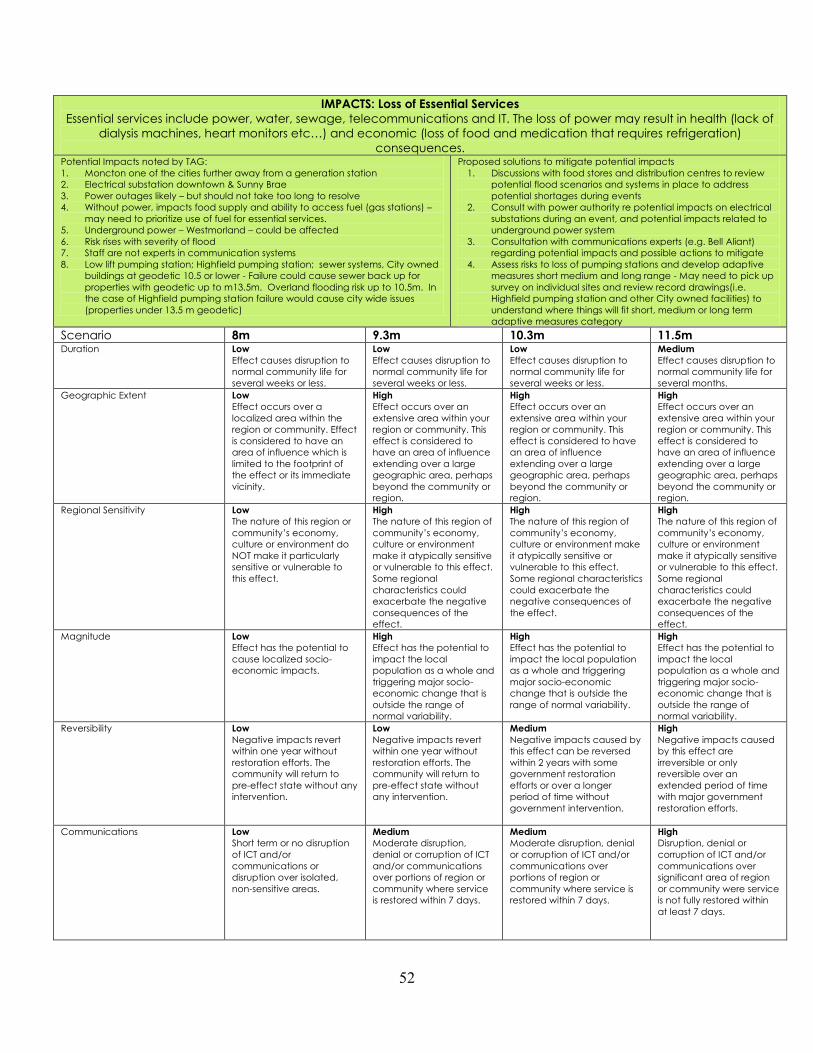
52
IMPACTS: Loss of Essential Services
Essential services include power, water, sewage, telecommunications and IT. The loss of power may result in health (lack of
dialysis machines, heart monitors etc…) and economic (loss of food and medication that requires refrigeration)
consequences. Potential Impacts noted by TAG:
1. Moncton one of the cities further away from a generation station
2. Electrical substation downtown & Sunny Brae
3. Power outages likely – but should not take too long to resolve
4. Without power, impacts food supply and ability to access fuel (gas stations) –
may need to prioritize use of fuel for essential services.
5. Underground power – Westmorland – could be affected
6. Risk rises with severity of flood
7. Staff are not experts in communication systems
8. Low lift pumping station; Highfield pumping station; sewer systems, City owned
buildings at geodetic 10.5 or lower - Failure could cause sewer back up for
properties with geodetic up to m13.5m. Overland flooding risk up to 10.5m. In
the case of Highfield pumping station failure would cause city wide issues
(properties under 13.5 m geodetic)
Proposed solutions to mitigate potential impacts
1. Discussions with food stores and distribution centres to review
potential flood scenarios and systems in place to address
potential shortages during events
2. Consult with power authority re potential impacts on electrical
substations during an event, and potential impacts related to
underground power system
3. Consultation with communications experts (e.g. Bell Aliant)
regarding potential impacts and possible actions to mitigate
4. Assess risks to loss of pumping stations and develop adaptive
measures short medium and long range - May need to pick up
survey on individual sites and review record drawings(i.e.
Highfield pumping station and other City owned facilities) to
understand where things will fit short, medium or long term
adaptive measures category
Scenario 8m 9.3m 10.3m 11.5m Duration Low
Effect causes disruption to
normal community life for
several weeks or less.
Low
Effect causes disruption to
normal community life for
several weeks or less.
Low
Effect causes disruption to
normal community life for
several weeks or less.
Medium
Effect causes disruption to
normal community life for
several months.
Geographic Extent Low
Effect occurs over a
localized area within the
region or community. Effect
is considered to have an
area of influence which is
limited to the footprint of
the effect or its immediate
vicinity.
High
Effect occurs over an
extensive area within your
region or community. This
effect is considered to
have an area of influence
extending over a large
geographic area, perhaps
beyond the community or
region.
High
Effect occurs over an
extensive area within your
region or community. This
effect is considered to have
an area of influence
extending over a large
geographic area, perhaps
beyond the community or
region.
High
Effect occurs over an
extensive area within your
region or community. This
effect is considered to
have an area of influence
extending over a large
geographic area, perhaps
beyond the community or
region.
Regional Sensitivity Low
The nature of this region or
community’s economy,
culture or environment do
NOT make it particularly
sensitive or vulnerable to
this effect.
High
The nature of this region of
community’s economy,
culture or environment
make it atypically sensitive
or vulnerable to this effect.
Some regional
characteristics could
exacerbate the negative
consequences of the
effect.
High
The nature of this region of
community’s economy,
culture or environment make
it atypically sensitive or
vulnerable to this effect.
Some regional characteristics
could exacerbate the
negative consequences of
the effect.
High
The nature of this region of
community’s economy,
culture or environment
make it atypically sensitive
or vulnerable to this effect.
Some regional
characteristics could
exacerbate the negative
consequences of the
effect.
Magnitude Low
Effect has the potential to
cause localized socio-
economic impacts.
High
Effect has the potential to
impact the local
population as a whole and
triggering major socio-
economic change that is
outside the range of
normal variability.
High
Effect has the potential to
impact the local population
as a whole and triggering
major socio-economic
change that is outside the
range of normal variability.
High
Effect has the potential to
impact the local
population as a whole and
triggering major socio-
economic change that is
outside the range of
normal variability.
Reversibility Low
Negative impacts revert
within one year without
restoration efforts. The
community will return to
pre-effect state without any
intervention.
Low
Negative impacts revert
within one year without
restoration efforts. The
community will return to
pre-effect state without
any intervention.
Medium
Negative impacts caused by
this effect can be reversed
within 2 years with some
government restoration
efforts or over a longer
period of time without
government intervention.
High
Negative impacts caused
by this effect are
irreversible or only
reversible over an
extended period of time
with major government
restoration efforts.
Communications Low
Short term or no disruption
of ICT and/or
communications or
disruption over isolated,
non-sensitive areas.
Medium
Moderate disruption,
denial or corruption of ICT
and/or communications
over portions of region or
community where service
is restored within 7 days.
Medium
Moderate disruption, denial
or corruption of ICT and/or
communications over
portions of region or
community where service is
restored within 7 days.
High
Disruption, denial or
corruption of ICT and/or
communications over
significant area of region
or community were service
is not fully restored within
at least 7 days.

53
IMPACTS: Loss of Transportation Links
Includes loss of structures and facilities such as airports and ports as well as loss or blockage of shipping channels. Potential Impacts noted by TAG:
1. Airport links should only experience short term issues from
storm activity
Proposed solutions to mitigate potential impacts
1. Consultation with Airport Authority to confirm potential
impacts and proposed actions to mitigate risk Scenario 8m 9.3m 10.3m 11.5m Duration Low
Effect causes disruption
to normal community life
for several weeks or less.
Low
Effect causes disruption to
normal community life for
several weeks or less.
Low
Effect causes disruption
to normal community life
for several weeks or less.
Medium
Effect causes disruption to
normal community life for
several months. Geographic Extent Low
Effect occurs over a
localized area within the
region or community.
Effect is considered to
have an area of
influence which is limited
to the footprint of the
effect or its immediate
vicinity.
Low
Effect occurs over a
localized area within the
region or community. Effect
is considered to have an
area of influence which is
limited to the footprint of
the effect or its immediate
vicinity.
Low
Effect occurs over a
localized area within the
region or community.
Effect is considered to
have an area of
influence which is limited
to the footprint of the
effect or its immediate
vicinity.
Medium
Effect occurs over a
portion of the region or
community. The effect is
considered to have an
area of influence which is
limited to a portion of the
geographic area.
Regional Sensitivity Low
The nature of this region
or community’s
economy, culture or
environment do NOT
make it particularly
sensitive or vulnerable to
this effect.
Low
The nature of this region or
community’s economy,
culture or environment do
NOT make it particularly
sensitive or vulnerable to
this effect.
Low
The nature of this region
or community’s
economy, culture or
environment do NOT
make it particularly
sensitive or vulnerable to
this effect.
Medium
The nature of this region
or community’s economy,
culture or environment
make it moderately
sensitive or vulnerable to
this effect. Some regional
characteristics are
vulnerable but do not
exacerbate the effect. Magnitude Low
Effect has the potential
to cause localized socio-
economic impacts.
Low
Effect has the potential to
cause localized socio-
economic impacts.
Low
Effect has the potential
to cause localized socio-
economic impacts.
Medium
Effect has the potential to
impact a portion of the
local population and
could trigger detectable
socio-economic
disruption. Reversibility Low
Negative impacts revert
within one year without
restoration efforts. The
community will return to
pre-effect state without
any intervention.
Low
Negative impacts revert
within one year without
restoration efforts. The
community will return to
pre-effect state without any
intervention.
Low
Negative impacts revert
within one year without
restoration efforts. The
community will return to
pre-effect state without
any intervention.
Medium
Negative impacts caused
by this effect can be
reversed within 2 years
with some government
restoration efforts or over
a longer period of time
without government
intervention. Communications Low
Short term or no
disruption of ICT and/or
communications or
disruption over isolated,
non-sensitive areas.
Low
Short term or no disruption
of ICT and/or
communications or
disruption over isolated,
non-sensitive areas.
Low
Short term or no
disruption of ICT and/or
communications or
disruption over isolated,
non-sensitive areas.
Medium
Moderate disruption,
denial or corruption of ICT
and/or communications
over portions of region or
community where service
is restored within 7 days.
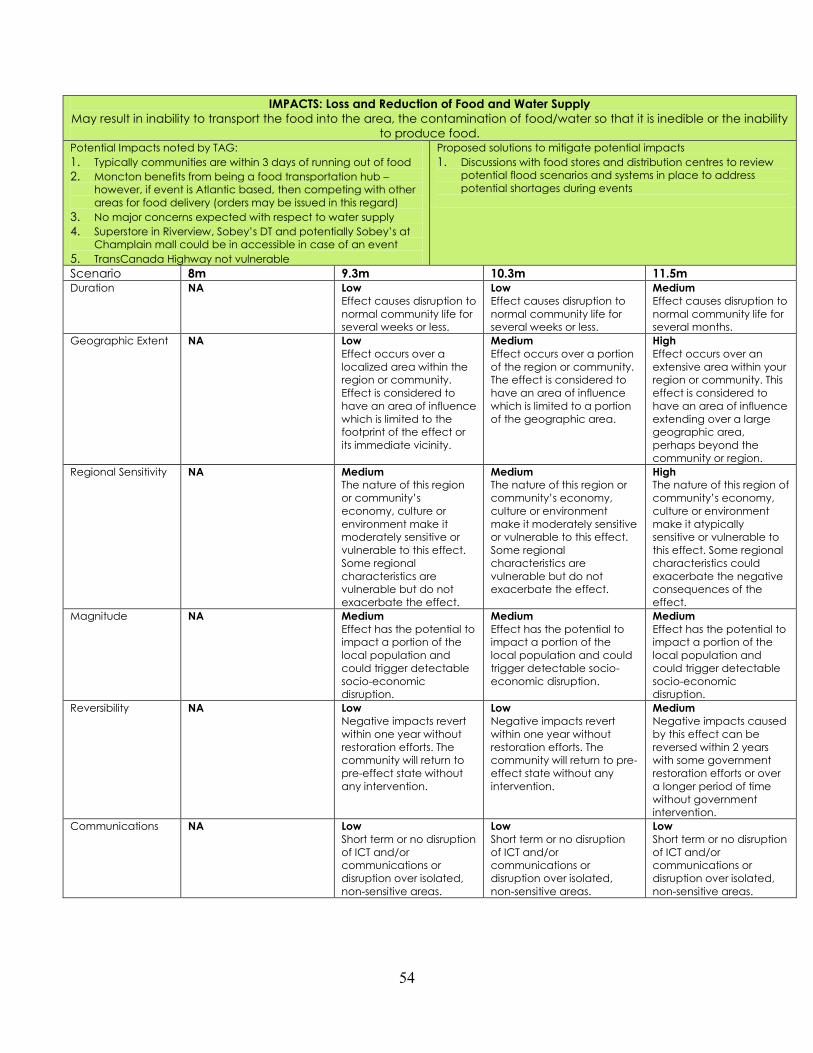
54
IMPACTS: Loss and Reduction of Food and Water Supply
May result in inability to transport the food into the area, the contamination of food/water so that it is inedible or the inability
to produce food. Potential Impacts noted by TAG:
1. Typically communities are within 3 days of running out of food
2. Moncton benefits from being a food transportation hub –
however, if event is Atlantic based, then competing with other
areas for food delivery (orders may be issued in this regard)
3. No major concerns expected with respect to water supply
4. Superstore in Riverview, Sobey’s DT and potentially Sobey’s at
Champlain mall could be in accessible in case of an event
5. TransCanada Highway not vulnerable
Proposed solutions to mitigate potential impacts
1. Discussions with food stores and distribution centres to review
potential flood scenarios and systems in place to address
potential shortages during events
Scenario 8m 9.3m 10.3m 11.5m Duration NA Low
Effect causes disruption to
normal community life for
several weeks or less.
Low
Effect causes disruption to
normal community life for
several weeks or less.
Medium
Effect causes disruption to
normal community life for
several months.
Geographic Extent NA
Low
Effect occurs over a
localized area within the
region or community.
Effect is considered to
have an area of influence
which is limited to the
footprint of the effect or
its immediate vicinity.
Medium
Effect occurs over a portion
of the region or community.
The effect is considered to
have an area of influence
which is limited to a portion
of the geographic area.
High
Effect occurs over an
extensive area within your
region or community. This
effect is considered to
have an area of influence
extending over a large
geographic area,
perhaps beyond the
community or region.
Regional Sensitivity NA Medium
The nature of this region
or community’s
economy, culture or
environment make it
moderately sensitive or
vulnerable to this effect.
Some regional
characteristics are
vulnerable but do not
exacerbate the effect.
Medium
The nature of this region or
community’s economy,
culture or environment
make it moderately sensitive
or vulnerable to this effect.
Some regional
characteristics are
vulnerable but do not
exacerbate the effect.
High
The nature of this region of
community’s economy,
culture or environment
make it atypically
sensitive or vulnerable to
this effect. Some regional
characteristics could
exacerbate the negative
consequences of the
effect.
Magnitude NA Medium
Effect has the potential to
impact a portion of the
local population and
could trigger detectable
socio-economic
disruption.
Medium
Effect has the potential to
impact a portion of the
local population and could
trigger detectable socio-
economic disruption.
Medium
Effect has the potential to
impact a portion of the
local population and
could trigger detectable
socio-economic
disruption.
Reversibility NA Low
Negative impacts revert
within one year without
restoration efforts. The
community will return to
pre-effect state without
any intervention.
Low
Negative impacts revert
within one year without
restoration efforts. The
community will return to pre-
effect state without any
intervention.
Medium
Negative impacts caused
by this effect can be
reversed within 2 years
with some government
restoration efforts or over
a longer period of time
without government
intervention.
Communications NA Low
Short term or no disruption
of ICT and/or
communications or
disruption over isolated,
non-sensitive areas.
Low
Short term or no disruption
of ICT and/or
communications or
disruption over isolated,
non-sensitive areas.
Low
Short term or no disruption
of ICT and/or
communications or
disruption over isolated,
non-sensitive areas.

55
IMPACTS: Road Closure/Route Denial
Includes the closure of routes (roads, rail, etc…) by permanent means such as having been destroyed or for extended
periods of time . Potential Impacts noted by TAG
- Impact severity rises with severity of flooding
- CN links should only experience short term issues from storm activity
- Codiac Transit services could be delayed significantly during storm activities
- Land freight transport should experience short term issues from storm activities
- Traffic signals:
Freeway:
a. Wheeler at Botsford St / Lewisville Rd (9.5)
Arterial Roads
b. Main St @ Super Store/Chateau Moncton (9.5)
c. Main St @ Route 15 (9.5)
d. Elmwood at Lewisville Rd (9.5)
e. Morton Ave. @ Université/Crawley Farm Rd. (9.5)
f. Assomption Blvd @ Westmorland St. (9.5)
g. Assomption Blvd @ Lutz St. (9.5)
h. Assomption Blvd @ Foundry (9.5)
i. Lewisville Rd at Shediac Rd. (10.5)
j. Assomption at Vaughan Harvey Blvd 11.5
Traffic Signal malfunctioning or not working. Risk of possible collisions if traffic continues utilizing the streets.
Fire department will lose functionality of controlling signals and will need to reduce speed through
intersections. Any flooding beyond elevation noted, the probability of traffic signals not functioning is very
high. The impact could be severe if traffic continues to utilize the intersections; however, if intersections are
not accessible, impacts are minor.
Freeways:
a. Wheeler Blvd - from Main Street including east traffic circle to approximately 400m beyond
Connaught Ave. (9.5)
b. Wheeler Blvd - 200 m section between Connaught Ave and Mapleton Rd. (10.5)
c. 1) Wheeler Blvd - 300 m section between Connaught Ave and Mapleton Rd. (11.5)
This entire section of Wheeler Blvd. will not be accessible for all type of vehicles during a flooding event
noted by elevation. The impact could be very severe for emergency services. East side of Moncton
and Dieppe will not be easily accessible from central Moncton. Presently Wheeler carries
approximately 30,000 vehicles per day. Diverting this amount of traffic to other surrounding streets in
Moncton will cause significant delays or event grid locks.
d. Wheeler Blvd - West traffic Circle.; West Traffic Circle will not be accessible for all type of vehicles
during a 9.25 m flooding event. Riverview and Salisbury Rd will not be accessible from the traffic
circle. (9.5)
Arterials:
a. Main Street between King Street and Dieppe(9.5)
b. Assomption Blvd between Main St. and Albert Street(9.5)
c. Vaughan Harvey Blvd between Assomption Blvd to intersection into Sobeys. (9.5) Assomption and
Vaughan Harvey generate on average 40,000 vehicles per day and traffic using these streets will
be diverted to Albert Street and Foundry Street. These streets are not designed to accommodate
an extra 40,000 vehicles per day. These streets would become grid lock.
d. Morton Ave. at the intersection of Crawley Farm Rd / Université (9.5) Morton Ave. generates on
average 20,000. Traffic would be diverted to other street and could increase delays significantly.
e. Botsford St. at Wheeler Blvd / Lewisville Rd. interesction. (9.5) Botsford and Lewisville Rd
generate on average 13,000 vehicles per day and traffic will require another location to access
east Moncton.
f. Lewisville Rd. from Wheeler to Germaine St. Lewisville Rd, generates on average 20,000 vehicles
per day and traffic using this street will be diverted elsewhere while creating more congestion.
(9.5)
g. Lewisville Rd from Germain to Pleasant and Shediac Rd to Dieppe (10.5) Lewisville Rd,
generates on average 20,000 vehicles per day and traffic using this street will be diverted
elsewhere while creating more congestion.
h. Main Street from Hillcrest to MacWilliams. (10.5) Main Street generates on average 15,000
vehicles per day and would need to be diverted thru west end, residential street.
i. Various sections of Assomption Blvd. (10.5)
j. Section of Vaughan Harvey Blvd near Assomption Blvd. north side (10.5 ) Assomption and
Vaughan Harvey generate on average 40,000 vehicles per day and traffic using these street will
be diverted to Albert Street and Foundry Street. These streets are not designed to accommodate
an extra 40,000 vehicles per day. These streets would become grid lock.
k. Main St. from Alma to Church St.10.5 Main Street between Alma and Church St. generates on
average 13,000 Vehicles per day
Proposed solutions to mitigate potential
impacts:
1. Consultation with CN and VIA Rail to
confirm any potential impacts and
proposed actions to mitigate
2. Codiac Transpo to review potential
impacts and mitigation actions.
3. Consultation with Atlantic Trucking
Association to confirm impacts and
proposed actions to mitigate risk
4. Maintain existing folded all-way
stops in order to control traffic during
impact. Could raise controller
cabinets to elevation 11.5. Down
side would be accessing cabinets
for maintenance. Cost to raise each
cabinet would be approximately
$20,000.
5. Raising/retrofitting:
a. Nothing can be done to
mitigate impacts on
Wheeler, other than to
raise Wheeler or realign it
to avoid the area. To
raise or divert Wheeler
could cost close to 1/2 a
billion dollars.
b. Change the West Traffic
Circle to overhead
interchange.
c. Main Street - Nothing can
be done for this street.
Raising Main in certain
parts est. $45 million
d. Vaughan Harvey Blvd -
Consider building a
bridge over CN Rail in the
future approximate cost
of $20 Million.
e. Morton Ave. - Build
overpass to access east
Moncton. Consider
building a bridge for
Morton Ave over
Université Ave/Crawley
Farm Rd. approximate
cost of $15 million.
f. Botsford St. and Lewisville
Rd. consider abandoning
both streets.
g. Raise Donald Ave and
abandon Clement
Cormier and Lutz St.
Raising Donald Ave would
cost approximately $2
million.
h. Raise the intersection of
Lewisville Rd at Shediac
Rd. Cost to raise Lewisville
Rd would be
approximately $2 million ,
approximately $10 million
at 10.5m flood scenario
i. Assomption and Vaughan
Harvey would need to be
raised. $30 million for
each street
j. Raise Foundry Street -
Cost to raise Foundry
Street would be
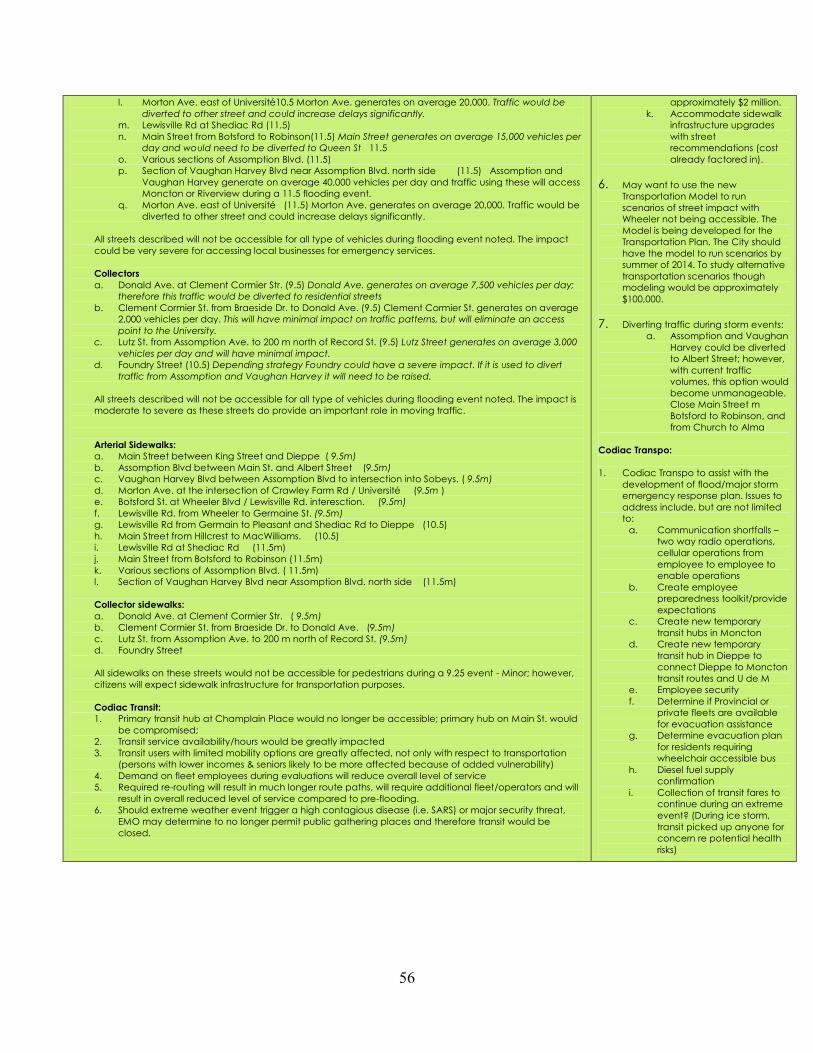
56
l. Morton Ave. east of Université10.5 Morton Ave. generates on average 20,000. Traffic would be
diverted to other street and could increase delays significantly.
m. Lewisville Rd at Shediac Rd (11.5)
n. Main Street from Botsford to Robinson(11.5) Main Street generates on average 15,000 vehicles per
day and would need to be diverted to Queen St 11.5
o. Various sections of Assomption Blvd. (11.5)
p. Section of Vaughan Harvey Blvd near Assomption Blvd. north side (11.5) Assomption and
Vaughan Harvey generate on average 40,000 vehicles per day and traffic using these will access
Moncton or Riverview during a 11.5 flooding event.
q. Morton Ave. east of Université (11.5) Morton Ave. generates on average 20,000. Traffic would be
diverted to other street and could increase delays significantly.
All streets described will not be accessible for all type of vehicles during flooding event noted. The impact
could be very severe for accessing local businesses for emergency services.
Collectors
a. Donald Ave. at Clement Cormier Str. (9.5) Donald Ave. generates on average 7,500 vehicles per day;
therefore this traffic would be diverted to residential streets
b. Clement Cormier St. from Braeside Dr. to Donald Ave. (9.5) Clement Cormier St. generates on average
2,000 vehicles per day. This will have minimal impact on traffic patterns, but will eliminate an access
point to the University.
c. Lutz St. from Assomption Ave. to 200 m north of Record St. (9.5) Lutz Street generates on average 3,000
vehicles per day and will have minimal impact.
d. Foundry Street (10.5) Depending strategy Foundry could have a severe impact. If it is used to divert
traffic from Assomption and Vaughan Harvey it will need to be raised.
All streets described will not be accessible for all type of vehicles during flooding event noted. The impact is
moderate to severe as these streets do provide an important role in moving traffic.
Arterial Sidewalks:
a. Main Street between King Street and Dieppe ( 9.5m)
b. Assomption Blvd between Main St. and Albert Street (9.5m)
c. Vaughan Harvey Blvd between Assomption Blvd to intersection into Sobeys. ( 9.5m)
d. Morton Ave. at the intersection of Crawley Farm Rd / Université (9.5m )
e. Botsford St. at Wheeler Blvd / Lewisville Rd. interesction. (9.5m)
f. Lewisville Rd. from Wheeler to Germaine St. (9.5m)
g. Lewisville Rd from Germain to Pleasant and Shediac Rd to Dieppe (10.5)
h. Main Street from Hillcrest to MacWilliams. (10.5)
i. Lewisville Rd at Shediac Rd (11.5m)
j. Main Street from Botsford to Robinson (11.5m)
k. Various sections of Assomption Blvd. ( 11.5m)
l. Section of Vaughan Harvey Blvd near Assomption Blvd. north side (11.5m)
Collector sidewalks:
a. Donald Ave. at Clement Cormier Str. ( 9.5m)
b. Clement Cormier St. from Braeside Dr. to Donald Ave. (9.5m)
c. Lutz St. from Assomption Ave. to 200 m north of Record St. (9.5m)
d. Foundry Street
All sidewalks on these streets would not be accessible for pedestrians during a 9.25 event - Minor; however,
citizens will expect sidewalk infrastructure for transportation purposes.
Codiac Transit:
1. Primary transit hub at Champlain Place would no longer be accessible; primary hub on Main St. would
be compromised;
2. Transit service availability/hours would be greatly impacted
3. Transit users with limited mobility options are greatly affected, not only with respect to transportation
(persons with lower incomes & seniors likely to be more affected because of added vulnerability)
4. Demand on fleet employees during evaluations will reduce overall level of service
5. Required re-routing will result in much longer route paths, will require additional fleet/operators and will
result in overall reduced level of service compared to pre-flooding.
6. Should extreme weather event trigger a high contagious disease (i.e. SARS) or major security threat,
EMO may determine to no longer permit public gathering places and therefore transit would be
closed.
approximately $2 million.
k. Accommodate sidewalk
infrastructure upgrades
with street
recommendations (cost
already factored in).
6. May want to use the new
Transportation Model to run
scenarios of street impact with
Wheeler not being accessible. The
Model is being developed for the
Transportation Plan. The City should
have the model to run scenarios by
summer of 2014. To study alternative
transportation scenarios though
modeling would be approximately
$100,000.
7. Diverting traffic during storm events:
a. Assomption and Vaughan
Harvey could be diverted
to Albert Street; however,
with current traffic
volumes, this option would
become unmanageable.
Close Main Street m
Botsford to Robinson, and
from Church to Alma
Codiac Transpo:
1. Codiac Transpo to assist with the
development of flood/major storm
emergency response plan. Issues to
address include, but are not limited
to:
a. Communication shortfalls –
two way radio operations,
cellular operations from
employee to employee to
enable operations
b. Create employee
preparedness toolkit/provide
expectations
c. Create new temporary
transit hubs in Moncton
d. Create new temporary
transit hub in Dieppe to
connect Dieppe to Moncton
transit routes and U de M
e. Employee security
f. Determine if Provincial or
private fleets are available
for evacuation assistance
g. Determine evacuation plan
for residents requiring
wheelchair accessible bus
h. Diesel fuel supply
confirmation
i. Collection of transit fares to
continue during an extreme
event? (During ice storm,
transit picked up anyone for
concern re potential health
risks)

57
IMPACTS: Road Closure/Route Denial
Includes the closure of routes (roads, rail, etc…) by permanent means such as having been destroyed or for extended periods of
time
Scenario 8m 9.3m 10.3m 11.5m
Duration NA Low
Effect causes disruption to
normal community life for
several weeks or less.
High
Effect causes disruption
to normal community
life for more than 1 year.
High
Effect causes disruption to
normal community life for
more than 1 year.
Geographic
Extent
NA Medium
Effect occurs over a
portion of the region or
community. The effect is
considered to have an
area of influence which is
limited to a portion of the
geographic area.
High
Effect occurs over an
extensive area within
your region or
community. This effect is
considered to have an
area of influence
extending over a large
geographic area,
perhaps beyond the
community or region.
High
Effect occurs over an
extensive area within your
region or community. This
effect is considered to have
an area of influence
extending over a large
geographic area, perhaps
beyond the community or
region.
Regional
Sensitivity
NA Medium
The nature of this region or
community’s economy,
culture or environment
make it moderately
sensitive or vulnerable to
this effect. Some regional
characteristics are
vulnerable but do not
exacerbate the effect.
Medium
The nature of this region
or community’s
economy, culture or
environment make it
moderately sensitive or
vulnerable to this effect.
Some regional
characteristics are
vulnerable but do not
exacerbate the effect.
High
The nature of this region of
community’s economy,
culture or environment
make it atypically sensitive
or vulnerable to this effect.
Some regional
characteristics could
exacerbate the negative
consequences of the
effect.
Magnitude NA Medium
Effect has the potential to
impact a portion of the
local population and
could trigger detectable
socio-economic
disruption.
Medium
Effect has the potential
to impact a portion of
the local population
and could trigger
detectable socio-
economic disruption.
High
Effect has the potential to
impact the local population
as a whole and triggering
major socio-economic
change that is outside the
range of normal variability.
Reversibility NA Low
Negative impacts revert
within one year without
restoration efforts. The
community will return to
pre-effect state without
any intervention.
Medium
Negative impacts
caused by this effect
can be reversed within 2
years with some
government restoration
efforts or over a longer
period of time without
government
intervention.
High
Negative impacts caused
by this effect are irreversible
or only reversible over an
extended period of time
with major government
restoration efforts.
Communications NA Low
Short term or no disruption
of ICT and/or
communications or
disruption over isolated,
non-sensitive areas.
Low
Short term or no
disruption of ICT and/or
communications or
disruption over isolated,
non-sensitive areas.
Low
Short term or no disruption
of ICT and/or
communications or
disruption over isolated,
non-sensitive areas.

58
IMPACTS: Structure Failure or Loss
With respect to buildings, means the destruction, collapse or loss of use of the structure for an extended period of time, or permanently.
Potential Impacts noted by TAG:
1. Homes with water become inhabitable in short term; variation in
damages depending on location of building and type of flooding
(surface vs. basement)
2. Impacts are localized, but overall extent of damage will have impact on
community as a whole.
3. Key public facilities at risk (list):
downtown police station;
2 fire stations;
access to courthouse;
public library (blue cross)
East End Boys & Girls Club pool;
4. Recovery period a key factor – likely owners will be allowed to rebuild in
some areas, but chances are not without financial risk (therefore
relocation discussions are likely at that time)
5. Residential owners less ‘resourced’ to recovery than businesses, based
on experiences in other cities
6. Downtown businesses will be impacted, development decisions will need
to weigh in on risks and provide adaptive solutions to proceed.
7. Champlain mall area also poses risk to regional economy
Proposed solutions to mitigate potential impacts:
1. Proposed 10.5m minimum habitable floor elevation in
proposed Zoning By-law.
2. Resources (Urban Planning) - Developing new Municipal Plan
policies and Zoning Overlay regulation Resources (senior
management) Need to develop a strategy on how to
"handle" lands in the most at risk areas.
3. Further review of how other jurisdiction are using overlay
zoning.
4. Inform land owners of potential risk / mitigate flood risk for new
development. – waiver form
5. Heritage properties to be addressed under the overlay zoning
regulations…may need to create specific policies for heritage
properties - may need to consult with heritage staff and
heritage board
Scenario 8m 9.3m 10.3m 11.5m
Duration Low
Effect causes disruption
to normal community life
for several weeks or less.
High
Effect causes disruption to
normal community life for
more than 1 year.
High
Effect causes disruption to
normal community life for
more than 1 year.
High
Effect causes disruption to normal
community life for more than 1 year.
Geographic
Extent
Low
Effect occurs over a
localized area within the
region or community.
Effect is considered to
have an area of
influence which is limited
to the footprint of the
effect or its immediate
vicinity.
Low
Effect occurs over a
localized area within the
region or community. Effect
is considered to have an
area of influence which is
limited to the footprint of
the effect or its immediate
vicinity.
Medium
Effect occurs over a portion
of the region or community.
The effect is considered to
have an area of influence
which is limited to a portion
of the geographic area.
High
Effect occurs over an extensive
area within your region or
community. This effect is considered
to have an area of influence
extending over a large geographic
area, perhaps beyond the
community or region.
Regional
Sensitivity
Medium
The nature of this region
or community’s
economy, culture or
environment make it
moderately sensitive or
vulnerable to this effect.
Some regional
characteristics are
vulnerable but do not
exacerbate the effect.
High
The nature of this region of
community’s economy,
culture or environment
make it atypically sensitive
or vulnerable to this effect.
Some regional
characteristics could
exacerbate the negative
consequences of the
effect.
High
The nature of this region of
community’s economy,
culture or environment
make it atypically sensitive
or vulnerable to this effect.
Some regional
characteristics could
exacerbate the negative
consequences of the
effect.
High
The nature of this region of
community’s economy, culture or
environment make it atypically
sensitive or vulnerable to this effect.
Some regional characteristics could
exacerbate the negative
consequences of the effect.
Magnitude Low
Effect has the potential to
cause localized socio-
economic impacts.
High
Effect has the potential to
impact the local population
as a whole and triggering
major socio-economic
change that is outside the
range of normal variability.
High
Effect has the potential to
impact the local population
as a whole and triggering
major socio-economic
change that is outside the
range of normal variability.
High
Effect has the potential to impact
the local population as a whole and
triggering major socio-economic
change that is outside the range of
normal variability.
Reversibility Low
Negative impacts revert
within one year without
restoration efforts. The
community will return to
pre-effect state without
any intervention.
Medium
Negative impacts caused
by this effect can be
reversed within 2 years with
some government
restoration efforts or over a
longer period of time
without government
intervention.
High
The nature of this region of
community’s economy,
culture or environment
make it atypically sensitive
or vulnerable to this effect.
Some regional
characteristics could
exacerbate the negative
consequences of the
effect.
High
The nature of this region of
community’s economy, culture or
environment make it atypically
sensitive or vulnerable to this effect.
Some regional characteristics could
exacerbate the negative
consequences of the effect.
Communications Low - Short term or no
disruption of ICT and/or
communications or
disruption over isolated,
non-sensitive areas.
Low - Short term or no
disruption of ICT and/or
communications or
disruption over isolated,
non-sensitive areas.
Low - Short term or no
disruption of ICT and/or
communications or
disruption over isolated,
non-sensitive areas.
Low - Short term or no disruption of
ICT and/or communications or
disruption over isolated, non-
sensitive areas.
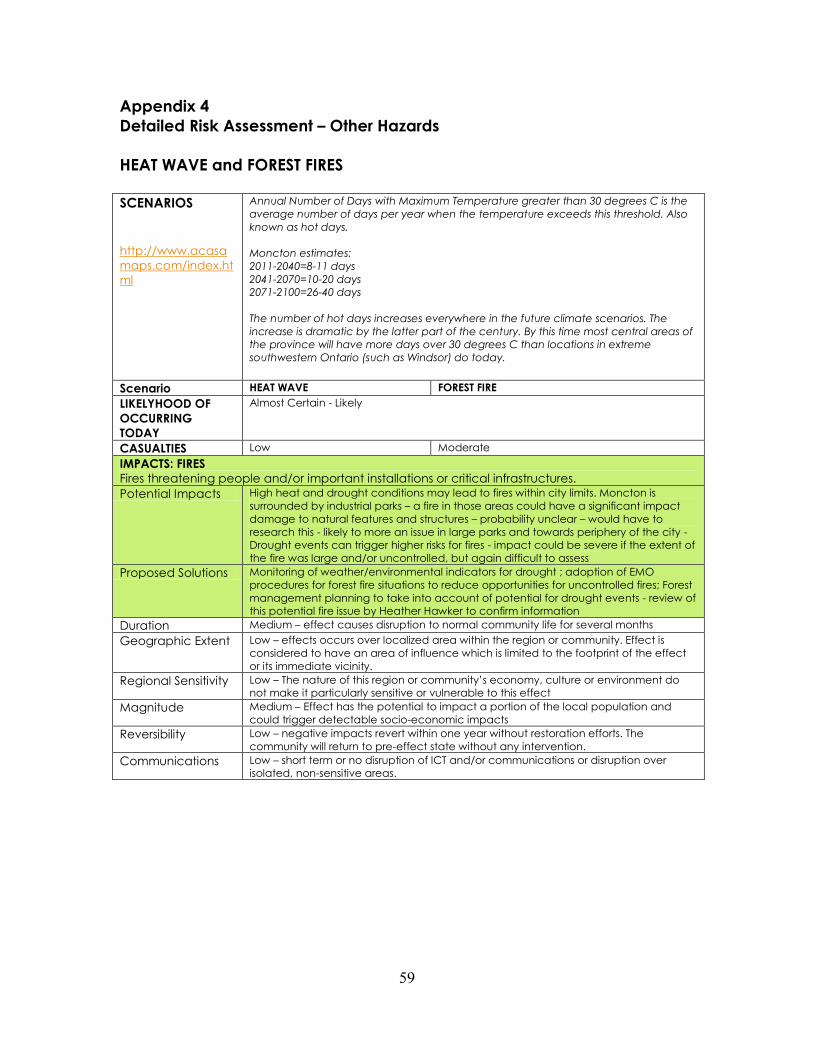
59
Appendix 4
Detailed Risk Assessment – Other Hazards
HEAT WAVE and FOREST FIRES
SCENARIOS
http://www.acasa
maps.com/index.ht
ml
Annual Number of Days with Maximum Temperature greater than 30 degrees C is the
average number of days per year when the temperature exceeds this threshold. Also
known as hot days.
Moncton estimates:
2011-2040=8-11 days
2041-2070=10-20 days
2071-2100=26-40 days
The number of hot days increases everywhere in the future climate scenarios. The
increase is dramatic by the latter part of the century. By this time most central areas of
the province will have more days over 30 degrees C than locations in extreme
southwestern Ontario (such as Windsor) do today.
Scenario HEAT WAVE FOREST FIRE
LIKELYHOOD OF
OCCURRING
TODAY
Almost Certain - Likely
CASUALTIES Low Moderate
IMPACTS: FIRES
Fires threatening people and/or important installations or critical infrastructures.
Potential Impacts High heat and drought conditions may lead to fires within city limits. Moncton is
surrounded by industrial parks – a fire in those areas could have a significant impact
damage to natural features and structures – probability unclear – would have to
research this - likely to more an issue in large parks and towards periphery of the city -
Drought events can trigger higher risks for fires - impact could be severe if the extent of
the fire was large and/or uncontrolled, but again difficult to assess
Proposed Solutions Monitoring of weather/environmental indicators for drought ; adoption of EMO
procedures for forest fire situations to reduce opportunities for uncontrolled fires; Forest
management planning to take into account of potential for drought events - review of
this potential fire issue by Heather Hawker to confirm information
Duration Medium – effect causes disruption to normal community life for several months
Geographic Extent Low – effects occurs over localized area within the region or community. Effect is
considered to have an area of influence which is limited to the footprint of the effect
or its immediate vicinity.
Regional Sensitivity Low – The nature of this region or community’s economy, culture or environment do
not make it particularly sensitive or vulnerable to this effect
Magnitude Medium – Effect has the potential to impact a portion of the local population and
could trigger detectable socio-economic impacts
Reversibility Low – negative impacts revert within one year without restoration efforts. The
community will return to pre-effect state without any intervention.
Communications Low – short term or no disruption of ICT and/or communications or disruption over
isolated, non-sensitive areas.
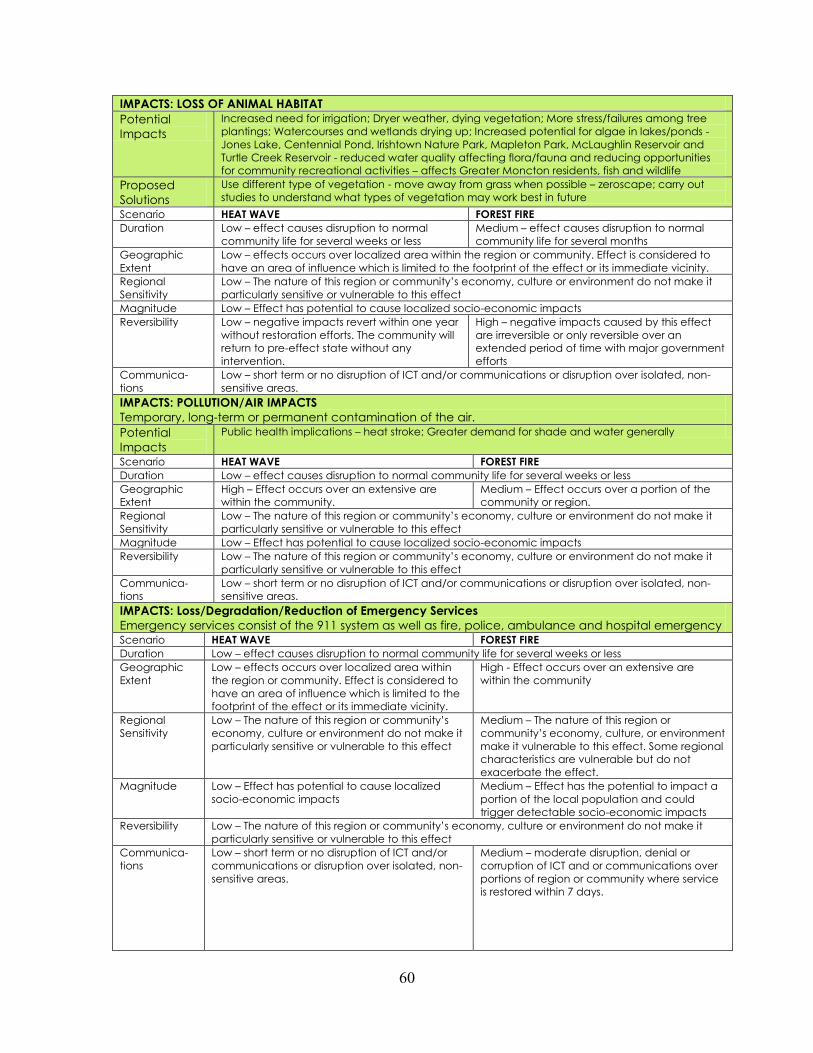
60
IMPACTS: LOSS OF ANIMAL HABITAT Potential
Impacts
Increased need for irrigation; Dryer weather, dying vegetation; More stress/failures among tree
plantings; Watercourses and wetlands drying up; Increased potential for algae in lakes/ponds -
Jones Lake, Centennial Pond, Irishtown Nature Park, Mapleton Park, McLaughlin Reservoir and
Turtle Creek Reservoir - reduced water quality affecting flora/fauna and reducing opportunities
for community recreational activities – affects Greater Moncton residents, fish and wildlife Proposed
Solutions
Use different type of vegetation - move away from grass when possible – zeroscape; carry out
studies to understand what types of vegetation may work best in future Scenario HEAT WAVE FOREST FIRE
Duration Low – effect causes disruption to normal
community life for several weeks or less
Medium – effect causes disruption to normal
community life for several months
Geographic
Extent
Low – effects occurs over localized area within the region or community. Effect is considered to
have an area of influence which is limited to the footprint of the effect or its immediate vicinity. Regional
Sensitivity
Low – The nature of this region or community’s economy, culture or environment do not make it
particularly sensitive or vulnerable to this effect Magnitude Low – Effect has potential to cause localized socio-economic impacts Reversibility Low – negative impacts revert within one year
without restoration efforts. The community will
return to pre-effect state without any
intervention.
High – negative impacts caused by this effect
are irreversible or only reversible over an
extended period of time with major government
efforts Communica-
tions
Low – short term or no disruption of ICT and/or communications or disruption over isolated, non-
sensitive areas. IMPACTS: POLLUTION/AIR IMPACTS
Temporary, long-term or permanent contamination of the air.
Potential
Impacts
Public health implications – heat stroke; Greater demand for shade and water generally
Scenario HEAT WAVE FOREST FIRE
Duration Low – effect causes disruption to normal community life for several weeks or less
Geographic
Extent
High – Effect occurs over an extensive are
within the community.
Medium – Effect occurs over a portion of the
community or region.
Regional
Sensitivity
Low – The nature of this region or community’s economy, culture or environment do not make it
particularly sensitive or vulnerable to this effect Magnitude Low – Effect has potential to cause localized socio-economic impacts Reversibility Low – The nature of this region or community’s economy, culture or environment do not make it
particularly sensitive or vulnerable to this effect Communica-
tions
Low – short term or no disruption of ICT and/or communications or disruption over isolated, non-
sensitive areas. IMPACTS: Loss/Degradation/Reduction of Emergency Services
Emergency services consist of the 911 system as well as fire, police, ambulance and hospital emergency Scenario HEAT WAVE FOREST FIRE
Duration Low – effect causes disruption to normal community life for several weeks or less
Geographic
Extent
Low – effects occurs over localized area within
the region or community. Effect is considered to
have an area of influence which is limited to the
footprint of the effect or its immediate vicinity.
High - Effect occurs over an extensive are
within the community
Regional
Sensitivity
Low – The nature of this region or community’s
economy, culture or environment do not make it
particularly sensitive or vulnerable to this effect
Medium – The nature of this region or
community’s economy, culture, or environment
make it vulnerable to this effect. Some regional
characteristics are vulnerable but do not
exacerbate the effect.
Magnitude Low – Effect has potential to cause localized
socio-economic impacts
Medium – Effect has the potential to impact a
portion of the local population and could
trigger detectable socio-economic impacts
Reversibility Low – The nature of this region or community’s economy, culture or environment do not make it
particularly sensitive or vulnerable to this effect
Communica-
tions
Low – short term or no disruption of ICT and/or
communications or disruption over isolated, non-
sensitive areas.
Medium – moderate disruption, denial or
corruption of ICT and or communications over
portions of region or community where service
is restored within 7 days.
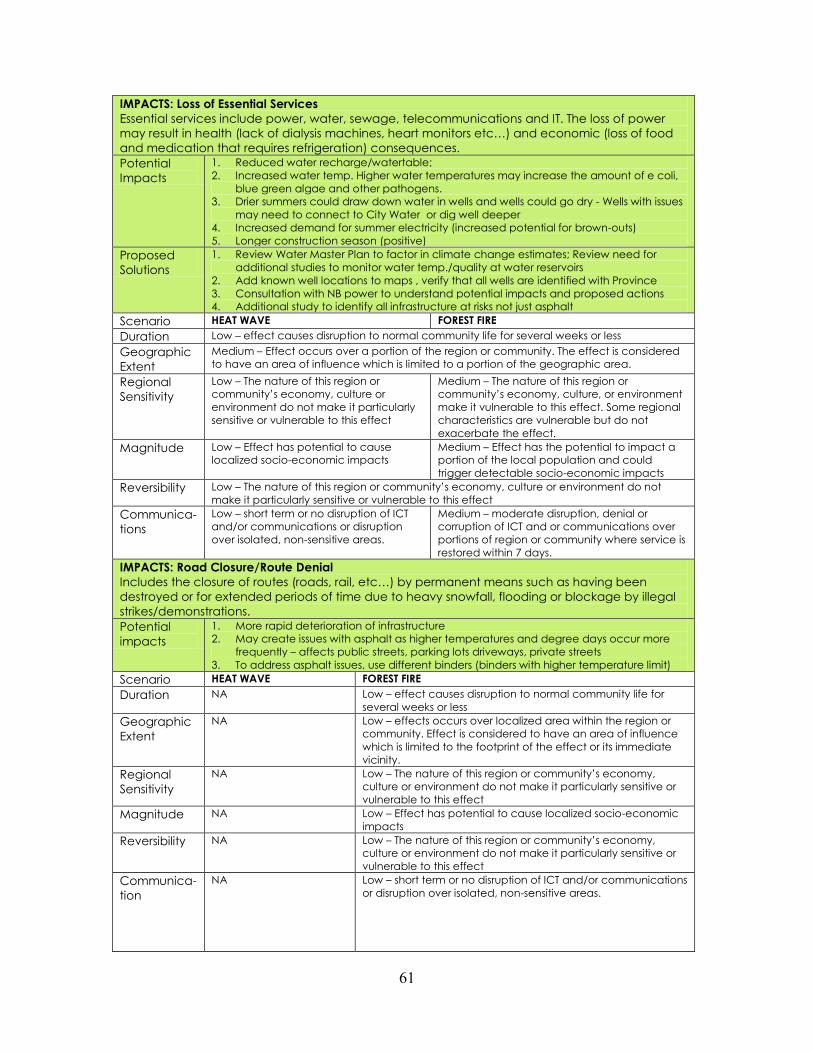
61
IMPACTS: Loss of Essential Services
Essential services include power, water, sewage, telecommunications and IT. The loss of power
may result in health (lack of dialysis machines, heart monitors etc…) and economic (loss of food
and medication that requires refrigeration) consequences.
Potential
Impacts
1. Reduced water recharge/watertable;
2. Increased water temp. Higher water temperatures may increase the amount of e coli,
blue green algae and other pathogens.
3. Drier summers could draw down water in wells and wells could go dry - Wells with issues
may need to connect to City Water or dig well deeper
4. Increased demand for summer electricity (increased potential for brown-outs)
5. Longer construction season (positive) Proposed
Solutions
1. Review Water Master Plan to factor in climate change estimates; Review need for
additional studies to monitor water temp./quality at water reservoirs 2. Add known well locations to maps , verify that all wells are identified with Province
3. Consultation with NB power to understand potential impacts and proposed actions
4. Additional study to identify all infrastructure at risks not just asphalt Scenario HEAT WAVE FOREST FIRE
Duration Low – effect causes disruption to normal community life for several weeks or less
Geographic
Extent
Medium – Effect occurs over a portion of the region or community. The effect is considered
to have an area of influence which is limited to a portion of the geographic area.
Regional
Sensitivity
Low – The nature of this region or
community’s economy, culture or
environment do not make it particularly
sensitive or vulnerable to this effect
Medium – The nature of this region or
community’s economy, culture, or environment
make it vulnerable to this effect. Some regional
characteristics are vulnerable but do not
exacerbate the effect. Magnitude Low – Effect has potential to cause
localized socio-economic impacts
Medium – Effect has the potential to impact a
portion of the local population and could
trigger detectable socio-economic impacts
Reversibility Low – The nature of this region or community’s economy, culture or environment do not
make it particularly sensitive or vulnerable to this effect Communica-
tions
Low – short term or no disruption of ICT
and/or communications or disruption
over isolated, non-sensitive areas.
Medium – moderate disruption, denial or
corruption of ICT and or communications over
portions of region or community where service is
restored within 7 days. IMPACTS: Road Closure/Route Denial
Includes the closure of routes (roads, rail, etc…) by permanent means such as having been
destroyed or for extended periods of time due to heavy snowfall, flooding or blockage by illegal
strikes/demonstrations. Potential
impacts
1. More rapid deterioration of infrastructure
2. May create issues with asphalt as higher temperatures and degree days occur more
frequently – affects public streets, parking lots driveways, private streets
3. To address asphalt issues, use different binders (binders with higher temperature limit) Scenario HEAT WAVE FOREST FIRE
Duration NA Low – effect causes disruption to normal community life for
several weeks or less
Geographic
Extent
NA Low – effects occurs over localized area within the region or
community. Effect is considered to have an area of influence
which is limited to the footprint of the effect or its immediate
vicinity.
Regional
Sensitivity
NA Low – The nature of this region or community’s economy,
culture or environment do not make it particularly sensitive or
vulnerable to this effect
Magnitude NA Low – Effect has potential to cause localized socio-economic
impacts
Reversibility NA Low – The nature of this region or community’s economy,
culture or environment do not make it particularly sensitive or
vulnerable to this effect
Communica-
tion
NA Low – short term or no disruption of ICT and/or communications
or disruption over isolated, non-sensitive areas.

62
IMPACTS: Structure Failure or Loss
With respect to buildings, means the destruction, collapse or loss of use of the structure for an
extended period of time, or permanently. Potential Impacts Longer construction season (positive); negative potential fire may damage
structures
Proposed Solutions
Scenario HEAT WAVE FOREST FIRE
Duration NA Medium – effect causes disruption to
normal community life for several
months
Geographic Extent NA Low – effects occurs over localized
area within the region or community.
Effect is considered to have an area of
influence which is limited to the
footprint of the effect or its immediate
vicinity.
Regional Sensitivity NA Medium – The nature of this region or
community’s economy, culture, or
environment make it vulnerable to this
effect. Some regional characteristics
are vulnerable but do not exacerbate
the effect.
Magnitude NA Low – Effect has potential to cause
localized socio-economic impacts
Reversibility NA Low – The nature of this region or
community’s economy, culture or
environment do not make it particularly
sensitive or vulnerable to this effect
Communications NA Low – short term or no disruption of ICT
and/or communications or disruption
over isolated, non-sensitive areas.

63
COLD WAVE, ICE STORM and SEVERE WINTER STORM
SCENARIOS
http://www.acas
amaps.com/inde
x.html
Moncton estimates for cold days (below minus 10 degrees Celsius): 2011-2040: 6-12days 2041-2070: 5-9 days 2071-2100: 3-6 days Days with a maximum temperature below -10 degrees C become increasingly rare towards 2100. Winter total precipitation is the average total of rainfall and snowfall for the months of December, January and February. Winter precipitation is expected to increase in all areas. Moncton estimates: 2011-2040: 323-373mm 2041-2070: 330-366mm 2071-2100: 348-380mm
Annual Total Snow Days is the average number of days per year with at least 0.2 cm of snowfall. Moncton estimates: 2011-2040: 51-61days 2041-2070: 53-61 days 2071-2100: 39-48 days Days with snow show relatively little change in future scenarios, decreasing slightly in the north and remaining similar in the south. Temperature change across the freezing point can directly affect materials and infrastructure (e.g. paint, road surfaces). There are also indirect effects. More freeze-thaw cycles can require increased use of road salt, for example. Increased freeze-thaw activity in winter can be harmful for plants and wildlife by breaking dormancy and increasing the damage caused by subsequent cold spells. The full range of impacts is hard to predict, but effects are likely on the maple syrup industry, forest management, and road maintenance and weight restriction periods.
Scenario COLD WAVE ICE STORM SEVERE WINTER STORM
LIKELYHOOD OF
OCCURRING
TODAY
Likely Likely Almost Certain
CASUALTIES Low
IMPACTS: Loss/Degradation/Reduction of Emergency Services
Emergency services consist of the 911 system as well as fire, police, ambulance and hospital emergency
Scenario COLD WAVE ICE STORM SEVERE WINTER STORM
Duration NA Low – effect causes disruption to normal community life for several weeks or less
Geographic Extent NA High - Effect occurs over an extensive are within the community
Regional Sensitivity NA Medium – The nature of this region or
community’s economy, culture, or
environment make it vulnerable to this
effect. Some regional characteristics are
vulnerable but do not exacerbate the
effect.
Low – The nature of this region or
community’s economy, culture or
environment do not make it
particularly sensitive or vulnerable
to this effect
Magnitude NA High – Effect has the potential to impact
the local population as a whole and
triggering major socio-economic change
that is outside the range of normal
variability
Medium – Effect has the potential
to impact a portion of the local
population and could trigger
detectable socio-economic
impacts
Reversibility NA Low – The nature of this region or community’s economy, culture or
environment do not make it particularly sensitive or vulnerable to this effect
Communications NA Medium – moderate disruption, denial or
corruption of ICT and or communications
over portions of region or community
where service is restored within 7 days.
Low – short term or no disruption
of ICT and/or communications or
disruption over isolated, non-
sensitive areas.

64
IMPACTS: Loss of Essential Services
Essential services include power, water, sewage, telecommunications and IT. The loss of power
may result in health (lack of dialysis machines, heart monitors etc…) and economic (loss of food
and medication that requires refrigeration) consequences.
Potential Impacts High than average demand on the grid; ice storm may cause loss of power;
Scenario COLD WAVE ICE STORM SEVERE WINTER STORM
Duration Low – effect causes disruption to normal community life for several weeks or less
Geographic
Extent
High - Effect occurs over an extensive are within the
community
Medium – Effect occurs over a
portion of the region or
community. The effect is
considered to have an area of
influence which is limited to a
portion of the geographic
area.
Regional
Sensitivity
Low – The nature of
this region or
community’s
economy, culture or
environment do not
make it particularly
sensitive or vulnerable
to this effect
High – The nature of the
region or community’s
economy culture or
environment make it
atypically sensitive to this
effect. Some regional
characteristics could
exacerbate the negative
consequence of the
effect.
Low – The nature of this region
or community’s economy,
culture or environment do not
make it particularly sensitive or
vulnerable to this effect
Magnitude Low – Effect has
potential to cause
localized socio-
economic impacts
Medium – Effect has the
potential to impact a
portion of the local
population and could
trigger detectable socio-
economic impacts
Low – Effect has potential to
cause localized socio-
economic impacts
Reversibility Low – The nature of
this region or
community’s
economy, culture or
environment do not
make it particularly
sensitive or vulnerable
to this effect
Medium - Negative
impacts caused by this
effect can be reversed
within 2 years with some
government restoration
efforts or over a longer
period of time without
government intervention.
Low – The nature of this region
or community’s economy,
culture or environment do not
make it particularly sensitive or
vulnerable to this effect
Communications Low – short term or no
disruption of ICT
and/or
communications or
disruption over
isolated, non-sensitive
areas.
High – Disruption, denial or
corruption of ICT and or
communications over
significant areas of region
or community where
service is not fully restored
within at least 7 days
Low – short term or no
disruption of ICT and/or
communications or disruption
over isolated, non-sensitive
areas.
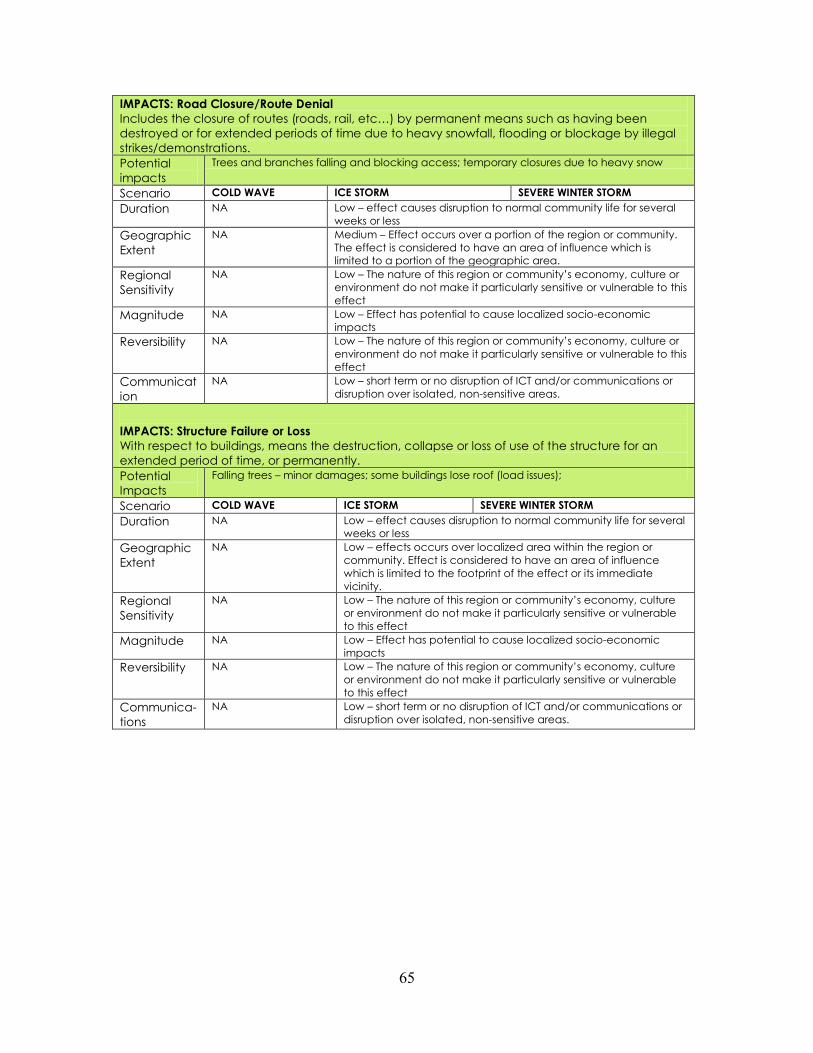
65
IMPACTS: Road Closure/Route Denial
Includes the closure of routes (roads, rail, etc…) by permanent means such as having been
destroyed or for extended periods of time due to heavy snowfall, flooding or blockage by illegal
strikes/demonstrations. Potential
impacts
Trees and branches falling and blocking access; temporary closures due to heavy snow
Scenario COLD WAVE ICE STORM SEVERE WINTER STORM
Duration NA Low – effect causes disruption to normal community life for several
weeks or less
Geographic
Extent
NA Medium – Effect occurs over a portion of the region or community.
The effect is considered to have an area of influence which is
limited to a portion of the geographic area.
Regional
Sensitivity
NA Low – The nature of this region or community’s economy, culture or
environment do not make it particularly sensitive or vulnerable to this
effect
Magnitude NA Low – Effect has potential to cause localized socio-economic
impacts
Reversibility NA Low – The nature of this region or community’s economy, culture or
environment do not make it particularly sensitive or vulnerable to this
effect
Communicat
ion
NA Low – short term or no disruption of ICT and/or communications or
disruption over isolated, non-sensitive areas.
IMPACTS: Structure Failure or Loss
With respect to buildings, means the destruction, collapse or loss of use of the structure for an
extended period of time, or permanently. Potential
Impacts
Falling trees – minor damages; some buildings lose roof (load issues);
Scenario COLD WAVE ICE STORM SEVERE WINTER STORM
Duration NA Low – effect causes disruption to normal community life for several
weeks or less
Geographic
Extent
NA Low – effects occurs over localized area within the region or
community. Effect is considered to have an area of influence
which is limited to the footprint of the effect or its immediate
vicinity.
Regional
Sensitivity
NA Low – The nature of this region or community’s economy, culture
or environment do not make it particularly sensitive or vulnerable
to this effect
Magnitude NA Low – Effect has potential to cause localized socio-economic
impacts
Reversibility NA Low – The nature of this region or community’s economy, culture
or environment do not make it particularly sensitive or vulnerable
to this effect
Communica-
tions
NA Low – short term or no disruption of ICT and/or communications or
disruption over isolated, non-sensitive areas.

66
REFERENCES i The Atlantic Climate Adaptation Solutions Association (ACASA) , established by the
Atlantic Provinces (New Brunswick, Nova Scotia, Prince Edward Island and Newfoundland and
Labrador) and with the Government of Canada, has assisted in managing the Atlantic RAC
projects. Additional information on ACASA and the RAC program can be found at
http://atlanticadaptation.ca/.
ii Climate Change Adaptation Measures for Greater Moncton Area, New Brunswick, prepared by
AMEC Earth Environmental for the Atlantic Canada Adaptation Solutions Association, December
21, 2011. A Final Summary Report was completed in September, 2012.
http://atlanticadaptation.ca/sites/discoveryspace.upei.ca.acasa/files/Adaptation_Measures_Gre
ater_Moncton-2011.pdf
iii The Province of New Brunswick is currently not required to prepare a Climate Change Action Plan
in order to receive Gas Tax funding. For more details on Gas Tax funding:
http://www.infrastructure.gc.ca/regions/nb/nb-prof-eng.html. In the Province of Nova Scotia,
municipalities are required to prepare Climate Change Action Plans by December 31, 2013 in
order to receive Gas Tax Funding in 2014: See http://www.nsinfrastructure.ca/pages/Municipal-
Climate-Change-Action-Plan-Guidebook1.aspx iv Note: Weather related disasters from the CDD include: cold waves, droughts, floods,
hail/thunderstorms, heat waves, hurricanes/typhoons, avalanches, storms (storm surges, freezing
rain, winter storms), tornados and wildfires. Geophysical disasters from the CDD include e
earthquakes, landslides and tsunamis. Disclaimer: Where there has been no finding of fact by a
court of law in criminal, civil or administrative proceeding, the facts set out in this database are
alleged facts. The Canadian Disaster Database continues to be a work in progress. While entries
are checked, and every effort is made to use reliable sources, the data presented here may
contain errors and/or duplications. As a consequence, revisions to the database are ongoing.
Other Climate Change Adaptation Plans and Resources
FCM, Climate Change Adaptation Planning Handbook for Small Canadian Communities:
http://www.fcm.ca/Documents/tools/PCP/climate_change_adaptation_planning_handbook_for_
small_canadian_communities_EN.pdf
Municipal Climate Change Action Plan Assistance (Nova Scotia):
MCCAP Assistant - nova scotia
Arviate Climate Change Adaptation Plan:
http://www.arviat.ca/wp-
content/uploads/2011/01/Arviat_Climate_Change_Adaptation_Plan_English_1008041.pdf
Saanich Climate Change Adaptation Plan:
http://saanich.ca/living/climate/pdf/SaanichAdaptationDiscussionPaper2010-FINAL.pdf
Windsor Climate Change Adaptation Plan:
http://www.citywindsor.ca/residents/environment/Environmental-Master-
Plan/Documents/Windsor%20Climate%20Change%20Adaptation%20Plan.pdf
Stratford Climate Change Adaptation Plan:
http://www.planningforclimatechange.ca/wwwroot/Docs/Library/CIPReports/CCMAP%20TOWN%
20OF%20STRATFORD%20COMPLETE.PDF