climate change 28/2019 - umweltbundesamt.de · the studies under consideration include at least one...
TRANSCRIPT

CLIMATE CHANGE
28/2019
Low-Carbon Europe 2050 Decomposition analysis of long-term projections for the European Union and selected Member States
German Environment Agency


CLIMATE CHANGE 28/2019
Ressortforschungsplan of the Federal Ministry for the Enviroment, Nature Conservation and Nuclear Safety
Project No. (FKZ) 3716 41 109 0Report No. FB000147/ZW,ANH,1,ENG
Low-Carbon Europe 2050 Decomposition analysis of long-term projections for the
European Union and selected Member States
by
Felix Chr. Matthes, Benjamin Greiner
Institute for Applied Ecology, Berlin
Vicki Duscha, Jakob Wachsmuth
Fraunhofer Institute for Systems and Innovation Research,
Karlsruhe
On behalf of the German Environment Agency

Imprint
Publisher Umweltbundesamt Wörlitzer Platz 1 06844 Dessau-Roßlau Tel: +49 340-2103-0 Fax: +49 340-2103-2285 [email protected] Internet: www.umweltbundesamt.de
/umweltbundesamt.de /umweltbundesamt
Report performed by: Fraunhofer Institute for Systems and Innovation Research ISI Breslauer Strasse 48 76139 Karlsruhe
Report completed in: August 2018
Edited by: Section V 1.2 Energy Strategies and Scenarios Guido Knoche
Publication as pdf: http://www.umweltbundesamt.de/publikationen
ISSN 1862-4804
Dessau-Roßlau, July 2019
The responsibility for the content of this publication lies with the author(s).

CLIMATE CHANGE Low-Carbon Europe 2050
5
Abstract: Low-Carbon Europe 2050
This report presents a thorough analysis of drivers for decarbonization in different scenario
studies. Selected baseline and emission reduction scenarios from a range of studies on the EU,
including some EU member states, were analysed to generate insights into:
► Which decarbonization strategies exist?
► Which sectors already show a clear decarbonization strategy?
► In which sectors is the decarbonization strategy less obvious or clear as significantly
different and mutually excluding strategies are researched?
► Are there sectors where decarbonization is particularly difficult and which are those?
► What issues have not been addressed in the existing scenarios so far?
Besides a generic comparison a decomposition analysis was applied to these scenarios to
identify key drivers for changes in emissions in the scenarios.
The studies under consideration include at least one ambitious climate protection scenario, and
provide a sufficient level of detail with regard to the quantitative results to allow for applying
the framework of the analysis. In addition to an analysis of total energy-related CO2 emissions,
this study analyses major energy-related sectors on the supply and demand side: electricity
supply, industry, tertiary, residential and transport (where possible differentiated by passenger
and freight). A comparison of findings and a synthesis along with a detailed data appendix
complete the report.
Kurzbeschreibung: Model Low-Carbon Europe 2050
Dieser Bericht enthält eine detaillierte Analyse der Treiber für Dekarbonisierung in
verschiedenen Szenarienstudien. Ausgewählte Basis- und Emissionsreduktionsszenarien aus
einer Reihe von Studien auf EU-Ebene, aber auch auf EU-Mitgliedsstaatenebene wurden
ausgewertet in Hinblick auf die folgenden Fragestellungen:
► Welche Dekarbonisierungsstrategien existieren?
► In welchen Sektoren ist bereits eine klare Dekarbonisierungsstrategie erkennbar?
► In welchen Sektoren ist die Dekarbonisierungsstrategie noch unklar, weil verschiedene, sich
teilweise gegenseitig ausschließende Strategien gibt?
► Gibt es Sektoren, in denen sich die Dekarbonisierung als besonders schwierig darstellt und
welche sind dies?
► Welche Themen wurden in den existierenden Szenarien bisher nicht addressiert?
Neben einer generischen Auswertung und Vergleich der Szenarien wurde eine
Dekompositionsanalyse durchgeführt, um die Haupttreiber für Emissionsveränderungen in den
Szenarien zu identifizieren.

CLIMATE CHANGE Low-Carbon Europe 2050
6
Alle für den Bericht ausgewerteten Studien enthalten mindestens ein ambitioniertes
Klimaschutzszenario und stellen genügend Daten zur Verfügung um die quantitativen Analysen
durchführen zu können. Neben einer Analyse der gesamten energie-bedingten CO2-Emissionen
wurden auch die wichtigsten energie-relevanten Sektoren auf der Angebots- und Nachfrageseite
ausgewertet: Stromerzeugung, Industrie, Dienstleisungssektor, Wohngebäude und Transport
(soweit möglich differenziert nach Personen- und Güterverkehr). Ein Vergleich der Studien und
eine Synthese sowie ein detaillierter Datenappendix vervollständigen den Bericht.

CLIMATE CHANGE Low-Carbon Europe 2050
7
Table of content
List of figures ........................................................................................................................................... 8
List of abbreviations ................................................................................................................................ 9
Summary ............................................................................................................................................... 10
Zusammenfassung ................................................................................................................................. 12
1 Introduction ................................................................................................................................... 14
2 Scenario overview and approach .................................................................................................. 15
3 Comparison and synthesis ............................................................................................................. 19
3.1 Aggregate and sectoral emission trajectories ....................................................................... 19
3.2 Sectoral contributions ........................................................................................................... 20
3.3 Contribution of emission reduction levers ........................................................................... 22
4 Conclusions and lessons learned ................................................................................................... 36
5 References ..................................................................................................................................... 40

CLIMATE CHANGE Low-Carbon Europe 2050
8
List of figures
Figure 1: Sectoral contributions to total emission reductions, 2010–
2030 .......................................................................................... 21
Figure 2: Sectoral contributions to total emission reductions, 2010–
2050 .......................................................................................... 21
Figure 3: Contributions of the different emission levers to the total
emission reductions, 2010–2030 ............................................. 23
Figure 4: Contributions of the different emission levers to the total
emission reductions, 2010–2050 ............................................. 24
Figure 5: Contributions of the different emission levers to the emission
reductions in the electricity sector, 2010–2030 ....................... 25
Figure 6: Contributions of the different emission levers to the emission
reductions in the electricity sector, 2010–2050 ....................... 26
Figure 7: Contributions of the different emission levers to the emission
reductions in the industry sectors, 2010–2030 ........................ 27
Figure 8: Contributions of the different emission levers to the emission
reductions in the industry sectors, 2010–2050 ........................ 28
Figure 9: Contributions of the different emission levers to the emission
reductions in the tertiary sectors, 2010–2030 ......................... 30
Figure 10: Contributions of the different emission levers to the emission
reductions in the tertiary sectors, 2010–2050 ......................... 30
Figure 11: Contributions of the different emission levers to the emission
reductions in the residential sector, 2010–2030...................... 32
Figure 12: Contributions of the different emission levers to the emission
reductions in the residential sector, 2010–2050...................... 32
Figure 13: Contributions of the different emission levers to the emission
reductions in the transport sectors, 2010–2030 ...................... 33
Figure 14: Contributions of the different emission levers to the emission
reductions in the transport sectors, 2010–2050 ...................... 34
CLIMATE CHANGE Low-Carbon Europe 2050
9
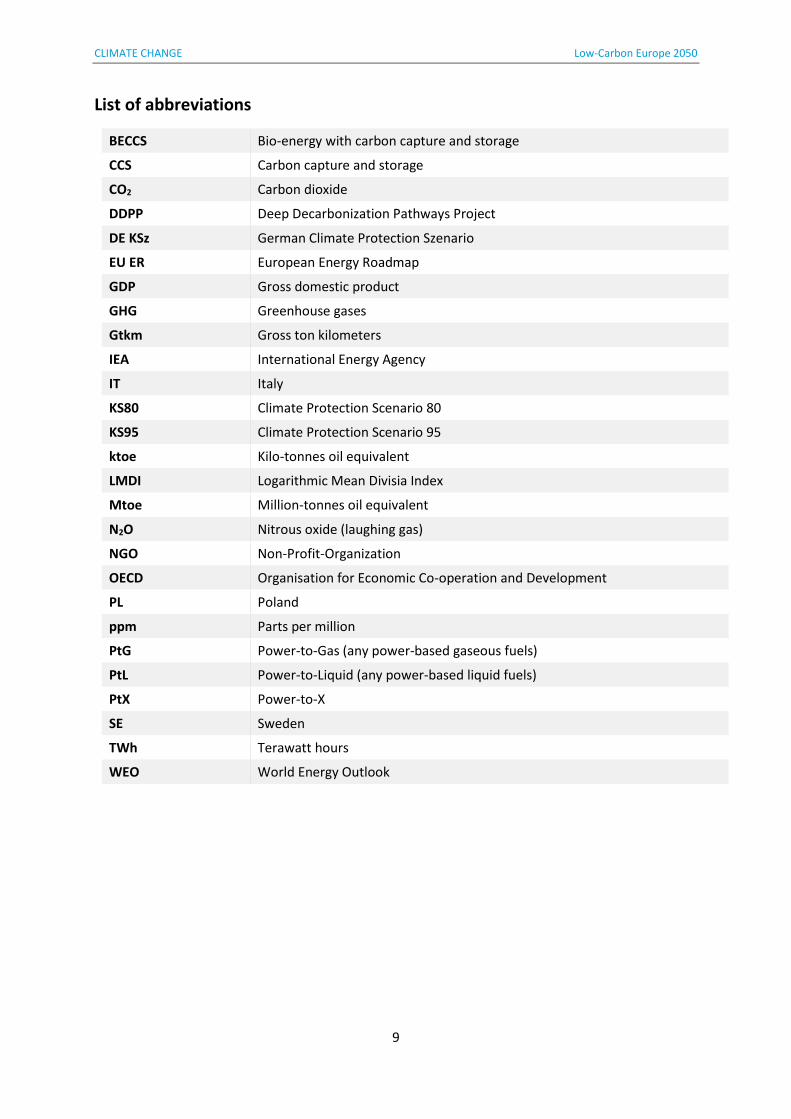
List of abbreviations
BECCS Bio-energy with carbon capture and storage
CCS Carbon capture and storage
CO2 Carbon dioxide
DDPP Deep Decarbonization Pathways Project
DE KSz German Climate Protection Szenario
EU ER European Energy Roadmap
GDP Gross domestic product
GHG Greenhouse gases
Gtkm Gross ton kilometers
IEA International Energy Agency
IT Italy
KS80 Climate Protection Scenario 80
KS95 Climate Protection Scenario 95
ktoe Kilo-tonnes oil equivalent
LMDI Logarithmic Mean Divisia Index
Mtoe Million-tonnes oil equivalent
N2O Nitrous oxide (laughing gas)
NGO Non-Profit-Organization
OECD Organisation for Economic Co-operation and Development
PL Poland
ppm Parts per million
PtG Power-to-Gas (any power-based gaseous fuels)
PtL Power-to-Liquid (any power-based liquid fuels)
PtX Power-to-X
SE Sweden
TWh Terawatt hours
WEO World Energy Outlook

CLIMATE CHANGE Low-Carbon Europe 2050
10
Summary
This report presents a thorough analysis of drivers for decarbonization in different scenario
studies. Selected baseline and emission reduction scenarios from a range of studies on the EU,
including some EU member states, were analysed to generate insights into:
► Which decarbonization strategies exist?
► Which sectors already show a clear decarbonization strategy?
► In which sectors is the decarbonization strategy less obvious or clear as significantly
different and mutually excluding strategies are researched?
► Are there sectors where decarbonization is particularly difficult and which are those?
► What issues have not been addressed in the existing scenarios so far?
Besides a generic comparison a decomposition analysis was applied to these scenarios to
identify key drivers for changes in emissions in the scenarios.
The studies under consideration include at least one ambitious climate protection scenario, and
provide a sufficient level of detail with regard to the quantitative results to allow for applying
the framework of the analysis. In addition to an analysis of total energy-related CO2 emissions,
this study analyses major energy-related sectors on the supply and demand side: electricity
supply, industry, tertiary, residential and transport (where possible differentiated by passenger
and freight). A comparison of findings and a synthesis along with a detailed data appendix
complete the report.
Key messages:
► Scenarios vary widely with regards to the emission levels reached by 2050, but only three
scenarios reach at least 95% reduction below 1990 levels by 2050 (“full decarbonization”):
the German KS95, the Advanced energy [r]evolution scenario 2015 and the Vision Scenario
for the EU. None of the scenarios reaches zero greenhouse gas (GHG) emissions by 2050
despite our analysis focusing on CO2 emissions from combustion of fossil fuels and processes
only.
► Emission trajectories compatible with the 2°C limit can only be achieved if full
decarbonization is achieved by 2050 and the emission reductions from 2010 to 2030 would
amount to at least 50% by 2030.
► Most of the scenarios indicate the opportunity of early emission reductions at a significant
scale for the electricity sector (50-60% by 2030), while transport and industry show limited
reductions in 2030 in almost all scenarios and still have significant emission levels left in the
80% scenarios in 2050. Full decarbonization scenarios for those sectors heavily rely on
carbon capture and storage (CCS) or power-to-gas (PtG)/power-to-liquid (PtL) to limit the
remaining emissions.
► Different sectors show different key factors for the reduction of emissions: renewables are
the key driver in the electricity sector, the tertiary and residential sector heavily rely on

CLIMATE CHANGE Low-Carbon Europe 2050
11
energy efficiency, electricity use and partly renewables, the transport sector uses energy
efficiency, renewables, electricity and PtG/PtL. In the industry sector strategies vary
significantly including renewables, electricity and heat, CCS or PtG/PtL. Unlike the majority
of global scenarios, most of the full decarbonization scenarios do not achieve the additional
emission reductions by compensating the residual emissions in net sinks or by CCS based on
bio-energy (BECCS).
► The scope of the studies and assumptions made when designing the scenarios heavily impact
the decarbonization strategies, e.g. with regards to the availability of CCS or PtG/PtL – which
still require significant innovation in the future to become available – or the use of biomass.
► In order to provide resilient input for upcoming debates on long-term climate strategies new
long term scenarios should cover all relevant sectors and greenhouse gases and at least try
to reach the goal of (nearly) net-zero emissions.

CLIMATE CHANGE Low-Carbon Europe 2050
12
Zusammenfassung
Dieser Bericht enthält eine detaillierte Analyse der Treiber für Dekarbonisierung in
verschiedenen Szenarienstudien. Ausgewählte Basis- und Emissionsreduktionsszenarien aus
einer Reihe von Studien auf EU-Ebene, aber auch auf EU-Mitgliedsstaatenebene wurden
ausgewertet in Hinblick auf die folgenden Fragestellungen:
► Welche Dekarbonisierungsstrategien existieren?
► In welchen Sektoren ist bereits eine klare Dekarbonisierungsstrategie erkennbar?
► In welchen Sektoren ist die Dekarbonisierungsstrategie noch unklar, weil verschiedene, sich
teilweise gegenseitig ausschließende Strategien gibt?
► Gibt es Sektoren, in denen sich die Dekarbonisierung als besonders schwierig darstellt und
welche sind dies?
► Welche Themen wurden in den existierenden Szenarien bisher nicht addressiert?
Neben einer generischen Auswertung und Vergleich der Szenarien wurde eine
Dekompositionsanalyse durchgeführt, um die Haupttreiber für Emissionsveränderungen in den
Szenarien zu identifizieren.
Alle für den Bericht ausgewerteten Studien enthalten mindestens ein ambitioniertes
Klimaschutzszenario und stellen genügend Daten zur Verfügung um die quantitativen Analysen
durchführen zu können. Neben einer Analyse der gesamten energie-bedingten CO2-Emissionen
wurden auch die wichtigsten energie-relevanten Sektoren auf der Angebots- und Nachfrageseite
ausgewertet: Stromerzeugung, Industrie, Dienstleisungssektor, Wohngebäude und Transport
(soweit möglich differenziert nach Personen- und Güterverkehr). Ein Vergleich der Studien und
eine Synthese sowie ein detaillierter Datenappendix vervollständigen den Bericht.
Kernaussagen:
► Die untersuchten Szenarien unterschieden sich stark hinsichtlich der bis 2050 realisierten
Emissionsminderungen, wobei nur drei Szenarien Emissionsminderungen von 95%
gegenüber 1990 und mehr ("volle Dekarbonisierung") erreichen: das deutsche KS95-
Szenario, das Advanced energy [r]evolution Szenario von 2015 und das Vision Szenario für
die EU. Trotz der Einschränkung auf energie-bedingte CO2-Emissionen erreicht keines der
Szenarien ein Emissionsniveau von Null bis 2050.
► Emissionspfade, die mit dem 2°C-Ziel kompatibel sind, erfordern eine volle
Dekarbonisierung im oben genannten Sinn bis 2050 und Emissionsminderungen von
mindestens 50% bis 2030.
► In der Großzahl der Szenarien werden zeitnahe Emissionsminderungspotenziale
insbesondere im Stromsektor gesehen (50-60% Minderung bis 2050). In den Sektoren
Transport und Industrie ist dagegen in den meisten Studien nur eine begrenzte Minderung
bis 2030 ausgewiesen und beide Sektoren verfügen über deutliche Restemissionen bis 2050
in 80%-Minderungsszenarien. Die Szenarien, die eine "volle Dekarbonisierung" bis 2050

CLIMATE CHANGE Low-Carbon Europe 2050
13
erzielen, setzen zur Minderung der Restemissionen in diesen beiden Sektoren insbesondere
auf die Abscheidung und Speicherung von CO2 (CCS) sowie auf die Nutzung von Power-to-
Gas/ Power-to-Liquid-Optionen.
► Unterschiedliche Sektoren weisen unterschiedliche Kerntreiber für die Dekarbonisierung
auf: Erneuerbare Energien sind der Haupttreiber im Stromsektor; im Dienstleistungs- und
Wohngebäudebereich sind Energieeffizienzverbesserungen, die Nutzung von (CO2-freiem)
Strom und teilweise Erneuerbare Energien die Hauptfaktoren; im Transportsektor spielen
Energieeffizienz, Erneuerbare Treibstoffe, Stromnutzung und Power-to-Gas/Power-to-
Liquid-Optionen eine wichtige Rolle. In der Industrie sind unterschiedliche Strategien in den
einzelnen Studien zu finden: Erneuerbare Energien, Strom und Wärme, CCS oder PtG/PtL.
Different sectors show different key factors for the reduction of emissions: renewables are
the key driver in the electricity sector, the tertiary and residential sector heavily rely on
energy efficiency, electricity use and partly renewables, the transport sector uses energy
efficiency, renewables, electricity and PtG/PtL. Im Gegensatz zu der Vielzahl der globalen
Szenarien, die in den IPCC-Berichten ausgewertet werden, spielt die Kompensation von CO2-
Emissionen über Senken (z.B. über die Kombination von Biomasse-basierter
Stromerzeugung und CCS (BECCS)) in den untersuchten Szenarien keine Rolle.
► Der Fokus der Studien und die im Rahmen der Szenarioentwicklung getroffenen Annahmen
haben wichtigen Einfluss auf die verfügbaren Dekarbonisierungsstrategien, z.B. die
Verfügbarkeit von CCS oder Power-to-Gas/Power-to-Liquid-Vermeidungsoptionen - zu
deren Realisierung weitere Forschung und Entwicklung notwendig ist - oder zur Nutzung
von Biomasse.
► Zukünftige robuste Beiträge in der Dekarbonisierungsdebatte sollten alle relevanten
Sektoren und Treibhausgasemissionen berücksichtigen und zumindest versuchen das Ziel
von (fast) Null-Emissionen zu erreichen.

CLIMATE CHANGE Low-Carbon Europe 2050
14
1 Introduction In the process of developing a long-term climate policy vision European policy decision making
should build upon or at least reflect carefully the range of already existing scenarios. This in-
depth information on existing scenarios provides guidance:
► Which decarbonization strategies exist?
► Which sectors already show a clear decarbonization strategy?
► In which sectors is the decarbonization strategy less obvious or clear as significantly
different and mutually excluding strategies are researched?
► Are there sectors where decarbonization is particularly difficult and which are those?
► What issues have not been addressed in the existing scenarios so far?
Against this background, this report presents a thorough analysis of existing emission reduction
scenarios. The analysis covers long-term baseline scenarios and long-term emission reduction
scenarios for ambitious climate policy targets, both providing a modelling horizon by 2050. The
primary focus is set on scenarios and numerical studies for the EU, which allow a more or less
direct comparison. In addition to this, energy and CO2 emission scenarios for selected member
states were included that are characterized by a long-term scenario horizon (to 2050) as well as
high levels of climate policy ambitions under different circumstances (Germany, Italy, Sweden,
Poland). As far as possible, analyses of these scenarios include total CO2 emissions from energy
use, but also analyses of key sectors: energy supply, industry, tertiary, residential and transport.
With a view on the broad range of scenario-specific issues, from input data to modelling
approaches, the comparative analysis provided in this report is based on a decomposition
analysis, which allows identifying driving forces for emission trends as well as the different
abatement levers that determine the results on total or sectoral CO2 emissions. The
decomposition analysis allows for a numerical analysis of different studies and scenarios that
allows for an explanation of emission trends at a sufficient level of detail for the different
scenarios on the one hand but also creates a framework for highly consistent comparisons
between various scenarios and studies not only on an aggregate but also on sectoral levels.
The report is structured as follows: Section 2 provides an overview and brief introduction to the
scenarios analysed. Section 3 provides a comparison and synthesis of the analysis of the
different scenarios, while Section 4 draws conclusions from the analysis. The detailed study
analyses along with an introduction to the methodology applied are provided in the annex.

CLIMATE CHANGE Low-Carbon Europe 2050
15
2 Scenario overview and approach Scenarios have a key role in providing insights and help policy makers decide and justify policies
and targets. Today, several quantitative scenarios with a focus on significantly reducing
emissions are available for the EU and for a relevant number of European Union member states.
Important ones include:
► EU baseline scenarios
► Scenarios from the Energy Roadmap 2050
► Scenarios from the low-carbon economy roadmap 2050
► Scenarios published each year in the IEA World Energy Outlook
► Greenpeace Energy [r]evolution scenarios for the EU, some of the member states and other
regions of the world
► Scenarios from the Deep Decarbonization Pathways Project for the EU, some member states
and other regions of the world
Along with national scenarios developed for policymaking or by NGOs as a vision for future
development, they provide a good starting point for collecting information on different
decarbonization strategies.
Of the modelling exercises available, we selected scenarios based on the following
considerations1:
► If possible, the scenarios should include all European Union member states.
► The scenarios should reflect a broader range of emission reduction targets to being able to
identify differences in strategies for different levels of ambition.
► More recent scenarios were chosen over older scenarios.
► A sufficient level of data should be available for the scenarios included to allow for a
meaningful decomposition analysis.
Based on those criteria, 16 scenarios from nine studies were selected that follow different
approaches in setting and reaching reduction targets:
► EU Energy Roadmap (2011): The EU Energy Roadmap illustrates different ways of reaching
an emission reduction of the EU energy system that is compatible with a GHG reduction
target of 80-95% below 1990 levels for the EU. Different strategies for lowering emissions
are highlighted in different target scenarios. In addition, a current policy initiatives scenario
shows development of emissions without additional efforts to mitigate.
Current Policy Initiatives scenario
1 At the time of analysis, available studies focused on a 2°C target and not the more ambitious targets formulated under the Paris Agreement. Applying more stringent climate targets such as 1.5°C would increase the need for early and very ambitious climate action compared to the studies analyzed in this study.

CLIMATE CHANGE Low-Carbon Europe 2050
16
High efficiency
High renewables
Delayed CCS
Low Nuclear
Diversified
► PRIMES baseline scenario for the EU: The PRIMES baseline scenario for the EU is updated
regularly and used as baseline for different modelling exercises on the EU as well as the MS
level. It does not assume reaching specific reduction targets above the level of already
implemented policies and EU targets. For this study, the most recent PRIMES baseline
scenario from 2016 was analyzed.
► Greenpeace Energy [r]evolution 2010/2015: The energy [r]evolution scenario for the EU
presents a way towards a 100% renewable energy system for the EU and the European
OECD member states, respectively. The analysis includes two scenarios from both studies:
Energy [r]evolution scenario
Advanced energy [r]evolution scenario
► Vision scenario for the EU (2018): The Vision Scenario for the European Union combines a
top-down analysis on a fair share of the EU in a global CO2 emissions budget that is
compatible with the 2°C limit for global warming with a bottom-up analysis on the emission
reduction trajectory that fits into such emissions budget for the EU.
► IEA World Energy Outlook 2016: The World Energy Outlook presents different scenarios for
the development of energy demand and supply along with energy-related emissions. Two
scenarios are included, one of which targets at limiting emissions to being compatible with a
2°C target.
New Policies Scenario
450 ppm
► Climate Policy Scenario 2050 for Germany: The study presents detailed analysis of
contributions of sectors to reducing GHG emissions in Germany. Levels of ambition of the
two scenarios included for the analysis vary between 80 and 95% reduction in GHG
emissions below 1990 levels.
KS80
KS95
► Deep Decarbonization Pathway Project for Italy:
Demand Reduction Scenario

CLIMATE CHANGE Low-Carbon Europe 2050
17
► Energy Scenario 2050 for Sweden
► Low Emissions Scenario for Poland
The modelling exercises that were considered in the comparison reflect different levels of
ambition with regard to greenhouse gas emission reductions. The analyzed scenarios can be
clustered as follows:
► Full decarbonization scenarios are the scenarios which achieve an emission reduction of
95% or more from 2010 to 2050 (the Advanced energy [r]evolution scenario for Europe, the
Vision Scenario for the EU, the KS95 scenario from the Policy Scenarios 2050 project for
Germany);
► Deep decarbonization scenarios are the scenarios which model emission reductions of 80 to
90% from 2010 to 2050 (the High Efficiency, High Renewables, Delayed CCS, Low Nuclear
and Diversified from the Energy Roadmap 2050 for the EU, the energy [r]evolution scenario
for Europe, the 450ppm Scenario from the World Energy Outlook 2016 for the EU, the KS80
scenario from the Policy Scenarios 2050 project for Germany, the Demand Reduction
Scenario from the Deep Decarbonization Project for Italy, and the Energy Scenario 2050 for
Sweden);
► Low emission scenarios are the scenarios which result in emission reductions in the range of
55 to 65% (the New Policies Scenario from the World Energy Outlook 2016 for the EU, the
Low Emissions Scenario for Poland);
► Policy-as-usual scenarios are the scenarios, which are built on the existing policies (the
Current Policy Initiatives scenario from the Energy Roadmap 2050 for the EU, the Primes
Baseline scenario for the EU).
The emission trajectories of the target-driven scenarios are normative in terms of end-year or
interim targets, but they also reflect political considerations as well as considerations on lifetime
of capital stocks and/or assumptions on innovation trajectories etc. However, the majority of the
scenarios analyzed in the comparison presented not based explicitly on a global temperature
limit or a budget approach. The comparison with the Vision Scenario, which is explicitly based
on a 2°C-compatible emission budget approach can, however, be used to derive some indication
on whether or not the scenarios could be compatible with an overarching climate constraint like
the 2°C limit.
The comparative analysis of scenario studies aims on the one hand at identifying reduction
contributions of different sectors or levers to the aggregate emission trajectory and on the other
hand at an assessment of the underlying driving forces. Against this background, the
methodological approach of a decomposition analysis is applied to the broad range of scenarios
selected. The starting point for the decomposition analysis is the methodology developed by
Kaya (Kaya/Yokobori 1997), on the basis of which the energy-related CO2 emissions can be
described as the product of (1) a driving force described by an activity variable (e.g. gross
domestic product), (2) the energy intensity given by the mean energy use per activity, and (3)
the sectoral carbon intensity given by the mean carbon emissions per energy used. In a second
step, the latter is further decomposed in the shares of the different energy carriers and the fossil
carbon intensity (see Annex A1 for detail on the methodology)

CLIMATE CHANGE Low-Carbon Europe 2050
18
The decomposition analysis includes – where possible – an analysis of aggregate results (based
on total energy-related CO2 emissions and primary energy use) along with a detailed analysis of
sector results. The sectors included are:
► Electricity sector
► Industry sector
► Residential sector
► Tertiary sector
► Transport, where possible differentiated by freight and passenger transport.
Individual driving forces included in the sector analysis are:
► Aggregate: gross domestic product (GDP) in constant monetary values;
► Electricity sector: electricity generation in terms of energy (in the business as usual trend);
► Industry and tertiary sector: value added in constant monetary values;
► Residential sector: number of households;
► Freight and passenger transport: total freight distance in ton-kilometers and total passenger
distance in person-kilometers.
The analysis covers the periods 2010–2030 and 2010–2050. The inclusion of further sectors,
other disaggregation of sectors or different driving forces was not possible due to limited data
availability in the different studies.
For each of the abatement levers, the figures show their contribution to the total emission
reduction relative to 2010, according to the concrete approach to the index decomposition
described in Annex A1. The individual levers are:
► Driving force and demand reduction: change of the chosen driving force in a baseline
scenario and in the evaluated scenario relative to the baseline;
► Energy efficiency: change of the energy used per activity level of the driving force;
► Electricity/heat/renewables/power-to-gas (PtG)/power-to-liquids (PtL)/nuclear: change of
the energy carrier’s share in the energy mix;
► CO2 intensity and CCS: change of the carbon emitted per fossil energy due to fuel switch and
application of CCS respectively.

CLIMATE CHANGE Low-Carbon Europe 2050
19
3 Comparison and synthesis This section provides a comparison and synthesis for the different scenarios analysed. Detailed
analyses of the individual studies can be found in the Annex.
3.1 Aggregate and sectoral emission trajectories
The analysis of the trajectories of aggregate energy-related CO2 emissions with a view to the
changes during the first 20 years from 2010 to 2030 compared to the 40 years from 2010 to
2050 indicates some similarities as well as some differences:
► Most of the target-driven scenarios (all full and deep decarbonization scenarios except those
from the EU Energy Roadmap 2050), with emission reductions of 70% and more by 2050
(compared to 2010), achieve 50% to 60% of the total emission reductions from 2010 to
2030. These scenarios thus achieve a more than proportional share of emission reductions in
the first half of the 40 years period.
► The only outliers in this regard are the scenarios from the EU Energy Roadmap 2050. In
these scenarios typically 40% of the total emission reduction effort for the phase from 2010
to 2050 materializes by 2030 and thus the smaller part.
► The low-emission scenario for Poland (total emission reduction by 2050 of 57%) indicates a
comparatively low emission reduction during the phase from 2010 to 2030 of only 22%.
► For the EU-wide policy-as-usual scenarios (with total emission reductions from 2010 to
2050 ranging from 35 to 57%) between 58% and 64% of the emission reductions are
achieved from 2010 to 2030.
Most of the modelling exercises for the EU and the deep decarbonization scenarios without
emission budget constraints show disproportionately high emission reduction efforts in the first
half of the scenario period. However, only a narrow range of scenarios can be assessed as
compatible to the global 2°C limit. Typically these scenarios reach a full decarbonization by
2050, and deliver at the same time CO2 emission reductions of 50% or more from 2010 to 2030.
A closer look to the sectoral emission trends discloses additional valuable insights into
particular sector specifics:
► The emission reductions achieved in the electricity sector are typically 8 to 15 percentage
points higher than for the overall reduction efforts from 2010 to 2050. The only exceptions
here are the full decarbonization scenarios where all sectors need to be fully decarbonized
by 2050 and thus almost no differences between the sectors can remain. For the period from
2010 to 2030 the emission reductions from the electricity sector are consistently
significantly higher than for the overall emission trends (between 10 and 25 percentage
points).
► For most deep decarbonization scenarios, the emission reductions from industry are
disproportionally low, typically between 10 and 20 percentage points below the aggregate
emission trends for both phases, from 2010 to 2030 and 2010 to 2050. The only exception
here is the full decarbonization scenario for Germany, which considers CCS for CO2

CLIMATE CHANGE Low-Carbon Europe 2050
20
emissions from industry. As a consequence, the emission reduction from industry for the
period from 2010 to 2030 is disproportionally low compared to the emission mitigation
during the subsequent two decades.
► The emission reduction trajectories for the tertiary sector are generally in line with the
aggregate emission trends during the course of the period from 2010 to 2030 and from 2010
to 2050.
► The trajectories for emissions and emission reductions for the residential sector are mixed.
In the EU Energy Roadmap 2050 scenarios, the emissions from the residential sector follow
more or less the same patterns than the aggregate emissions. The country scenarios for
Germany and Italy show higher than total emission reductions by 2030 and 2050 (again with
the exception of the full decarbonization scenario for Germany).
► The emission trajectories for the transport sector show in nearly all scenarios
disproportional emission reductions compared to the aggregate emission trends.
Furthermore, most scenarios indicate lower shares of emission reductions from 2010 to
2030 than for 2030 to 2050. Only the Greenpeace scenarios result in approximately the same
reduction effort from 2010 to 2030 and 2030 to 2050.
In summary most of the scenarios indicate the opportunity of early emission reductions at a
significant scale for the electricity sector, long innovation lead-times for transformative emission
reductions in the transport sectors and very heterogeneous emission reduction trajectories for
the industry and the residential sectors.
3.2 Sectoral contributions
The analysis of the sectoral contributions to the overall emission reductions shows strong
similarities for the EU-wide scenarios:2
► For the period from 2010 to 2030 (Fehler! Verweisquelle konnte nicht gefunden
werden.)3
the emission reductions from the electricity sector range from 50 to 60%;
the emission reductions from the industry range from 15 to 25% and differ not that
much from the policy-as-usual trajectories;
the emission reductions from the tertiary sectors range from 30 to 40%;
the emission reductions from the residential sector range from 30 to 40%;
the emission reductions from the transport sectors range from 15 to 25%.
► For the period from 2010 to 2050 (Figure 2)
2 The decomposition analysis presented in this study is based on emission trends starting in 2010 and not in 1990 due to the availability of consistent historical data.
3 The figure shows the full sample of scenarios to allow the identification of robust corridors for the emission reduction contributions from different sectors. The dotted lines mark scenarios that can be characterized as business as usual, the continuous lines mark scenarios from the cluster of deep decarbonization scenarios and the broken lines mark full decarbonization scenarios.

CLIMATE CHANGE Low-Carbon Europe 2050
21
the emission reductions from the electricity sector amount to 90% and more;
the emission reductions from the industry range from 60 to 70%;
the emission reductions from the tertiary sectors range from 80 to 90%;
the emission reductions from the residential sector range around 85%;
the emission reductions from the transport sectors range from 60 to 90%.
Figure 1: Sectoral contributions to total emission reductions, 2010–2030
Source: Calculations by Öko-Institut
Figure 2: Sectoral contributions to total emission reductions, 2010–2050

CLIMATE CHANGE Low-Carbon Europe 2050
22
Source: Calculations by Öko-Institut
For scenarios with a focus on national emission trajectories and partly deeper emission
reductions, some specifics should be noted:
► For the scenario on Italy, the deep emission cuts in the residential sector for the period from
2010 to 2030 are remarkable, also the disproportionally low emission reductions in the
transport and the industry sectors for the period from 2010 to 2050;
► The full decarbonization scenario for Germany is characterized by more than proportional
emission reductions in the transport and the industry sectors compared to the KS80
scenario (emission reduction of 80%).
3.3 Contribution of emission reduction levers
The decomposition analysis provides also the possibility to compare the different emission
reduction levers between the scenarios. For this purpose, the results of the single decomposition
analysis exercises were normalized to the driving forces to enable a robust inter-scenario
comparison4, presented here from both an aggregate and a sectoral perspective.
Aggregate perspective
Figure 3 and Figure 4 indicate the contributions of the different emission reduction levers to the
total emission reduction from 2010 to 2030 and 2010 to 2050:
► The comparison shows the significant differences with regard to the driving forces, i.e. the
growth of gross domestic product. The driving forces range from 10 to 6035% for the period
2010 to 2030 and 10 to 60% for the period from 2010 to 2050. The scenarios with the lower
driving forces are essentially the country scenarios for Germany and Italy.
► Typically, the contribution of primary energy productivity is the stronger the stronger the
driving forces are. This is due to the enhanced potential for energy efficiency in a system
with higher activity. This might be a key explanation for the broad diversity of its
contributions to the total emission reductions.
► The strongest diversity can be observed for the emission reduction contributions from
renewable energies. Renewables can therefore be seen as a reliable marker for differences
between the scenarios.
► The contributions from a transition to fossil fuels with lower CO2 emissions is significant in
2030 as well as in 2050. In the full decarbonization scenarios, the emission increasing lever
results essentially from the fact that the remaining CO2 emissions (at very low levels) result
from fuel oil use in the sectors where some fossil fuel use remains (inland navigation etc.).
► CO2 capture and storage (CCS) plays a role only in a few scenarios. Even in the respective
scenarios there is no significant emission reduction contribution for the period from 2010 to
4 See section A 1 for the detailed methodology and its implications for the comparison of different driving forces and emission abatement levers.

CLIMATE CHANGE Low-Carbon Europe 2050
23
2030 and only a range of contributions that is 20% or less of total the reduction effort
between 2010 and 2050.
► In nearly all scenarios, the role of nuclear energy decreases and constitutes a lever that
drives emissions and needs to be compensated by other emission abatement levers. In the
most ambitious nuclear scenarios, nuclear energy maintains its contribution to the emission
reduction efforts, in most of the other scenarios nuclear phase out is a driving force of up to
20% of the base year emissions.
Last but not least it should be mentioned that the profile of emission abatement levers for the
Swedish scenario is characterized by the specific starting point of the country (high share of
imports, significant shares of hydro and nuclear energy) and its general trends towards
significantly less electricity generation from nuclear and much less electricity imports. The
specifics of the scenario for Poland result from the significantly higher economic growth (which
is the key driving force for emissions) and the lower ambition on the use of renewable energy
sources.
Figure 3: Contributions of the different emission levers to the total emission reductions, 2010–2030
Source: Calculations by Öko-Institut

CLIMATE CHANGE Low-Carbon Europe 2050
24
Figure 4: Contributions of the different emission levers to the total emission reductions, 2010–2050
Source: Calculations by Öko-Institut
Electricity sector
The electricity sector as the most significant single CO2 emission source for most of the
jurisdictions mirrors most of the emission levers at the aggregate emission levels.
Figure 5 and Figure 6Fehler! Verweisquelle konnte nicht gefunden werden. show the
emission lever contributions to the total emission reductions for the electricity sector.
► For most of the scenarios the driving forces for the electricity sector, i.e. electricity
consumption before additional electricity savings but also before the effects from additional
electrification, are more moderate and amount at the maximum to 20% in 2030 and 30% in
2050.
► For the time horizon 2030, electricity savings (“energy efficiency”) contribute significantly to
emission reductions (up to 20% of base year emissions) but turn back to be no longer an
emission abatement lever by 2050. This is due to the increasing role of electrification in
other sectors in later years. In 2050, the demand change is a more neutral lever compared to
the base year emissions, i.e. additional electricity savings are compensated by the additional
demand from stronger electrification efforts.
► The switch to low-CO2 fossil fuels (“CO2 intensity”) contributes with up to 20% in 2030,
ranging from 0% to 20%. For 2050 this range does not narrow significantly, the median is,
however, shifted a bit more to the 0% level.
► The biggest range of emission reduction contributions can be found for renewables, which
carry between half and almost the full emission reduction in the electricity sector. Against
the reverse contributions of increasing demand and less use of nuclear, the contribution of

CLIMATE CHANGE Low-Carbon Europe 2050
25
renewables to the emission reduction effort can amount to more than 80% of the base year
emissions in the high-renewables scenarios.
► CCS in the electricity sector is only an option in a few scenarios and plays almost no role for
the period from 2010 to 2030. For 2050, the reduction effort amounts to 50% of the total
emission efforts at the upper part of the scenario range. For scenarios that allow for CCS in
the electricity sector but set no special focus on this emission reduction lever, the abatement
contributions are around 25% of base year emissions.
► The use of nuclear energy is neutral with regard to additional emission abatement only in
the “high-nuclear” scenario (titled “Delayed CCS”). In all other scenarios, the decreasing role
of nuclear drives the emission levels and other emission abatement levers (renewables or
CCS) fill the gap.
Figure 5: Contributions of the different emission levers to the emission reductions in the electricity sector, 2010–2030
Source: Calculations by Öko-Institut

CLIMATE CHANGE Low-Carbon Europe 2050
26
Figure 6: Contributions of the different emission levers to the emission reductions in the electricity sector, 2010–2050
Source: Calculations by Öko-Institut
► Electricity imports or electricity generation based on imported synthetic fuels (PtG/PtL)
play nor or only minor roles for emission abatement in the electricity sector for both time
frames.
Industry sector
The patterns of levers that reduce emissions and levers that drive emissions are much more
diverse for the industry sectors in the different scenarios for the EU or single member states.
Figure 7 and Figure 8 highlight the different emission levers to emission reductions in the
industrial sectors:
► There are major differences between the different scenarios with regard to the assumptions
on how the industrial sectors grow from 2010 to 2030 and the subsequent two decades. The
highest assumptions on economic growth in the industrial sectors here can be observed for
the EU-wide projections whereas the driving forces in the projections for Germany and Italy
differ significantly from these levels.5 Overall, the economic growth in industry represents an
increasing contribution to industrial emissions (if all other factors would not change)
between approx. 10 and 30% in the period from 2010 to 2030 and 10 to 60% from 2010 to
2050.
► The contribution of energy efficiency in the industrial sectors depends on the one hand again
on the assumptions on economic growth. The contribution to CO2 mitigation differs,
however, significantly for scenarios with almost identical assumptions on industrial growth
5 This situation results for some scenarios from specific issues of data availability. In the scenarios for Germany and Italy, changes occur in terms of production volumes but there is no recalculation into value added terms, which are used as the basis in the decomposition analysis.

CLIMATE CHANGE Low-Carbon Europe 2050
27
and range here from 60 to 80% of the base year emissions. The highest ambition with regard
to industrial energy efficiency can be observed for the two IEA scenarios.
► The switch to less CO2-intensive fossil fuels plays a limited role by 2030 but represents
emission levers of 0 to 20% for the period from 2010 to 2050. For most scenarios, this lever
arrives at a level of approx. 10% in 2050.
Figure 7: Contributions of the different emission levers to the emission reductions in the industry sectors, 2010–2030
Source: Calculations by Öko-Institut

CLIMATE CHANGE Low-Carbon Europe 2050
28
Figure 8: Contributions of the different emission levers to the emission reductions in the industry sectors, 2010–2050
Source: Calculations by Öko-Institut
► The most significant variations result again for the direct use of renewables in the industrial
sectors. In most scenarios beyond the policy-as-usual projections renewables deliver an
emission reduction effort of up to 30% (of base year emissions) in 2030 and up to 40% by
2050, with a main cluster of 10% in 2030 and 30% in 2050. The advanced energy
[r]evolution scenario is an outlier here, because the emission abatement lever of direct use
of renewables reaches 80% of base year emissions in the period from 2010 to 2050.
► The contribution of electrification is in the range of 0 to 10% in 2030 (apart from the outlier
in the decarbonization scenario for Italy) and around 30% in full decarbonization scenarios
by 2050 i.e. the KS95 scenario for Germany, the Vision Scenario for the EU and the advanced
energy [r]evolution scenario, with the remaining scenarios reaching a contribution of
around 10% in 2050.
► Electricity-based fuels (i.e. hydrogen) play only a significant role in the Vision Scenarios
beyond 2030 (emission abatement lever of 20%) due to its full decarbonization approach
and the assumption on a very limited availability of sustainable biomass.
► A broad variety of emission levers results for the use of heat which ranges from +10%
to -20% in 2030 and from +10% to -20% in 2050.
► CCS only plays a minor role in the full decarbonization scenario for Germany in 2050.
Different to the industrial sector, the patterns of determinants for CO2 emission trends for the
tertiary sector from 2010 to 2030 as well as from 2010 to 2050 differ much less but show
significant differences for single emission levers.

CLIMATE CHANGE Low-Carbon Europe 2050
29
Figure 9 and Figure 10Fehler! Verweisquelle konnte nicht gefunden werden. indicate the
variety of emission reduction contributions for the tertiary sector6:
► The range of driving forces for the tertiary sector in the different scenarios is significant. The
key differences occur between the EU-wide scenarios and the country-specific projections
for Germany and Italy. Whereas the economic growth in the tertiary sectors represents a
driver for emissions growth of about 35% from 2010 to 2030 it represents a contribution of
almost 60% from 2010 to 2050. For Germany and Italy, the contribution of economic growth
in the tertiary sectors ranges from 10 to 20% in the period from 2010 to 2030 and from
2010 to 2050.
► The contribution of increased energy efficiency in the tertiary sector mirrors again the
assumptions on economic growth on the one hand. On the other hand, it differs (slightly)
among the EU-wide scenarios as well as the two scenarios for Germany. In all scenarios, the
energy efficiency lever at least offsets the contribution from economic growth.
► With regard to the emission reduction contributions from the direct use of renewables the
range between the scenarios is comparatively small for the period from 2010 to 2030. The
lever here presents an emission reduction contribution of approx. 10% of the base year
emissions. For 2050, two clusters can be identified: one group of scenarios sees emission
reduction contributions around 20% of base year emission and another group sees
significantly higher contributions that amounts to approx. 40%.
► A part of the differences with regard to direct use of renewables can explained by the
different results on the emission reduction contributions from electrification. For 2030, the
range here is from 10 to 20% of base year emissions and for 2050 from 15 to 45%. Typically,
the scenarios with lower emission reduction contributions from direct use of renewables
envisage higher contributions from electrification. The only exemptions here are the deep
decarbonization scenario for Italy and the full decarbonization scenario for Europe as
outlined in the Vision Scenario. Electrification represents an emission abatement lever of
about 70% by 2050.
► Quite similar patterns can be observed for the contributions from heat supplies to the
tertiary sectors.
► As for the industrial sectors the Vision Scenario for the EU shows as the only scenario very
significant contributions from hydrogen as a form of PtG (emission abatement lever of more
than 50%).
6 The Advanced energy [r]evolution scenario, the energy [r]evolution scenario as well as the WEO 2016 scenarios do not provide disaggregated data for the tertiary and the residential sectors.

CLIMATE CHANGE Low-Carbon Europe 2050
30
Figure 9: Contributions of the different emission levers to the emission reductions in the tertiary sectors, 2010–2030
Source: Calculations by Öko-Institut
Figure 10: Contributions of the different emission levers to the emission reductions in the tertiary sectors, 2010–2050
Source: Calculations by Öko-Institut
► The other levers (CCS, synthetic fuels, nuclear) play no role for the tertiary sectors.

CLIMATE CHANGE Low-Carbon Europe 2050
31
Residential sector
The differences with regard to the different emission abatement levers for the residential sector
are clearly visible for the period from 2010 to 2030 and even more significant for the time span
from 2010 to 2050.
Figure 11Fehler! Verweisquelle konnte nicht gefunden werden. and Figure 12 show the
different contributions to emission increases and emission reductions for the periods from 2010
to 2030 and 2010 to 20507:
► Different to the industrial and the tertiary sectors, the underlying growth trends play a much
less significant role for the residential sector. The driving force is here essentially the
increase of living space. Again, the driving force for the EU-wide projections (around 10%) is
significantly higher than for the country scenarios for Italy and Germany (almost constant).
► The role of energy efficiency is significant in all scenarios and ranges from 20 to 35% for the
period from 2010 to 2030 and from 25 to 35%, mainly around 30%, from 2010 to 2050. The
interrelations between the emission reduction contributions from energy efficiency and
direct use of renewable energy sources or electrification are significantly lower than for the
tertiary sector.
► The emission reduction contributions from direct use of renewables differ significantly
between the two time horizons on the one hand and for the different jurisdictions. For the
period from 2010 to 2030, three clusters exist. A subset of the EU-wide scenarios show an
emission reduction contribution of 5% for the time span from 2010 to 2030. Other EU-wide
scenarios and the 80% reduction scenario for Germany show a 10% contribution and the
deep decarbonization scenario for Italy as well as the 95% reduction scenario for Germany
show a 15% contribution. For 2050, the patterns differ much more significantly. The High
Renewables Scenario shows an emission reduction of 40%, the other EU-wide scenarios and
the projection for Italy show a contribution of 30% and the two scenarios for Germany show
a contribution of approx. 15% emission reduction.
7 The Advanced energy [r]evolution scenario, the Energy [r]evolution scenario as well as the WEO 2016 scenarios do not provide disaggregated data for the tertiary and the residential sectors.

CLIMATE CHANGE Low-Carbon Europe 2050
32
Figure 11: Contributions of the different emission levers to the emission reductions in the residential sector, 2010–2030
Source: Calculations by Öko-Institut
Figure 12: Contributions of the different emission levers to the emission reductions in the residential sector, 2010–2050
Source: Calculations by Öko-Institut
► The contributions from electrification in the residential sector in most of the EU-wide
projections, the scenario for Italy and the 95% reduction scenario for Germany range from
30 to 35%. In the 80% reduction scenario for Germany, this contribution is much lower and
amounts to approx. 20%. Only for the Vision Scenario for the EU electrification represents a
higher emissions abatement lever of more than 20% by 2030 and more than 40% by 2050.

CLIMATE CHANGE Low-Carbon Europe 2050
33
► The range of contributions from heat supplies to the residential sector is significant but
interferes partly with the contributions from electrification. In the EU-wide scenarios and
the projection for Italy, the role of heat supplies is very low, but it is significant for the
scenarios for Germany (15 to 25%) at least for 2050.
► A more than marginal contribution from hydrogen (PtG) is only modelled in the Vision
Scenario for the EU with an emission abatement lever of approx. 5% by 2030 and 10% by
2050.
Transport sector
The transport sector is the sector with the most homogenous starting position. Energy
consumption and carbon emissions are currently dominated by petroleum products. The range
of future trajectories might be very different in terms of technology and also might differ
significantly for the passenger transport on the one hand and freight transport on the other
hand.
Figure 13 and Figure 14 highlight the different patterns in the scenarios and their evolution over
time8:
► The driving forces differ again significantly for the EU-wide scenarios on the one hand and
the projections for Italy and Germany on the other hand. The growth of transport activity
(before transport avoidance) amounts to more than 25% for the EU-wide scenarios and
levels around 15% for Germany and Italy from 2010 to 2030. From 2010 to 2050, the
increasing transport activities grow by almost 40% for the EU-wide scenarios and by 10 to
15% for Germany and Italy.
Figure 13: Contributions of the different emission levers to the emission reductions in the transport sectors, 2010–2030
8 The WEO 2016 scenarios do not provide disaggregated data for the transport sector.

CLIMATE CHANGE Low-Carbon Europe 2050
34
Source: Calculations by Öko-Institut
Figure 14: Contributions of the different emission levers to the emission reductions in the transport sectors, 2010–2050
Source: Calculations by Öko-Institut
► Demand change (avoidance of transport) plays a significant role only for Italy (emission
reduction contribution of 15%) and there especially in the long term.
► The contributions of energy efficiency again mirrors the growth of transport activity and
ranges from 30 to 50% for the period from 2010 to 2030 and 30% to 60% for the period
from 2010 to 2050. These reductions contain the efficiency gains due to the switch from
vehicles with combustion engines to electric vehicles, while only the fuel switch itself is
accounted for under electrification.
► The contributions from the direct use of renewables in the transport sectors is very low in all
scenarios from 2010 to 2030 (5% or less). For the period from 2010 to 2050, the EU-wide
scenarios and the scenario for Italy rely on significant contributions (20 to 25%) from direct
use of renewables (mainly biofuels). The contribution of this lever to emission reductions is
very low in the projection for Germany.
► A comparison between the different projections shows that the lower the contribution from
biomass (i.e. the direct use of renewable energy sources) and the higher the emission
reduction level is the higher the emission reductions attributable to electrification are. For
the three full decarbonization scenarios (Advanced energy [r]evolution, Vision Scenario and
KS95 for Germany), electric mobility provides emission abatement levers between 30 and
60% of base year emissions. For the other scenarios, electrification provides emission
reductions contributions of 10 to 20%.
CLIMATE CHANGE Low-Carbon Europe 2050
35
► A unique feature of the transport sector among the scenarios analysed here is the role of
electricity-based fuels (PtG/PtL: synthetic fuels, hydrogen etc.). For the three full
decarbonization scenarios, these new fuels represent emission reduction contributions that
amount to 30 to 45%. They become relevant only after 2030.

CLIMATE CHANGE Low-Carbon Europe 2050
36
4 Conclusions and lessons learned Being part of the project “Model low-carbon Europe 2050” the analysis serves to identify
important aspects for the development of the scenario “Low-carbon Europe 2050” and to
provide the context of the scenario developed within this project compared to other already
existing scenarios. This is the focus of this section, which is organized around some guiding
questions.
1. What emission levels are reached in the different studies and how do they relate to the EU’s
target of an 80-95% reduction below 1990 levels in 2050 and to the Paris Agreement’s
targets of limiting temperature increase to well below 2°C, aiming at 1.5°C and reaching net-
zero emissions in the second half of the 21st century?
The scenarios analyzed vary widely with regards to the emission levels reached by 2050. The
studies commissioned by the European Commission, except for the Primes Baseline scenario and
the current policy initiatives scenario from the EU Energy Roadmap aim at a reduction of 80%
below 1990 levels by 2050 and hence the lower end of the reduction range set by the EU.
Scenarios with similar targets can also be found for Germany, Italy, and Sweden as well as in the
World Energy Outlook 2016 (450 ppm scenario) and to some extent the Energy [r]evolution
scenario 2015. Lower reductions are reached in the policy-as-usual scenarios (current policy
initiatives scenario from the Energy Roadmap 2050, Primes Baseline scenario), but also in the
study for Poland and the new policies scenario from the World Energy Outlook 2016. Full
decarbonization scenarios (i.e. at least 95% reduction below 1990 levels by 2050) are
only represented by three scenarios: the German KS95, the Advanced energy [r]evolution
scenario 2015 and the Vision Scenario for the EU.
Most of the climate target scenarios reach the EU’s reduction range for 2050, however, none of
the scenarios under consideration reaches zero GHG emissions by 2050. Since our analysis
focuses on CO2 emissions from combustion of fossil fuels and processes only, it is unlikely that
this reduction level is sufficient to meet the Paris Agreement’s target of net-zero emissions
because a significant share of the non-CO2 emissions will remain and therefore will require a
complete phase-out of fossil fuels. However, strategies and technologies to move to net-zero,
such as CCS or the use of power-to-gas/power-to-liquid (PtG/PtL), have been integrated in more
recent full decarbonization scenarios. Increasing their share could make an additional
contribution to reach zero CO2 emissions. But, options to create net CO2 sinks will probably still
be needed to achieve net-zero CO2 emissions by 2050 and potentially net negative CO2 emissions
for the decades beyond 2050.
If full decarbonization (i.e. at least 95% reduction below 1990 levels by 2050) is achieved
by 2050, the emission reductions from 2010 to 2030 would amount to at least 50% by
2030. Except for the EU Vision Scenario, none of the scenarios is explicitly based on a carbon
budget approach. Hence, the compatibility with reaching the temperature goal(s) of the Paris
Agreement was only possible on the basis of very approximate comparisons. According to the
Vision Scenario emission trajectories in this range are compatible with the 2°C limit. For
reaching a 1.5°C target, the requirements for early and ambitious emission reductions are even
more pronounced.
Finally, the decomposition analysis showed that except for the EU Energy Roadmap scenarios,
the scenarios aiming at a reduction of 80% and more already show a significant amount of
reductions between 2010 and 2030, which has a positive effect on cumulative emission levels. In
contrast, in the scenarios of the EU Energy Roadmap 2050 only 40% of emission reductions are
achieved between 2010 and 2030, resulting in higher cumulative emissions. Scenarios with

CLIMATE CHANGE Low-Carbon Europe 2050
37
lower emission reductions than 80% by 2050 result in higher cumulative emissions (scaled to
EU levels) and are hence more unlikely to meet the temperature targets.
2. What sectors are the remaining emissions located in? What sectors appear to hold
significant challenges for decarbonization?
While in the full decarbonization scenarios the remaining emissions are strongly limited, both,
their figures for 2030 and the figures for 2050 in the deep decarbonization scenarios aiming at
80% give an indication of which sectors are particularly difficult to decarbonize.
The comparison of the different scenarios shows that emission reductions in the electricity
sector are significant; by 2050 emission reductions of 90% and more are reached in most
of the target scenarios. At the same time, electricity sector emission reductions by 2030 are
already quite significant (50–60%).
In contrast, transport and industry show limited reductions in 2030 in almost all scenarios
and still have significant emission levels left in the 80% scenarios in 2050. In the full
decarbonization scenarios, CCS or PtG/PtL are used to limit the remaining emissions in these
sectors.
Finally, it should be noted that greenhouse gas emission reductions in the agriculture sector are
constraint significantly on the one hand (e.g. for methane and nitrous oxide). On the other hand,
ambitious climate policy strategies also need to consider the potentials of agriculture and
forestry to create net CO2 sinks, which were not reflected in the analysis carried out in this study
on energy-related CO2 emissions.
3. What reduction levers are used in the different scenarios?
When analyzing overall emission reductions by decomposition analysis, the impact from driving
forces (i.e. demographic trends or economic activities that usually drive emissions up) get
obvious. Primary energy productivity, renewables, partly nuclear, CCS and imports of carbon-
free fuels drive emission levels down. In the electricity sector, the use of renewables is the key
driver, with nuclear having an increasing effect in those scenarios where its share is reduced or
even phased-out. CCS use in the electricity sector is very limited in the scenarios, having a strong
decreasing effect on emissions only in those scenarios from the EU Energy Roadmap 2050
where CCS use is not excluded or tightly restricted.
In the industry sector, the development of emissions in the different scenarios is driven by
development of the economic activity, energy efficiency, use of renewables, electricity and heat.
Along with differences in remaining emission levels, strategies for reducing emissions vary
significantly between scenarios. While energy efficiency improvements are important in all
scenarios, but with varying contributions, the impact of renewables, electricity and heat are
more heterogeneous. Among the full decarbonization scenarios, the KS95 uses a significant
amount of renewables (in particular biomass) along with contributions from electricity and heat
and a small amount of CCS for reducing emissions down to almost zero. In contrast, the Energy
[r]evolution scenario assumes even more contributions from energy efficiency and a less
significant contribution from direct use of renewables. In addition to this, the Vision Scenario
considers significant contributions from electricity-based fuels (PtG/PtL), essentially hydrogen
from domestic production and synthetic or other (“novel”) motor fuels that are imported to
Europe.
In the tertiary and the residential sector, the activities along with energy efficiency, electricity
use and partly renewables are the main factors for the development of emissions. While energy
efficiency in these sectors is important in all scenarios, the impact of renewables and electricity
differs. For the tertiary sector, there is a tendency to use electricity for decarbonization of heat
CLIMATE CHANGE Low-Carbon Europe 2050
38
supply instead of renewables. For the residential sector, similar effects can be found, however,
renewables play a more important role compared to the tertiary sector.
For the transport sector, its activity, energy efficiency, renewables, electricity and – newly –
PtG/PtL (including hydrogen) are important drivers for the development of emissions. The use
of electricity varies in accordance with the reduction level and the demand for transport. In
addition, those scenarios that reach emission reduction levels of 95% and more also use a
significant share of power-to-gas/power-to-liquid to decarbonize the transport sector (German
KS95; the advanced energy [r]evolution 2015; and the Energy [r]evolution 2015 scenario). In
contrast, the 80% scenarios from the Energy Roadmap 2050 use a significant amount of biofuels
to reduce emissions in the transport sector.
In summary, unlike the majority of global scenarios, most of the full decarbonization scenarios
(as defined in this report) do not achieve the additional emission reductions by compensating
the residual emissions in net sinks (i.e. additional efforts in agriculture or forestry) or by CCS
based on bio-energy (BECCS). Instead, the full decarbonization scenarios use additional
mitigation options in energy end-use sectors (energy efficiency, electrification, PtG/PtL). The
availability of these levers is of crucial importance and necessary for the design of a long-term
strategy for achieving net-zero emissions in the EU but probably not sufficient. Additional levers
that create net CO2 sinks are an essential element of strategies that target net-zero emissions.
4. How much do assumptions on emission abatement levers determine the outcome of the
scenarios and what role play system boundaries?
Target emission levels are not the only parameter that determines the scenario outcome.
Another important factor is the scope of the scenarios. The emissions (i.e. industrial process
emissions along with energy-related emissions) as well as the sectors (international and
domestic aviation and maritime shipping) included determine to a large extent the reduction
potential available. The reduction of process emissions requires either changes in consumption
patterns and materials used or the use of technologies such as CCS. Aviation and maritime
shipping are growing sectors where direct use of electricity as mitigation option is limited, thus
other mitigation options such as PtG/PtL need to be considered. With regard to PtL it should be
noted that the needed climate-neutral fuels could be electricity-based but also could result from
not yet foreseeable breakthroughs with regard to completely new generations of sustainable
biofuels. As the share of these “novel fuels” (from whatever sources) will be required
significantly beyond 2030, “novel fuels” should be considered as a wildcard for highly innovative
fuels that still do require a broad range of innovation efforts.
Along with the scope of the respective studies, the assumptions made when designing the
scenarios are the most important factors for the results. A good example is CCS, which is allowed
in the KS95 scenario and hence applied to reduce process emissions in the German industry
sector, while this option does not feature in the KS80 scenario and hence emission levels in the
industry sector remain significantly above zero. A similar example is the use of nuclear for
electricity generation, which can contribute to emission reductions but the application of this
technology is highly depending on political targets (e.g. KS80/KS95, Energy Roadmap 2050 low
nuclear, Energy Roadmap 2050 high renewables). Similarly, the use of biomass can be restricted
due to political reasons, resulting in other mitigation options being required for the transport or
industry sector.
5. What can be learned from the results of the analysis for the development of a scenario “Low-
carbon Europe 2050”?

CLIMATE CHANGE Low-Carbon Europe 2050
39
The Low-carbon Europe 2050 scenario should at least try to reach the goal of (nearly) net-zero
emissions. Such a scenario would provide further insights compared to the scenarios already
out there for the EU. This is particularly relevant for the partially unavoidable non-energy-
related emission sources in agriculture, waste and possible emission sinks in the land use
sector9, but also for the transport and industry sector, where the majority of scenarios does not
reach a complete decarbonization.
To provide a relevant assessment reference for the discussions under the Paris Agreement, i.e.
aiming at net-zero emissions around mid-century the scenario needs to cover all relevant
sectors and greenhouse gases. That includes in particular methane and N2O from agriculture,
where technological emission reduction options are limited and a significant amount of
emissions will remain. It further includes the aviation and shipping sector, for which direct use
of electricity is a mitigation option only to a limited extent and other options are needed such as
climate-neutral synthetic fuels (PtG/PtL) or biofuels. Also waste treatment is important to
address – due to the persistence of the emission source – though emission levels are significantly
lower compared to other sectors. On the other hand, it includes an assessment of sinks from the
land-use, land-use change and forestry.
While the strategy for decarbonization seems to be rather clear for some sectors, e.g. the
electricity and transport sector, scenarios for other sectors, i.e. industry, still vary significantly,
which indicates that different decarbonization strategies may be possible. Focusing on these
sectors with yet undecided decarbonization strategies and assessing the different key
strategies during the scenario development, taking into account interlinkages between sectors
along with the European perspective can be a key contribution of the scenario “Low-carbon
Europe 2050”.
The assumptions made in the modelling process determine to a large extent the solution space
and the scenario derived. Assumptions (e.g. use of CCS/exclusion of CCS, use of biomass,
assumptions on main drivers such as GDP, production, …) made should therefore be
transparent and well-argued.
The use of PtG/PtL in the transport and other sectors depends strongly on supply options of
synthetic fuels (PtG/PtL). In contrast to the direct use of electricity, PtG/PtL production requires
besides significantly higher electricity supplies climate-neutral carbon sources if it goes beyond
the use of hydrogen. These challenges need to be addressed transparently.
9 These sectors were not included in this analysis as not all studies analyzed cover those sectors

CLIMATE CHANGE Low-Carbon Europe 2050
40
5 References Bukowski, M.; Gaska, J.; Jackl, F.; Kassenberg, A.; Pankowiec, A.; Sniegocki, A. et al. (2013): 2050.pl the journey
to the low-emission future. Available online at http://np2050.pl/files/pliki/raport_low-
emission_poland_2050.pdf, last accessed 19 October 2017.
European Commission (2016): EU Reference Scenario 2016 – Energy, transport and GHG emissions. Trends to
2050. Available online at https://ec.europa.eu/energy/en/data-analysis/energy-modelling.
European Commission (2011): Energy Roadmap 2050. Impact Assessment. Part 2/2. SEC(2011) 1565. Available
online at https://ec.europa.eu/energy/sites/ener/files/documents/sec_2011_1565_part2.pdf, last accessed 10
March 2018.
Greenpeace (2010): Energy [R]evolution 2010. A sustainable world energy outlook. Available at
http://www.greenpeace.org/international/en/publications/reports/Energy-Revolution-A-Sustainable-World-
Energy-Outlook/, last accessed 22 Nov 2017.
Greenpeace (2015): Energy [R]evolution. A sustainable world energy outlook 2015. Available at
http://www.greenpeace.org/international/en/publications/Campaign-reports/Climate-Reports/Energy-
Revolution-2015/, last accessed 22 Nov 2017.
Gustavsson, M.; Särnholm, E.; Stigson, P.; Zetterberg, L. (2011): Energy Scenario for Sweden 2050. Based on
Renewable Energy Technologies and Sources. Available online at
http://www.wwf.se/source.php/1409709/Energy%20Scenario%20for%20Sweden%202050_bakgrundsrapport
%20IVL_sep%202011.pdf, last accessed 19 October 2017.
IEA (International Energy Agency) (2016): World Energy Outlook 2016. Paris. Available at
https://www.iea.org/bookshop/720-World_Energy_Outlook_2016, last accessed 22 Nov 2017.
Kaya, Y, Yokobori, K. (Eds.) (1997): Environment, Energy, and Economy: strategies for sustainability. United
Nations University Press: Tokyo, New York, Paris.
Matthes, F. C.; Blanck, R.; Greiner, B.; Zimmer, W. (2018): The Vision Scenario for the European Union. 2017
Update for the EU-28. Report for the Greens/EFA Group in the European Parliament. Available online at
https://www.oeko.de/fileadmin/oekodoc/Vision_Scenario__EU-28-Report_2017.pdf, last accessed 10 March
2018.
Repenning, J.; Braungardt, S.; Ziesing, H.-J. et al. (2015): Klimaschutzszenario 2050: 2. Endbericht. Studie im
Auftrag des Bundesministeriums für Umwelt, Naturschutz, Bau und Reaktorsicherheit. Available online at
http://www.isi.fraunhofer.de/isi-wAssets/docs/x/de/projekte/Bericht_Runde_2.pdf, last accessed 19 October
2017.
Virdis, M. R.; Gaeta, M.; De Cian, E.; Parrado, R.; Martini, C.; Tommasino, M. C. et al. (2015): Pathways to deep
decarbonization in Italy. Available online at http://deepdecarbonization.org/wp-
content/uploads/2015/09/DDPP_ITA.pdf, last accessed 19 October 2017.