climate change – 1: background. processes earth’s annual global mean energy balance ar4, wgi,...
TRANSCRIPT
Climate Change – 1: Background
Processes
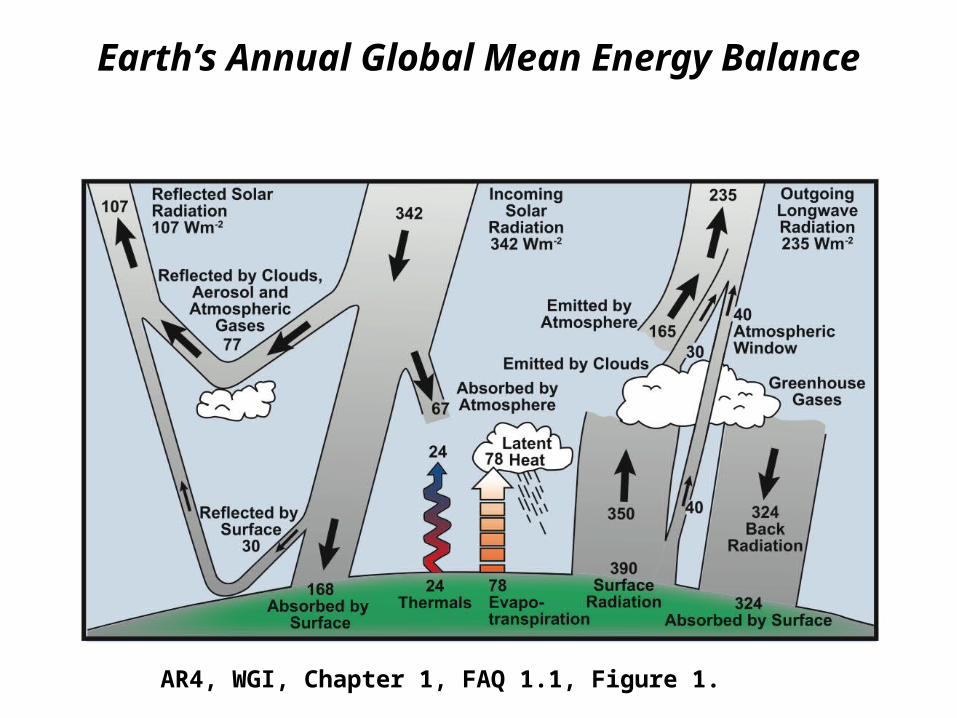
Earth’s Annual Global Mean Energy Balance
AR4, WGI, Chapter 1, FAQ 1.1, Figure 1.
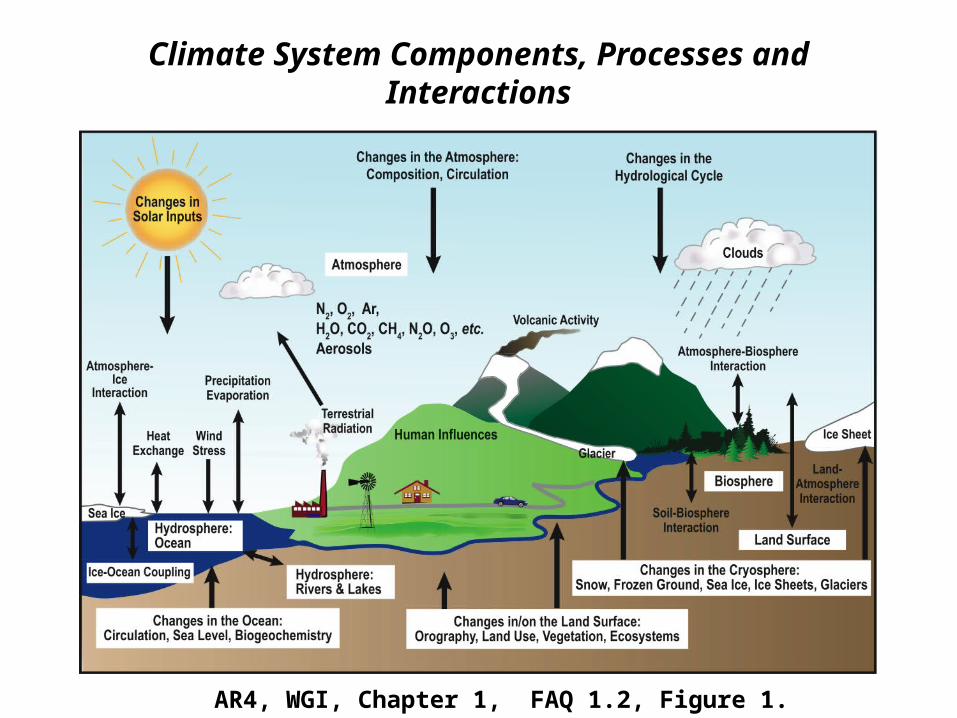
Climate System Components, Processes and Interactions
AR4, WGI, Chapter 1, FAQ 1.2, Figure 1.
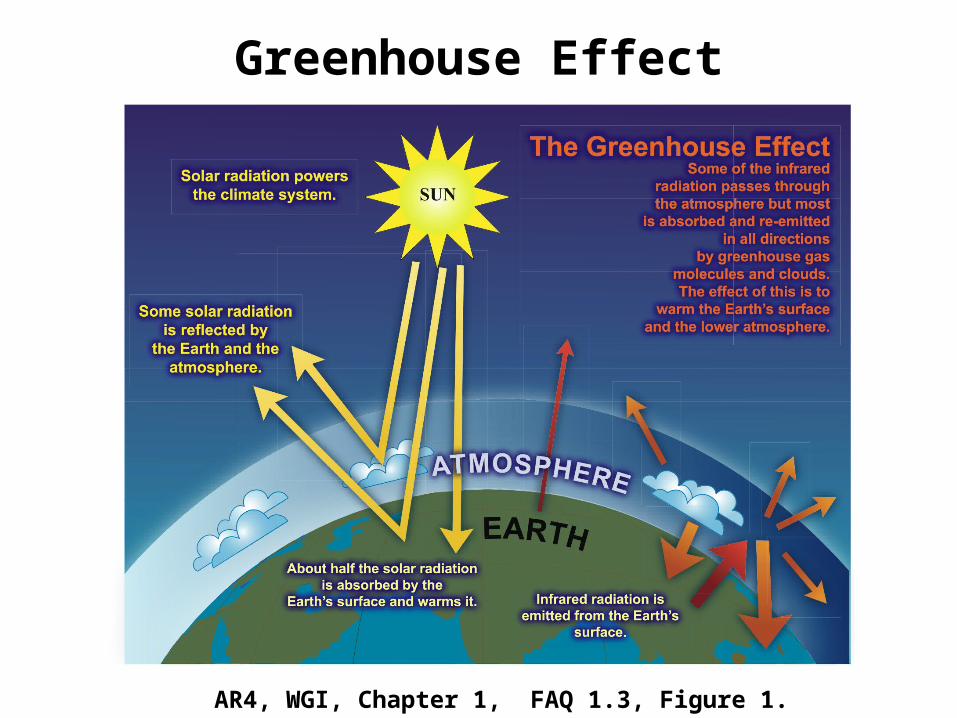
Greenhouse Effect
AR4, WGI, Chapter 1, FAQ 1.3, Figure 1.
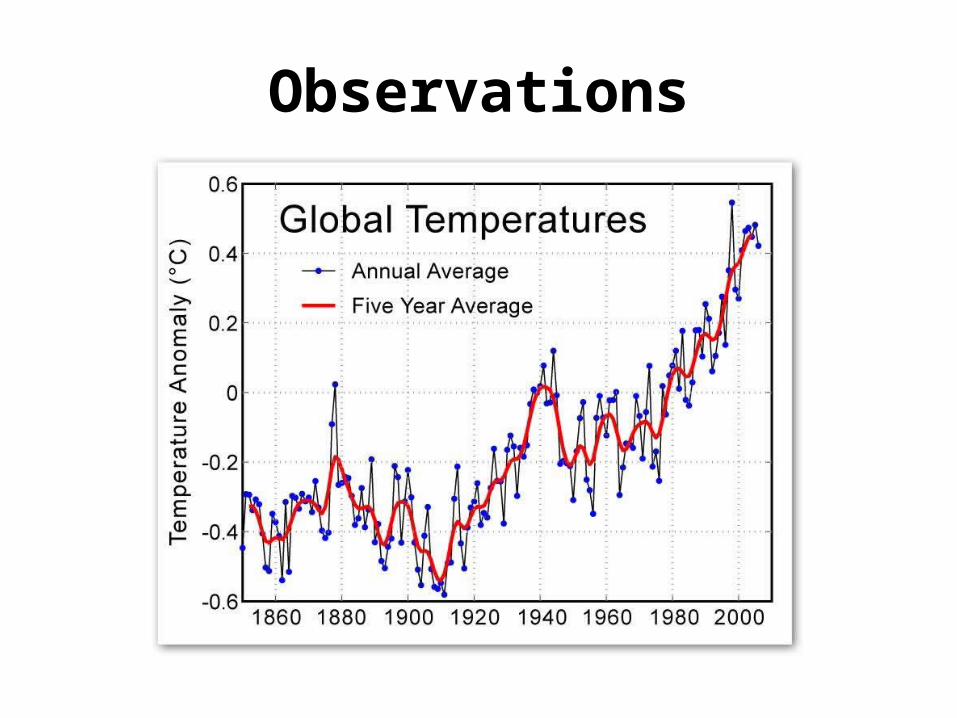
Observations
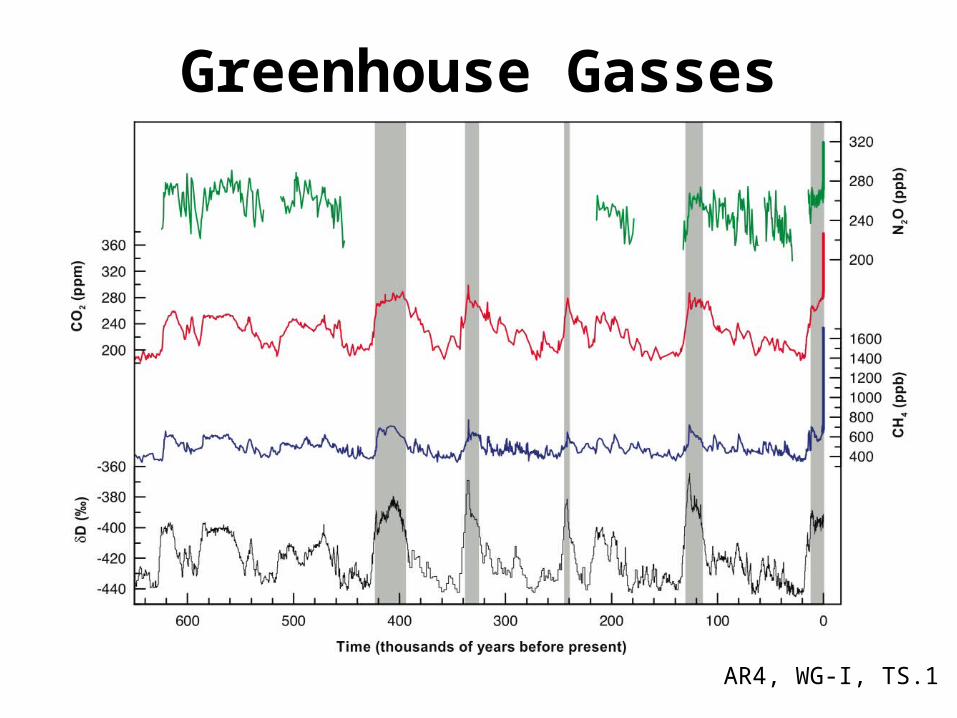
Greenhouse Gasses
AR4, WG-I, TS.1
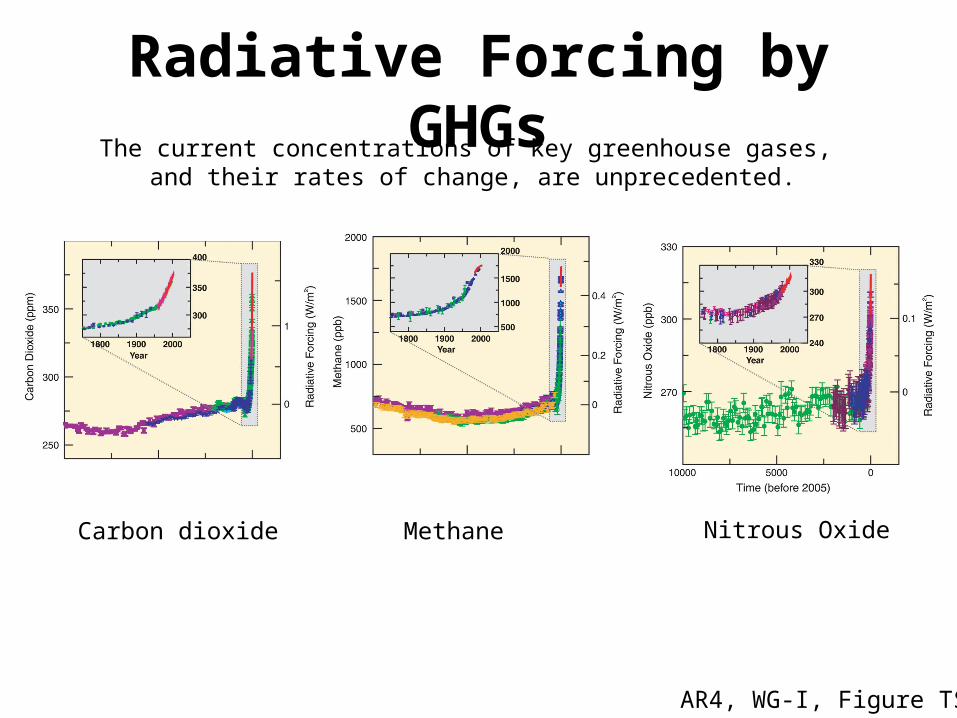
Radiative Forcing by GHGs
AR4, WG-I, Figure TS.2
The current concentrations of key greenhouse gases, and their rates of change, are unprecedented.
Carbon dioxide Methane Nitrous Oxide
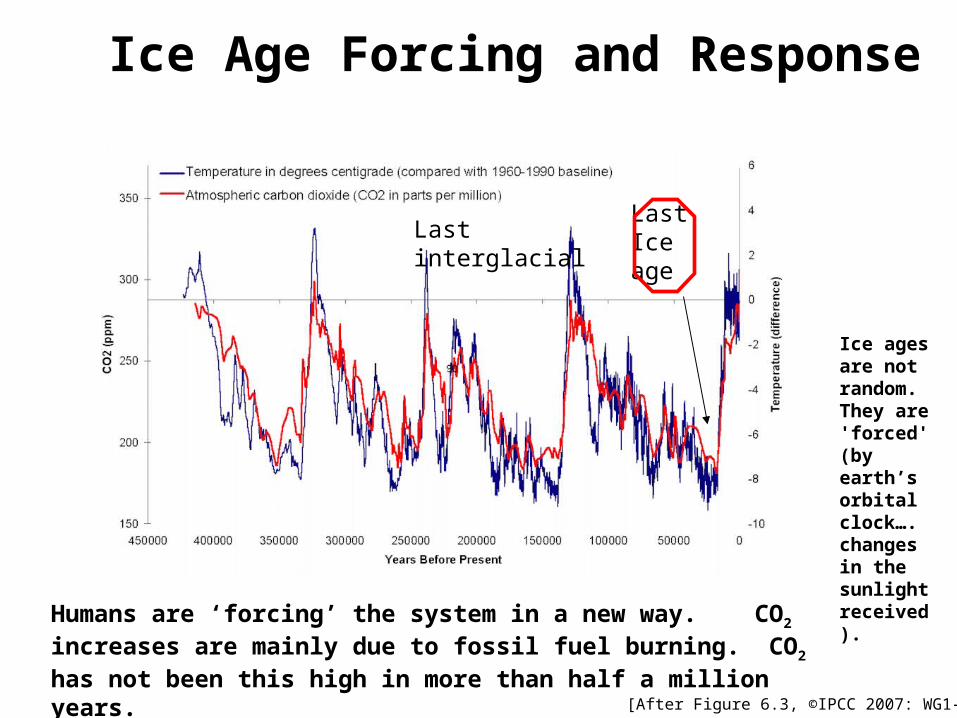
Ice Age Forcing and Response
Last Ice age
Lastinterglacial
[After Figure 6.3, ©IPCC 2007: WG1-AR4]
Humans are ‘forcing’ the system in a new way. CO2 increases are mainly due to fossil fuel burning. CO2 has not been this high in more than half a million years.
Ice ages are not random. They are 'forced' (by earth’s orbital clock…. changes in the sunlight received).
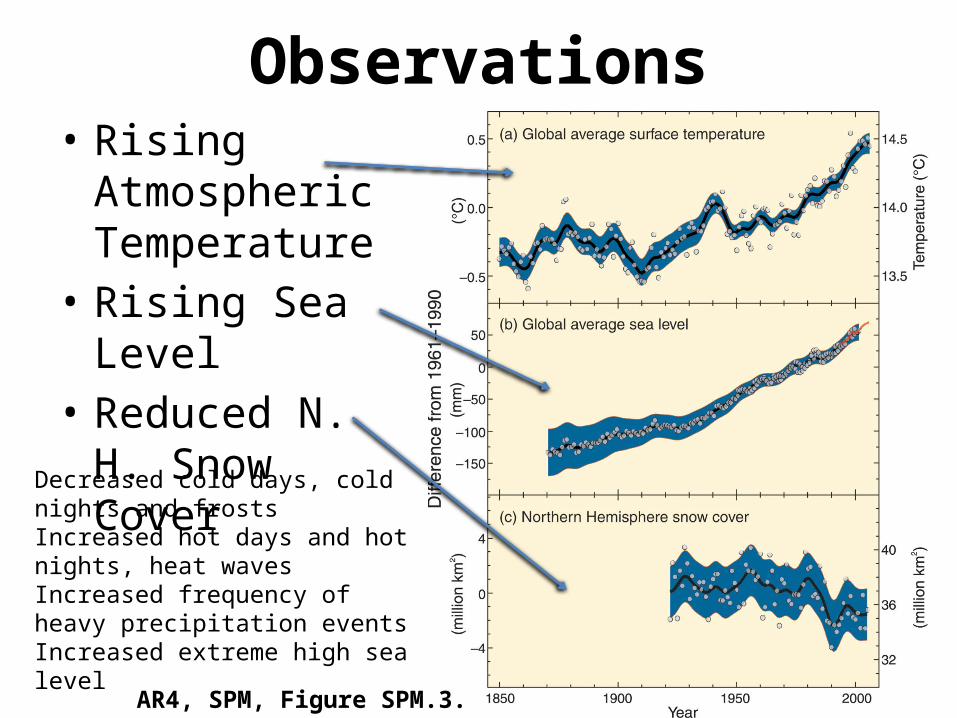
Observations• Rising
Atmospheric Temperature
• Rising Sea Level• Reduced N. H.
Snow CoverDecreased cold days, cold nights and frostsIncreased hot days and hot nights, heat wavesIncreased frequency of heavy precipitation eventsIncreased extreme high sea level
AR4, SPM, Figure SPM.3.
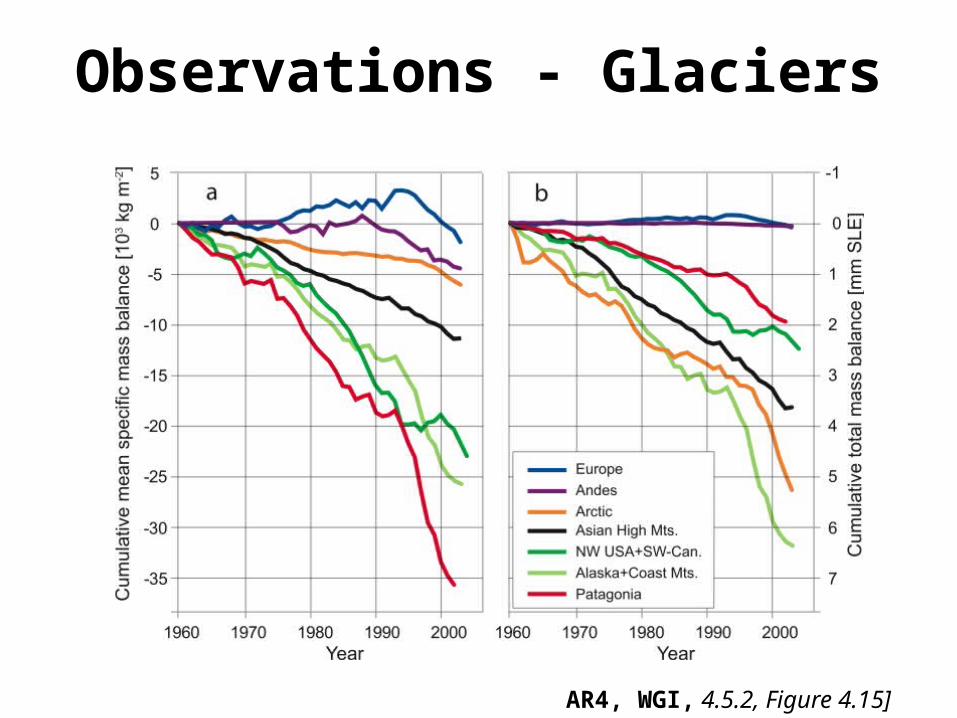
Observations - Glaciers
AR4, WGI, 4.5.2, Figure 4.15]
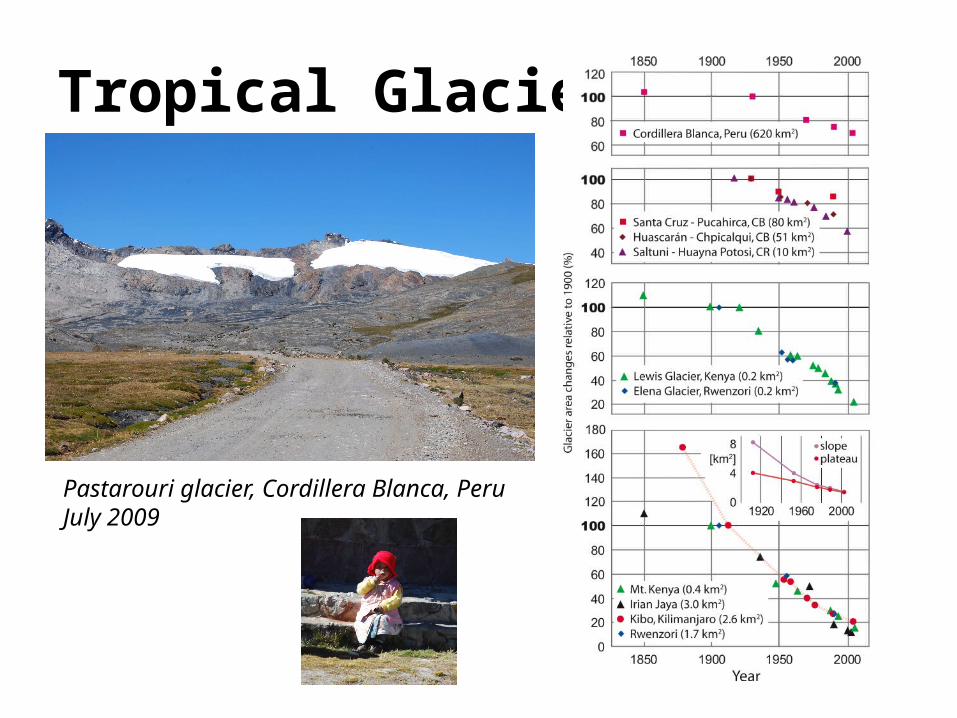
Tropical Glaciers
Pastarouri glacier, Cordillera Blanca, PeruJuly 2009
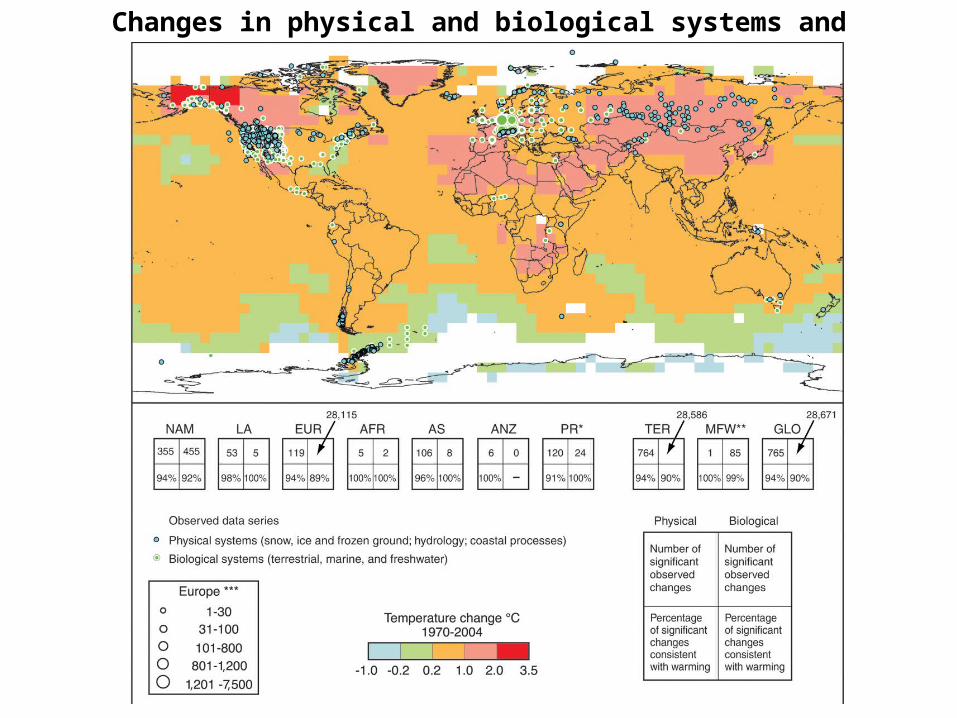
Changes in physical and biological systems and surface temperature 1970-2004
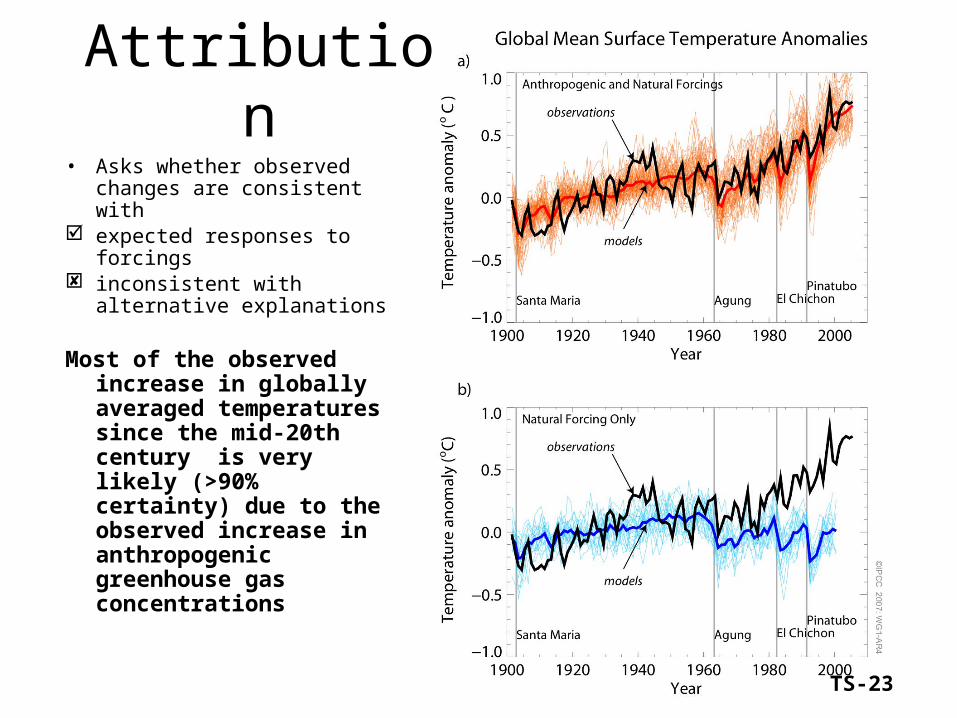
Attribution• Asks whether observed
changes are consistent with expected responses to
forcings inconsistent with alternative
explanations
Most of the observed increase in globally averaged temperatures since the mid-20th century is very likely (>90% certainty) due to the observed increase in anthropogenic greenhouse gas concentrations
TS-23
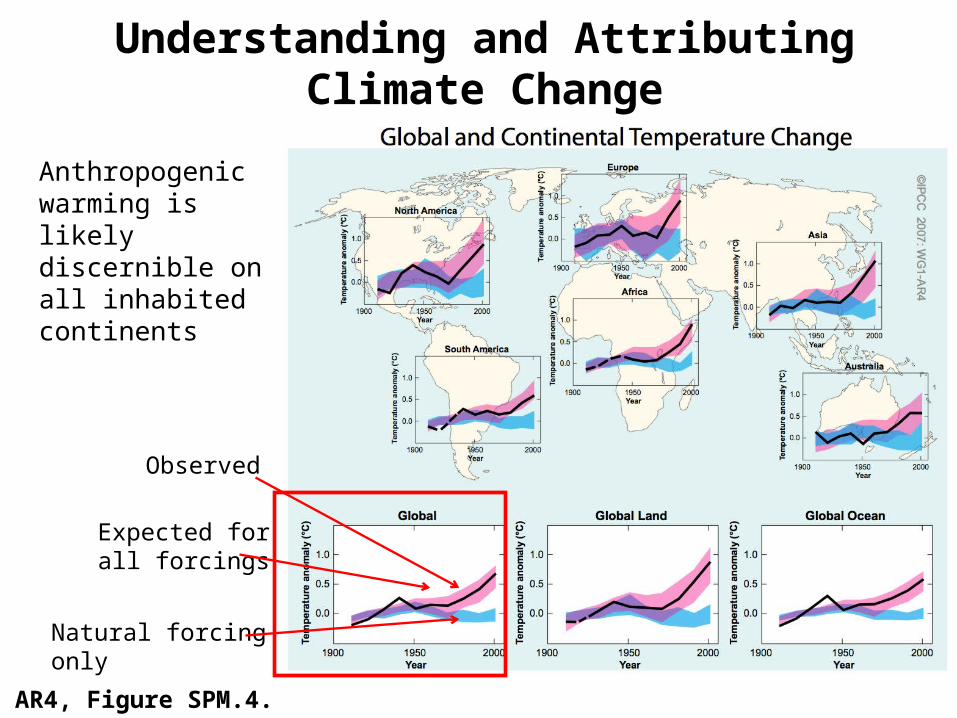
Understanding and Attributing Climate Change
Anthropogenic warming is likely discernible on all inhabited continents
Expected for all forcings
Natural forcing only
Observed
AR4, Figure SPM.4.
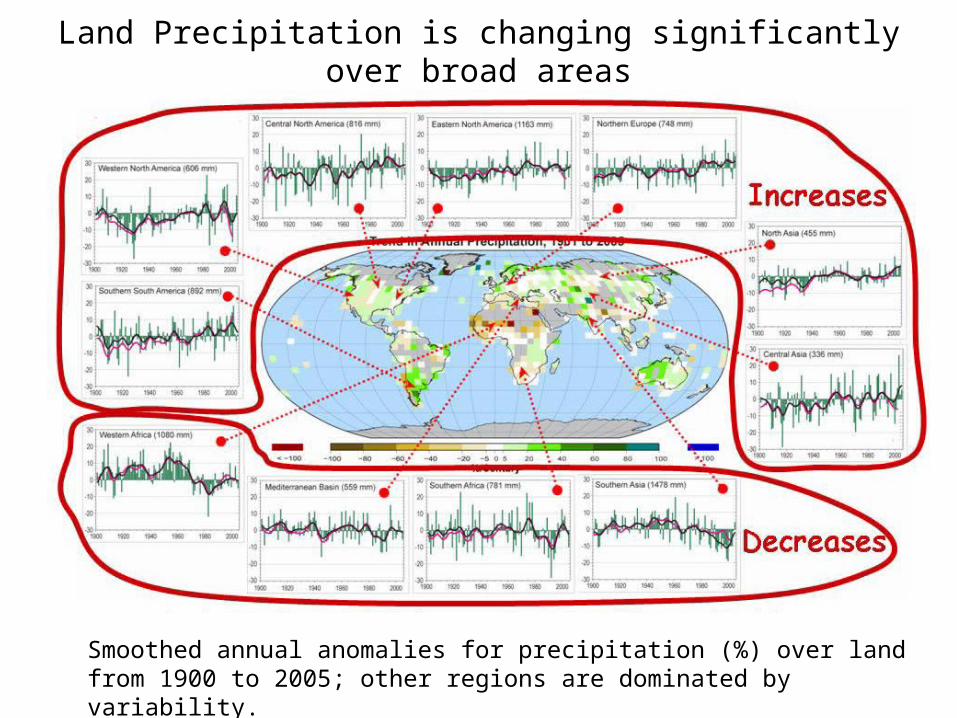
Land Precipitation is changing significantly over broad areas
Smoothed annual anomalies for precipitation (%) over land from 1900 to 2005; other regions are dominated by variability.
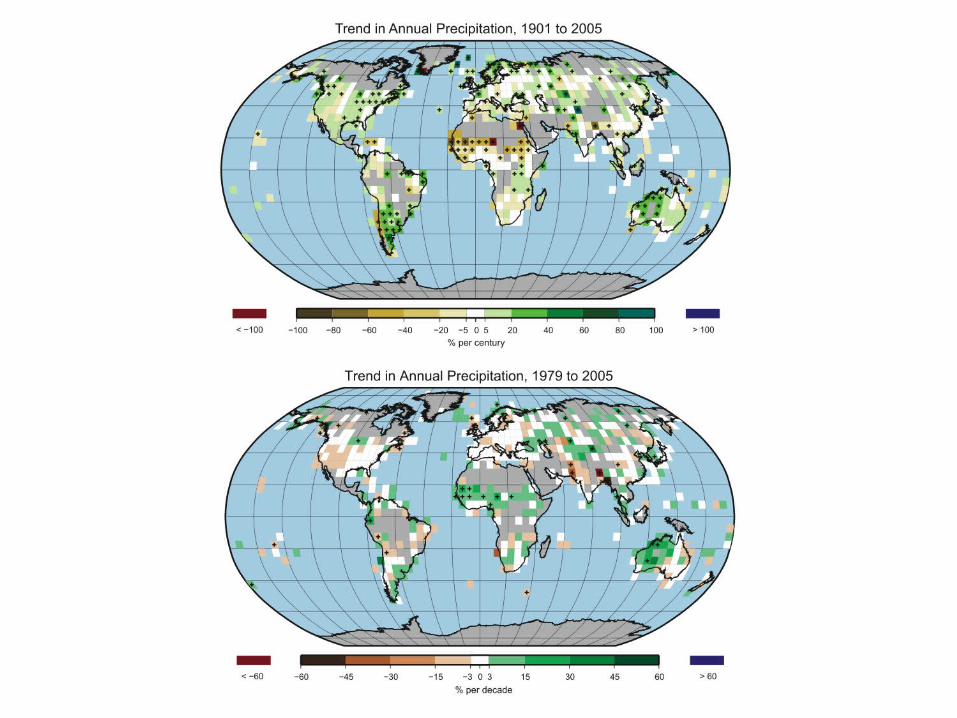
Figure 3.13
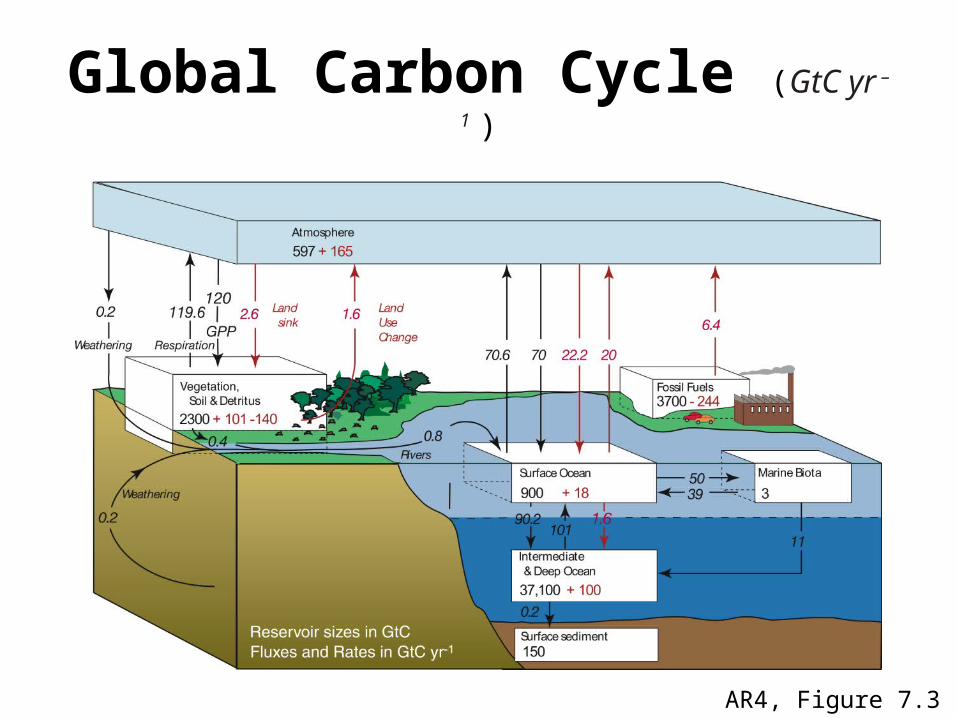
Global Carbon Cycle (GtC yr –1 )
AR4, Figure 7.3
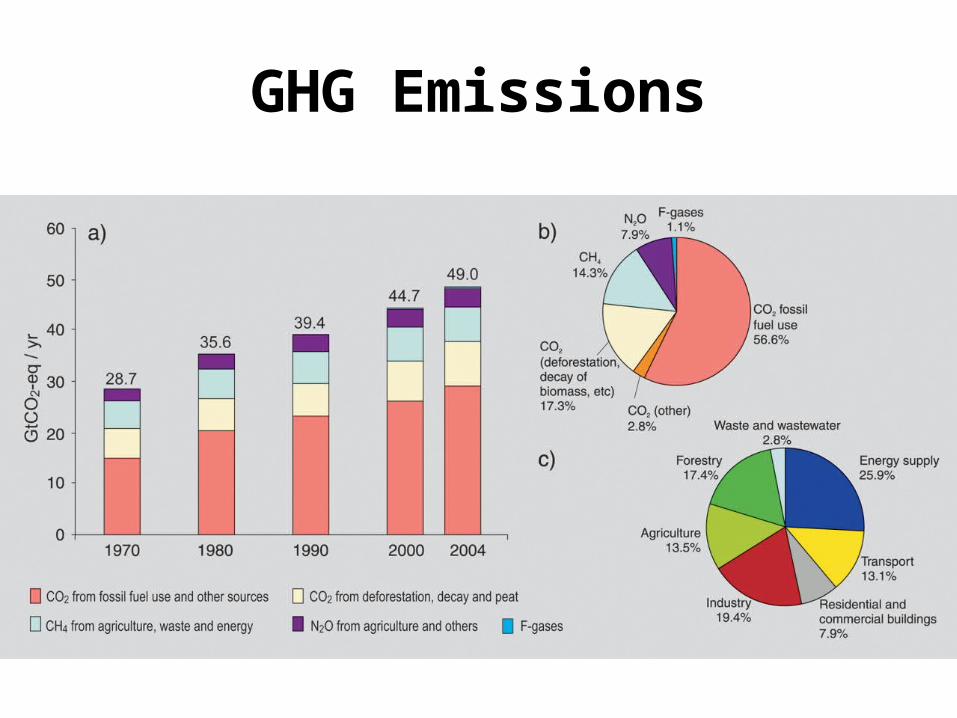
GHG Emissions
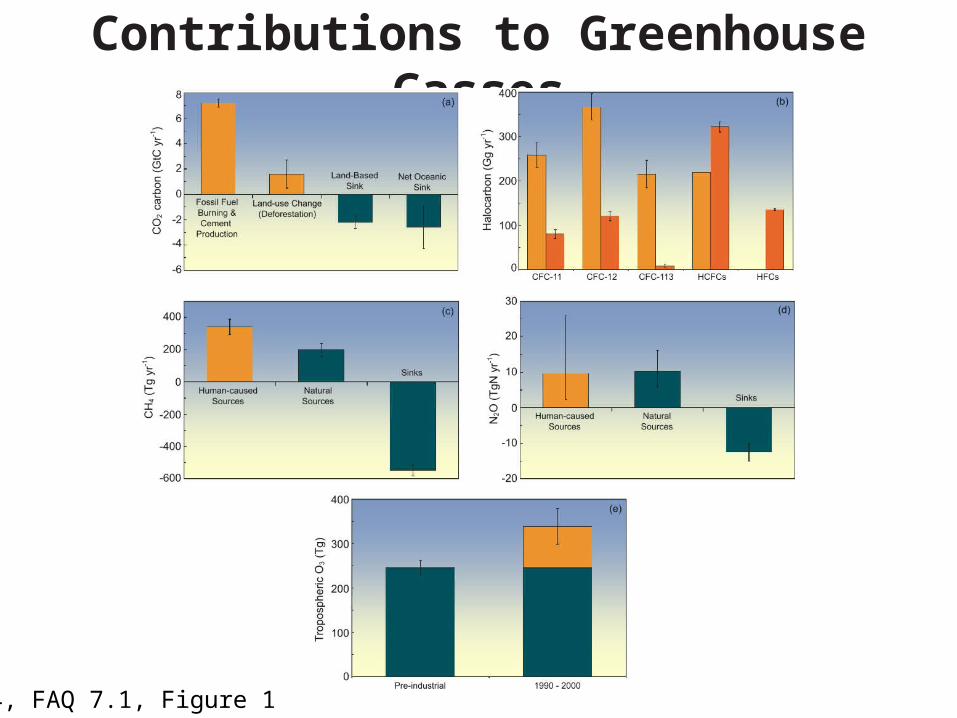
Contributions to Greenhouse Gasses
AR4, FAQ 7.1, Figure 1
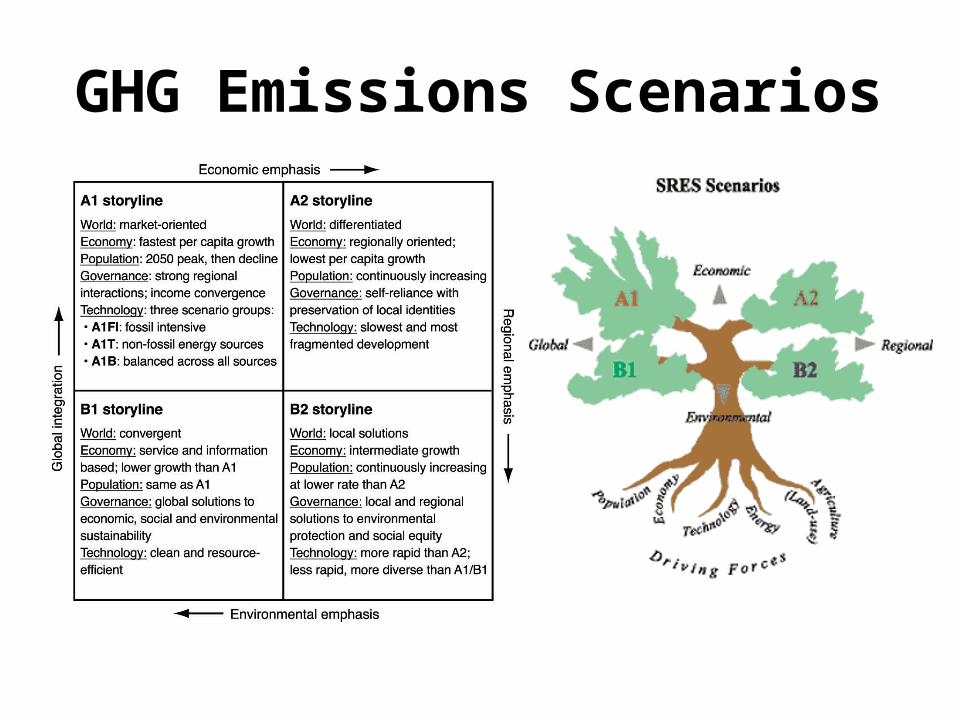
GHG Emissions Scenarios
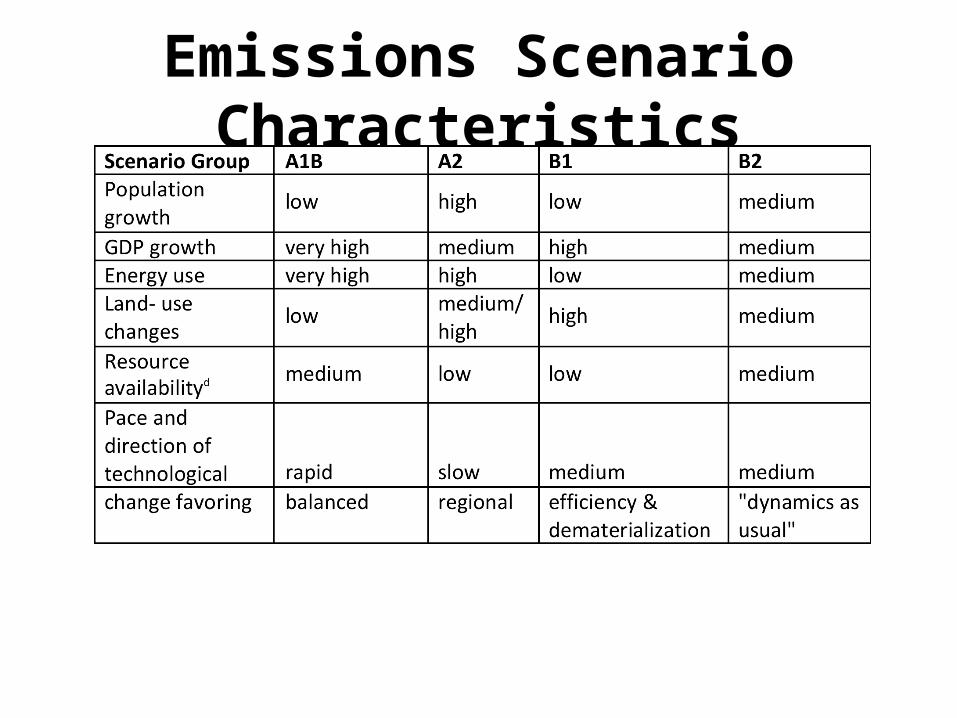
Emissions Scenario Characteristics
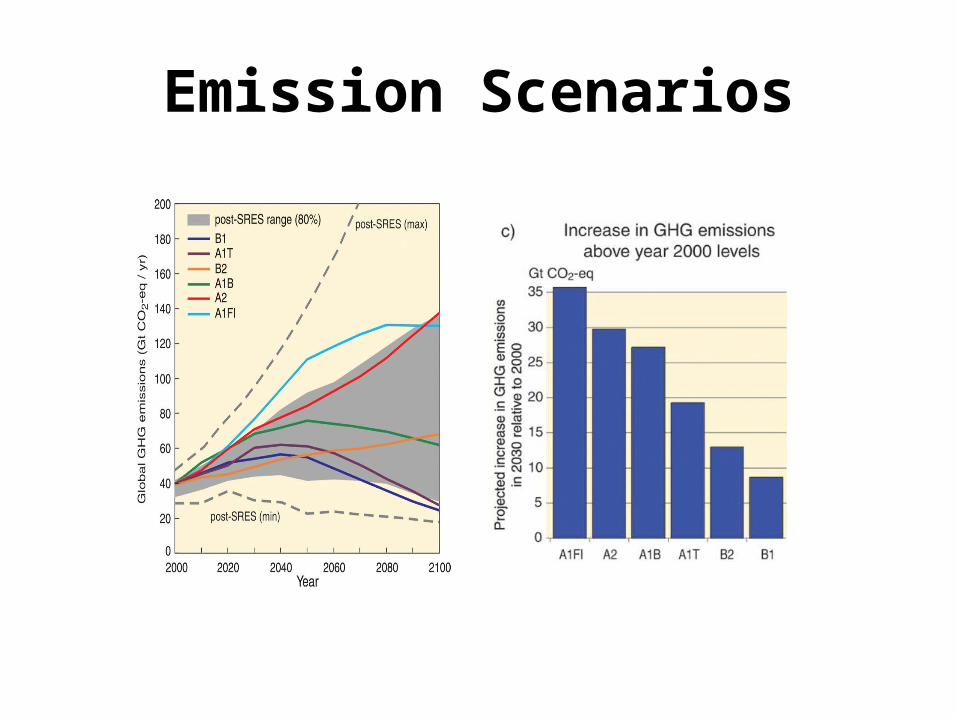
Emission Scenarios
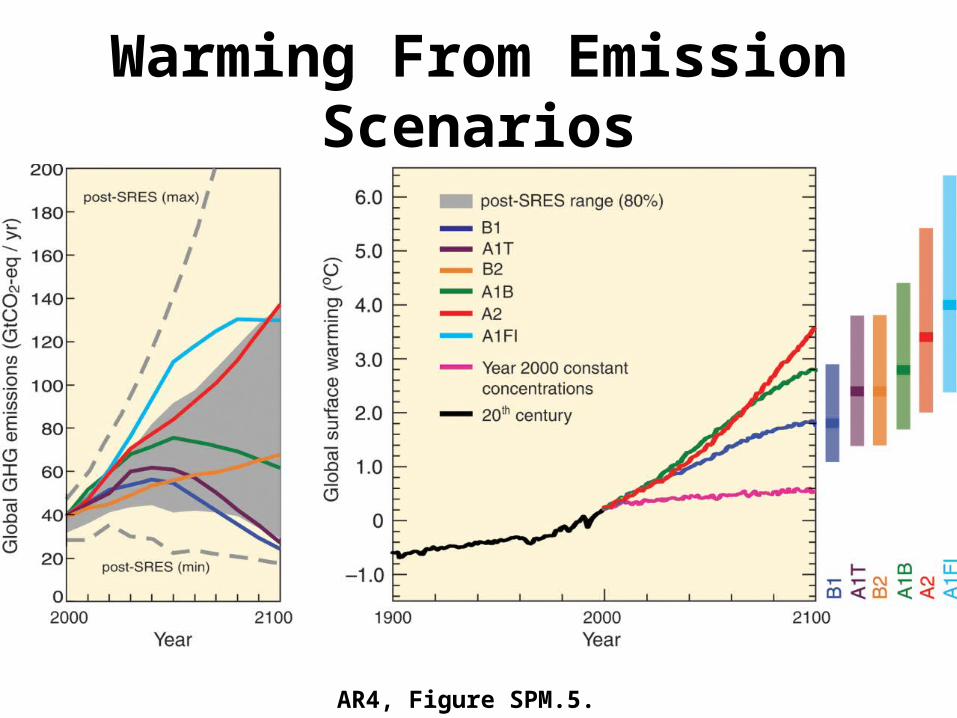
Warming From Emission Scenarios
AR4, Figure SPM.5.
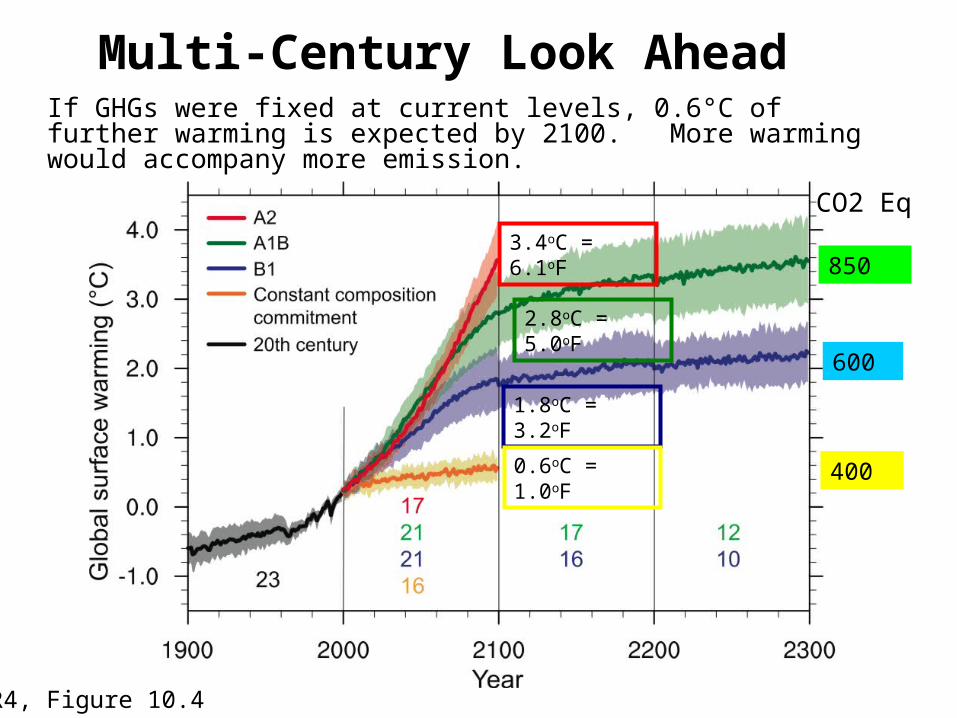
Multi-Century Look AheadIf GHGs were fixed at current levels, 0.6°C of further warming is expected by 2100. More warming would accompany more emission.
1.8oC = 3.2oF
2.8oC = 5.0oF
3.4oC = 6.1oF
CO2 Eq
850
600
4000.6oC = 1.0oF
AR4, Figure 10.4
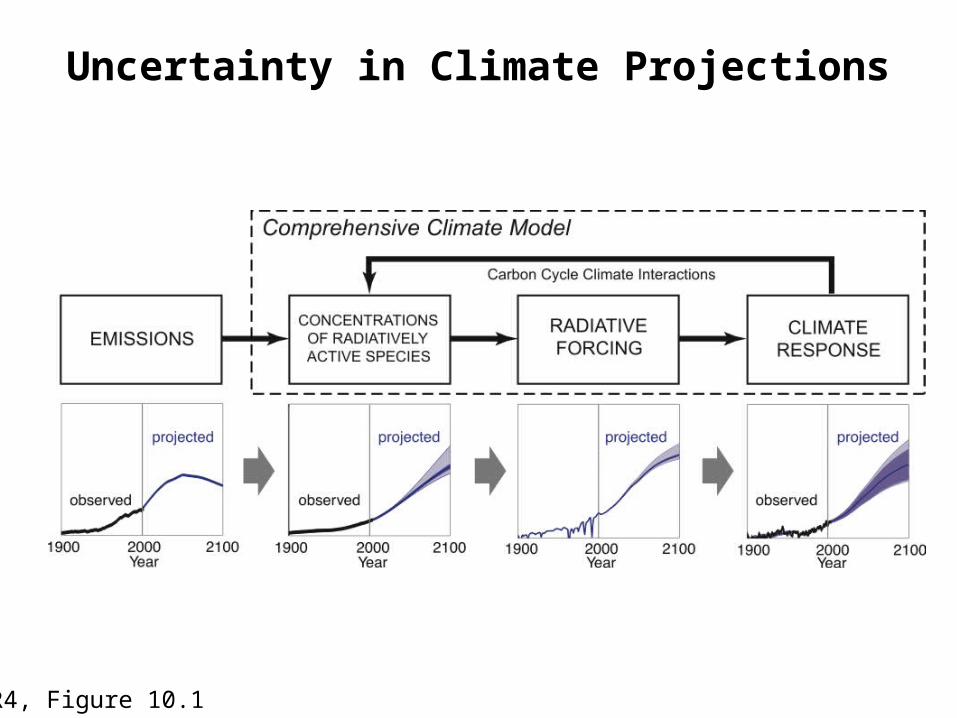
Uncertainty in Climate Projections
AR4, Figure 10.1
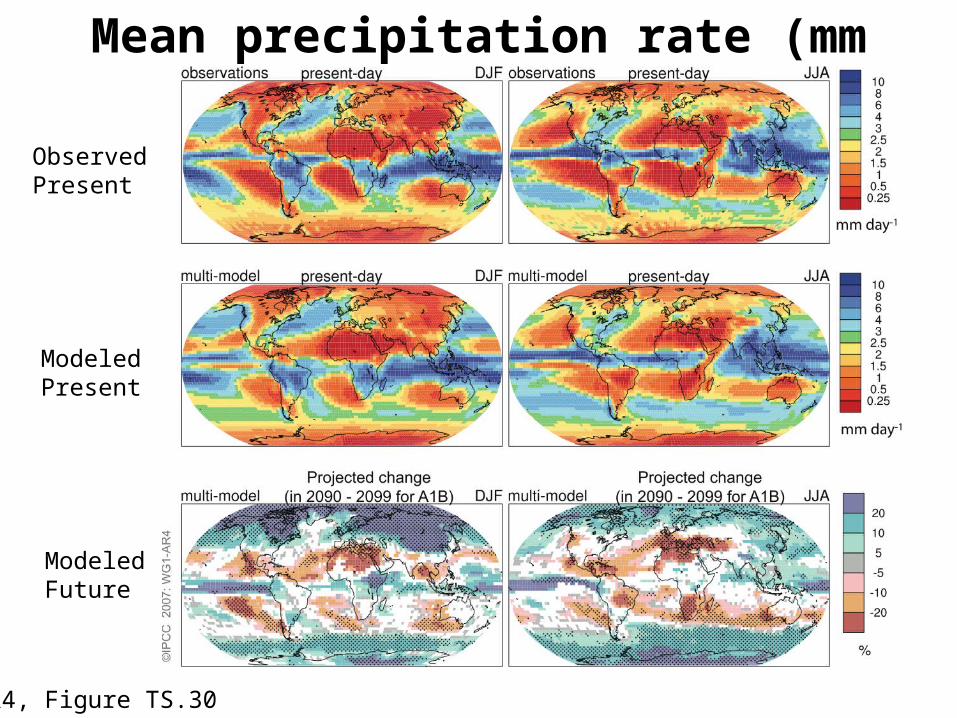
Mean precipitation rate (mm day–1)
AR4, Figure TS.30
ObservedPresent
ModeledPresent
ModeledFuture
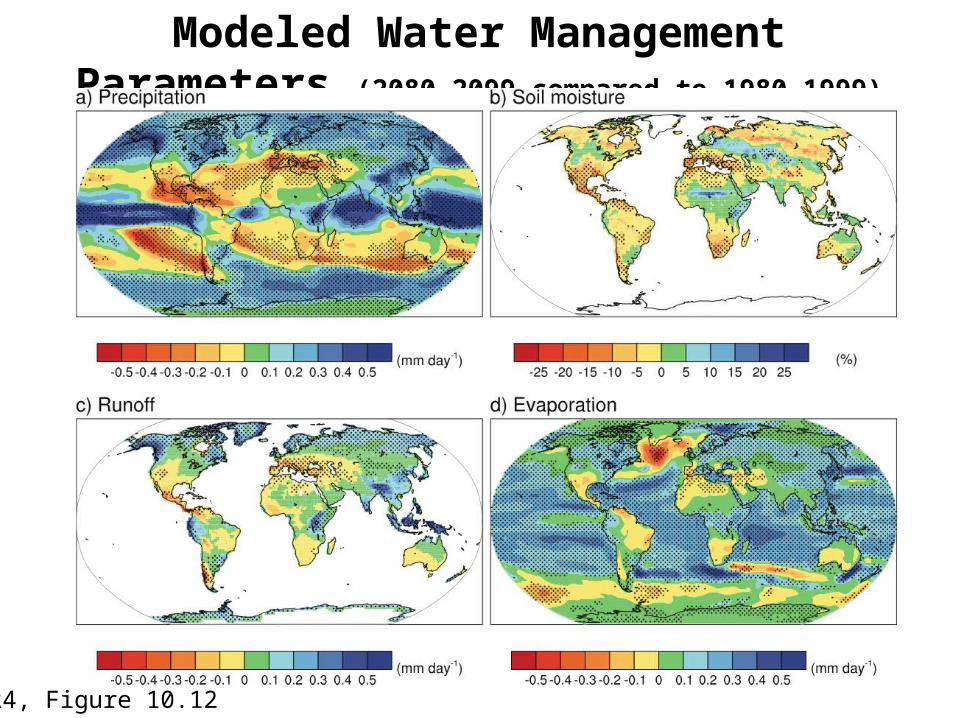
Modeled Water Management Parameters (2080-2099 compared to 1980-1999)
AR4, Figure 10.12
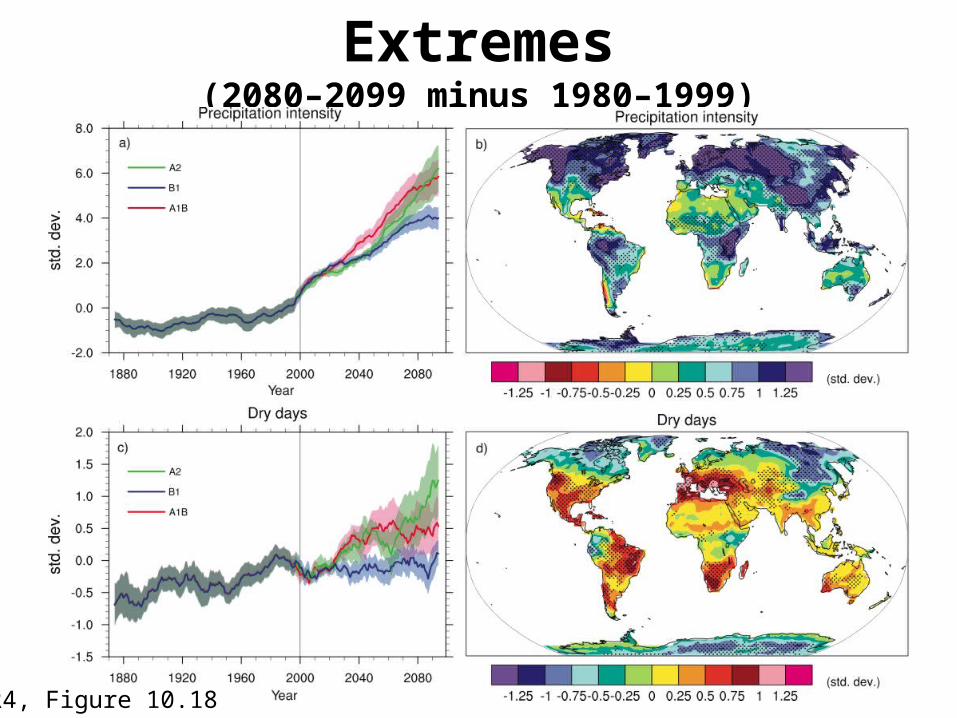
Extremes (2080–2099 minus 1980–1999)
AR4, Figure 10.18
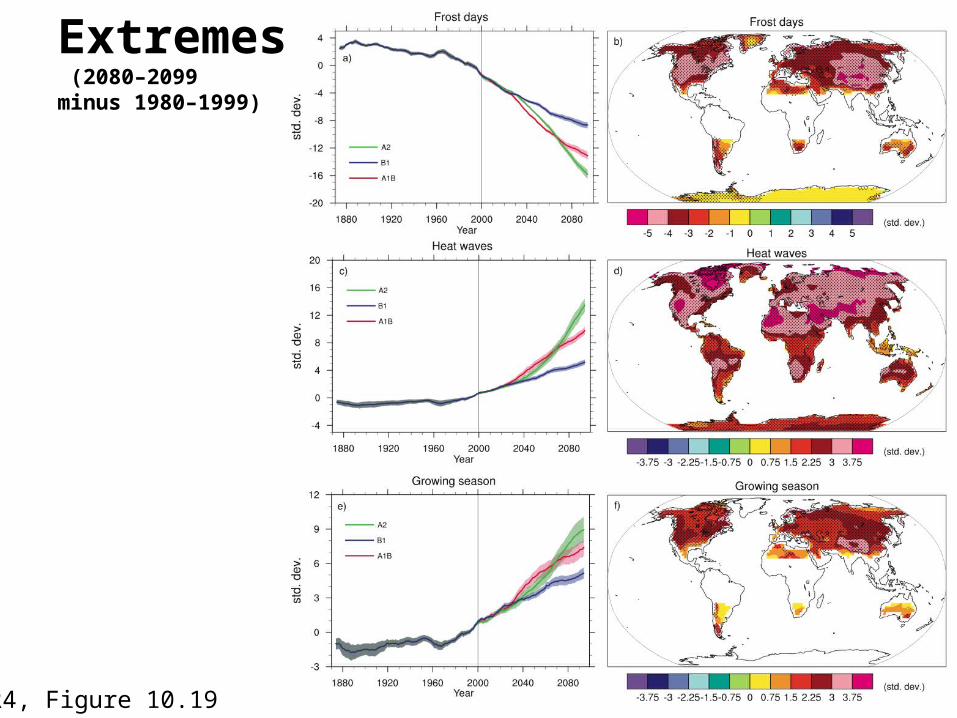
Extremes (2080–2099 minus 1980–1999)
AR4, Figure 10.19
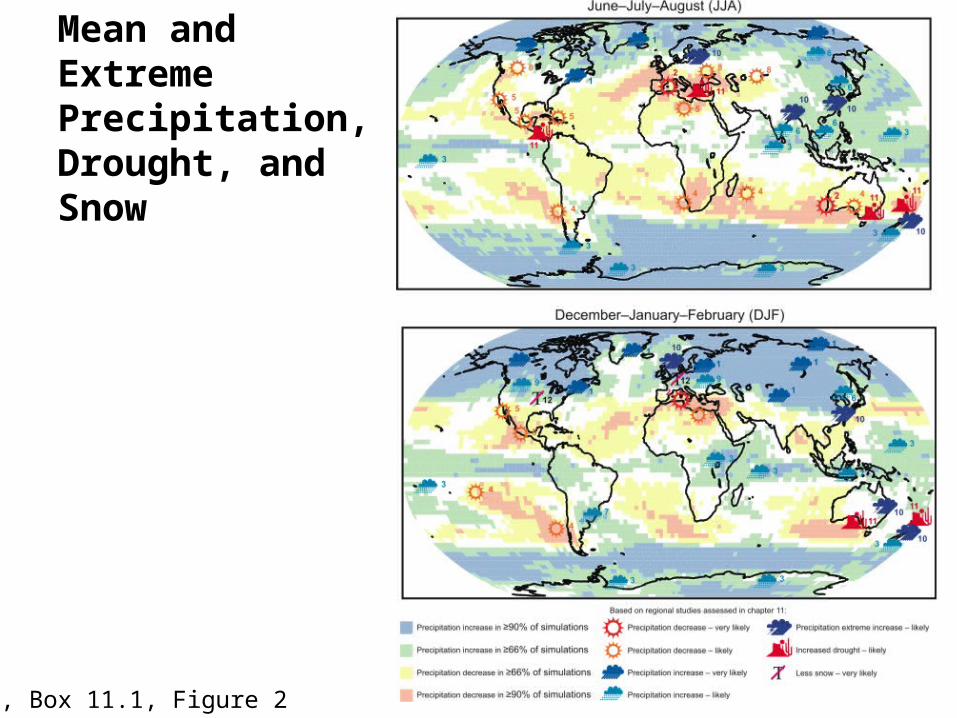
Mean and Extreme Precipitation, Drought, and Snow
AR4, Box 11.1, Figure 2
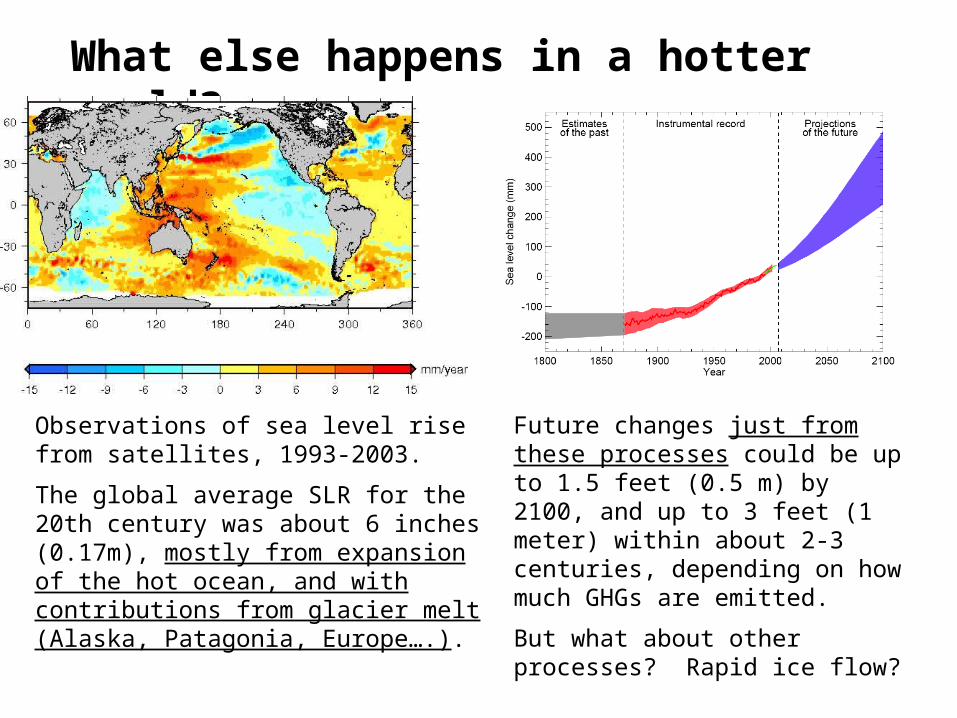
What else happens in a hotter world?
Observations of sea level rise from satellites, 1993-2003.
The global average SLR for the 20th century was about 6 inches (0.17m), mostly from expansion of the hot ocean, and with contributions from glacier melt (Alaska, Patagonia, Europe….).
Future changes just from these processes could be up to 1.5 feet (0.5 m) by 2100, and up to 3 feet (1 meter) within about 2-3 centuries, depending on how much GHGs are emitted.
But what about other processes? Rapid ice flow?