climate and soils of the south kinangop plateau of kenya
TRANSCRIPT

Climate and soils of the South Kinangop Plateau of Kenya.
Their limitations on land use

Promotor: D r . i r . J . Bennema, oud-hoogleraar i n de t r op i sche
bodemkunde aan de Landbouwhogeschool t e Wageningen.

,d , jO?Zo»,1^-
l.N. NYANDAT
CLIMATE AND SOILS OF THE SOUTH KINANGOP PLATEAU OF KENYA
Their limitations on land use
Proefschrift
ter verkrijging van de graad van
doctor in de landbouwwetenschappen,
op gezag van de rector magnificus,
dr. C.C. Oosterlee,
hoogleraar in de veeteeltwetenschappen,
in het openbaar te verdedigen
op woensdag 11 april 1984
des namiddags te vier uur in de aula
van de Landbouwhogeschool te Wageningen.
/SAlz. Xo^^ss-oV

Climate and so i l s of the South Kinangop Plateau of Kenya
Their l imitat ion on land use.
To my parents.
For Pamela, Pritt, Beatrice,
Paul, Job, Eric and Linda.

CONTENTS
ACKNOWLEDGEMENT
ABSTRACT
SUMMARY
PART 1 - INTRODUCTION 1 1. Introduction 1
1.1 General introduction 1 1.2 Features (location, population, infrastructure, 5
marketing, extension services) of the area 1.3 Background data and objectives of the present study 11 1.4 The methods used for acquiring the data 13
PART 2 - ACQUIRED DATA AND THEIR IMPLICATION 16 2. The land use before resettlement and the present pattern 16
of land use 2.1 Arable agriculture 16 2.2 Livestock production 23 2.3 Tree production 27
3. Farm types and crops 28 4. The value of the present small-farm settlement 31 5. The climate of the area and its constraints on land use 34
5.1 The temperature and forst regime 34 5.1.1 Temperature type and variability 34 5.1.2 Influence of temperature with regard to crops 38
5.2 Water availability 38 5.2.1 Rainfall distribution 38 5.2.2 Rainfall probability 41 5.2.3 Evaporation and évapotranspiration patterns 41 5.2.4 Cumulative water balance and the length of the 44
growing period 5.2.5 Influence of water availability with regard to 46
crops 5.3 The land use pattern as influenced by temperature and 46
water availability 6. The soils of the area and their constraints on land use 51
6.1 Introduction (Geology, Physiography, Surface Hydrology) 53 6.2 The classification and correlation of the soils; and a 57
description of some of the soil units 6.3 Problems of the soil and how they influence land use 70
PART 3 - POSSIBILITIES FOR LAND USE 74 7. The Land Utilization types identified for the area and their 74
land requirements 7.1 Land Utilization types 74
Small scale rainfed arable farming for non-cereal annual crops at low level management 76 Small scale rainfed arable farming for non-cereal annual crops at intermediate level of management 76 Medium scale rainfed arable farming for wheat/barley/oats at intermediate level of management 77 Small scale rainfed arable farming for fruit trees at intermediate level of management 78

•II-
continued Small scale grazing for cattle and sheep at intermediate level of management 79 Tree production for firewood and building poles 80 Fish pond for fish production 81
7.2 The Land Requirements of the Land Utilization Types 81 8. The kind of Land Qualities identified for the area, their 84
grades and how they fit the requirements of the land utilization types
9. The Possibility for improvement of the land and the limits of 88 the grades of land qualities set for the suitability classes for the different land utilization types
10. The Current land utilization types 9 3 11. A preliminary assessment of the posssibility of improving the 95
drainage of the imperfectly and poorly drained soils and the potential land suitability
PART 4 - RESULTS, CONCLUSIONS AND NECESSARY FOLLOW-UP 100 12. Results and Conclusions 100 13. Necessary Follow-up 106
REFERENCES 108

"Jmöttp^Wf
STATEMENTS
1. Survival of man depends on responsible and rational use of the finite soil
resource of the earth.
2. Soil and climate are the base of development and without a good knowledge
of them man's survival is placed at jeopardy.
3. The development of agriculture should not only be without degradation of
the track of land under consideration but should also not have a negative
impact on the wider environment.
4. A poor farmer can become rich on good soil and a rich farmer can make poor
soil productive, but a poor farmer on poor soil has little chance of
succeeding.
5. Drainage is the most critical factor limiting the use and productivity of
the soils of the study area. The first need is to improve the general
drainage system of the region.
6. Land suitability classification should always be for a specified land use
since the land suitability depends on the use to which the land is to be
put.
7. Soil structure degradation by use of inappropriate implements and the
degradation of soil fertility by erosion of top soil are the most serious
soil problems in the developing countries.
8. Loss of soil through secondary salinization under poorly managed
irrigation outweights advantage from irrigated agriculture in the world
today.
9. The lack of use of soil information at farm level for soil management and
conservation has partly been due to non-problem solving soil research
approach and partly due to improper presentation of the soil information
by the soil scientists.
10. It is high time less emphasis was placed on soil fertility maintenance
with fertilizer in a low capital investment farming which is common in the
developing countries and more emphasis placed on organic residue and
biological nitrogen as alternative sources for fertility maintenance.
11. Soil scientists should now pay equal attention to the soil problems for
pasture production in animal production just as they do for crop
production.
12. Field soil training should be compulsary for all agricultural research
scientists and extension workers.

13.. Agricultural extension workers destined to work in the tropics, whether
derived from international, bilateral or local sources should be
conversant in the subject matter of soil conservation.
14. The contribution of research by international institutions can only be
effective in the developing countries through collaborative research with
the national soil research institutions.
15. Self reliance is the surest way of development.
16. Technical aid without concommitant training of the nationals is an
incomplete aid.
17. Although the methodology proposed in the framework of land evaluation for
the land suitability classification is elaborate, it is an important step
forward.
FAO, 1976. A Framework for land evaluation. FAO Soils Bulletin No. 32, p.
9-10, Rome.
18. Emphasis on the development of non food crops in the developing countries
where food shortage is critical should be discouraged.
19. Crop breeding has until now placed emphasis on disease resistance and
yield response to added fertilizer. It is high time the breeding was also
done for the soil conditions.
20. Sex education should be an essential part of a school curriculum in Kenya
so that the school youth can be assisted to behave responsibly.
21. The teaching of agriculture at school level is necessary for the
motivation of the school youth in the developing countries to develop
interest in working in the rural area.
N.N. NYANDAT
Doctorate thesis: Climate and soils of the South Kinangop Plateau of Kenya:
their limitations on land use

• I l l -
ANNEXES:
1. Land occupied between 1964 and 1975 by various crops during the long
rain seasons in seven Kinangop Settlement Schemes
2. Livestock numbers during 1967 to 1975 and the stocking rates in
seven Kinangop Settlement Schemes
3. Profile description and analytical data of some representative
profiles
4. Proposals for grading of land qualities (partly after Van de Weg
and Braun, 1977)
5A-G. The current land suitability classification
6. Scientific names of the crops mentioned in the report

•IV-
FIGURES
la. Location of the study area in relation to the country
lb. The study area
2. Settlement schemes of the study area
3. Main crops of the settlement schemes during 1975
4. Climate stations of the study area
5. Sites of observation of the soils in the field
6. The geology of the study area
7. The surface hydrology and contours of the study area
7A. Semi-detailed soil map of South Kinangop Settlement Schemes
8a-c. Characteristic schematic profiles of the soils
PLATES
1.
3.
4.
5.
6.
The landscape: Aberdare Mountains in background and overgrazed
pasture in foreground
The field meteorological station set for the drainage investi
gation
Example of crop mix: cabbages and potatoes grown in some farms
Type of cattle and sheep kept by farmers
Better managed grass pasture; compare with overgrazed grass
pasture in plate 1
Mount Longonot, the source of recent volcanic ash sprinkling at
Kinangop, in the background
TABLES
1.
2.
3a-g.
4.
5.
Production and Marketing of some agricultural produce from the
Kinangop area during 1975 and 1976 after resettlement and in
1961 before the resettlement
Land occupied by the major crops in the Kinangop area in 1960
Land occupied between 1964 and 197 5 by various crops during the
long rain season in seven Kinangop Settlement Schemes (found in
Annex 1)
Present yields and the yields before the resettlement, of some
crops in the Kinangop area
Sensitivity to frost, temperature, altitude and rainfall require
ment for the crops found in the Kinangop area and others that
could be considered for the area

-V-
6. Some soil requirement of the crops found in the Kinangop area
and others that could be considered for the area
7. Number of livestock before the land resettlement
8a-g. Livestock numbers during 1967 to 1975 and the stocking rates in
seven Kinangop Settlement Schemes (found in Annex 2)
9. The proportion of green and dried out grass during different
months of the year
10. Nutritive value of the green and dried out grass during different
months of the year
11. Temperature ("C) at three sites of the study area
12. Absolute minimum temperature (°C) during 1975 to 1979
13. Comparison of absolute minimum temperature (*C) at high lying
and low lying grounds
14. Monthly mean rainfall and calculated annual potential evapora
tion data (mm) for the areas in and around the study area
15. Rainfall probability at Ndiara metereological site (representing
Tulaga, Njabini and Bamboo Settlement Schemes) and Karati meteo
rological site (representing Karati Settlement Scheme)
16. Monthly potential evaporation (mm) at South Kinangop and Kimakia
according to Woodhead (1968)
17. Monthly potential evaporation as percentage of year potential
evaporation; calculated from Table 16
18. Estimated monthly and annual potential evaporation (mm) for the
area in and around the study area
19. The monthly maximum crop évapotranspiration and rainfall (mm)
at three representative meteorological stations
20. Ranges of the available soil moisture storage capacity
21a. Cumulative water balance from March to February at Ndiara
Meteorological Station representing Tulaga, Njabini and Bamboo
Settlement Schemes
21b. Cumulative water balance from March to February at Carnell
Meteorological Stations representing Muruaki, Githioro and South
Kinangop Settlement Schemes
21c. Cumulative water balance from April to March at karati Meteoro
logical Station representing Karati Settlement Scheme
22. The classification and correlation of the soils
23. The major characteristics of the soils and the area of soils

•Vi
per scheme
24. The grades of the land qualities of the soils units
25a-g. Limits of the grades of land qualities set for the suitability
classes for the different land utilization types
26. Current land suitability for various rainfed land uses
27. Crop establishment and yields as well as monthly rainfall during
the drainage test period 1976 to 1979 inclusive
28. Depth to water table under various drainage treatment
29. The rate of drying of the land surface under various drainage
treatment determined by penetrometer
30a. Comparison of the effectiveness of the various drainage treat
ment and the distance from open ditch drain
30b. Comparison of the yields from the middle and the sides of
camberbed

•VII-
ABSTRACT
In the Kinangop Plateau of Kenya where small holder farmers have been
settled, varied climate and soils occur and the level of land use and
management is not as high as may be expected. The climate and soils were
therefore studied with a view to identify the constraints they present to land
use and management and how the constraints may be rectified. Low temperatures
and frequent frosts are the main climate constraints while imperfect drainage,
low fertility and shallow effective rooting depth are some of the soil
constraints. A comprehensive project which incorporates sub-programmes on the
improvement of soil drainage and fertility, the improvement of collection,
storage, transportation and marketing of produce, the improvement of the
economics of farm enterprises and advisory services, and the improvement of
on-farm roads has been proposed.

• V I I I -
ACKNOWLEDGEMENT
The work on this thesis arises from the initiative of my promotor, E.
Prof.Dr. J. Bennema, who is the E. Professor in Tropical Soil Science at the
State Agricultural university in Wageningen, The Netherlands. I am indebted to
him for initiating this investigation, the guidance he provided to me
throughout the investigation, and the useful advice he gave during the
compilation of the report. I am also indebted to Prof.Dr. W.H. Van der Molen,
Prof.Dr. M. Flach and Prof.Dr. J.F. Bierhuizen who are respectively Professors
in Agrohydrology, Tropical Agriculture and Horticulture at the same
University, for their useful suggestions and assistance.
Grateful thanks also go to the many people whom without their assistance
it would have been impossible to accomplish the task of completing the
investigation and reporting. I am particularly grateful to the staff of the
Kenya Soil Survey, the National Agricultural Laboratories and the Department
of Settlement in Nairobi and Kinangop for the invaluable assistance during
both the field and laboratory investigations. Special mention needs to be made
Messrs. J.R. Rachilo and Mureithi Waweru of the Kenya Soil Survey whose
assistance during the field work was tremendous. Special mention also needs to
be made of Mr. D.M. Olulo and his staff who were responsible for the well
prepared diagrams and pictures found in this report. Mrs. O.N. Waswa formerly
of the National Agricultural laboratories tirelessly worked to type the many
drafts which had to be produced throughout the investigation and this
assistance is very much acknowledged. Without the assistance of Ir. R.F. Van
de Weg, Ing. W. Boxem and Miss Bea Verhaar of Wageningen Agricultural
University's Department of Soil Science and Geology with the organization of
the printing of the thesis in The Netherlands and its presentation, the
successful defence of this thesis would have not been made easy. I am indebted
to them. The Senior Chief of Kinangop, Mr. Mugo, provided his land for the
field drainage experiments and I am indeed grateful to him. Also the
suggestions given by Dr. J.W. Kijne formerly of the Department of Agricultural
Engineering at the University of Nairobi during the drainage experiments
undoubtely helped me to acquire useful data. I very much appreciate his help.
Finally, I owe much to my wife, Pamela, who accepted to relieve me of
many of the family engagements so that I could find adequate time for this
thesis. For her, our childeren and my parents, this publication is dedicated.

•IX-
SÜMMARY
An area of approximately 32,500 ha in the Kinangop Plateau of Kenya where
2881 families have been settled in seven Settlement Schemes (South Kinangop,
Bamboo, Njabini, Githioro, Karati, Muruaki and Tulaga) was investigated with a
view to find out the constraints of climate and soils on the land use of the
area and how the constraints may be rectified.
Section 4 of the report gives the results of the analysis of climatic
regimes and the soils. The mean monthly temperature lies between 10°C and 16°C
with a mean annual temperature between ll'C and 15*C. These rather low mean
temperatures are not conductive to the growing of warmth requiring crops. The
crops that could be considered for the area are indicated in Table 5. They
include pyrethrum, potato, cabbage, cauliflower, kale, carrot, onion, leek,
peas, sunflower, wheat, barley, beet, oats, mangold, apple, plum, pear and
peaches. But because of the frequent occurrence of night frost which is
detailed in Section 4.1.1, the crops like potato and sunflower which are very
sensitive to frost can only be grown during the frost-free period. This frost-
free period was found to extend only from the middle of March to middle of
June. The presently available maize varieties which are late maturing and
which are at present being grown by the farmers can therefore only be grown
with considerable risk of frost damage.
The rainfall amount and reliability is adequate. Only its storage by the
soil makes the difference as has been shown in Tables 21a to 21c. The higher
the capacity of the soil to store the rainwater the higher the moisture
sufficiency to meet the évapotranspiration requirement of the plant. In order
to obtain at least three months of continuous moisture sufficiency for crops
in the area, it has been found that the soil moisture storage capacity must be
at last 90 mm within 100 cm depth of soil.
In Section 5, the thirty-four soil units identified at a scale of
1:50,000 are presented. The soils key out into seventeen units according to
the FA0/UNESC0 legend and into twenty-six soil families according to the
United Staées Soil Taxonomy. These soils are characteristically fine textured
and are deep. Some are well drained while others are imperfectly to poorly
drained. The imperfectly drained and poorly drained soils which constitute
22,450 ha of the 32,500 ha of the study area have a subsoil claypan which
greatly limits the effective rooting depth. All soils have low fertility and
pH in general. The water holding capacity of the well drained soils is high
but that of the imperfectly drained and poorly drained soils is low because of

the shallow effective soil depth of these latter soils.
The present and past land use back to 1960 has been reviewed in Sections
2 and 3 and possible land utilization types as well as their land requirements
identified. Also investigated are the land qualities. The latter have then
been matched against the requirements of the land utilization types in order
to identify the constraints and their possible remedies.
Seven land utilization types which have been identified for the study
area are presented in Section 6.2. They include:
A. Small scale rainfed arable farming for non cereal annual crops at low
level of management
B. Small scale rainfed arable farming for non cereal annual crops at
intermediate level of management
C. Medium scale rainfed arable farming for wheat/barley/oats at intermediate
level of management
D. Small scale rainfed arable farming for fruit trees at intermediate level
of management
E. Small scale grazing for cattle and sheep at intermediate level of
management
F. Tree production for firewood and building poles
G. Fish pond for fish production.
The land qualities fullfil to a smaller or greater extent the
requirements of the land utilization type and are expressed in similar terms.
Identified are the relevant land qualities for each of the land utilization
types. These land qualities are shown in Section 7 of the report. They relate
to:
1. Availability of water (moisture)
2. Availability of drinking water
3. Availability of nutrients
4. Resistance of erosion
5. Possibility of use of mechanical implements
6. Presence or hazard of water logging (availability of oxygen)
7. Availability of foodhold
8. Presence or hazard alkalinity/sodicity/alkalinization
9. Hinderance by vegetation
10. Risk of overgrazing
11. Risk of periodically occuring pests and diseases
12. Presence of windfall hazard

•XI-
13. Presence of forest fire hazard
14. Availability of conditions for pond construction.
The land qualities have been quantified and graded for the assessment of
land suitability classes according to the scheme presented in Annex 5 while
the grades of the relevant land qualities computed for each of the soil units
of the study area are given in Table 24. These grades of the land qualities of
the soil units have been matched against the land requirements of each of the
land utilization types in order to assess the current land suitability and
also to identify the major land constraints. The current land suitability for
each of the land use alternatives is presented in Table 26. The well drained
soils (comprising some 10,050 ha) are in general marginally drained soils
(comprising about 22,450 ha) are unsuitable for arable agriculture. The
imperfectly drained soils are however largely marginally suitable for tree
production and grazing but moderately to highly suitable for construction of
fish pond.
A major land constraint related to the imperfect drainage which affects
22,450 ha of the study area of 32,500 ha. The Settlement Schemes mostly
affected by the imperfect drainage are Muruaki, Githioro, Karati and Tulaga
(see Fig. 2). It is worst in Githioro and Karati Settlement Schemes because
of the undissected and rather flat topography found in these schemes. Other
minor constraints relate to shallow effective rooting depth mostly in the
soils with claypan and the low phosphorus as well as nitrogen and pH.
A preliminary four-year field drainage experiment was conducted from 1976
to 1979 to compare the effectiveness of mainly ditch drain, ditch drain plus
ripping, and camberbed. The results of this experiment are presented in
Section 10 of the report. The results indicated that the camberced is fairly
effective for drainage and can be easily adopted in small scale farming under
a well laid out overall network of surface drainage.
With regard to soil fertility this may considerably be improved when
fertilizers, manures and lime are used for crop production. The areas affected
by shallow effective rooting depth may however best be used for grazing, tree
production and fish pond construction. A number of Eucalyptus, Cupresses and
Pinus species indicated in Section 2.3 were found to perform well on these
soils with shallow effective depth.
It may be necessary to mount a comprehensive land development project for
the study area. The project would incorporate a number of sub-programmes on
the following:

-XII-
1. Improvement of the surface drainage and water storage
2. Investigation of appropriate husbandry techniques for crops and livestock
as well as preparation of advisory materials
3. Conducting a detailed farm survey to identify the major socio/economic
constraints of the development of the farms and analysis of the economic
viability of the different farm enterprises
4. Programme to improve the collection, storage, transportation and marketing
facilties for the produce
5. Programme to rehabilitate and maintain the on-farm roads to all-weather
standard.
The formulation of such a comprehensive project and the investigations to
follow will no doubt be greatly facilitated by the base data provided from the
present study.

-XIII-
Samenvatting
In een gebied ter grootte van 32.500 ha is een onderzoek uitgevoerd met het
oogmerk om de beperkingen van het landgebruik, van het klimaat en de bodems
nader te bepalen en tevens is onderzocht hoe deze beperkingen kunnen worden
bijgesteld. Het gebied ligt in Kenia op het Kinangop plateau, waar, verdeeld
over zeven vestigingsgebieden,(South Kinangop, Bamboo, Njabini, Githioro,
Karati, Muruaki en Tulaga) zich 2.881 boerengezinnen hebben gevestigd.
In hoofdstuk 4 worden de resultaten van de klimaatsanalyses en het
bodemonderzoek gegeven. De gemiddelde jaarlijkse temperatuur ligt tussen ll'C
en 15°C terwijl de gemiddelde maandelijkse temperatuur tussen 10°C en 16°C
ligt. Voor de groei van gewassen die veel warmte vereisen zijn deze lage
temperaturen niet bevorderlijk. De voor dit gebied in aanmerking komende
gewassen (zie tabel 5) zijn pyrethrum, aardappelen, kool, bloemkool, bladkool,
wortelen, uien, prei, erwten, zonnebloemen, tarwe, gerst, bieten, haver,
voederbieten, appelen, pruimen, peren en perzikken. Aangezien nachtvorst
frequent voorkomt in het gebied, kunnen nachtvorst-gevoelige gewassen zoals
aardappelen en zonnebloemen, alleen verbouwd worden gedurende de vorstvrije
periode. Deze periode strekt zich uit van medio maart tot medio juni. Dat
houdt in dat de huidige verbouwde laatrijpende mais variëteiten door de boeren
geteeld worden met een aanzienlijk gevaar voor vorstschade.
De regenval en de betrouwbaarheid van de regenval is over het algemeen
voldoende. Er zijn echter grote verschillen in vochtbergend vermogen, zoals
uit de tabellen 21a tot en met 21c duidelijk wordt. Naarmate het vochthoudend
vermogen van de bodem hoger ligt, wordt meer voldaan aan de evapotranspiratie
behoefte van de plant. Er werd vastgesteld dat om zeker te zijn van een
driemaandelijkse groeiperiode tenminste 90 mm beschikbaar vocht binnen een
bewortelbare bodem van 1 m aanwezig moet zijn.
Op een schaal van 1:50.000 worden 34 bodemeenheden onderscheiden en deze zijn
beschreven in hoofdstuk 5. De bodems zijn geclassificeerd in 17 eenheden
volgens het FAO/UNESCO systeem en in 26 bodemfamilies volgens
het USDA Soil Taxonomy classificatiesysteem. De bodems zijn in het algemeen
diep en zwaar. Sommige bodems zijn van nature goed ontwaterd, terwijl andere
onvoldoende tot slecht ontwaterd zijn. De onvoldoende en slecht ontwaterde

-XIV-
bodems beslaan een oppervlakte van 22.450 ha en bij deze bodems is er een
dichte kleilaag (alay pan) aanwezig die in hoge mate de effectieve
bewortelingsdiepte beperkt. Alle bodems hebben een lage bodemvruchtbaarheid en
een lage pH. Vanwege de geringe effectieve bewortelingsdiepte hebben de
onvoldoende en slecht ontwaterde bodems een gering vochthoudend vermogen
terwijl dit groot is bij de bodems met een goede ontwatering.
Het huidige en vroegere (rond 1960) landgebruik is beschreven in de
hoofdstukken 2 en 3 en de mogelijke vormen van landgebruik (landgebruikstypen)
met de daaraan gerelateerde landgebruiksbehoeften zijn geïdentificeerd. Ook de
landhoedanigheden (land qualities) zijn onderzocht. Deze zijn getoetst aan de
behoeften van de landgebruikstypen ten einde de beperkingen vast te stellen
met de mogelijke verbeteringen.
Zeven landgebruiktstypen zijn in het gebied te onderscheiden; zij zijn
weergegeven in hoofdstuk 6.2. Deze zijn:
1) Kleinschalige regen-afhankelijke akkerbouw van jaarlijkse niet-graan
gewassen met een laag bedrijfvoeringsniveau.
2) Kleinschalige regen-afhankelijke akkerbouw van jaarlijkse niet-graan
gewassen met een matig (intermediate) bedrijfsvoeringsniveau.
3) Matig grootschalige regen-afhankelijke akkerbouw van graangewassen met
een matig bedrijfsvoeringsniveau.
4) Kleinschalige regen-afhankelijke fruitbomenteelt met een matig
bedrijfsvoeringsniveau.
5) Kleinschalige veehouderij (koeien en schapen) met een matig
bedrijfsvoeringsniveau.
6) Houtproductie voor brandhout en bouwhout.
7) Vijvers voor visteelt
De landhoedanigheden voldoen in meerdere of mindere mate aan de
landgebruiksbehoefte van het landgebruikstype en zijn dan ook in vergelijkbare
termen gesteld. De relevante landhoedanigheden voor elk landgebruikstype zijn
aangegeven in hoofdstuk 7.
Deze zijn gerelateerd aan:
1) Beschikbaarheid van vocht voor het gewas
2) Beschikbaarheid van drinkwater
3) Beschikbaarheid van voedingsstoffen voor de plant
4) Erosiegevoeligheid

-XV-
5) Mogelijkheden tot gebruik van landbouwwerktuigen
6) Verankeringsmogelijkheid voor de plant (foothold)
7) Risico's van verzouting
8) Beperkingen t.g.v. de natuurlijke vegetatie
9) Risico van overbeweidlng
10) Risico van ziekten en plagen
11) Gevaar van windschade
12) Risico's van bosbranden
13) Mogelijkheden tot visvijver constructie
De landhoedanigheden zijn gekwantificeerd en in klassen ingedeeld ter bepaling
van de geschiktheid volgens een schema weergegeven in appendix 5. De gradaties
van de landhoedanigheden voor elk van de voorkomende bodenveenheden zijn
gegeven in tabel 24. De gradaties van de landhoedanigheden van de
bodemeenheden zijn vergeleken met de landgebruiksbehoeften van elk
landgebruikstype om op die manier de actuele landgeschiktheid vast te stellen
en bovendien de voornaamste landbeperkingen te identificeren. De actuele
landgeschiktheid voor elk landgebruiksalternatief is in tabel 26 weergegeven.
De goed ontwaterde gronden (10.050 ha) zijn in het algemeen marginaal tot
matig geschikt voor akkerbouw, terwijl de onvoldoende ontwaterde gronden
(22.450 ha) ongeschikt zijn. De onvoldoende ontwaterde gronden zijn marginaal
voor houtproductie en beweiding maar matig tot goed geschikt voor de
constructie van visvijvers.
Dé belangrijkste landbeperking zijn de onvoldoende ontwaterde bodems die
22.450 ha van het totale onderzochte gebied beslaan. Vooral de
vestingsgebieden Muruaki, Githioro, Karati en Tulaga (zie fig. 2) hebben
drainage problemen. Voor Githioro en Karati geldt dit in het bijzonder omdat
die gebieden tamelijk vlak zijn en niet versneden. De wat minder belangrijke
beperkingen zijn: de geringe effectieve bewortelingsdiepte, wat het
duidelijkst zichtbaar is in de bodem met een dikke kleilaag (clay pari); het
lage fosfaatgehalte; het lage stikstofgehalte en de lage pH.
Een vierjarig drainage veldonderzoek is uitgevoerd van 1976 t/m 1979 om de
effectiviteit te vergelijken van slootdrainage, slootdrainage met diepwoelen,
akkers op ruggen met greppels (aambevbeds).
Hoofdstuk 10 geeft de resultaten van dit veldexperinent weer. Geconstateerd

-XVI-
werd dat akkers met greppels redelijk drainage- verbeterend werkt en dat het
gemakkelijk geïntroduceerd kan worden in kleinschalige akkerbouw althans
indien er een goed netwerk van waterlopen aanwezig zou zijn.
Met gebruikmaking van kunstmest, stalmest en bekalking kan de
bodemvruchtbaarheid aanzienlijk worden verbeterd. De gebieden met geringe
effectieve bewortelingsdiepte kunnen het beste gebruikt worden voor beweiding,
houtproductie en het aanleggen van visvijvers. In hoofdstuk 2.3 worden een
aantal Eucalyptus, Cupressus en Pinus soorten genoemd die het goed doen op
deze ondiepe gronden.
Voor het studiegebied zou het noodzakelijk zijn een alomvattend landontwikke-
lingsproject te starten. Zo'n project zou de navolgende deelprojecten moeten
omvatten:
1) Verbetering van de oppervlakkige drainage en het vocht bergend vermogen.
2) Onderzoek naar de meest geschikte teelttechnieken en veehouderij
methodieken, terwijl tevens voorlichtings materiaal zou moeten worden
opgesteld.
3) Gedetailleerde bedrijfsstudies om de belangrijkste socio-economische
beperkingen van de bedrijfsontwikkeling te onderkennen, met een kosten
en baten analyse van de verschillende bedrijven.
4) Een programma om oogstmethoden, opslag, transport en afzet van de
landbouwproducten te verbeteren.
5) Een programma tot herstel en onderhoud van de bedrijfswegen voor
permanent gebruik (all weathev).
De basis gegevens uit onderhavig onderzoek zullen ongetwijfeld van nut zijn
bij het opstellen van zo'n integraal project en het daarmee samenhangend
onderzoek.
*******
PART 1
INTRODUCTION
1. INTRODUCTION
1.1 GENERAL
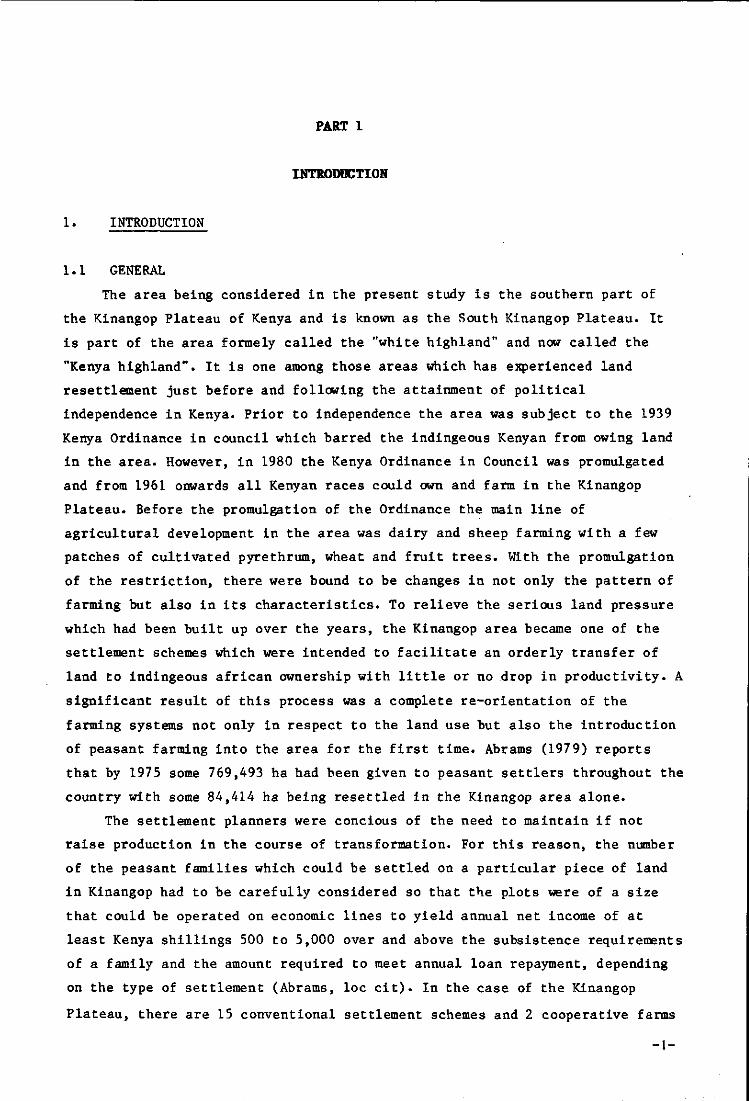
The area being considered in the present study is the southern part of
the Kinangop Plateau of Kenya and is known as the South Kinangop Plateau. It
is part of the area formely called the "white highland" and now called the
"Kenya highland". It is one among those areas which has experienced land
resettlement just before and following the attainment of political
independence in Kenya. Prior to independence the area was subject to the 1939
Kenya Ordinance in council which barred the indingeous Kenyan from owing land
in the area. However, in 1980 the Kenya Ordinance in Council was promulgated
and from 1961 onwards all Kenyan races could own and farm in the Kinangop
Plateau. Before the promulgation of the Ordinance the main line of
agricultural development in the area was dairy and sheep farming with a few
patches of cultivated pyrethrum, wheat and fruit trees. With the promulgation
of the restriction, there were bound to be changes in not only the pattern of
farming but also in its characteristics. To relieve the serious land pressure
which had been built up over the years, the Kinangop area became one of the
settlement schemes which were intended to facilitate an orderly transfer of
land to indingeous african ownership with little or no drop in productivity. A
significant result of this process was a complete re-orientation of the
farming systems not only in respect to the land use but also the introduction
of peasant farming into the area for the first time. Abrams (1979) reports
that by 1975 some 769,493 ha had been given to peasant settlers throughout the
country with some 84,414 ha being resettled in the Kinangop area alone.
The settlement planners were concious of the need to maintain if not
raise production in the course of transformation. For this reason, the number
of the peasant families which could be settled on a particular piece of land
in Kinangop had to be carefully considered so that the plots were of a size
that could be operated on economic lines to yield annual net income of at
least Kenya shillings 500 to 5,000 over and above the subsistence requirements
of a family and the amount required to meet annual loan repayment, depending
on the type of settlement (Abrams, loc cit). In the case of the Kinangop
Plateau, there are 15 conventional settlement schemes and 2 cooperative farms
-1-

with a total of about 6,545 plot holders settled. The average plot size ranges
from 5.54 ha in the high density schemes to 17.53 ha in the low density
schemes.
The Settlement Department provided a detailed subdivision plan drawn on
scale of 1:2,500 and giving plots that were designed to yield the annual net
income of Kenya shillings 500 to 5,000 based on 1963 prices (Kenya shilling
7.0 = U.S. dollar 1.0). Careful consideration was supposed to have been given
to drainage, soil types, water availability and access roads to each plot. The
plot boundaries followed contour drains. The land was categorised as fertile,
fair and poor and designated Class I, Class II and Class III respectively.
Class I land was considered to have a Kenya Shilling 480 per hectare
profitability potential and Class II land a Kenya Shilling 240. The land which
was only suitable for permanent grazing or building site was classified as
Class III land. Even if the haste with which the settling had to be carried
out is recognised, it is to be appreciated that categorising land in terms of
its soil fertility alone can not be without serious déficiences. The size of
the plots has in many cases not been well adapted to the production potentials
of the particular land.
Land purchase loans amounting to 10% of purchase price were given at 6%
annual interest and repayement over 30 years in sixty half yearly equal
instalments. In addition, a development loan repayable over 10 years by way of
twenty half yearly equal instalments was given. The lending of money to the
new farmers was a comparativelty easy process. However, the recovery of the
loan has not been as easy. Abrams (loc cit) states that as at the end of
December 1975, the Kenya pounds 8.313 million had been recovered out of the
billed Kenya pounds 17.129 million and only 1,414 plot holders out of 32,294
had been able to keep 100% repayement rate. The inability of the majority of
plot holders to keep up the loan repayement is not without pertinent reasons
some of which may be the land resource constraints. With the coming of peasant
farmers to the settlement schemes, especially the Kinangop Plateau settlement
schemes, the whole farming outlook has been forced to change, with new
problems also being created.
The new outlook in farming in the South Kinangop Plateau is essentially
peasant and so are problems which have been created. New crops which used not
to be grown in the area under large scale farming have emerged. In the same
way a new pattern of livestock farming has emerged. Settlement has unwittingly
produced a diversification and intensification of the farming without a base
to do so.
-2-
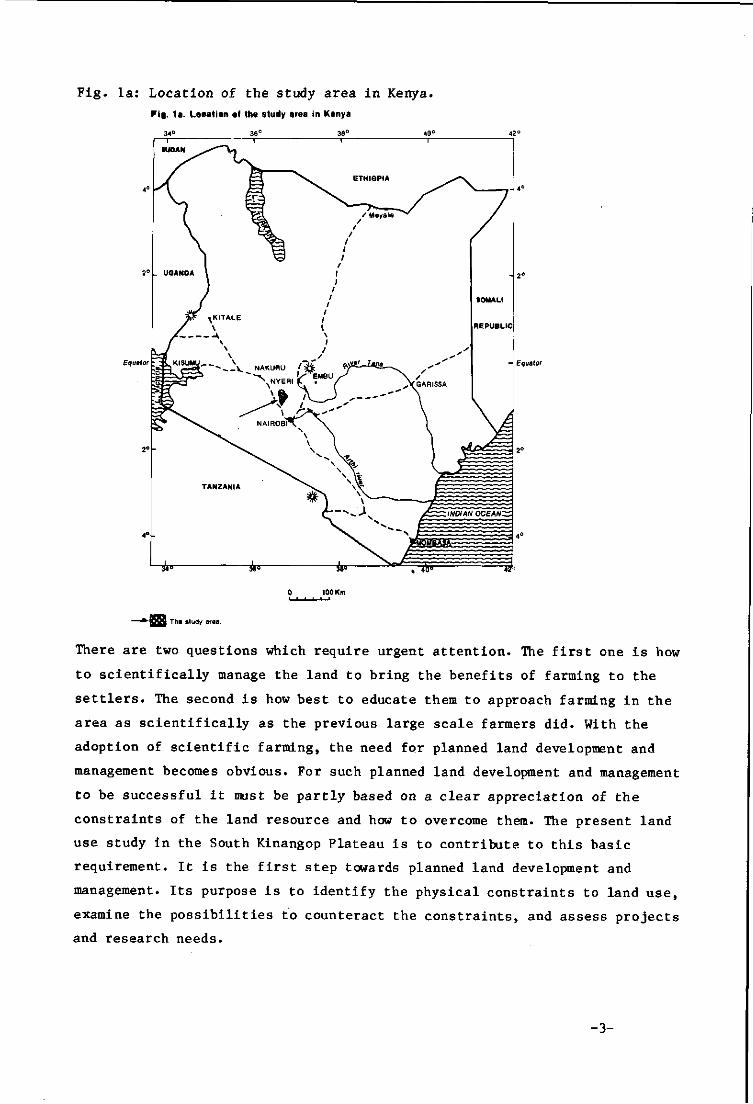
Fig. la: Location of the study area in Kenya. Fla,. 1a. Leeatien of the study area in Kenya
34° 36° 38°
Equator
0 100 Km • • • • •—i
I The study area.
There are two questions which require urgent attention. The first one is how
to scientifically manage the land to bring the benefits of farming to the
settlers. The second is how best to educate them to approach farming in the
area as scientifically as the previous large scale farmers did. With the
adoption of scientific farming, the need for planned land development and
management becomes obvious. For such planned land development and management
to be successful it must be partly based on a clear appreciation of the
constraints of the land resource and how to overcome them. The present land
use study in the South Kinangop Plateau is to contribute to this basic
requirement. It is the first step towards planned land development and
management. Its purpose is to identify the physical constraints to land use,
examine the possibilities to counteract the constraints, and assess projects
and research needs.
-3-

Fig.lb. The study art«
36° 40*S
36° 40 'E
- "~ ~~~ — Road
i l i l Escarpment
Building
Kljabe HIM
The study is also aimed at demonstrating how the methodology of the
framework for land evaluation (FAO, 1976) can be used as a first basis for
determining the form of improvement of the land use of an area with settlement
schemes having traditional or improved traditional farming. Moreover, only a
few examples are available in Kenya where the land evaluation have been
carried out according to the framework and so far examples do no exist for
comparable areas.
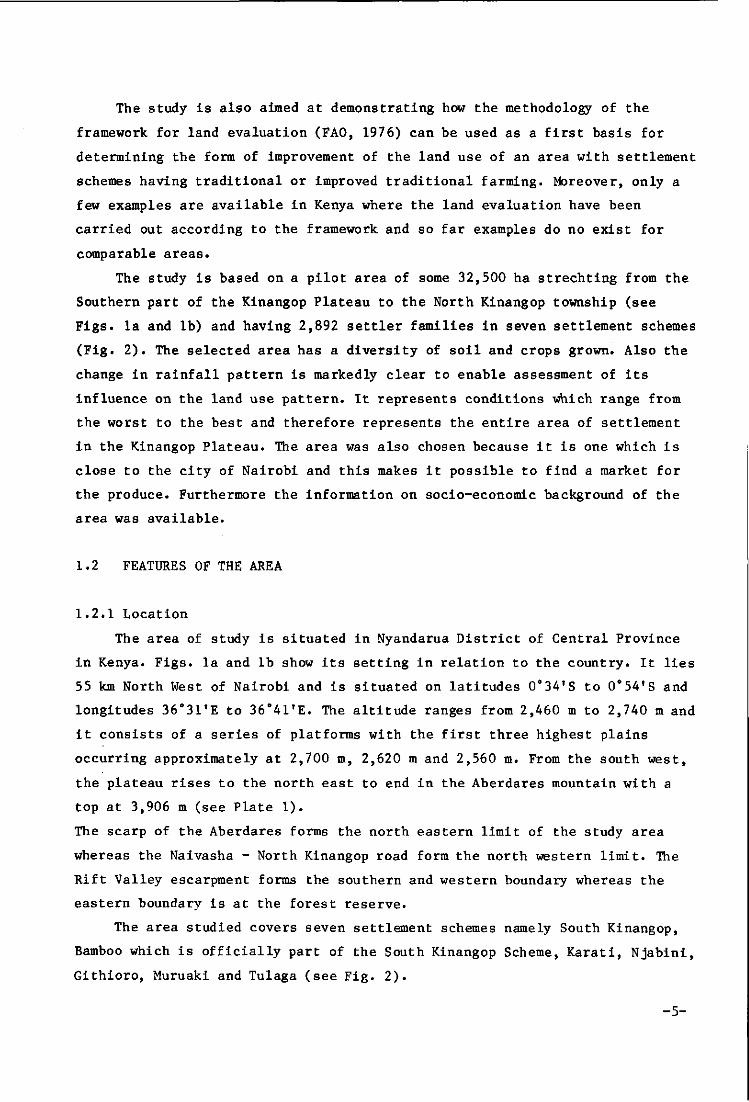
The study is based on a pilot area of some 32,500 ha strechting from the
Southern part of the Kinangop Plateau to the North Kinangop township (see
Figs, la and lb) and having 2,892 settler families in seven settlement schemes
(Fig. 2). The selected area has a diversity of soil and crops grown. Also the
change in rainfall pattern is markedly clear to enable assessment of its
influence on the land use pattern. It represents conditions which range from
the worst to the best and therefore represents the entire area of settlement
in the Kinangop Plateau. The area was also chosen because it is one which is
close to the city of Nairobi and this makes it possible to find a market for
the produce. Furthermore the information on socio-economic background of the
area was available.
1.2 FEATURES OF THE AREA
1.2.1 Location
The area of study is situated in Nyandarua District of Central Province
in Kenya. Figs, la and lb show its setting in relation to the country. It lies
55 km North West of Nairobi and is situated on latitudes 0°34'S to 0°54'S and
longitudes 36"31'E to 36°41'E. The altitude ranges from 2,460 m to 2,740 m and
it consists of a series of platforms with the first three highest plains
occurring approximately at 2,700 m, 2,620 m and 2,560 m. From the south west,
the plateau rises to the north east to end in the Aberdares mountain with a
top at 3,906 m (see Plate 1).
The scarp of the Aberdares forms the north eastern limit of the study area
whereas the Naivasha - North Kinangop road form the north western limit. The
Rift Valley escarpment forms the southern and western boundary whereas the
eastern boundary is at the forest reserve.
The area studied covers seven settlement schemes namely South Kinangop,
Bamboo which is officially part of the South Kinangop Scheme, Karati, Njabini,
Githioro, Muruaki and Tulaga (see Fig. 2).
-5-

•Ü**?'5-'v' -
Plate 1: The landscape: Aberdare mountains in background and overgrazed
pasture in foreground.
1.2.2 Population
No precise figure can be given about the population but some 2,892
persons own land in the area under study. Furthermore there are persons
employed from outside as government agricultural, settlement, administration,
forestry, police and health workers. Besides, there are cooperative workers
and business people at many trading centres that exist in the area. The
population including that of the farming families consist of people of diverse
ethnic groups and agricultural background. They need more technical guidance
and assistance for agricultural production.
1.2.3 Infrastructure
At the inception of the settlement in the area in the early sixties, a
network of major roads, access roads and settlement administration centres
were established. Although the external road communication of the area with
Nairobi, Thika, Nyahurururu and Naivasha (see Fig. 1) is still good, some of
the roads within the study area are now in very bad shape. Those roads
classified as settlement access roads and which do not fall under the Ministry
-6-

Fig.2 Settlement Schemes of the study area
— _ - * • " ^
_, , -^ - 'KAHimu\ l?/ „ ^ T " " 7 ~ X S E T T L E M E N K / «
/ — .S 'x X x \ » » Kahuru Sch. p N v ^ /^ N
v / 1
To M M M
36" 40"E
0" 45'S
36° 40'E
Scheme boundary
Road
l i l i Escarpment
K . 1 °
36° 35'E

of Transport and Communication's classified roads are the worst affected.
Recognizing the harm that poor road communication in the area may bring to the
agricultural production, the Ministry of Transport and Communication of the
Kenya Government has examined the required rehabilitation of roads which they
estimate will cost about Kenya £3,400 per km as per 1977 prices (DANIDA,
1977). The annual maintenance cost thereafter is estimated at Kenya £240 per
km. It is possible that the road rehabilitation programme could favourably
attract external funding under the Kenya Goverment's Rural Access Road
Programme. It should however, be emphasized that the maintenance of the roads
is as important as the rehabilitation. For this reasons there should be a
definite commitment to the annual maintenance of the roads by the government.
With passable roads throughout the year it can be expected that the amount of
produce transported from the farmers will substantially increased to enhance
the agricultural productivity by the farmers.
Two health centers and two large market centres exist at North Kinangop
and Njabini townships. There also exist small market center which are fairly
well distributed in the area. Similarly, many schools are available and are
well distributed throughout the area.
1.2.4 Marketing
The main agricultural production that prevails in the area is dairy
production. This is supplemented with the production of mainly wool, potatoes,
cabbages, pyrethrum, maize, barley, wheat, green peas and leeks. Table 1 gives
the agricultural production and marketing of some of the produce in 1975 and
1976 after resettlement and in 1961 before the resettlement.
The main outlets for carrots and green peas are respectively the
dehydration factory of the Pan African Foods Ltd. in Naivasha and the Kabazi
Canners Factory at Kabazi in Nakuru. The Pan African Foods Ltd. enter into
delivery constracts with the farmers through the Farmers Cooperative Union.
The company provides seeds and chemicals on credit, organizes transport for
collection of the produce from the farmers and sees that the farmers harvest
their produce according to a plan that fits with the needs for an even supply
to the processing plant. The contracts stipulate a certain minimum production
and in order to encourage the farmers to honour the contract, bonuses are paid
when the minimum production under contract is exceeded.
-8-

Table 1: Production and Marketing of some agricultural produce from the Kinangop area during 1975 and 1976 after resettlement. (Source: Annual Report for 1975 and 1976 of the Kinangop complex, Department of Settlement, Kenya).
Produce
Milk Wheat Barley Potatoes Carrots Pyrethrum Cabbages Green peas Wool Vegetables
Metric tons nd nd nd 3,000 3,000 nd
478 268
nd nd
1975 K£
nd nd nd 33,100 33,350 nd
4,800 6,850
nd 78,100
Metric tons 16,086 nd nd nd nd
522 nd nd
55 nd
1976 K£
721,150 nd nd nd nd 125,050 nd nd
25,900 nd
nd = no data.
Note: Milk, pyrethrum and wool figures cover only the first 11 months of the year. Figures for carrots and cabbages are sales to the Pan African Foods Factory while green peas are sales to the Kabazi Canners Factory. A certain amount of cabbages, carrots and green peas is definitely sold to private traders and no data can be given.
The production and marketing of some agricultural produce from the Kinangop area in 1961 before the resettlement. (Source: Annual Report of Department of Agriculture, South Kinangop, 1961).
Produce
Milk Wheat Barley Potatoes Carrots Pyrethrum Cabbages Green peas Vegetables Wool
(pulse drops)
'Production
nd 15,539 metric tons 2,692 3,600
nd 2,677.3 metric tons
nd 18.2
318.2 nd
Total value (K£)
nd 323,000 49,482 36,000
nd 589,000 nd
4,000 7,000
nd
Note: Converted to the metric units from the original imperial units. 1 bag wheat =90.7 kg : 1 bag barley = 81.6 kg 1 bag potatoes = 90 kg : 1 kg - 2.2 lbs. 1 Kenya pound • 20 Kenya shillings.
-9-

Other outlets for vegetables consists of private traders who collect
vegetables directly from the farmers for sales in urban centres, mainly
Nairobi wholesale and retail markets. Potatoes, leeks and cabbages are mainly
bought by private traders from the farmers. According to the information from
the Agricultural Economics Department of the University of Nairobi quoted by
the German Agricultural Team (1976), the total daily consumption of vegetables
in Nairobi is as follows: Cabbage, 9,500 metric tons; carrots, 3,200 metric
tons; green peas, 1,500 metric tons; potatoes, 35,000 metric tons. About 40 to
60 percent of the produce sold in Nairobi pass through the whole-sale market.
There is no fixed price system between the private traders and the farmers.
They strike a balance at each delivery. The prices may be extremely low during
the peak production season but could also be very high during the off season.
For the other produce namely milk, pyrethrum, wheat, barley, maize and
wool, secured market outlets exist. The milk, pyrethrum and wool are
respectively sold to the Kenya Cooperative Creameries, the Pyrethrum Marketing
board and the Kenya Farmers Association through collection centres organized
by the Farmers Cooperative Union. Maize, wheat and barley, like the rest of
the produce, are respectively sold to the National Cereal and produce Board
(for maize and wheat) and Kenya Breweries (for barley) through individual
arrangement by the farmers.
The marketing for the bulk of vegetables produced in the area needs to be
improved. In the original conception of the settlement programme it was
expected that cooperative societies would solve many marketing problems. The
cooperatives were not only expected to deal with matter like mechanization but
also intended to be the pillar of increased productivity. They would provide
the best method for farming the land economically, make large marketing
possible and thus benefit the individual peasant farmer both at the production
and marketing levels. One of the administrative conditions imposed on the
settlers has therefore been the insistence that the head of the family becomes
a member of a marketing cooperative society from the day that they sign the
necessary letter of allotment. All the suppositions assumed that the
cooperative society would be well run and function perfectly. As it is, the
majority of the cooperative societies have not functioned well. The success of
cooperative however depends on social considerations such as the willingness
of the people to work together. But the lack of the right person at the
leadership and management of the farmers cooperative societies has given rise
to improper functioning of the cooperative societies. This is one of the
-10-

aspects that need to be streamlined to achieve effective and beneficial
marketing system for the farmers. The Kinangop Cooperative Union must be
operated efficiently and be adequately mobile in terms of vehicles for
transporting produce. The union also needs to work closely with the
Horticultural Cooperative Union for the purpose of the marketing of
vegetables.
There are also other facilities like the grading, packing, collection and
storage centres for the horticultural crops which need to be improved in order
to secure good average prices in the fresh vegetable markets. This matter it
is understood is receiving the due attention it deserves.
1.2.5 Extension services
The extension services in the area under the staff of the Ministry of
Agriculture, the Department of Settlement and the Ministry of Cooperative
Development. The efforts of these ministries are supplemented with that of Pan
African Foods Ltd. who provide extension service to the farmers for the
production of vegetables particularly carrots. In 1976 some 33 agricultural
staff and 14 cooperative staff were operating in the Kinangop area (Department
of Settlement, Kinangop Complex Annual Report, 1976). Furthermore, the Njabini
Farmers Training Centre which is located in the study area also provides some
extension work. Although the number of extension staff may appear small in
relation to the number of farmers to be assisted (above 10,000 plot holders)
perhaps what is more essential is a streamlined extension approach to enable
the farmers to be easily reached. As already stated under the general
information, there is urgent need to bring the benefits of farming to the
settlers and to educate them to approach farming in a scientific way. For this
reason, it is desirable that methods of extension such as demonstration, field
days, tours, cinemas and courses be itensified. Moreover the coordination of
timely supply of inputs, improved agricultural husbandry and marketing, needs
to be given greater emphasis.
1.3 BACKGROUND DATA AND OBJECTIVES OF THE PRESENT STUDY
The study area which is a rural settlement is agriculturally important
for the production of food crops, pyrethrum, milk and wool. In spite of its
agricultural importance only general soil investigations of the area have been
carried out.
The area constains a range of soils including Planosols which become
-11-

waterlogged during the rainy season. Gethin-Jones and Scot (1958) published a
soil map on scale 1:3,000,000 which being too small, places the area under one
soil namely "dark brown clays with light textured top soils". Moreover the
soil they so identified lacks proper characterization in terms of laboratory
data and field description. Undoubtedly, an area as large as the Kinangop
Plateau (about 100,000 ha), can not possibly have only one kind of soil. This
deficiency was recognised by the German Agricultural Team (loc cit) during
their pre-feasibility study of the development of the Kinangop Plateau. Among
the recommendation arising from the study was one which called for a soil map
on scale 1:100,000 and which would indicate the proportion of different soils
together with their limitations to crop production. Following this
recommendation and in order to gain a preliminary impression about the soils,
Rachilo (1978) carried out a generalised appraisal (scale 1:100,000) of the
soils of an area covering about 108,430 ha and including the area of the
present study. For the present study area, the report indicates seven soil
units described as follows:
well drained, deep to very deep, reddish brown, friable, clay to
gravelly clay (ando-ferric ACRISOLS)
well drained, very deep, dark reddish brown to very dark greyish brown,
friable clay (mollic ANDOSOLS)
imperfectly drained to poorly drained, deep very dark greyish brown,
mottled, friable to firm, clay, abruptly underlying 45-55 cm of silty
clay loam to clay loam, with many iron-manganese concretions at
transition (dystric PLANOSOLS)
imperfectly drained to poorly drained, deep, very dark grey to greyish
brown, mottled, firm clay (eutric GLEYS0L)
poorly drained, deep, very dark greyish brown to very dark grey,
mottled, very firm clay, abruptly underlying 30-45 cm of silty clay loam
to clay loam, with common iron-manganese concretions at transition
(dystric PLANODOLS)
- complex of well drained, shallow to moderately deep, dark brown to very
dark brown, friable, clay loam to clay.
It reveals that the soils vary in depth from moderately deep to very deep and
similarly the drainage range from good through imperfect to poor.
Recognizing the marked variation revealed by the preliminary
investigation of Rachilo (loc cit) even at the small scale of mapping, it was
considered appropriate to study the area in a little more detail at semi-
-12-

detailed level (scale 1:50,000) in order to provide a base for determining the
need for more detailed soil investigation and assessment of the constraints of
the land resource to the agricultural production in the Kinangop Plateau.
Since soils and climate may be inseparable with regard to the assessment of
agricultural production potential, the study also includes the examination of
the rainfall and temperature of the area. The objectives of the study were
therefore the following:
1. To examine the present land use
2. To analyse the rainfall and temperature regime of the area
3. To map the soils at semi-detailed level, scale 1:50,000
4. To define the relevant land utilization types and their requirements
5. To establish grades of the relevant land qualities and to determine how
they fit the requirements of the land utilization types
6. To establish on the basis of the identified constraining land qualities
the present (current) land suitability and to suggest how the
constraints may be removed partly or completely by minor improvements of
the land or adaptation of the land utilization type
7. To examine the possibility of improving the soil drainage and to
determine the potential land suitability
8. To suggest any further investigations and projects necessary for the
improvement of agricultural production in the area.
1.4 THE METHODS USED FOR ACQUIRING THE DATA
The study primarily concerns the examination of the present pattern of
land use, the climatic trends and the nature of soils. The interaction of
these variables are then investigated with a view to arrive at the present
land suitability without any major improvement. Attempt is also made to
investigate the possibility for improving the drainage of the imperfectly
drained and poorly drained soils so as to assess the possibility of improving
the land use. The following is a brief outline of the methods that have been
applied for the acquisition of the data.
The data on present land use with regard to crops and livestock were
acquired by studying the annual reports of the South Kinangop Divisional
Agricultural Office for the period 1964 to 1975. This was supplemented with
published data such as that of Odingo (1971) and also ground observation. Also
possible crops for introduction such as rice were investigated. The pattern of
land use with regard to trees was however acquired by observing and collecting
-13-

the trees growing in the area. Some of the trees were sent to the Kenya
Herbarium for identification. The performance, dominance of the tree species,
and the purpose of growing the trees were noted at specific sites where soils
profiles had been studied.
The climatic data were obtained from the published reports of the Kenya
Meterological Department (1970, 1974 and 1975) and Jaetzold (1976). For the
purpose of assessing the state of the night frost in the area and also for the
purpose of the experiment on the improvement of drainage, a meterological
recording station (see Plate 2) was established in 1975.
The station involved the records of only temperature, rainfall and A-Pan
evaporation. It was operated until the end of 1980.
The soils were studied at semi-detailed scale of 1:50,000. Aerial
photographs were first studied and tentative soil boundaries marked on the
basis of topography and pattern on the photographs. Auger observations were
then made to identify the different soils. This was followed by a
comprehensive description and sampling of the representative profiles. The
results of soil analysis together with further augering where necessary were
used to fix the boundaries between the soils. The interpretation of the soils
was made in order to determine their present and potential suitability for
agricultural and forestry development. The possibility for improving the
drainage of the poorly drained soils was investigated by conducting a
preliminary drainage experiment to test ripping, ditch drain and camberbed.
The details on the layout of this experiment are found in Part 3, section 10.
-14-

Plate 2: The field meteorological station set for the drainage investigation.
-15-

PART 2
ACQUIRED DATA AND THEIR IMPLICATION
2. THE LAND USE BEFORE RESETTLEMENT AND THE PRESENT PATTERN OF LAND USE
2.1 ARABLE AGRICULTURE
The prevailing topography in most of the study area is very gently to
gently undulating. This type of topography lends itself to mechanized farming
for small grain cereal. It is for this reason as well as climate among others,
it is found that before the area was broken up for small holders settlement,
the mechanized farming for small grain cereal was the main type of farming
practised. Because of the rainfall which is distributed throughout the year in
the area and appropriate temperature, not only two crops of wheat were
possible to be grown in a year but also the wheat could be grown together with
other crops such as barley, oats and pyrethrum (see Annex 6 for the scientific
names of the crops). According to Odingo (loc cit) the following was the land
occupied by the major crops in the Kinangop in 1960 before the small-farm
resettlement.
Table 2: Land occupied by the major crops in the Kinangop area in 1960 (According to Odingo, 1971).
Crop Area (ha) As percentage of cultivated land
Remarks
Wheat Barley Oats Pyrethrum Linseed Grass leys
840 560 400 extensive 400 480
10-19 5-9
more than 5 20-25 no data 20
mostly in North Kinangop
on higher lying parts
Pyrethrum was apparently an important crop for the mixed farming. It was
extensively grown on the higher lying part of the Kinangop Plateau and
occupied about 20 to 25 percent of the cultivated land in the whole area. Its
importance might have arisen from the fact that it is a relatively easy crop
to produce which might have proved easy to adopt as a sideline to dairy
farming since it is economical in terms of the land size required. The small
grain cereals were rotated with pyrethrum. No maize was grown in the area and
grass ley farming was quite successful.
-16-

Fig 3 Main crops of the settlement schemes during 1975.
Py: Pyrethrum
Po: Potato
Ca: Cabbage
Ct: Carrot
On: Onion
Pe: Pea
0° 45 ' S
36° 40 E L: Leek
Mz: Maize
W: Wheat / Barley
K: Kale
Oa: Oats
Fb: Fodder - beetroot
Md: Mangold
AAA Escarpment
17

Plate 3: Example of cropmix: cabbages and potatoes grown in some farms.
^M^KpLè 9RMpin|pR^P9
As already stated, from 1961 the land ownership in Kinangop Plateau was
open to all Kenyans and the area consequently placed to small holder
settlement scheme. The area attracted settlement partly because it was a mixed
farming area and partly because it was assumed that the system of farming
being followed in these'' areas could coveniently be adopted or modified to suit
the requirements of small holder farming. However, profound changes in both
the nature and pattern of farming followed the land resettlement in the
Kinangop area. Table 3a to 3g in Annex 1 provide approximate indication of the
land occupied between 1964 and 1975 by various crops in the Kinangop
settlement schemes covered by the present study while Fig. 3 shows the major
crops found in the schemes. The data refer to the long rain cultivation (March
to June) when most of the land is generally cultivated in the Kinangop area.
Since intercropping is characteristic of the farming in the area, this may
lead to underestimate or overestimate of the area under some crops. The crops
likely to be affected in this respect are potato, peas, cabbages, kale and
leek which sometimes occur in mix as seen in Plate 3.
The growing of crops is substantial in all the schemes covered by this
study except in the Githioro scheme. The latter area also happens to contain
predominantly the typical Planosols of the area. Pyrethrum is grown throughout
the area but the main production areas seem to be the South Kinangop, Njabini,
Muruaki, Tulaga and Bamboo schemes. Potatoes are also grown throughout the
area but the main growing areas found in Njabini, Tulaga and South Kinangop
schemes. The main schemes for cabbages are Njabini, South Kinangop and Tulaga
whereas carrots are produced mainly from Tulaga and South Kinangop.
-18-

South Kinangop is the main onion producing areas whereas peas are mainly
produced in the South Kinangop, Njabini and Tulaga schemes. The main areas for
leeks are found in Njabini, South Kinangop and Tulaga. Maize growing is
concentrated in South Kinangop, Njabini, Karati and Tulaga. The areas for
wheat are found in Muruaki and Githioro, whereas the production of kale is
concentrated in Njabini, South Kinangop, Muruaki and Bamboo schemes. The
schemes where oats is mainly produced are Tulaga, South Kinangop, Muruaki,
Njabini and Karati. Beet is produced from Muruaki, Tulaga and Njabini whereas
mangold is produced mainly in the Muruaki, Njabini and Tulaga schemes.
The development of the crops within the schemes since 1964 to 197 5 follow
certain trends which cannot be fully explained in the present study. For the
South Kinangop Scheme, pyrethrum, potatoes, peas and maize were the major
crops in 1964. They are still the major crops to date but also have cabbages,
carrots, onions and oats are present. Following the drop in the cultivated
land in Kinangop scheme during 1965 to 1969 mainly due to reduced growing of
potatoes, peas and maize, there was a general increase in the cultivated land
from 1970 with a substantial increase in the growing of pyrethrum. Small areas
of wheat were tried in 1969 and 1970 but later abandoned.
For the Bamboo Scheme, pyrethrum, potatoes, maize and peas were the main
crops in 1964. This situation changed in 1975 to give rise to pyrethrum,
potatoes, cabbages, carrots and kale as the main crops. Drastic drop in the
growing of most crops especially potatoes, cabbages, peas, maize and kale
occurred in the Bamboo scheme after 1971. Pyrethrum however still remains the
major crop. There was substantial growing of the beet in 1970.
The Karati Scheme had mainly pyrethrum, potatoes, peas and maize in 1964.
By 1975 other crops were also grown included cabbages, carrots, wheat, kale,
oats, beet and mangold. The main crops grown lately are however pyrethrum,
cabbages, potatoes, peas, maize and oats. The period 1968 to 1970 was the
major period for wheat growing whereas the growing of potatoes substantially
decreased in 1974 and 1975.
In the Njabini Scheme, the main crops grown in 1964 were pyrethrum,
potatoes, peas and maize. These crops are still very prominent in the area.
Other crops that figure prominently are cabbages, carrots, leeks, kale, oats
and beet. The growing of wheat occurred during 1968 and 1970 but has since
been abandoned. The peak production of pyrethrum and potatoes was in 1970,
with 1,700 ha being under the former and 1,000 ha being under the latter.
Githioro Scheme had virtually no cultivated crops from 1964 till 1969
-19-

when only small areas were under pyrethrum, potatoes, carrots and beet. In
1971, cabbages and peas were Introduced in this scheme whereas wheat and
barley were introduced in 1973. By 1975 the main crops were pyrethrum,
potatoes, cabbages, peas, leeks, wheat, oats and mangold. The total area which
was under cultivation was however very small compared to that of other
schemes. This is because of the dominance of the imperfectly drained soils
(Planosols) which lead to difficulties in drainage.
The Muruaki Scheme had pyrethrum, potatoes, peas and maize as the main
crops grown in 1964. These crops except maize were still being grown in 1975.
In addition, cabbage, carrots, leeks, wheat, kale, oats, fodder beet and
mangold are prominent in the area. Wheat was introduced in this scheme in 1966
and the area under this crop reached the highest peak in 1970 with 1,270 ha
planted. The growing of wheat has however gone down considerably since 1972.
There was a large area under potatoes in 1973 but the area under this crop
went down by 1975.
For Tulaga Scheme the crops grown in 1964 were pyrethrum, potatoes, peas
and maize. These crops continued to be grown and by 1975 there were also
cabbages, carrots, leeks, wheat, kale, oats, beet and mangold. Wheat was
particularly widely grown in 1968 and 1970 but its production declined
considerably since 1970. The major crops by 1975 were pyrethrum, potatoes,
cabbages, carrots, peas, maize and oats.
From the above, the diversity of the crops in the area is evident. The
fluctuation of the area under various crops from year to year is also evident.
This fluctuation seems to be caused by the desire of the farmers to secure
successful harvests. The main factors which seem to influence the crop
production in the area are the soil and the weather. In years when the
rainfall is heavy the area of the imperfectly drained soils (Planosols) become
waterlogged and the crops including even wheat which may do well on the
planosols under moderate rainfall are destroyed. Similarly periods of
insufficient rainfall may occur and the drought destroys crops. Another
unpredictable weather phenomenon which may effect crop production is the
occurrence of night frost. So in a particular year, the weather may be
favourable and a bumper crop may be obtained. This encourages the farmers to
increase the acreage of such crops the following year. But the weather in the
following year may then become unfavourable so that crops fail. This
discourages the farmers so that the following year they abandon the
cultivation of the affected crops. The areas under cultivation for various
-20-

200 4
11 1.5
10 2 4
11
kg metric metric metric metric metric metric metric
tons tons tons tons tons tons tons
400 22 30
3.5 15 12 12 22
kg tons tons tons tons tons tons tons
Table 4: Present yield per hectare of some of the crops in the Kinangop area (Source: DANIDA, 197 7).
Crop yield per ha Potential yield/ha
Pyrethrum Cabbages Potatoes Peas Carrots Leeks Beet Cauliflower
Yields of some crops from the Kinangop area in 1961 before the resettlement. (Source: Annual Report of Department of Agriculture, South Kinangop, 1961 and Odingo, loc cit).
Produce Yield per ha
Wheat 1.02 metric tons Barley 1.43 Potatoes 11.30 Vegetables 5.70 Pyrethrum 567 kilograms
Note: Converted to metric units from the original imperial units: 1 Acre =0.4 ha.
crops may therefore go up one year only to drop again the following year.
Pyrethrum is fairly suitable for small holder farming in the settlement
scheme. It is a cash crop which fetches high income under relatively small
acreage of say 1.0 to 2.0 ha besides providing easy area of employment for the
families of the settlers. The crop has remained an important one in the
Kinangop area inspite of the various fluctuations. Indeed small holder
pyrethrum production has been so successful that at present all the pyrethrum
in Kenya is produced by small scale farmers.
Maize has popularly been adopted throughout the schemes. But the growing
of this late maturing crop is not without risk of being destroyed by frost at
any month of the year. In addition to maize and pyrethrum, the many crops that
are now being grown in the schemes (see Tables 3a - g in Annex 1) can easily
be adapted to suitable growing conditions so that the farmers can derive
better returns.
With the diversity of crops introduced by trial and error, there has been
unavoidable drop in crop husbandry with the resultant drop in yields. Table 4
-21-

gives rough indication of the present yields of some of the crops. Given that
crop varieties have been considerably improved, the present yields are rather
low compared to those before the resettlement. Crop rotations or proper
intercropping has disappeared and many of the farmers do not use fertilizers
although they may be aware of their value. As an aid to rehabilitating the
crop production, Tables 5 and 6 below categories the diversity of crops now
being grown or that could be tried in the area according to their sensitivity
to frost, temperature requirement, altitude requirement, rainfall requirement
and soil requirement. This categorisation is based on information obtained
from such publications as Bailey (1958), Brown (1963), Acland (1971),
Purseglove (1974, 1975), Janick (1974), Usher (1974) and FAO (1978). Rice crop
is included for consideration because of the occurrance of soils (Planosols)
which characteristically have impended drainage. Its development is however
subject to breeding appropriate cool tolerant rice varieties.
From Tables 5 and 6, the variability in the crops with regard to
sensitivity to frost, temperature, altitude, rainfall and soil can be seen.
Table 5: Sensitivity to frost, temperature, altitude and rainfall requirement of the crops found in the Kinangop area and others that could be considered for the area (nd » no data) Crop
Pyrethrum Potato Cabbage Cauliflower Kale Carrot Onion Leek Beet Peas Maize Wheat Barley Oats Mangold Apples Plums Pears Peaches Rice Sunflower
Effect of frost slight severe slight slight slight slight slight slight slight slight severe slight slight slight slight slight slight slight slight slight severe
Temperature optimum 15-20 15-20 15-20 15-20 15-20 nd nd nd 15-20 15-20 25-30 15-20 15-20 15-20 nd nd nd nd nd 25-30 15-20
"C Range
5-30 5-30 5-30 5-30 5-30
nd nd nd 5-30 5-30
10-4 5 5-30 5-30 5-30
nd nd nd nd nd 10-35 5-30
Altitude m
2000-2900 1800-2900 above 900 nd nd nd
0-2300 nd nd 2100-2700 upto 2400 1800-2900 1800-2900 1800-2900 nd 1800-2700 1800-2700 2100-2700 1800-2400 less 1500 upto 2600
""Rainfall mm
over over over nd nd nd
1500 900 900
900-1100 nd nd over nd nd nd nd nd over over over over -over
1000
1000 900
1000 900
700 Included because of the occurrence of soils (Planosols) which
characteristically have impeded drainge. Its development is however subject to breeding appropriate cool tolerant ri"ce varieties.
Assuming a standard soil for the rainfall requirement.
-22-

Table 6: Some soil requirement of the crops found in the Kinangop area and other that could be considered for the area, (nd = no data).
Crop
Pyrethrum Potato Cabbage
Soil (cm)
depth
optimum
nd more nd
Cauliflower Kale Carrot Onion Leek Beet Peas Maize Wheat Barley Oats Mangold Apples Plums Pears Peaches Rice Sunflower
nd nd nd nd nd nd more more nd nd nd nd nd nd nd more more
than
than than
than than
75
50 50
50 75
Soi 1 d Range
nd 50-nd nd nd nd nd nd nd nd 10-10-nd nd nd nd nd nd nd 25-50-
75
•50 50
50 •75
rainage Class
optimum
nd W-SE nd nd nd nd nd nd MW-W MW-W MW-W MW-W MW-W MW-W nd nd nd nd nd I-MW MW-W
range
nd MW-E nd nd nd nd nd nd nd nd I-SE I-SE nd nd nd nd nd nd nd VP-W nd
pH 1:2.5
optimum
nd 5.0-5.4 5.7-7.0 nd 5.3-7.0 5.7-7.0 6.0-6.6 nd 5.5-7.0 6.0-7.0 5.5-7.0 5.5-7.0 5.5-7.0 5.5-7.0 nd 5.5-7.0 nd nd nd 5.5-7.5 nd
water
range
nd 5.2-8 nd ndnd nd nd nd nd nd nd 5.2-8 5.2-8 nd nd nd nd nd nd nd 5.2-8 nd
.5
.5 5
.2
VP » very poorly drained W = well drained P » poorly drain SE = somewhat excessively drained I = imperfectly drained E • excessively drained
MW = moderately well drained
In paragraphs 4 and 5, the climate and soils of the area will be examined with
a view to assessing their effect on the crops of the area.
2.2 LIVESTOCK PRODUCTION
Before the break up of land in the Kinangop area for settlement in 1961,
cattle and woo-sheep production figured prominently. Livestock farming
contributed greatly to the successful mixed farming with dairy cattle playing
a very important role. Wool-sheep were introduced so as to raise the carrying
capacity of the land. According to Odingo (loc cit), the following Table 7
shows the trend of livestock farming in 1960 before the time of land
resettlement.
-23-

Table 7: Number of livestock before the land resettlement (according to Odingo, loc cit, p. 153-171).
Number of As percentage of total number of cattle
Dairy cattle 4,300 more than 80% Sheep 23,000 no data Beef cattle no data less than 20%
Odingo reports that the grass ley farming was fairly successful in the
Kinangop area and the area of planted grass leys per 100 dairy cattle was
about 8.1 to 15.8 ha, i.e. 6.3 to 12.3 livestock units (LU) per hectare.
Mixed farming including cattle and sheep continued to be given prominence
in the Kinangop area even after the land resettlement (see Plate 4). This mix
farming was considered essential in order to provide the farmer with
diversified enterprises to safeguard him economically. The settlement plan was
therefore designed to include two or more dairy cows to give the settlement
farmer the opportunity to earn a regular income. Table 8a to 8g in Annex 2
show the livestock number during 1967 to 1975 and also the calculated stocking
rate. The implication of the stocking rates can be assessed by considering the
state of grass for grazing as in 1975. Planted grass leys which enabled a high
stocking rate of 6.3 and 1.3 LUs per hectare in 1960 no longer exist. They
have given way to natural pasture whose composition and quality is described
below.
The dominant grasses of grazing lands which are mainly on Planosols are:
Evagvostia atvovirens, Digitavia soalavum, Aldhemilla graoilipes, Setavia
aurea, Fiaine filiformis and Thesium sp.B. Other grasses which are common are:
Evagvostia sahweinfuvthii, Heliehvysum cymosum, Trifolium semipilosum vav
semipiluan, Cvepis cavbonavia, Medioago sp., Monopsis 8telVavoid.es vav
sahimpeviana, Lobelia ancepts and Pennisetum clandestinum. The grasses occur
in various proportions of dried out and green depending on the time of the
year. Table 9 shows the proportion of green and driedout grass as determined
during 1975 and 1976 while Table 10 shows the nutritive value of both the
green and dried out grass.
The nutritive value of the grass measured by % crude protein is only
medium. Moreover it tends to go down when the grass becomes dried out. Thus
the value of grass would be at best during August when there is greater
proportion of green grass and at worst during February and March when there is
greater proportion of dried out grass. The nutritive value of grass was lowest
-24-

Plate 4: Type of cattle and sheep kept by farmers.
The stocking rates have since 1967 to 1975 varied in the schemes as
follows:
Scheme Githioro Muruaki Karati Tulaga South Kinangop Njabini
Range of stocking rate (LU/ha) during 1967 to 1975 0.10 - 0.34 0.34 - 0.92 0.48 - 0.91 0.49 - 1.20 0.29 - 1.40 0.36 - 2.04
Compared with the stocking rate, before the land resettlement, of 0.50-0.83
LU/ha, i.e. 1.2-2 ha/LU (Odingo, loc cit, p. 153).
during December. This is probably due to the effect of frost which was severe
in December.
Against the above nutritive value of the pasture it could be said that
the stocking rates during 1975 was found in Tables 8a to 8g (Annex 2) are
somewhat too high in most of the schemes. Indeed as can be seen by comparing
Plate 1 which shows grazed land and Plate 5 which shows ungrazed pasture
-25-

within an enclosure, there is evidence of overgrazing. Unless the stocking
rate is kept low and the natural pasture supplemented with fodders or
concentrates, the yield of milk is likely to be only moderate. The milk
production at present is fair at about 1,200 to 1,500 kg per cow per year
(DANIDA, loc cit). The annual milk yield per cow before the resettlement,
according to Odingo (loc cit, p. 162) was 1096.6 litres (1,129 kg). But the
full genetic potential of the grade cows (Ayrshires and Friesians) which are
being kept is certainly not being realised at the present level of milk yield.
The possibility of producing some of the fodders like beet, oats, kale
and mangold to improve the livestock feeding will be examined in this report
in relation to the climate and soils suitability.
Table 9: The proportion of green and dried out grass during different months of the year. Month % Green grass % Dried out grass January 50 50 February 20 80 March 20 80 May 50 50 July 50 50 August 75 25 September 50 50 October 50 50 November 50 50 December 55 45
Table 10: Nutritive value of the green and dried out grass at various times of the year.
Month
February
May
August
October
December
Dried Green Mean Dried Green Mean Dried Green Mean Dried Green Mean Dried Green Mean
out grass grass
out grass grass
out grass grass
out grass grass
out grass grass
% Crude Oil
1.40 1.50 1.45 1.48 1.56 1.52 1.41 1.50 1.46 1.49 1.53 1.51 1.53 1.61 1.57
% Crude Protein
5.94 6.69 6.32 5.88 6.30 6.09 5.13 7.50 6.32 5.07 6.63 5.85 3.26 5.38 4.32
% Crude Fibre
28.12 25.60 26.86 27.79 25.34 26.57 28.70 30.02 29.36 28.85 29.81 29.33 29.02 30.21 29.62
Proportion Green/Dried out grass 20/80
50/50
75/25
50/50
55/45
-26-

Plate 5: Better managed grass pasture; compare with overgrazed pasture in
Plate 1.
2.3 TREE PRODUCTION
The whole area of study is almost devoid of natural trees which have been
cleared to provide land for cultivation and grazing. In those areas where
trees are available, the trees are mostly exotics planted for various
purposes. The main purpose for planting the trees appear to be for wind-break,
building timber and firewood. There is however no evidence anywhere in the
schemes that trees planting is carried out. for a commercial purpose.
A survey of the exotic trees that are planted in the area was carried
out. Cupressus lusitaniaa and Eucaplyptus saligna are most common on the well
drained and moderately well drained soil units UPrl to UPbl8p and are all
doing well. Also found on some well drained soils are Eucalyptus globulus.
Eucalyptus paniculata and Pinus which are doing quite well. Commonly found on
imperfectly drained soil units UPap to BPp are Cupressus lusitanica,
Eucalyptus saligna and Eucalyptus globulus. They are all doing well on these
soils, except soil unit BPp. Also found on some of the imperfectly drained
soils are Cupressus microcarpa, Cupressus benthirrrii, Eucalyptus maculata and
Pinus halapensis. They are all doing well. There therefore exist suitable tree
species for both the well drained and imperfectly drained land to provide for
building timber and firewood. Tree production can therefore be one of the best
form of land use for the imperfectly drained soils.
-27-

3. FARM TYPES AND CROPS
The existence of a diversity of crops grown in the Kinangop area gives
rise to variation in the farm types. Although the farming in the area is
directed towards advanced farming, it is to be noted that traditional way of
farming which involves intercropping is very much evident with regard to some
crops.
The farms in the Kinangop are small holdings. The average size range from
about 6.40 ha in South Kinangop schemes to about 15.02 ha in Muruaki scheme as
follows: (Source: Department of Settlement, Annual Report for 1976). Scheme Average plot size (ha) Muruaki 15.02 Karati 14.33 Tulaga 9.14 Njabini 6.68 South Kinangop and Bamboo 6.40
The farming is complex since the farmer operates a very much diversified
agricultural enteprise. It is however, largely on small scale for both
subsistence and commercial purpose. The later involves the sale of surplus
milk and the production of wool, pyrethrum, wheat and barley. In order to
promote agricultural development the government adopts a variety of policy
measures intended to modify agricultural production. The changes express
themselves at the farm level in the adaption of the pattern of farming that
are followed. Generally the official measures are aimed at assisting or
accelerating increased production. They are undoubtedly vital factors
influencing the development and evaluation of farming patterns.
Because of the continually changing institutional, economic, social and
cultural situations, the farmers of Kinangop try to farm more itensively to
make more productive use of land. The development path that each farm type and
crops tends to follow when the farming is itensified depends to a high degree
on the nature of the above situations. The emerging farm types are however
designed in a manner that they consist of a combination of inputs in numbers,
sequences and timing to satisfy specific objectives of the farmer under a
specified environmental setting. Crops production, dairy farming and sheep
rearing for wool and meat are all practised.
The farm types found in the study area may be categorised as indicated
below. The main ones are the Annual field crops. Tree crops, livestock,
livestock-Timber and Livestock-Annual field crop. The following is a brief
outline of the nature of each farm type.
-28-

Annual field crop: This farm type is characterised by annual crops grown
either single or in mixtures. A marked feature of the mixtures is the variety
of their forms. The cropping pattern utilized on a given farm determines the
nature or make up of the farm type. The variations and changes in cropping
pattern have arisen from the land reform and the development of semi-
commercial production of food crops. The cropping patterns which are very much
evident in the area full under Mixed intercropping, Relay inter-cropping, Row
inter-cropping and Sole (single) cropping. Features of these cropping patterns
are briefly mentioned below.
Mixed inter-cropping: This is the growing of two or more crops stimultaneously
intermingled on the same land with no distinct row arrangement. This together
with Row inter-cropping and Relay inter-cropping are appropriate where the
land is scarce but labour is ample since they increase yield, save moisture,
reduce risk and save fertilizer and power. In the Kinangop area the mixed
inter-cropping involves mainly cabbage (Kale) - potato (see Plate 3), cabbage
(Kale) - leek and potato-peas.
Row inter-cropping: The row inter-cropping is where two or more different
crops are grown together in distinct row arrangement. An example of this
cropping pattern in the Kinangop area is found in some plots under maize and
peas.
Relay inter-cropping: This is the growing of two or more crops in overlapping
sequence. Usually the seeding or transplanting of the succeeding crop is done
before the harvest of the preceding crop. It is a common farming practice in
Kenya in areas with extended rainy seasons or where several rainy seasons
overlap. It is exemplified in the study area by some plots under cabbage and
peas.
Sole (single) cropping: The sole or single cropping is where one crop variety
or species is grown alone in pure stands. It is a wide spread practice in the
Kinangop area for the growing of the commercial crops as well as semi-
commercial food crops which include pyrethrum, wheat, barley, maize, cabbage
and potatoes.
Recently there has been considerable interest in the study of inter
cropping in Kenya since it is now appreciated that in a small holder farming,
the farmer not only requires varied food supply but also requires to obtain
them in a continuous fresh supply as there are no storage faciliteit and the
storage losses are high. Moreover it is now recognised that by having inter
cropping the farmer of small holding is able to cater for his needed food and
-29-
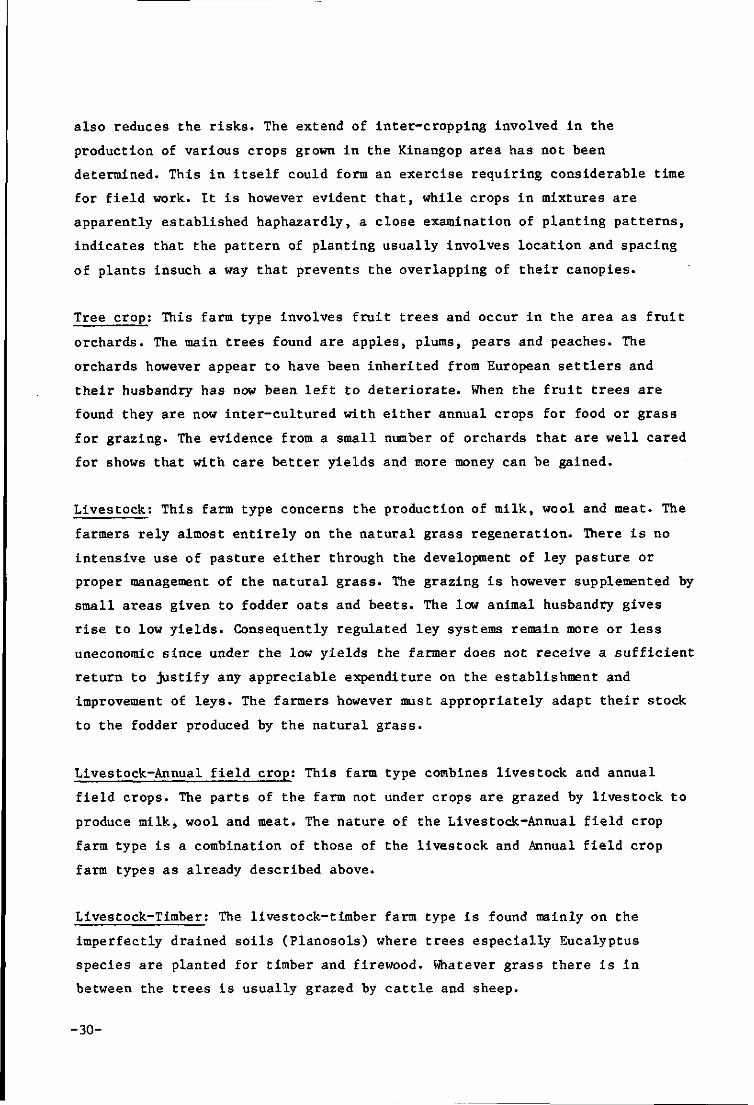
also reduces the risks. The extend of inter-cropping involved in the
production of various crops grown in the Kinangop area has not been
determined. This in itself could form an exercise requiring considerable time
for field work. It is however evident that, while crops in mixtures are
apparently established haphazardly, a close examination of planting patterns,
indicates that the pattern of planting usually involves location and spacing
of plants insuch a way that prevents the overlapping of their canopies.
Tree crop: This farm type involves fruit trees and occur in the area as fruit
orchards. The main trees found are apples, plums, pears and peaches. The
orchards however appear to have been inherited from European settlers and
their husbandry has now been left to deteriorate. When the fruit trees are
found they are now inter-cultured with either annual crops for food or grass
for grazing. The evidence from a small number of orchards that are well cared
for shows that with care better yields and more money can be gained.
Livestock: This farm type concerns the production of milk, wool and meat. The
farmers rely almost entirely on the natural grass regeneration. There is no
intensive use of pasture either through the development of ley pasture or
proper management of the natural grass. The grazing is however supplemented by
small areas given to fodder oats and beets. The low animal husbandry gives
rise to low yields. Consequently regulated ley systems remain more or less
uneconomic since under the low yields the farmer does not receive a sufficient
return to justify any appreciable expenditure on the establishment and
improvement of leys. The farmers however must appropriately adapt their stock
to the fodder produced by the natural grass.
Livestock-Annual field crop: This farm type combines livestock and annual
field crops. The parts of the farm not under crops are grazed by livestock to
produce milk, wool and meat. The nature of the Livestock-Annual field crop
farm type is a combination of those of the livestock and Annual field crop
farm types as already described above.
Livestock-Timber: The livestock-timber farm type is found mainly on the
imperfectly drained soils (Planosols) where trees especially Eucalyptus
species are planted for timber and firewood. Whatever grass there is in
between the trees is usually grazed by cattle and sheep.
-30-

4. THE VALUE OF THE PRESENT SMALL FARM SETTLEMENT
The area under discussion underwent a major subdivision after 1960 to
accomodate small-holding farms. With this small holder settlement, came into
being a significant diversification of the crops being grown as will be seen
from Table 3 in Annex 1. Although the yields of some produce might have gone
down with this change from large farms to small farms, the overall value of
current small-farm settlement may be viewed against some of the Kenya
Government policy objectives namely:
- employement creation
- income earning and distribution
- food sufficiency.
Employement creation: The urban and rural labour forces continue to increase.
Many of these new demands for employement have to be absorbed into the primary
and processing activities within agriculture. With the sub-division of the
study area from 30 large farms into 2892 small farms, self-employement was
created for a large number of people and their families apart from retention
of some of the salaried farm labourers.
Income earning and distribution: Not only there is a wide disparity between
average incomes in rural and in urban but also the distribution is highly
unequal. Equity and growth of incomes will initially depend on the development
of rural agriculture. The Kenya government at present aims to raise the rural
per capita income to Kenya Shillings 3,000 per year.
In 1975 and 1976 the sales of produce from the study area was as follows
in Kenya pounds (one Kenya pound equals about US dollar 3.0 at the time):
Sale in Kenya pounds
Produce 1975 1976
Milk Potatoes Carrots Pyrethrum Cabbages Green peas Wool Vegetables
Source: Annual Report for 1975 and 1976 of the Kinangop Complex, Department of
Settlement, Kenya.
Note: nd = no data.
-31-
nd 33,100 33,350 nd 4,800 6,850
nd 78,100
721,150 nd nd 125,050 nd nd 25,900
nd

This income went into the hands of the 2892 settlers and their families as
compared to only 130 previous settlers. There can be no doubt of the extent to
which the sub-division of the large farms has helped to bring many rural
people in the area into the income earning bracket.
Food sufficiency: The importance of food production in Kenya can be seen from
the table below which shows the distribution of daily calorie consumption in
Kenya as in 1975.
Income
Rural 1 2 3 4 5 6 Total
Urban 1 2 3 Total
Class I of total population
39 32 19 5 2 4
100
42 25 33
100
Daily calori consump person
1578 2077 2545 2867 2788 3036 2069
1787 2117 2453 2086
tion e per
Daily calorie deficit per person
642 143 ----151
343 13
-44
Source: M.M. Shah, 1978. Calorie Demand Projections Incorporating Urbanization and Income Distribution. Food and Agricultural Programme, International Institute for Applied Systems Analysis.
A moderately active rural worker requires 2,200 calories per day while urban
light activity requires 2,130 calories per day. It is evident from the table
that Kenyan rural areas has a deficit of 151 calories on average with a range
from 143 to 642 calories while the urban areas have a deficit of 44 on average
with a range of 13 to 343 calories.
That the inadequate supply of food is an endouring problem is obvious
from the occurrence of hunger and malnutrition. Increased food production and
distribution may seem to be the abivous answer to meeting the problem of
hunger and malnutrition. The extent to which food production in the study area
has been diversified since the small holder settlement, can be seen by
comparing the produce before the sub-division of of farms (Tables 3 and 8 in
Annex 1). The variety of food produced from the area has markedly increased
with a surplus for sale as already shown above. In 1975 and 1976 the food
production in metric tons was as shown below:
-32-

1975
nd 3,000 3,000
478 268
1976
16,086 nd nd nd nd
Food production in metric tons Produce
Mlïk Potatoes Carrots Cabbages Green peas
Source: Annual Report for 1975 and 1976 of the Kinangop Complex, Department of
Settlement, Keynya.
nd » no data.
Although the yields per hectare are at present low as shown in Table 4,
overall, the small holder settlement has greatly helped to save many families
from hunger and malnutrition which are some of the serious problems of
developing countries. There is however a potential for increased agricultural
production in the study area which when realised should lead to even increased
benefit and better standard of living for the farmers.
-33-

5. THE CLIMATE OF THE AREA AND ITS CONSTRAINTS OF LAND USE
Climate is an important factor influencing land use. The climatic
variables that exert profound influence on the trend of agricultural
development of an area and its productivity include rainfall, evaporation and
temperature. The study area falls within a rain-shadow of the Aberdare
Mountains (see Plate 1). Therefore the rains may be variable in the area.
Another feature connected with the climate is the occurrance of frost. This
arises from the cold air which is generated on the moorlands of the Aberdare
Mountains during clear nights and which flows down to the study area. Also
observed are the rather low mean temperatures and minimum temperatures which
may exclude the possibility of the growing of certain crops. The following
sections give the details about the climate.
5.1 THE TEMPERATURE AND FROST REGIME
5.1.1 Temperature type and variability
Little data on temperature exist for the area. Where they exist, it is
only for short period. The available data on temperature however provide fair
indication on the type and variability of the temperature of the study area.
Table 11 gives the temperature of three sites in the area. The South Kinangop
Forest Station which has nine years of data lies in the eastern edge of the
study area (see Fig. 4). The Kinangop Mtarakwa Farm which has seven years of
data lies within the study area and South West of the South Kinangop Forest
Station. In the south of Kinangop Forest Station lies Sasumua Dam which has
fifteen years of data.
The mean monthly temperature lies between 10"C and 16(>C with the mean
annual temperature between 11°C and 15"C. The monthly absolute maximum
temperature does not exceed 26*C with the hottest months being January,
February and March while the coldest months being July and Augyst. The monthly
mean minimum temperature lies between 2.7*C and 9.4°C with an absolute minimum
temperature of as low as minus 2.2°C. The Meteorological station which the
author set up in the study area in 1975 (see Plate 2) to monitor especially
the incidence of frost revealed the situation indicated in Table 12 with
regard to the absolute minimum temperature on the ground and above the ground
at 1.5 meters.
It is evident that the absolute minimum temperature above the ground is
about 1°C higher than near the ground. Moreover, as shown in Table 13 which
-34-

Fig.4. Climatic stations of the study area j \ ® North Kinangop
' i Forest station
® Climatic station
Settlement boundary
Road i i i i Escarpment
36° 40" E
South Kinangop Forest Station
0° 45'S
gKinale
35

O un
O ~* —• lA
en CM 0>
»-I 00 00 <-•
O J •-H -a- en
CM oo co
en .—i CT*
en ,-< CM CM I —>
0 o
JN 0 0
n -tf
n ^4
n m
0 CM
D m
N O
O CM
O
O CM
CM
O CM
vO
O
-a-
l
sO
O 1
CM
CM 1
^ W
r-
O
•»a-
o
m O
CÏN
O
c* O CM
v£
00
CT> f »
•a-c*
f — 4
r*.
<r
r-.
^ r-»
m r-.
er co CM
^
<T
ex* CM
O
O
O
.—<
vO
O
O
O
— —
m m
o <r
o en
U-I
en
00 O r». f-
ON i—t o en
in —* c •—•
-36-
<r p*» oo
O» .-* CM
oo r^
\0 m P-I
r*. CM —i
oc *ö m co r-.
^t r-* O •»
© en -a- .-«
oo o —'
O
o
CM
ON
CM
un
^ m
m CM
O
m CM
O 1
-* 1
en
i n
m
m r* »-• *- o ^ i-t O m -t CM un
X
ffl r c
c
r c « £
M
« <U 4J 3
f - (
O m
J =
<
B
S il 4J S
w o m x. •*
X C
S 2 X e

Table 12: Absolute minimum temperature (*C) recorded by the authors during 1975 to
1979; ground measurement is at 1.5 metres (nd - no data).
Month
Jan. Feb. Mar. Apr. May Jun. Jul. Aug. Sep. Oct. Nov. Dec.
1975 Above
1976 Above
Year 1977
Above 1978
Above 1979
Above ground ground ground ground ground ground ground ground ground
nd nd nd nd
3 2 0 1 1 1 2
-2
nd nd nd nd nd nd nd nd nd nd nd nd
-3 0
-1 2 2
-1 0
-2 0
-1 2
-1
nd nd nd nd nd nd nd nd nd nd nd nd
1 1 1 7 6 0 1 1 1 1 5 1
nd nd nd nd nd nd
1 0
-1 1 5 0
-2 -2
5 7 2 0 0 5
nd 4
nd 5
-3 -2
4 6 1 0 0 3
nd 3
nd 4
0 4
-2 4 5 4
nd nd
4 1
-3 -1
ground
0 3
-2 3 4 3
nd nd
3 0
-4 -2
Table 13: Comparison of absolute minimum temperature (°C) at high lying and low lying grounds.
DATE
4 Dec. 7 Jan. 3 Feb. 2 Mar. 20 Oct.
1977 1978 1978 1979 1979
MEASURED AT HIGH LYING ELEVATION
-1 -3 -3 -2 0
GROUND LEVEL LOW LYING ELEVATION
0 -2 -1 -1
0
MEASURED 1.5 HIGH LYING ELEVATION
0 -2 no data -1
1
M ABOVE GROUND LOW LYING ELEVATION
1 -2 no data -1
2
compares the absolute minimum temperature at two elevations, the absolute
minimum temperature appears, at the site studied, to be lower at high lying
ground than at low lying ground.
Frost was observed to occur whenever the temperature dropped to -10°C and
below. They were observed on the following dates since May, 1975.
Severe frost Mild frost January 1976, 1978 March 1976 February 1878 June 1976 March 1979 * August 1979 July 1979 September 1976, 1977 August 1976 October 1976 December 1975, 1979 December 1976
-37-

Frost may therefore be expected to occur in the study area during most
months of the year except during April and May. Mild frost occurred at 0"C to
-1°C but a severe one occurred when the temperature dropped below -1*C. Frost
damage may be expected to be more severe at the ground level and at the high
lying ground. It also happens that the high lying grounds in the study area
are the area with better drained soils which can easily be farmed. The
constraint of the temperature will be further examined in section 5.1.2 below.
However the type and range of temperature appear uniform throughout the area.
The study area may therefore be considered to have only one type of
temperature whose mean annual is from 11°C to 15°C with the risk, of frost in
most of the months except April and May.
5.1.2 Influence of temperature with regard to crops
The mean monthly temperature ranges between 10*C and 16°C with the mean
annual temperature between 11*C 15*C. The main problem associated with
temperature is the occurrence of night frost in most of the months except
April and May. Therefore the growing of certain crops which are very sensitive
to frost especially maize, sunflower and potatoe may be risky if extended
beyond March to June. Maize which requires at least ten months to maturity can
not easily be adapted for the area. The rather low mean temperatures are also
not conductive to the growing of the warmth-requiring crops such as beans,
sorghum, sweet potatoes, bananas, pawpaw, cassava and coffee. Crops that could
be considered for the area are given in Table 5 above and include pyrethrum,
potato, cabbage, cauliflower, kale, carrot, onion, leek, peas, sunflower,
wheat, barley, beet, oats, mangold, apples, plums, pears and peaches.
5.2 WATER AVAILABILITY
5.2.1 Rainfall distribution
Table 14 gives the rainfall at some of the sites in and around the study
area. The rainfall as can be deduced from Fig. 4 increases from North to South
on some longitude while it decreases from East to west. Sasumua Dam area which
lies in the extreme east of the study area receives 920 mm. Rains occur
throughout the year but a few months of the year may be considered as wet
months. If a monthly rainfall of 50 mm to 100 mm is taken as indicative of
moist season while over 100 mm rainfall is taken as indicative of a wet season
then the following is the position with regard to the rainfall stations
mentioned in Table 14.
-38-

«et r*. • — ' C M O O ^ — « m O C t - l ,«1 <-H _4 CM •—I ^-| ^ * ^ - i
(M p*» CM ^- i CM C l
CM CM ~ * CM ,-1 CM CM
00 \ 0 CM
en J*I
en .—i en
CM iTi
0 0
CM
- Ï
en 00 •—i
O 1—1
00
o e n
o> CM
^ r*-
.—" O 0*\
O CM CM
O
o CM
00
m O CM
i n
\0 m i ~ *
C
«
<-( l u C
«
É >-O
M C
3 J=.
c o * a - o 0 i - i ^ - ' 0 > v o ^ - o > o c
C O r ^ . C O s O O ^ C M ' J ' O ^ f ^ ' i — »
C M C M C M C M f M C M C M C M C M C M
c CO
c - H
« J= * J
§ w
fi a o CO 3 E 3 CO
CO
e/3
H
b.
e -o CO
z
X
o. o 011 e
•H
^
u o
4)
i *;
o. o oo e CO e
* z
•rt n i j
>C CC U^ F^ U^ N .-I ^H ^-t O CN
cN I-H w r-«31 CT* e*i oo O — O -*
3 O c o c 3 < —-
-39-

Station Wat seasons (months with more than 100 mm rainfall)
N. Kinangop For. Sta. April-June September
S. Kinangop For. Sta. Sasumua Dam Kamae For. Sta. Njabini F.T. Centre
March-May March-May March-May March-May
October-November October-November October-November October-November
Njabini F.T. Centre Kerita-Kinale Kinangop Expt. Sta. Ndiara
March-May March-May March-May March-May
November November November November
Karati Scheme April-May November
The wet seasons for Tulaga, Muruaki, Githioro, Njabini, Bamboo and South
Kinangop schemes therefore occur during March to May and in November while
they occur during April to May and in November for Karati Scheme. There are in
general two wet periods within the study area. A dry period occurs in Karati
Scheme during June to August whereas it occurs during July in the rest of the
schemes. For the purpose of further analysis of rainfall, the representative
ness of the rainfall is treated as shown below:
Representative rainfall site Ndiara Came 11 Karati
Settlement Schemes represented Tulaga, Njabini, Bamboo Muruaki, Githioro, South Kinangop Karati
Table 15: Rainfall Probability at Ndiara meteorological site (representing Tulaga, Njabini and Bamboo Settlement Schemes) and Karati meteorological site (representing Karati Settlement Scheme).
042 183
Expected minimum rainfall in mm
Sta. Name Observation Average Estimated number period for annual rain- long period 90.36... rains fall for the average rain- 4 out of 2 out of
observation fall mm 5 years 3 years period mm
Ndiara Karati Scheme
1931-1960 1957-1974
1140 905
1140 900
940 740
1090 800
Source: Jaetzold, 1976: Climatic situation of the Kinangop area. Internal Publication of the Department of Settlement, Ministry of Lands and Settlement, Nairobi.
-40-

5.2.2 Rainfall probability
The rainfall occurs throughout the year as revealed in Table 14. The
rainfall probability can therefore be assessed on annual basis. Jaetzold (loc
cit) has computed the probabilities as indicated in Table 15.
For the Ndiara site which represent Tulaga, Njabini and Bamboo settlement
schemes the probability of receiving a minimum of 940 mm in a year is 4 out of
5 years whereas the probability of receiving a minimum of 1090 mm in a year is
2 out of 3 years. Even for the rather dry Karati area which represent the
Karati Scheme, the rainfall reliability is high. In 4 out of 5 years a minimum
of 740 mm of rainfall could be received in a year whereas a minimum of 800 mm
could be received in 2 out of 3 years.
The high rainfall reliability in the study area favours intensified
agricultural production and should lead to good crop yields every year.
5.2.3 Evaporation and évapotranspiration pattern.
Information on evaporation and évapotranspiration for the study area is
meagre since to acquire this information needs a completely equiped
meteorological station to obtain among other, the data on radiation, wind
speed, humidity and daily sunshine. Woodhead (1968) has however, using the
Penman (1956) formula, computed potential evaporation for the South Kinangop
Forest Station which lies just outside the eastern edge of the study area and
also for Kimakia which lies some 16.5 km east of the study area. Table 16
provides his computed Penman potential evaporation for the two sites while
Table 17 gives the monthly potential evaporation as percentage of the year
potential evaporation.
Woodhead (Ibid) has also provided a formula for estimating annual Penman
potential evaporation from the altitude of a site as follows: Annual potential
evaporation, Eo • 2422-0.358h where h is altitude in metres. This formula was
arrived at by carrying out a correlation between potential evaporation and
altitude at different areas of Kenya. The above formula has been employed to
estimate the annual potential evaporation of the meteorological stations in
and around the study area while the monthly mean percentages of Table 17 have
been used to calculate the monthly potential evaporation from the estimated
monthly annual potential evaporation. Table 18 provides the estimated monthly
and annual potential evaporation. The potential evaporation is lowest during
the month of July while it is highest during the month of March. It is also
fairly high during the months of January, February and October.
-41-

South Kinangop Forest Station
116 113 129 110 99 88 81 86
100 119 105 105
1251
Kimakia
150 149 160 132 116 105
89 99
122 143 131 133
1529
Table 16: Monthly Penman potential evaporation (mm) at South Kinangop Forest Station and Kimakia according to Woodhead (1968).
PENMAN POTENTIAL EVAPORATION (Eo) MONTH
January February March April May June July August September October November December Year
Table 17: Monthly potential evaporation as percentage of year potential evaporation; calculated from Table 16.
MONTH % S. Kinangop % Kimakia % Mean
January February March April May June July August September October November December
Work by Dagg (1965) has shown that the average ratio of maximum crop
évapotranspiration (ETm) to potential evaporation (Eo) is 72.3 percent over a
growing period of 180 days. According to FA0 (1979, p. 25) the crop
coefficient, kc for most crops averaged over growing period is 0.7 to 0.95
(average 0.825). It is therefore apparent that maximum crop évapotranspiration
(ETm) averaged over the growing season for most crop is approximately 2/3 of
the potential evaporation (Eo) since ETm = kcE and ETo - O.8E0. This ratio of
2/3 is also the one used by the Kenya Soil Survey (see Van de Weg and Mbuvi,
1975, p. 11) and has therefore been adopted for the present study as to keep
the result in line with the investigations by the Kenya Soil Survey elsewhere
in the country. Table 19 gives the monthly maximum crop évapotranspiration
-42-
9.3 9.0
10.3 8.8 7.9 7.0 6.5 6.9 8.0 9.5 8.4 8.4
9.8 9.7
10.5 8.6 7.6 6.9 5.8 6.5 8.0 9.4 8.6 8.7
9.5 9.4
10.4 8.7 7.7 6.9 6.2 6.7 8.0 9.4 8.5 8.6

O
> o z
f*. o f «O r*.*o oo r*- CN \0 (sj m CM «N N « CM CM Cl CN
O c> o o o o
3 1
Pu
•o
m O t—1
u-v
*-* <—*
O m
.—»
m m
O < •
C M
• *
oo 0 0
m CM
a o ÖO
c CC
e •H
^ CO
•* \ 0
^
A3 4-1 CO
t - l
o ü-
t£>
o ^ - t
oo
•—1
- 3 -
m
O ^O
-T •<t
O <r r - l
*T r --3-CM
o . 0 00 c cd c
*: co 0 0
«-•
s ca o
co 3 E 3 w ca
to
m o < - i
m
o m
m m
c * 3 "
C N
-*
0 0 0 0
m eg
H
Pu i H
c t - t
•o aj
• « - i
2 : CM U"\
~*
<U u 4-1
c CU u
-3-o I—(
\ 0
^ m
r-. m
CM
•*
en <r l—1
i -H
*o m C N
4 J
B-t l *
CL O 00 c CO
cn O ^ - i
m
O C O
\ 0
m
t—i
<r
C M
- 3 -i—i
r - 1 O * i n
CM
co CO
u o
& 4
CU eo
c co e • H 4 J CO
Ü CO &
C N i—l
O
O m CM
CNI
O
<T
r-4
O N C M
- 3 E
m i -H
ON co
^ * 3 -
O N C N v © CM
O. O OO c: CO
c • H
* •
z i n
C N
O
efl 4-1
co
J-l
o Ü -
>3" O
M3
^ C")
r-. m
C M •*3-
•<r s T
i—t
\ 0 - 3 "
m C N
«3 J-CO
• o
•z
C N
- 3 -
o
n O
i n
O m
m i n f—i
o <r
C N
- 3 "
ON i n
CM
at r-H
co e u 1 co 4 J
fc-CU u
,_4
O N
^
r-» O
O N
i n
en
vO f - j
vO -3-
t - *
-3-r-4
Os ro
-ff CM
t - t
< H CU
c u ca u —4
co O
CM
O
<r
O N C M
-ff m
.—<
o - 3 "
_, *tf —i
0 0
MO CM
CU
£ u
co
i - l
co u co
*: m 0 0 .—i
(O
-< 3 S U O
CU
4 j
B O u
<4-t
•o OJ 4-)
§ 4-1 CO OJ
o
c 0 4-1
CQ b
O O, co
> CU
.—1
CO
4-1
c CU 4 J
o a c § c CU
Ou
co 3 C C
< CU 4-1
O z
w CU u 4-1 CU
6
c CU
1 4 J
l - l
co
co • H
CU V4 CU
3
£ 00 i n cn
O
1
C M C N
sr CM
H
S
S O
U3
-43-

Table 19: The monthly maximum crop évapotranspiration and rainfall (mm) at three representative meteorological stations. STATION MONTH
Jan. Feb. Mar. Apr. May Jun. Jul. Aug. Sep. Oct. Nov. Dec. Note:
Ndiara Station Rainfall
52 56
110 226 200
68 40 58 49 85
113 73
Maximum crop
Maximum évapotranspiration (ETm) 96 95
105 88 78 70 63 68 81 95 86 87
Carnell Sta Rainfall
61 67
115 203 169
60 35 58 54 75
101 81
évapotranspiration (ETm)
tion Maximum évapotranspiration (ETm) 98 98
108 90 80 72 64 70 83 98 88 89
computed as
Karati Station Rainfall
64 59 80
156 125
47 36 47 51 68
105 84
two/third
Maximum évapotranspiration (ETm) 94 94
103 86 76 68 62 67 80 94 84 86
(2/3) Penman potential evaporation (Eo) .
(2/3 Eo) computed for Ndiara, Carnell and Karati meteorological stations which
are representative for the seven settlement schemes covered by this
investigation.
5.2.4 Cumulative Water Balance and the Length of the Growing Period.
The presence of clay pan or solid rock layer in a soil can limit the
soil's moisture storage capacity and the cumulative water balance. Tests on
the imperfectly drained soils (Planosols) of the study area show that the soil
moisture storage of these imperfectly drained soils with clay pan lies between
40 mm and 80 mm. This greatly contrast with that of the better drained soils
which are free of the clay pan and where the tests reveal that the soil
moisture storage down to 100 cm depth varies between 50 mm and 240 mm depth,
where the soil depth allows, the following (see Table 20) were the ranges of
the moisture storage.
Table 20: Ranges of the available soil moisture storage capacity.
Moisture storage 40-50 mm 50-75 mm
75-100 mm 100-125 mm 125-150 mm 150-200 mm 200-250 mm
Number of representative soils 5 4 7 6 2 2 1
-44-

Therefore for the purpose of assessing the cumulative water balance, the
levels of available soil moisture storage capacity adopted for this report are
200, 150, 125, 100, 75, 50 and 25 mm. Table 21a - c provide the data on
cumulative water balance for a whole year using the monthly rainfall and
maximum crop évapotranspiration shown in Table 19.
The Growing Period
This is regarded as the period when water availability and temperature
permit crop growth. Except for the occurrence of night frost which is a risk
to some crops, the temperatures in Kinangop as shown in Table 11 above are
ideal for most crops throughout the year. For this reason, only moisture
availability will be considered for the purpose of assessing the growing
period.
In order to enable a quantitative assessment of the growing period, a
simple water balance model which compares the stored soil moisture with the
monthly maximum crop évapotranspiration (ETm) is used in this report. The
precision of this assessment would no doubt be improved by using rainfall and
évapotranspiration periods shorter than one month (say 10 days intervals) but
the published climatic data available to the author do not easily allow for
such a refinement.
If optimum growth of crop is to be attained then a continuous moisture
supply is required throughout the growing season. The balance between
available soil moisture and the maximum crop évapotranspiration (ETm) should
accordinly be continously positive throughout the growing season. As is
evident from Tables 21a - c, this situation is dependent on the available soil
moisture storage capacity. Where the soil is capable of storing more available
moisture there is a longer period of moisture sufficiency. For the Ndiara area
which represent Tulaga, Njabini and Bamboo Settlement Schemes, the period of
continuous moisture sufficiency ranges from 3 months for a 100 mm available
soil moisture storage capacity to 11 months for a 200 mm available soil
moisture storage. Similarly for the Carnell area which represents Muruaki,
Githioro and South Kinangop Settlement Schemes the period of continuous
moisture sufficiency ranges from 3 months for a 200 mm available moisture
storage capacity. The period of continuous moisture sufficiency is shorter for
the Karati area which represents Karati Settlement Scheme. The period ranges
from 3 months for 100 mm available soil moisture storage capacity to 6 months
for a 200 mm available soil moisture storage capacity.
-45-

Calculations for available soil moisture storage between 75 ma and 100 mm
indicate that soils with less than 90 mm available moisture storage capacity
either have the period of continuous moisture suffucuency less than three
months or are suffering a moisture deficiency throughout.
5.2.5 Influence of water availability with regard to crops
The Western part of the study area may be considered semi-humid while the
central and eastern parts are sub-humid. In the eastern side and the middle of
the area, there are two main peak of rainfall, one in April and the other in
November, and there is substantial rain in the rest of the months except July.
The moist and humid periods may therefore be considered to occur throughout
the year. For the western part of the study area, the two rainy seasons are
more clearly divided. There are two peaks in April and November but the months
of June, July and August receive less than 50 mm and may be considered dry.
Important for crops are the differences in the water balance computed on
the basis of simple model that compares the soil moisture with monthly maximum
crop évapotranspiration. A positive balance between the two factors is
necessary for optimum growth of the crop. But as can be seen in Tables 21a to
21c the situation is substantially influenced by the capacity of the soil to
store the water during the humid and moist periods to be available to the
crop. The higher the soil moisture storage capacity, the fewer the months with
moisture deficit in the study area. Taking available soil moisture storage of
90 mm as average it is evident that there are only three months of continuous
moisture sufficiency in the study area. As can be seen from Table 23 in
section 6.3 a number of soils of the study area have available moisture
storage capacity less than 90 mm. Such soils will therefore has less than 3
months of continuous moisture sufficiency and are less favourable for crop
growing.
5.3 THE LAND USE PATTERN AS INFLUENCED BY TEMPERATURE AND WATER AVAILABILITY
The rather cool temperature and the three types of rainfall in the study
area have influence on the land use pattern. The eastern part of the area
which comprises Tulaga, Njabini and Bamboo Settlement Schemes have moist and
humid rainfall regimes throughout the year and could be a little too wet for
crops sensitive to excess moisture e.g. oats. The long moist and humid periods
are however favourable to many crops and support good pasture throughout the
year. The good pasture is benefitial to the livestock for milk and wool
-46-

o .o a
c J3
O
£>
u QJ 4_t «0 3
<u > •*4 •u
F - (
e M
c * 3
« CA O
dl E
CM E
CU r H i H 4J .O U CO CU
E - CO
> CM ««I - i
Moisture balance
Moisture held
Moisture balance
Moisture held
o
i
CM
in in
1
m
Moisture balance
Moisture held
Moisture balance
Moisture held
Moisture balance
Moisture held
Moisture balance
Moisture held
Moisture balance
C M C M C M C M Ç M C M C M C M C M C M
O
CM
I
in m m
en -cr
I I
in m u-t m
m i n m c G O o o o i u i m c > C M \ c r - r ^ p ~ i O - c r i n " 3 ' r * * r ^ r ~ u i m
o o O O O O
m O r*. CM *o 00 © oo ""» ui
in CM CM O f » r*- r~ -3"
+ + + r~i
+
O
o
en 1
i n
c->
1
l A
r-i CM
+ +
O CM
+
1 ^ " 1 CO l / l
+ +
i n CM co
+ +
Moisture 2 § o g S held w CM CM - H -
Max. évapotranspiration (mm) m oo co o co - (ETm) 2 " "- - *
i-t CM CM
Month s o u
-47-

". o
I c
•*s oo
3 I
-C
( N
<u ^H . 0 M H
a. o 00 c ffl e u;
Moisture balance
Moisture held
Moisture balance
Moisture held
Moisture balance
Moisture held
Moisture balance
Moisture held
Moisture balance
Moisture held
Moisture balance
Moisture held
Moisture balance
Moisture held
co in m r-~ CO vO ^ - f I I I I
m m m m m m m m m m m m ! N ( N j e N o 4 < N r 4 < M ( S | < N r 4 C V » e M
<n CN CM CM
I I I I
o o o o ^ o o o o o o o m m m m c t i n m i n i n m ' n m
c o * * m m r ^ O c ^ v O \ o
in in r"> -3" m -a- ro
+ + + +
r- c
+ + r - i n CM <—t i—*
+ + + + I
Max. evapo- § transpiration (mm) *"1
- (ETm)
Rainfall (mm)
Month
m o CM
CT* -X5
O
C 3
i n
f H 3
IT)
A3 3
m
a.
m
4-1 U
O
> O
00
Ü 0»
t C
c cd
y 3
-48-

Moisture balance
in sf
I I
Moisture held
m m m m C M C M C M C M C M C M C M C N
Moisture balance
\0 *0 »-* vO m CM CM CM
Moisture held
m m m m
to u o
Moisture balance
—. —• — SO CM CM CM CM
Moisture held
m m r** —< x m m \o in r-
Moisture balance
_-< CM
+ + CM CM CM -* —< W CO CM
Moisture held
o _i O r- in io O
£ O
Moisture balance + +
CM CM CM
Moisture held
—* oo m m en x in oo
Moisture balance
CM
+ +
Moisture held
m m f>
a 3 u
e o
Moisture balance
Moisture held
Max. évapotranspiration (n - (ETm)
CM CM * n CO
R a i n f a l l (mm) iû r*. ^ oo
J3 CO
Month r l 00 3 3 n <:
-49-

production. The cold nights highly favour pyrethrum because they assist to
increase flowering and pyrethrin content.
The middle part of the area which is comprised of Muruaki, Githioro and
South Kinangop Settlement Schemes also has a rather cool and subhumid climate.
The humid periods are not as strong as in the eastern parts but there occur
long moist and humid periods. Like in the eastern part, the climate is
favourable for a large range of crops which include pyrethrum, potato, wheat,
barley, oats, cabbage, cauliflower, peas, carrots and fruit trees. The risk of
frost is still great and a crop like maize cannot safely be produced. Even
potato should be grown during March to June. This zone still supports good
pasture for both milk and wool production.
The western part of the study area comprises of the Karati Settlement
Scheme. It is characterised by short humid periods and a definite rather dry
period. The humid seasons occur only in April, May and November with dry
periods from June to September. The short humid period and the intervening dry
period is not favourable to crops like wheat, barley, potato, cabbago and peas
which require ample period for vegetable setting. Although the cold nights are
favourable for pyrethrum production, the rainfall is rather low for this crop.
Since there is no extreme drying up during the dry period there is fair
pasture throughout the year to support milk and wool production. This pasture
can also be supplemented with the production of fodder crops like oats, beet
and mangold which are ideal for this zone.
-50-

6. THE SOILS OF THE AREA AND THEIR CONSTRAINTS ON LAND USE
Kikuyu Red Loam and Black Cotton Soil are common names which have been
used respectively to identify the well drained red soils and the imperfectly
drained dark coloured soils which occur in the area. Like most common names,
they lack precision, but are more readily understood by a large audience than
scientific names. The names are frequently used locally to convey respectively
an image of a deep and well drained red soil which is ideal for coffee and or
tea growing and an imperfectly drained dark soil which is ideal for cotton,
sugarcane and rice growing.
Soils on young landscape or recently deposited pyroclastics and river
sediments as occur in the area may be rich in plant nutrients and support a
vigorous plant and animal community provided that water, sunlight and
temperature are not limiting. But the soil nutrient supply is not limitless
and with time, soluble nutrients are removed in crops and some find their way
to ground and river waters. What remains on the landscape may be a soil that
is stripped of its capacity to retain and supply the nutrients essential for
plant growth. Formulation of sound soil management practices therefore depends
on the understanding of the causes and effect relationship between the crop
response and soil manipulation. A poor farmer can become rich on fertile soil
and a rich farmer can make infertile soil productive, but a poor farmer on
fertile soil has little chance of succeeding. Sound principles are needed to
assist farmers to reduce the risk of failure when they are advised to
implement farming practices which are unfamilair to them. For this reason the
most exacting principles are needed to forecast with great accuracy the likely
response when a soil is subjected to a particular use. The first step for
accomplishing this objective is to carry out a field study to determine the
characteristics of the soils so that the information could be used to predict
the behaviour of the soils, identify their best use and estimate their
productivity.
The following sections provide information on the characteristics of the
soils of the study area and also an assessment of how the soils may influence
the land use. The previous soil investigations in the area and the methodology
for present soil study is already indicated in Section 1.4 of this report.
Fig. 5 shows the sites where the soils were examined in the field in order to
confirm the various soils previously delineated from aerial photographs.
-51-

Fig 5. Sites of observation of the soils in the field
g Profile pit + Augerhole
A.A À!f»B*»arpm«it
36° 30'E
0° 45'S
36° 40'E

6.1 THE GEOLOGY, PHYSIOGRAPHY AND HYDROLOGY OF THE AREA
Geology.
The geology of the area is reported by Thomson (1964). Fig. 6 shows the
occurring geology. The rocks are of volcanic origin. They consist of
pyroclastic rocks and basalt. Soft and coloured trachytic pumice tuffs which
frequently form thick deposits are the most common pyroclastic rocks in the
area. Thomson (loc cit, p. 26) reports that the powdery light grey pumiceous
ash found over much of the study area was deposited possibly during the
Holocene period and may be equivalent in age with the pumice eruptions derived
from the nearby Mt. Longonot (see Plate 6) which lies some 15 km south west of
the study area. The weathering of the rocks has resulted in the various soils
found in the area.
Physiography
The geomorphological phenomena which comprise of volcanicity and other
tectonic activities together with climate have produced extensive areas of
plateau and scarps as well as raised ground within and the vicinity of the
Plate 6: Mount Longonot, the source of recent volcanic ash sprinkling at
Kinangop, in the background.
-53-

Fig.6 Geology of the study area.
North K inangop^ *? ** •
( J
^ Ä C ' N ^ ^ N^ ^
f^^^S ToUihafatt
Geological boundary
Road
Ü Ü Escarpment
36" 30 •£
54
0"45 ' S
36' 40"E
T^:Pyroclastic rocks ( Quaternary )
Plt3 | Pyroclastic rocks and Sedime-n t s (Upper middle Pleistocene)
( PII2 3 Pyroclastic rocks with intercalated Laikipian-typebasalt-( Lower middle pleistocene t o -miocene)
J U : Basalts and agglomerates (M i ocene )

study area. Kijabe Hill which is of basaltic origin lies 2 km south of the
study area whose southern and western boundaries coincide with the Rift Valley
escarpment. Although the general physiography of the study area may be
referred to as a plateau, it is a step which forms a plain or platform on the
side of the Rift Valley (Thomson and Dodson, 1963, p. 11; Thomson 1964, p. 7).
Also Shackleton (1954, p. 7) considers it as a marginal strip of a plain of
accumulation which formely extended from the foot of the Aberdares (shown in
Plate 1) across the Rift Valley, and possibly also across the northern end of
the Aberdares.
Within the study area, the plain falls from south to north by a series of
three platforms whose elevations lie approximately at 2700 m, 2620 m and 2560
m above sea-level. The plain also rises to the north-east to end in the scarps
of the Aberdares mountain with a top at 3906 m. The first two steps in the
south have undissected topography with occasionally raised ground (inselbergs)
which carry better drained soils. The last step in the north of the study area
is deeply dissected by widely spaced streams. The widely spaced dissection
gives rise to fairly wide and flat interfluves with rather short but steep
sides. Similar topography prevails in the extreme eastern and north eastern
parts of the area.
Surface Hydrography
Fig.7 shows the surface hydrography and contour of the area. The north
western part is deeply dissected by the Muruaki, Kitiri, Turasha and other
rivers which are the tributaries of Malewa which ultimately discharges into
Lake Naivasha laying 11 km west of the study area. The southern and south
eastern part is also the catchment area for tributaries to the Athi and Tana
rivers which discharge into Indian Ocean (Fig. la). In the central part of the
area natural drainage ways whose valleys are generally flat. A number of dams
have been built to store water along some of the rivers. The Sasumua dam which
lies in the east of the area is among these dams and is the main source of
water for the city of Nairobi which is situated 50 km southeast of the study
area. On the imperfectly drained lands are found outlines and ditches which
have been installed to drain the lands into the natural drainage lines. Some
of these outlines and ditches which were constructed at the inception of the
settlement in 1963 are no longer effective and definitely need to be
rehabilitated.
-55-

Fig.7. The surface hydrology and contours of the study area
36° 40°E
45'S
Of 50'S
36° 40-E
rivers
roads and tracks
- drainage lines
A A • A escarpment ""-•2840— "^-2600—• contours V.I 40m
I 36e 35 'E

6.2 THE CLASSIFICATION AND CORRELATION OF THE SOILS AND DESCRIPTION OF SOME OF
THE SOIL UNITS
Fig. 7A (soil map) shows the soils of the area. The general pattern of
the soils is related to the topography. On low lying areas are found mainly
Planosols which have imperfect to poor drainage. These soils have a clay pan
subsoil with a bleached and light topsoil. On high lying ground are found
better drained soils consisting of Andosols, Phaeozems and Cambisols. Table 22
gives the thirthy four soil which have been delineated together with their
correlation to both FAO/UNESCO/legend (1974) at Sub-Group level and United
States Soil Survey Staff's Soil Taxonomy (1975) at Family level.
Fig. 7A: Semi-detailed soil map of the Kinangop area (original 1:50,000 soil
map can be obtained from the Kenya Soil Survey, Nairobi).
1. For the description of the soil unit represented by the symbol in the
numerator, see Table 22.
2. The letters A, B, C, D en E in the denominator of the soil unit symbol
represent the slope classes.
3. Key to slope classes:
Slope Slope class Symbol Name of the macrorelief
0 - 2
2 - 5
5 - 8
8 -16
16-30
Key t o d e p t h c l a s s e s :
Th i ckne s s s o i l i n cm
0 - 50
5 0 - 80
80 -120
more t h a n 120
A
B
C
D
E
Symbol
P
P
f l a t t o v e r y g e n t l y u n d u l a t i n g
g e n t l y u n d u l a t i n g
u n d u l a t i n g
r o l l i n g
h i l l y
Name
s h a l l ow
m o d e r a t e l y deep
deep
v e r y deep
-57-


\"M "l i! hihi i luimt!
>MEIiHli!fc
59

Table 22: The classification and correlation of the soils: The FAO/UNESCO
classification terms indicated in brackets are those which have been
introduced by the Kenya Soil Survey as reported by Siderius and Van der Pouw
(1980). Where the clay mineralogy is not mentioned it is amorphous.
Map
unit
UPrl
UPr2
UPr3
UPbl
UPb2
UPb3
UPb4
UPb5
UPb6
Description
Well drained, very deep, reddish brown
to dark reddish brown, friable clay
loam, underlying loam with many iron-
manganese concretions
Well drained, very deep, reddish brown
to dark reddish brown, friable clay,
underlying black, silt loam
Well drained, very deep, dark reddish
brown, friable clay, with few iron-
manganese concretions
Well drained, very deep, reddish brown
to very dark brown, friable clay loam,
underlying dark brown to very dark
brown, loam
Well drained, very deep, dark brown,
to very dark brown, friable clay loam,
underlying black, silt loam
Well drained, very deep, reddish brown
to dark reddish brown, friable clay
loam, underlying dark brown to very
dark brown, clay loam
Well drained, very deep, reddish brown
to very dark brown, friable to firm
clay, underlying very dark grey to
black, loam
Well drained, very deep, dark reddish
brown, friable clay, underlying very
dark grey to black clay
Well drained, very deep, dark reddish
brown, friable clay, underlying very
dark grey to black, clay
FAO/UNESCO SOIL TAXONOMY
haplic PHAEOZEM udic HAPLUSTOLL,
fine loamy,
isothermic
luvic PHAEOZEM udic ARGIUSTOLL,
fine clayey,
isothermic
udic ARGIUSTOLL,
very fine clayey
isothermic
haplic PHAEOZEM cumulic HAPLUSTOLL,
fine loamy
isothermic
(ando)-luvic
PHAEOZEM
(cumulo)-luvic
PHAEOZEM
(cumulo)-ha plie
PHAEOZEM
(ando)-luvic
PHAEOZEM
(luvo)-mollic
ANDOSOL
(luvo)-mollic
ANDOSOL
pachic ARGIUSTOLL,
fine clayey,
isothermic
cumulic HAPLUSTOLL,
fine clayey,
isothermic
pachic ARGIUSTOLL,
fine clayey
isothermic
ultic HAPLUSTALF,
fine clayey,
isothermic
ultic HAPLUSTALF,
fine clayey,
isothermic
-60-

Map
unit
UPb7
Description
Well drained, very deep, reddish brown
to dark reddish brown, friable clay
FAO/UNESCO SOIL TAXONOMY
UPb8p Well drained, deep, reddish brown to
dark reddish brown, friable loam,
underlying very dark greyish brown to
greyish brown, silt loam, with many
iron-manganese concretions
UPb9p Well drained, deep reddish brown to
dark reddish brown, very friable clay
loam, underlying dark brown to very
very dark, silt loam, with common
iron-manganese concretions
UPblOp Well drained, deep reddish brown to
dark reddish brown friable clay loam,
underlying reddish brown to very dark
brown, clay loam, with few to common
iron-manganese concretions
UPbllp Well drained, deep, dark brown to very
dark brown, friable clay loam, under
lying black, loam
UPbl2p Well drained, deep, reddish brown to
dark reddish brown, friable clay,
underlying loam, with many iron-
manganese concretions
UPbl3p Well drained, deep, dark brown to very
dark brown, friable to firm clay,
underlying reddish brown to dark
reddish brown, silty clay loam, with
with many manganese concretions
UPbl4p Well drained, deep, dark brown to very
dark brown, friable to firm clay,
underlying very dark greyish brown to
greyish brown, clay loam
(ando)-humic
CAMBISOL
andic ustic
HUMITROPEPT,
fine clayey,
isothermic
eutric CAMBISOL ustric HUMISTROPEPT,
sodic phase fine loamy,
isothermic
luvic PHAEOZEM udic ARGIUSTOLL,
fine loamy
isothermic
dystric CAMBISOL ustic HUMITROPEPT,
fine loamy
isothermic
haplic PHAEOZEM udic HAPLUSTOLL,
sodic phase fine loamy,
isothermic
dystric CAMBISOL ustic HUMITROPEPT,
fine loamy,
isothermic
eutric CAMBISOL typic USTROPEPT,
sodic phase fine clayey,
isothermic
luvic PHAEOZEM
sodic phase
pachic ARGIUSTOLL,
fine clayey,
isothermic
-61-

Map
unit
Description FAO/UNESCO SOIL TAXONOMY
UPbl5p Moderately well drained, deep, dark
brown to very dark brown, friable to
firm, sodic, clay, loam, underlying
reddish brown to dark reddish brown,
loam, with common to many iron-
manganese concretions
UPbl6p Moderately well drained, deep, reddish
brown to dark reddish brown, friable
clay, underlying clay loam, with few
iron-manganese concretions
UPbl7p Well drained, moderately deep, reddish
brown to dark reddish brown, friable
loam, underlying dark brown to very
dark brown, loam, with many iron-
manganese concretions
UPbl8p Moderately well drained, moderately
deep, dark brown to very dark brown,
friable clay, underlying clay loam,
with few iron-managese concretions
UPap Imperfectly drained, deep, very dark
greyish brown to greyish brown, mottled
firm clay, underlying more than 40 cm
of clay, with many iron-manganese con
cretions
LPal Imperfectly drained, very deep, dark
brown to very dark brown, mottled, very
firm sodic clay, abruptly underlying
less than 40 cm of very dark greyish
brown to greyish brown loam
LPa2 Imperfectly drained, very deep, very
dark greyish brown to greyish brown,
mottled, friable clay, abruptly under
lying more than 40 cm of dark brown to
very dark brown, silt loam
dystric CAMBISOL utric HUMITROPEPT,
sodic phase fine loamy
isothermic
luvic PHAEOZEM
sodic phase
pachic ARGIUSTOLL,
fine clayey,
isothermic
eutric CAMBISOL typic USTROPEPT,
fine loamy,
isothermic
dystric CAMBISOL ustic DYSTROPEPT,
clayey-skeletal,
over fine loamy,
isothermic
eutric CAMBISOL typic USTROPEPT,
sodic phase fine clayey, mixed
montmorillonitic/
illitic, isothermic
solodic PLANOSOL albic NATRAQUALF,
fine clayey,
montmorillonitic,
isothermic
solodic PLANOSOL abruptic TROPAQUALF,
fine clayey,
montmorillonitic
isothermic
-62-

Map
unit
LPa3p
LPa4p
LPa5p
LPa6p
LPa7p
LPa8p
Description FAQ/UNESCO
Imperfectly drained, deep, black,
mottled, firm clay, abruptly less than
40 cm of very dark greyish brown to
greyish brown, loam, with common iron-
manganese concretions at transition
Imperfectly drained, deep, dark brown
to very dark brown, mottled, firm clay
abruptly underlying 30-50 cm of very
dark greyish brown to greyish brown,
loam, with many iron-manganese con
cretions at transition
Imperfectly drained, deep, dark brown
to very dark brown, mottled, firm clay,
abruptly underlying 20-40 cm of very
dark greyish brown to greyish brown,
silt loam with common iron-manganese
concretions at transition
Imperfectly drained, deep, dark brown
to very dark brown, mottled, firm clay
abruptly underlying more than 40 cm of
very dark greyish brown to greyish
brown,- silt loam, with many iron-
manganese concretions at transition
Imperfectly drained, deep, dark brown
to very dark brown, mottled, firm clay,
abruptly underlying 20-40 cm of very
dark greyish brown to greyish brown,
silt loam, with many iron-manganese
concretions at transition
Imperfectly drained to poorly drained,
deep, black, mottled, friable to firm,
sodic clay abruptly underlying 30-40 cm
of very dark greyish brown to greyish
brown, silt loam, with few iron-
manganese concretion at transition
SOIL TAXONOMY
solodic PLAN0S0L abruptic TROPAQUALF,
fine clayey,
montmorillonitic
isothermic
solodic PLAN0S0L aerie TROPAQUALF,
very fine clayey,
(montmorillonitic/
illitic)
isothermic
solodic PLANOSOL abruptic TROPAQUALF,
fine clayey, mixed
(montmorillonitic)
isothermic
solodic PLANOSOL aerie TROPAQUALF,
fine clayey,
isothermic
eutric PLAN0S0L abruptic TROPAQUALF,
very fine clayey,
mixed, (montmorillo-
nitic/illicit/
kaolitic)
isothermic
solodic PLAN0S0L typic NATRAQUALF,
fine, clayey, mixed
(montmorillonitic/
illitic/kaolonitic)
isothermic
-63-

Map
unit
Description FAO/UNESCO SOIL TAXONOMY
LPa9p Imperfectly drained to poorly drained,
deep, dark brown to very dark brown,
mottled, firm clay, abruptly underlying
less than 40 cm of very dark grey to
grey, silty clay loam, with few iron-
manganese concretions at transition
LPalOp Imperfectly drained to poorly drained,
deep, black, mottled, firm sodic clay,
abruptly underlying 30-40 cm of very
dark greyish brown to greyish brown,
clay loam
LPallp Poorly drained, deep, black, mottled
firm clay, abruptly underlying less
than 40 cm of very dark greyish brown,
silt loam
BPp Imperfectly drained to poorly drained,
moderately deep, dark brown to very
dark brown, mottled, friable to firm
clay, underlying very dark grey to grey
clay loam
eutric PLAN0S0L abruptic TROPAQUALF,
sodic phase very fine clayey,
isothermic
solodic PLANOSOL typic NATRQUALF,
fine clayey,
isothermic
solodic PLANOSOL abruptic TROPAQUALF,
fine clayey, mixed
(montmorillonitic/
illitic/kaolinitic),
isothermic
humic GLEYSOL aerie TROPAQUEPT,
fine clayey,
isothermic
-64-

Eleven soil mapping units fall under Phaeozem (Mollisol); eleven units are
Planosols (Alfisol); nine units are Cambisol (Inceptisol); two units are
Andosol (Ultisol or Alfisol) and one unit is Gleysol (Inceptisol).
Not alle the soil mapping units identified are described in this report.
Only a few soil units representative of soils with significantly different
properties are presented. The rest of the soils are described in a
supplementary report which can be found at the Kenya Soil Survey in Nairobi.
The following sections provide a description of the soils together with their
characteristic schematic profiles.
PHAEOZEMS (Mollisols)
Eleven soil units have been identified as Phaeozems. These soils are
generally deep to very deep and are well drained. One unit (UPblöp) is however
only moderately well drained. The textures of the topsoil are loam, silt loam,
clay loam or clay while the textures of the subsoil are clay loam or clay. The
pH of the topsoil varies from 4.9 to 6.7 (average 5.7) and can be considered
moderately acid. The soil fertility assessed in terms of available phosphorus
is variable but commonly low. The available phosphorus varies between 2 ppm
and 193 ppm (average 50 ppm). These soils have a favourable ability to store
moisture. The moisture storage capacity for 100 cm depth varies from 54.5 mm
to 133.4 mm (average 99.0 mm).
The description and analytical data of three of these Phaeozems is given
in Annex 3. Fig. 8 shows the characteristic schematic profiles of the
Phaeozems.
CAMBISOLS (Inceptisols)
Nine soil units have been identified as Cambisols. They are generally
deep and well drained. One soil unit (UPap) however has imperfect drainage
while two soil units (UPbl5p and UPbl8p) are only moderately well drained.
Also one soil unit (UPb7) is very deep while two others (UPbl7p and UPbl8p)
are only moderately deep. The textures of the topsoil are loam, silt loam,
silty clay loam, clay loam or clay while textures of the subsoil are loam,
clay loam or clay. The pH of the topsoil varies from 4.4 to 6.4 (average 5.2)
and can be considered moderately acid. The soil fertility is generally low
with available phosphorus varying between 4 ppm and 182 ppm (average 45 ppm).
The soils however have a very favourable capacity for storing moisture. The
moisture storage capacity down to 100 cm varies from 92.7 mm to 234.5 mm
(average 142.4 mm).
The description and analytical data of three of the Cambisols is given in
-65-

Fig. 8 a. Characteristic schematic profiles of the Phaeozems ( Molli sols) (L: Loam; SiL: SiIty loam; SiCL:silty clay loam; SCL:sandy clay loam; CL: clay loam; C: clay )
UPr1
Ap
Bw
Bwg
Texture
L
CL
CL
UPr2 UPr3 UPb1
Ap
Bt
BC
SiL
CL
Ap
AB
Bu
Bt
Btcg
Ap
AB
Bwg
CL
CL
UPb2 UPb3 UPb4 UPb9p
Ap
Au
SiL
L
Ap CL Ap
AE CL
Ap
AE
SiL
L
Btg CL Eg CL Bt CL
Bwg CL Bw
Bg
CL
SCL
Btg
Bg
C
CL BCcg
CL
L
UPb11p UPb14p UPb16p
Ap Au
Ecg
CL
CL
Ap
AE
CL
CL
CL Btcg Bt
Bw CL
L
Bcg CL Btg
Bc
66

Fig.8b. Characteristic schematic profiles of the Cambisols ( Inceptisols) and Andosols (Ultisols and Alfisols)
UPb7
Bw
Bg
Texture
C
CL
UPb8p
Ap
Bwg
Beg
Bms
SiL
UPblOp
Ap
Bg
Bwg
Bg
CL
CL
CL
CL
UPb12p
Bg
Beg
CL
CL
UPb13p
Ap
Bw
BC
SiCL
CL
C
C
CL
UPb15p
Ap
Bwg
Beg
CL
CL
UPb17p
Ap
Bw
BC CL
UPb18p
Apg
Beg
Be
Bg
BCc
CL
ANDOSOLS
UPap UPb5 UPb6
Apg Ap SCL Ap
ABg CL
Bwcg AE CL
Bg SiL Bt Bt
CL
67

Fig.8c. Characteristic schematic profiles of the Planosols (Alfisols) and Gleysol (Inceptisol)
LPa1
Ag
Eg
Bt
2Bng
Texture
L
CL
C
CL
LPa2.
Apg
Eg
Btg
Bg
Cc
SiL
LPa3p
Ag
Eg
Btc
Bg
SiL
LPa4p
Apg
Eg
Btc
Btg
SIL
CL
LPa5p
Apg
Eg
Btcg
Btg
Bg
SiL
SiL
C
C
C
C
LPa6p
Ag
Eg
Btc
Btg
Bg
SiL
SiL
CL
C
C
LPaZp
Apg
Ee
Bt
Bg
CL
SC
LPa8p
Ap
Eg
Bng
Bg
SiL
SiL
LPa9p
Ap
Eg
SiCL
SiCL
LPalOp
Apg
Eg
CL
C
LPailp
Ag
Eg
SiL
SiCL
GLEYSOL
BPp
Ag
Bg
CL
Bt«
Bt
C
C
Bng Btg
Bg
C
C
Bg
68

Annex 3. Fig. 8 indicates the characteristic schematic profiles of the
Cambisols.
ANDOSOLS (Ultisol or Alfisol).
These are comprised of two soil units. They are very deep soils which are
well drained. The textures of the topsoils are sandy clay loam or clay while
the textures of the subsoil are clay. The soils have a pH of the topsoil which
varies from 4.7 to 5.6 (average 5.2) and this may be graded as moderately
acid. The phosphorus status of the soil is variable and ranges between 12 ppm
and 130 ppm (average 71 ppm). These soils have a good water storage capacity
which varies from 90.5 mm to 112 mm (average 101.3 mm).
The description and analytical data of the Andosols is given in Annex 3.
Fig. 8 shows the characteristic schematic profiles of the Andosols.
PLANOSOLS (Alfisols).
Eleven soil units have been identified as Planosols. The soils are mostly
deep but two of them (units LPal and LPa2) are very deep. All the soils have
imperfect to poor drainage which arises from the existence of a subsoil clay
pan with a very low permeability. The textures of the topsoil which generally
contain mainly amorphous clay minerals are loam, silt loam, silty clay loam or
clay loam while the textures of the subsoil which mainly contain
montmorillonite clay mineral are clay. The pH of the topsoil varies from 4.6
to 5.8 (average 5.3) and can be rated as moderately acid. The fertility of
these soils especially available phosphorus and nitrogen is very low. The
available phosphorus is about 11 ppm (range 2 ppm to 78 ppm). These soils have
only a moderate moisture storage capacity which varies from 40.8 mm to 75.6 mm
for 100 cm storage depth (average 53.3 mm).
The description and analytical data of three of these Planosols is given
in Annex 3. Fig. 8 shows the characteristic schematic profiles of the
Planosols.
GLEYS0L (Inceptisol).
One soil unit falls under this group. It is a moderately deep and
imperfectly to poorly drained soil. The topsoil texture is clay loam which
overlies a clay subsoil. The pH of the topsoil is 5.2 and the phosphorus
status is very low being 6 ppm.
The description and analytical data of this soil is given in Annex 3
while Fig. 8 indicates the characteristic schematic profile.
-69-

6.3 PROBLEMS OF THE SOILS AND HOW THEY INFLUENCE LAND USE
Plants have specific requirements for optimal production. The integrated
effect of climate and soil condition at a site determine the production from a
given crop or plant cultivated under a specified level of management. Although
the effect of climate by way of temperature and moisture supply is overriding
in determining crop production, the effect of soil and land management are as
important. Basic land requirements of plants may be summarised as below:
1. temperature regime as concerns the annual or seasonal and/or daily
temperature level and fluctuations
2. the soil moisture regime as related to the possibility to release
moisture
3. the soils aeration as related to the capacity to supply oxygen to the
rootzone
4. the effective soil depth that is available for root development and
foothold of the crop
5. the natural soil fertility regime with regard to its ability to retain,
store and release plant nutrients and absence of harmful conditions such
as high salinity and sodicity as well as too low pH
6. the soil tilth as required for germination and early growth
7. absence of soil degradation to enable sustained yields.
In the study area, the high lying areas contain soils that are friable
and porous. The infiltration and permeability for both water and air are good
and the soils are well drained. They are also deep to very deep for foothold
and have a high capacity to store and release moisture. In the low lying areas
the soils have a subsoil claypan giving rise to low infiltration and
permeability. The soils in these low lying areas are consequently imperfectly
to poorly drained. In some areas the soils have very high content of sodium
(alkali) and this worsens the drainage condition. In spite of their deep
profiles, the effective depth of these soils is restricted by the occurrence
of claypan. Their capacity to store and release moisture is therefore rather
low. They also have a poor state of aeration.
Most soils as assessed by the method of Mehlich et al (1962) are
moderately acid and have low fertility especially with regard to phosphorus.
The available phosphorus is generally below 20 ppm. Total analysis for
phosphorus has been carried out on topsoil to derive some measure of the
potential supply source for this element. Total phosphorus levels range from
28 ppm to 120 ppm (average 68 ppm) for better drained soils and 16 ppm to 110
-70-

Table 23: The major characterist ics of the s o i l s and the area of s o i l s per scheme (moisture between pF 2.0 and 4 .2; ref. FAO, 1979).
Area (ha) in the scheme" Soi l Drai- Depth Moisture hoi- Other unit nage ding capacity spec-
(mm) to 100 i a l cm; 150 cm featu
res
South Bamboo Karati Njabini Githioro Muruaki Tulaga Special Kinan- management gop , problem
Ü P r ï g ö ö d v.deep 103.7 13772 Iron-Mn SFT concretions
UPr2 UPr3 UPbl UPb2 UPb3 UPb4 UPb5
UPb6 UPb7
UPb8p
UPb9p UPblOp
UPbllp UPbl2p
UPbl3p " UPbHp " UPbl5p mod.
good
UPbl6p " UPbl7p good mod.
deep
UPbl8p mod. good
120.4 146.8 187.0 140.1
137.2 202.8 238.8 186.6
206.5 285.0 -156.8 207.3 -202.3 248.3 -
143.6 206.1 -247.7 385.7 -
deep 118.8 130.9
120.4 148.0
139.0 145.7
139.7 210.5
191.5 206.2
207.9 252.3 111.6 119.3 266.6 391.6
138.8 149.8
199.3 149.8
iron-Mn concretions
iron-Mn concretions
Iron-Mn concretions
Iron-Mn concretions
UPap
LPal
Impe- deep rfect Impe- very rfect deep
151.6 151.6 -
138.9 199.4
536 nil 683 96
125 228 nil
15 nil
nil
nil 66
132 nil
nil nil nil
nil 15
nil
nil
104.6 104.6 sodic; 455 clav
LPa8p
LPa9p
LPalOp
LPallp
BPp
Imperfect to poor
poor
Imper feet to poor
10
767 nil nil nil nil nil 259
474 nil
nil
nil nil
nil nil
nil nil
nil
nil
nil
LPa2 Impe- very 83.3 83.3 claypan 30 nil rfect deep
LPa3p " deep 89.5 89.5
LPa4p " " 90.8 90.8
LPa5p " " 142.5 142.5
LPa6p " " 91.4 91.4
64.5 64.5
nil
nil nil 211 nil 109 nil nil
42 79
265
nil 12
nil nil
1323
22 205
nil nil nil nil
11
nil 789
nil
nil 1145
nil 200
nil nil
nil
nil
640
92 nil
205
nil
335
272 nil
nil nil nil nil
44 nil 2131 427
nil nil nil nil
nil
nil nil nil nil nil nil nil
nil nil
nil
400 nil
nil nil
nil 18 nil nil nil 218 nil nil nil nil 135 nil
nil 57
nil
nil
739
nil
nil nil nil nil nil
nil nil nil nil nil
86.7 86.7 sodic; nil nil 1473 nil nil claypan
57.4 57.4 sodic; 2100 nil claypan
37 nil nil
92.3 92.3 claypan 867 nil nil nil 404
66.9 66.9 - nil nil nil 70 159
nil
nil nil nil nil nil nil nil
nil nil
nil
nil nil
nil nil
nil nil nil
nil nil
nil
nil
nil
nil
nil
nil
nil
nil nil nil nil 84 nil nil
nil nil
nil
nil 49
nil nil
nil nil 161
323 nil
305
239
nil
69 1814 221
nil nil
1904 2612 478
68 718 1117
925 992
24 472
nil nil
110.2 110.2 claypan nil nil 79 nil nil 536 nil
n i l
n i l
n i l
low pH, low phosphorus
low phosphorus low phosphorus
low phosphorus low pH; low phosphorus
low pH; very low f e r t i l i t y low pH; very low f e r t i l i t y
low pH; very low f e r t i l i t y low phosphorus low pH; very low f e r t i l i t y
low pH; very low f e r t i l i t y
low phosphorus Low pH; very low f e r t i l i t y
low pH; very low f e r t i l i t y heavy clay subsoil; low permeability low nitrogen and phosphorus heavy and alkal subsoi l ; low permeability very low f e r t i l i t y ; heavy clay subsoil; low permeability low nitrogen and phosphorus; heavy clay subso i l ; low permeability low nitrogen and phosphorus heavy clay subso i l ; low permeability, low nitrogen and phosphorus heavy clay subs o i l ; low permeability very low f e r t i l i t y ; heavy clay subsoil; low permeability low nitrogen and phosphorus heavy clay subs o i l ; low permeability low pH; low f e r t i l i t y ; heavy clay subsoil; low permeability very low f e r t i l i t y ; low low permeability
very low f e r t i l i t y ; heavy and a lkal i subso i l ; low permeability low phosphorus; heavy clay subsoil low phosphorus ; flooded
- 7 1 -

ppm (average 66 ppm) for imperfectly drained soils. This may be considered a
moderate supply level. It should however be borne in mind that during the
release of this phosphorous, fixation process may be operative in the soil in
which case the total phosphorous figure is of less significance.
It was observed that when the imperfectly drained soils are cultivated
with mouldhoard or disc plough, the soil is turned into large lumps of hard
soil. To prepare a seedbed from these soils requires at least two ploughing
and three harrowings. The process is even more elaborate for a finer seedbed
necessary for wheat or barley growing. The cost of land preparation on the
imperfectly drained soils is consequently high and is an important drawback in
the use of these soils for arable agriculture. Also because especially the
subsoils of these imperfectly drained soils predominantly contain
montmorillonite clay mineral, the soils become very sticky and plastic when
wet and may stay so for a long time. They can therefore not be reasily
cultivated when wet and also driving over them during the rainy season is
difficult.
Table 23 shows the soils characteristics with regard to the drainage,
depth, moisture holding capacity, fertility and workability. It also show the
hectarages of the various soil units in the different settlemtn schemes. Soil
drainage is the most outstanding limiting factor in the area. About 31% of the
area of the seven schemes (32,500 ha) covered by this study consist of well
drained and moderately well drained soils while about 697 of the area
comprises imperfectly drained to poorly drained soils.
The percentage distribution of the better drained and imperfectly drained
soils between the schemes is as follows:
Scheme South Bamboo Karati Njabini Githioro Muruaki Tulaga Total Kinangop
% well 7.5 4.7 2.1 13.5 0.3 0 2.8 30.9 drained soils % imper- 10.8 0 14.2 2.6 10.3 20.4 10.8 69.1 fectly drained soils
Muruaki and Githioro Settlement Schemes consist exclusively of
imperfectly drained soils while Karati and Tulaga Schemes are dominated by the
imperfectly drained soils. Bamboo Scheme is exclusively of well drained soils
while Njabini Scheme is dominantly by well drained soils and the well drained
-72-

soils are in almost equal proportion in the South Kinangop Scheme. The effect
of imperfect soil drainage is therefore expected to be felt more in Muruaki,
Githioro, Karati and Tulaga Settlement Schemes. However the very dissected
topography in the Muruaki and Tulaga Scheme (see Fig. 7) no doubt helps in the
lateral removal of excess water, for this reason, Githioro and Karati Schemes
are the worst affected with regard to poor drainage.
-73-

PART 3
POSSIBILITIES FOR LAND USE
7. THE LAND UTILIZATION TYPES IDENTIFIED FOP. THE AREA AND THEIR LAND
REQUIREMENTS
In the previous sections 2 and 3 the crops, livestock and trees that are
adapted to the study area have been discussed. Furthermore the nature of the
climate and the soils of the area are presented in sections 5 and 6. The
information in the above mentioned sections indicates the diversity of the
crops and soils which however occur under a climatically favourable situation
not withstanding the occurrence of night frosts which as already mentioned can
be contained by adapting suitable crops. The following sections attempt to
examine the possibilities that the prevailing physical nature of the area
offer for improved land use.
7.1 LAND UTILIZATION TYPES
The determination of physically possible forms of land use in an area is
necessary if the agricultural production of the area is to be improved. The
methodology for such a determination has been developed by various workers
(Beek and Bennema, 1972; Brinkman and Smyth (eds.), 1973; FAO, 1972-1975)
culminating in the publication by FAO (1976) of the "Framework for Land
Evaluation". The concept of Land Utilization Type (LUT) as introduced by Beek
and Bennema (loc cit) and elaborated by Beek (1978) has been adopted by FAO
(1976) in the framework for land evaluation. According to this concept, the
LUT is considered to be the subject of land evaluation whereas the Land Unit
(LU) is the object of land evaluation. LUT and LU then constitute a Land Use
System (LUS).
A Land Utilization Type can be either a known common practice to the land
user or a new practice that can be managed within the land user's know-how and
economic capability. It can therefore only adequately be defined using
essential distinguishing factors which have marked influence on the
performance of the land. These factors are produce, capital intensity, labour
intensity, farm power, level of technical know how, farm size, land tenure,
farm incomes and institutional infrastructure (roads, markets, price
structures, etc). A land utilization type also requires the specification of
-74-

the management level. The management refers to the practices connected with
the improvement of the land qualities.
Based on the observation of the farming practices in the study area, the
following land utilization types are relevant to the area:
A. Small scale rainfed arable farming for non cereal annual crops at low
level of management.
B. Small scale rainfed arable farming for non cereal annual crops at
intermediate level of management.
C. Medium scale rainfed arable farming for wheat/barley/oats at intermediate
level of management.
D. Small scale rainfed arable farming for fruit trees at intermediate level
of management.
E. Small scale grazing for cattle and sheep at intermediate level of
management.
F. Tree production for firewood and building poles.
G. Fish pond for fish production.
In considering the crops for the land utilization typs, maize is omitted
because of the risk of frost mentioned in section 5.3 and the lack of a
suitable variety which can mature within the period March to June which is the
safe period with regard to frost. Similarly, because of the lack of a suitable
cool tolerant rice variety for the cool temperature of the area this crop is
omitted although some of the soils may be ideal for rice. Sixteen rice
varieties supposed to be cool tolerant were tested but found unsuitable for
the cool temperature of Kinangop. Eight varieties named Jyanak, Fujisaka 5,
Ai-nan-tsao 1, Kn-lh-361-1-8-6-9-1, Kn-lh-361-1-8-6, IR1846-300-1-1, IR 3941-1
and China 1039 were obtained from the International Rice Research Institute in
Philippine whereas the other eight varieties known as Kayayuki, Hokusetsa,
Kachi Honami, Oirase, Ishikari, Sorachi, Tatsumi-mochi and Yoneshiro were
obtained from Japan's Third Laboratory of Rice, Hokkaido National Agricultural
Experimental Station. Potato is included as a crop for the area provided it is
grown during mid March to mid June which is free from frost. The
characteristics of the above land utilization types are discussed below:
-75-

A. Small scale rainfed arable farming for non cereal annual crops at low
level of management.
This land use alternative is characterised in the study area by the
practice of mixed cropping. The cropping pattern is essentially of a mixed
nature as already discussed elsewhere in this text. The crops grown are
pyrethrum, potato, cabbage, cauliflower, kale, carrot, onion, leek, beet,
peas, mangold and sunflower. The mixed cropping mostly involve potato,
cabbage, kale and leek. Yields are low but the farmer is able to assure
continued supply of his food. Fertilizer use under this land utilization is
difficult to justify as there are no experimental data to aid the
determination of the amounts to apply and how to apply them. Because of the
low yields this land use alternative mainly cater for the food needed by the
family. The little surplus crop especially with regard to cabbage and potato
may however be sold.
The capital intensity is low. The investment is confined mainly to the
purchase of seeds. Land cultivation is by hoe but is also sometimes by hired
tractor which is owned by the cooperative society. The present land tenure
system in the area which consists of settlement schemes does not act as an
impediment to the development of this land utilization type. The head of the
family is the registered plot holder and owner of the land title deed.
The farm sizes vary between the schemes as already indicated elsewhere in
the text. Also the actual area put under crop at a particular time varies
considerably depending on the family food needs and desired cash income. The
farm power is mostly made up of manpower. Much of the work is carried out by
women. The technical know-how is low. Moreover little improvement on the
farming system has been carried out by agricultural research.
B. Small scale rainfed arable farming for non cereal annual crops at
intermediate level of management.
This involves that level of farming where certain inputs (fertilizers,
insecticides, herbicides, mechanization, etc.) are used on modest scale at
lower levels than those recommended from research trials. In order to raise
the presently low level of management the farming in the area to a higher
level of intermediate management, an appropriate development strategy has to
be worked out.
Similar crops are grown as in the low level management. The technology
for the majority of crops consists of the use of improved seeds but the use of
-76-

fertilizers and pesticides is in practice limited. The latter are practised
mainly for the production of carrots which is supported by a commercial firm.
Hired tractor is commonly used for land preparation. The greater investment
goes to the purchase of improved seed and tractor ploughing. However
investment for moderate fertiliser use is necessary under this intermediate
level of management. As already stated elsewhere in the text the yields
achieved at present are rather low and can substantially be increased with
modest fertilizer application, timely planting, better weeding, and adequate
pest and disease control. The improved agricultural husbandry should be based
on sound farm planning.
Apart from manpower, tractor power is essential especially for the land
preparation on the rather difficult imperfectly drained soils (Planosols). The
lack of technical know-how at the farm level is definitely a constraint and
greater agricultural extension effort needs to be placed on educating the
farmers on improved agricultural husbandry and its impact on yields. With
improved crop husbandry methods, the farm incomes could be increased without
basically changing the farming system. The adoption of improved methods will
also no doubt be an essential first step towards the development of a high
level of farm management in the study area.
The farm size is not different from that operated under the low level
management since the area is comprised of settlement schemes with demarcated
plots. The actually cultivated areas are however somewhat larger than those
under the low level management.
A significant problem that can have profound effect on this land use
alternative is the lack of good farm road system and profitable markets for
the surplus food crops. Availability of profitable markets is hampered by high
transport costs and the lack of well organised marketing system except for
produce such as pyrethrum, wool, milk and carrots which have organized
marketing systems within the area. The farmers can put in a lot of effort when
they are provided with appropriate marketing system for their produce.
C. Medium scale rainfed arable farming for wheat/barley/oats at intermediate
level of management.
This land use alternative concerns the growing of wheat, barley and oats
where the full range of agricultural production inputs are used as recommended
from agricultural research. Since the technology for wheat growing in Kenya is
at present fully mechanized using combine planters and harvestes etc. , it is
-77-

not economic to use these machinery on small plots of wheat. It is for this
reason of the lack of small scale technology for wheat/barley/oat growing,
that the areas where this land use alternative can be practised is restricted
to the schemes with larger farm sizes. This land use is therefore mainly
practised in the extensively flat and slightly sloping areas which carry the
imperfectly drained soils (Planosols) and where the holdings are slightly
larger to compensate for the poor soils. It is a common practice for the
farmers to rent the land to outsiders who have the capital for full
mechanization of the production of wheat, barley and oats. Success in the
production of these crops is however not always attained as a lot of effort is
required to produce from the imperfectly drained soils the fine seedbed
necessary for the crops. Moreover, unless camberbeds are used the drainage
conditions are such that in years of unusually heavy rainfall the fields are
waterlogged and crops totally fail.
The production of wheat has been encouraged through loans from the Kenya
Agricultural Finance Corporation whereas the growing of barley is supported by
the Kenya Breweries. Because of the generally poor land preparation and the
adverse effect of drainge, yields are low. The profitability of the wheat,
barley and oats enterprise is therefore not assured. Moreover, the Department
of Settlement (1976, p7 and p9) has reported that the wheat and barley have
taken up the grazing and pyrethrum land and subsequently reduced the dairy and
pyrethrum production. Investments involve the purchase of improved seeds,
fertilizers, pesticides, land preparation and mechanical harvesting. The
labour requirement is however low since the operations are largely mechanized.
The full use of tractor is made and the manpower required is only for a few
operators of the machinery.
The level of technical know-how for production is high although it is not
up to full use by the present farmers. Prior to the small-holder settlement,
the study area was prominent in large scale wheat farming which employed
research proved advance technology on the sloping lands of the imperfectly
drained soils.
D. Small scale rainfed farming for fruit trees at intermediate level of
management.
This land utilization type is at present mostly practised in the form of
orchards. The fruit trees involved are mainly plums, apples and pears, but
also are peaces. Yields are low since the husbandry is poor. Because of the
-78-

low yields, this land utilization type mainly cater for the fruit needed by
the family. There is however scope for intensifying the production of the
above fruits which are not only very much required for the domestic market but
also for the export market.
The capital intensity is low. The investment goes mainly to the purchase
of planting material. Land preparation is by hoe but ploughing is also
sometimes done by hired tractor owned by the cooperative society. The farm
size is similar to that under the non-cereal land utilization types. Also the
actual area put under crop depends on the family needs. The farm power is
mostly made up of manpower. The lack of technical know-how at the farm level
is a constraint and greater effort is required to assist the farmer to improve
the husbandry of the growing of fruit-trees. With improved crop husbandry
methods, the farm incomes could be increased. Profitable markets are difficult
to secure because of high transport cost to such markets and also lack of
organized marketing. This constraint can greatly be improved through efforts
of the Kenya Horticultural Development Authority.
E. Small scale grazing for cattle and sheep at intermediate level of
management.
This land use alternative is practiced in the study area for milk, meat
and wool production. The herd and flock consist almost exclusively of grade
cattle (Aryshire and Friesian) and sheep. The stocking rate varies from 0.34
Livestock Unit (LU) per hectare to 2.04 LU/ha. Because of the low level of
pasture management, profitability of the livestock enterprise is not as high
as expected. Since the carrying capacity of the prevailing natural pasture is
low, there is already some degree of overstocking and this could even worsen
the rather low profitability. The stocking rate needs to be regulated and the
production of fodder and improved ley grass encouraged.
The farm size in the areas of better drained soils is small and the
grazing is often supplemented with fodders such as kale, mangold, beet and
oats. The farm size is however large in the areas with imperfectly drained
soils where the livestock husbandry is wholly dependent on grazing the natural
pasture. The production of oats as a fodder is tried in these areas but the
yields are usually low because of imperfect drainage of the land. The
technology consists of the use of grade cattle and sheep which are highly
susceptible to diseases and must be protected at all cost. The capital
requirement therefore concerns the acquisition of grade animals, the chemicals
-79-

for maintenance of the animal health and artificial insemination.
The technical know-how is high and the extension service for animal
health and articifial insemination is well organized. The labour requirement
of confined to manpower for milking, shearing and spraying of the animals.
Almost exclusively, this is handled by the family labour. The marketing of
milk and wool is through organized cooperatives with well laid collection
centres. This well organized marketing for milk and wool is a great incentive
to the farmers.
F. Tree production for firewood and building poles.
This land utilization type concerns silviculture for the provision of
firewood and building poles. For many farmers of the area, trees have
traditionally provided and continues to provide some of the basic needs for
life namely fuel for cooking and building materials. The shortage of firewood
alone presents an energy crisis as profound as and probably more intractable
than that connected with oil. If local crisis are to be avoided and the
environmental role of trees preserved, ways must be found to satisfy the local
trees requirements particularly for firewood and building. These needs may be
met by encouraging the development of woodlots as part of the farming system.
The extent of the woodlot will obviously depend on the demand and availability
of land that can be spared for this purpose. Only land with little potential
for arable agriculture could in principle be set aside for the purpose of tree
plantation. The area under trees is present very small. The major tree species
found on the imperfectly to poorly drained soils are Eucalyptus saliqna,
Eucalyptus globulus, Eucalyptus maculata, Cupvessus lusitanica, Cupvessus
micvocavpa, Cupvessus benthimii and Pinus halapensis. There are possibilities
for other species as well.
Attention should be paid to the above tree species which have been
planted especially on the imperfectly drained soils (Planosols) by the
farmers. In considering the possibility for tree exploitation it should be
realised that apart from their timber potental they also have other functions
such as the provision of shelter belt. It was observed that crops in fields
surrounded by trees are normally protected from severe damage by frost and
strong winds which are common in the Kinangop area. Firewood and building pole
plantations on the imperfectly drained areas of Planosols could be viable
enterprises since the need for fuelwood and poles appear high.
-80-

G. Fish pounds for fish production.
There exist a number of dams in the area (see Fig. 7) and it is possible
to construct others. With support from the Fisheries Department, some of the
dams could be developed for fish farming especially to increase the value of
land in the imperfectly drained areas with claypan soils.
Fish culture has assumed progressively greater importance in Kenya. Once
the ponds are constructed there are two approaches to the management that may
be adopted. One is extensive fish farming while the other is intensive fish
farming. In the former, the fish are placed in large body of water and are
allowed to grow until harvesting without additives in the form of food or
fertilizers. In intensive fish culture, the fish are given additional
fertilizer and food to improve growth rates. Fish farming has two culturing
systems namely mono-culture and poly-culture. Mono-culture is the culture of a
single species of fish and usually involves only the males of that species to
prevent unwanted breeding in the production ponds. The fish most commonly used
for mono-culture are Tilapia which are indigenous to Africa. The other system
which is poly-culture entails a situation where several species of fish with
complementary feeding habits are used. One poly-culture practised in Africa
involves Tilapia and Clarias.
An alternative to fish culture by itself is an integrated system of fish
farm closely associated with other domestic livestock such as chicken. The
livestock are housed in such a way that their droppings can easily be washed
into fish ponds thereby increasing the productivity of the ponds. A yields of
fish of 2 tonnes/ha/year from a fish pond is not excessive. Normally however,
for a village fish farmer a figure of 1 tonne/ha/year would be considered a
good yield.
The construction cost of fish ponds are probably a little more than those
for gravity fed irrigation ditches. However the cost is justified considering
the improved nutritional status of the farmer as a result of having a high
quality protein supply on his doorstep.
7.2 THE KIND OF LAND REQUIREMENTS OF THE LAND UTILIZATION TYPES
In section 7.1 the Land Utilization types have been identified and their
key attributes described. With this background it is possible to identify the
specific land requirements of each land utilization type. Land requirements
relate to those land factors which have direct influence on the feasilibity
and performance of the type of land under consideration. If the land use
-81-

envisaged is for instance grazing on natural grassland then the requirement of
good grassland as well as drinking water becomes significant.
The land requirements may be categorised according to Beek and Bennema
(loc cit) as follows: requirements of plant growth; requirements of animal
growth; requirements of natural product extraction and requirements of
management practices in plant and animal production or extraction. The land
requirements for each of the land utilization type of the study area is as
indicated below:
A. Small scale rainfed arable farming for non cereal annual crops at low
level of management:
- Water requirement
- Nutrient requirement
- Lack of risk of erosion
- Requirement of use for agricultural implements
- Oxygen requirement
- Lack of risk of alkalinity/sodicity/alkalization
- Lack of risk of periodically occurring pests and diseases.
B. Small scale rainfed arable farming for non cereal annual crops at
intermediate level of management:
- Land requirements are similar to the above mentioned.
C Medium scale rainfed arable farming for wheat/barley/oats at intermediate
level of management:
- Land requirements are similar to the above mentioned.
D. Small scale rainfed arable farming for fruit trees at intermediate level
of management:
- Water requirement
- Nutrient requirement
- Lack of risk of erosion
- Requirement for use of agricultural implements.
- Oxygen requirement
- Lack of risk of alkanity/sodicity/alkalization
- Requirement of foothold
- Lack of risk of periodically occurring pests and diseases.
E. Small scale grazing for cattle and sheep at intermediate level of
management:
- Water requirement
- Nutrient requirement
- 8 2 -

- Lack of risk of erosion
- Oxygen requirement
- Lack of hinderance by vegetation
- Lack of risk of overgrazing
- Requirement of drinking water
- Lack of risk of alkalinity/sodicity/alkalinization
- Lack of risk of periodically occurring pests and diseases.
F. Tree production for firewood and building poles:
- Water requirement
- Nutrient requirement
- Lack of risk of erosion
- Oxygen requirement
- Lack of risk of alkalinity/sodicity/alkalinization
- Requirement of foothold
- Lack of forest fire hazard
- Lack of windfall hazard
- Lack of risk of periodically occuring pests and diseases.
G. Fish pond for fish production:
- Requirement of pond construction
- Lack of risk of erosion
- Water requirement.
The relationship of the land requirements with the land qualities will be
treated in section 8 as to identify the constraints to the land utilization
types.
-83-

8. THE KIND OF THE LAND QUALITIES IDENTIFIED FOR THE AREA, THEIR GRADES AND
HOW THEY FIT THE REQUIREMENTS OF THE LAND UTILIZATION TYPES.
Many land or soil characteristics are unlikely to influence land
suitability independently unless they are extreme. The majority of the land
and soil characteristics must therefore be considered jointly with or in
relation to other characteristics to allow for interaction between them.
Proposals have been made by Beek and Bennema (loc cit), FAO (1976) and Beek
(loc cit) to group single characteristics into a combination called a "land
quality". It is defined in FAO (1976) as "a complex attribute of land which
acts in a distinct manner in its influence on the suitability of and for a
specific kind of use". The expression of each land quality is determined by a
set of interacting land characteristics which may be single or compound and
which have different weights in different environments depending on the values
of all characteristics in the set.
Beek and Bennema (loc cit) have provided a list of examples of land
qualities. The following land qualities correspond to the land requirements of
the land utilization types of the study area:
A. Small scale rainfed arable farming for non cereal annual crops at low
level of management:
- Availability of water
- Availability of nutrients
- Resistance to erosion
- Possibility to use mechanical implements
- Presence/hazard of water logging (availability of oxygen)
- Presence/hazard of alkalinity/sodicity/alkalinization
- Risk of periodically occurring pests and diseases.
B. Smalle scale rainfed arable farming for non cereal annual crops at
intermediate level of management:
- Land qualities are similar to the above mentioned.
C. Medium scale rainfed arable farming for wheat/barley/oats at intermediate
level of management:
- Land qualities are similar to the above mentioned.
D. Medium scale rainfed arable, farming for fruit trees at intermediate
level of management:
- Availability of water
- Availability of nutrients
-84-

- Resistance to erosion
- Possibility to use mechanical implements
- Presence/hazard of waterlogging (availability of oxygen)
- Availability of foothold
- Presence/hazard of alkalinity/sodicity/alkalinization
- Risk of periodically occurring pests and diseases.
E. Small scale grazing for cattle and sheep at intermediate level of
management:
- Availability of water
- Availability of nutrients
- Resistance to erosion
- Presence/hazard of waterlogging (availability of oxygen)
- Hinderance by vegetation
- Risk of overgrazing
- Availability of drinking water
- Presence/hazard of alkalinity/sodicity/alkalinization
- Risk of periodically occurring pests and diseases.
F. Tree production for firewood and building poles:
- Availability of water
- Availability of nutrients
- Resistance to erosion
- Presence/hazard of waterlogging (availability of oxygen)
- Availability of foothold
- Presence/hazard of alkalinity/sodicity/alkalinization
- Presence of windfall hazard
- Presence of forest fire hazard
- Risk of periodically occurring pests and diseases.
G. Fish pond for fish production:
- Resistance to erosion
- Availability of water
- Availability of conditions for pond construction.
A land quality can be quantified and graded for assessment of land
suitability classes. There is no international system for grading of the land
qualities but various methods of grading have been proposed by various workers
including van de Weg and Braun (1977) and Debele (1980). Van de Weg and Braun
(loc cit) have proposed a system for the rating of land qualities for regional
-85-

land evaluation in Kenya while Debele (loc cit) in a paper presented at the
meeting of the Eastern Africa Soil Correlation and Land Evaluation Sub
committee presented a methodology for the rating of the land qualities and
determining the land suitability classes based on the weighting of the land
characteristics and land qualities. The problem with methods based on the
weighting of indices such as Debele's method is that the weight or idex of one
land characteristic or land quality can not be treated independently of the
others and yet often it is the one land characteristic or land quality which
presents the strongest constraint which is the determining one for a land
suitability class. Moreover, the weights must of necessity be different for
different situations and their use cannot therefore appropriately allow for
extrapolation.
The methodology of van de Weg and Braun (loc cit) on the other hand
treats the land characteristics and land qualities independently and thus
allows the individual effect to be assessed. It is for this reason that the
latter methodology is considered to be more appropriate for the present study
and is therefore employed with appropriate modifications, in computing the
grades of the land qualities. The use of this method is particularly
facilitated because the laboratory and field soils data essential for its
application have been determined for the area in the course of the present
study. The grading of the land qualities according to van de Weg and Braun
(loc cit) is found in Annex 4 while the grades of the relevant land qualities
computed for the soil units of the area are found in Table 24. A significant
modification made with regard to the ratings of van de Weg and Braun concerns
the moisture availability. The grades of available moisture carrying capacity
have in this study been related to the periods of moisture sufficiency since
it is the latter, rather than the available moisture carrying capacity, which
influences plant growth. Moreover the available moisture has been considered
between pF 2.0 and 4.2 as recommended by FAO (1979, p26)
-86-

Availability of c o n d i t i o n s f o r i n i n i n i r i i n i n i n i r i i n u i i n i n i / , i i r i i r i u , i i n < , < t i n - * t , i n ( n ( « i n < n f , i r i N n N n < * i p o n d c o n s t r u c t i o n
R i s k o f o e s t s & __ d i s e a s e s — 1 ^ ^ _ — 4 _ ^ — i ^ - t ^ n i p ^ _ ^ . _ - < —, —,„__<_-, _ _ _, _ —, _ —, _ —< — — — —• -« —•
0) 01 Ü Hazard of windfall -i-, — -, .,-,-,-,-,-,-,-,,-,— _ _ _ _ _ _ _ _ _ - , _ _ _ _ _ „ H _ _ _ _ M <U •g Hazard of forest _ ^ _ _ J _ _ - ^ ^ _ _ _ < _ ^ _ ^ r t _ < _ — „ . ^ ^ ^ „ ( ^ ^ ^ ^ ^ ^ ^ ^ „ H ^ - ,
^ fire o g Availability of _ _ _ _ _ „ , _ _ „ , _ _ _ _ _ _ _ < , H _ * _ I _ _ _ _ , H _ _ ____„< _ _ -, -. -* £ drinking water •H B •*•! R i s k Of O V e r g r a z i n g N N N N N N N C M M M N N N N N N N N M N N N n M r i P i n o l C I C l f O m c X ^ •o je Hinderance by
vegetation u o
Availability of _ _ _ _ foothold
* C
e Hazard of water- _ _ __ „ lo88ing <u o to ca i
H O CO 4J •H . C ß Possibility <u
O f U S e O f O —' CN — ' C M — I Ç S J - * C M - H O " J - H - H . - J — < C M { N I « - H - H - H { N C N - H - * - H — < - < r t - H - * - * - - - J - * —I
•H implements (0 B (U ff ^ - i C S l . - * . - * — 4 . - 4 — < - H . - < C N | - - - * — H — — - * — I — < — H — < C N - H - ' . - - - H - * - H - - C N — - * - * - - ' - « 4-1
o Resistance to S erosion CU
•H « Hazard of alkalin-'H ity/sodicity/alka- w - - - - - n - - H - < r j - i r t f o - - i N r t N - i - i - N N N ( N N ( N N f M r t W N w £. linization "3 Availability of « nutrients
f-H
dl O je m e iJ —I U N N - ' H M - ' —< -- -H -J CN! CN —< CN -* — i r i H N N N N n - J - J C 1 N n - ï - * n > t M - î
Availability ° of. O 05 moisture o G 'S u M 0) H •<!•
CN 0-c.Q.Q.o.a.a.D.a. Q- a.
<u Soil Unit B.CLO—'cNiro^-Ln^or-oo o.cuei.a.o.o.Q.0—. —i "w-^j- «"j-- H M —'cMfo-<TLn\or~«ooo>--<—'—i—i—<—i—i—(-H a.—i N n <• ir>, * N co » - -H S 3 B 3 3 3 » D 0 P S D 3 3 C ; 3 0 3 3 3 = ) 3 i - J i - J p - J 1 - J h J 1 J 1 - J » J 1 J i J H J c e
- 87 -
9. THE IMPROVEMENT POSSIBILITY OF THE LAND AND THE LIMITS OF THE GRADES OF
LAND QUALITIES SET FOR THE SUITABILITY CLASSES FOR THE DIFFERENT LAND
UTILIZATION TYPES
Before a land suitability classification is carried out, the
possibilities of improvement of the land have to be established and the
minimum grades of the land qualities that should be allowed for each land
suitability class set for each land utilization type as assumed level of
management (i.e. input). The technical improvement possibilities include the
following among others: improvement of fertility status by using fertilizers;
improvement of water availability by irrigation; improvement of the soil
aeration by drainage; the control of soil erosion with soil conservation
practices; the control of floods with embankment. The technical improvement
can be assessed in terms of the capital inputs involved of the effectiveness
of the measures. They may be designated by letters 0, A, B, C, D and E which
respectively represent no improvement, low input improvement, medium input
improvement, high input improvement, very high initial improvement plus normal
recurrent cost, and very high initial input improvement plus high recurrent
cost. At low input improvement, only special crop management and simple soil
management may be required while at medium input improvement, intensive soil
management is involved and the farmer needs well organized advisory service.
Measures requiring high input are usually beyond on-farm development and
implies regional planning and development. These input measures which may
concern large scale land and water engineering operations such as reclamation,
land grading, drainage system, terracing, etc. may require service of a
contractor. Where the improvement of the land involved high input the
classification of the land is regarded as a potential suitability at medium
and low input the classification is treated as current suitability.
The suitability of the land then depends on the degree to which its land
qualities satisfy the requirements of the land utilization types at assumed
level of input (management). If the yields from a number of sites on different
types of land are available, this may provide a better clue for the
suitability class. But information on the relationship between land qualities
and yields are scarce. For the study area and indeed for the whole of Kenya,
this information is lacking. Furthermore, examples of conversion tables are
scarce in literature. Tables 25a to 25g give the limits of the grades of the
land qualities which the author has set for the suitability classes for the
-88-

different land utilization types applicable in the study area and at assumed
low and medium levels of input (management). The limits for moisture
availability especially take into account the fact that the rainfall in the
study area is well distributed throughout the year. Thus the moisture is
frequently replenished even though that the available moisture may be small.
Table 25a: Limits of the grades of land qualities set for the suitability classes for the land utilization type A: Small scale rainfed arable farming for non cereal annual crops at low level of management (i.e. at low input requirement).
r4
» s a. o c » i—»
n en H-h-" C rt 03 F> ^ en rt 03 03
o* F -F 1
F « rt ^
1.1 Highly s u i t ab l e
1.2 Moderately s u i t ab l e
1.3 Marginally s u i t ab l e
3 Unsuitable
> < 03 F » h-1
0) O* P « P-1
F -f t
VJ
O Ph
3 o F -CO p t C n ro
1
2
3
4
> < 03 F -P 1
03
er F -P-> F -rt •< O i-h
3 C rr p( F ' (B 3 rt os
1
2
3
4
!» m m F -CO P t 03 3 O
m rt o m PI
o co F -
o 3
2
3
4
5 Note: n . a . = not appl icable
co 33 O 03 Oi N F - 03 O Pi p . o. Pt
V! O - ^ Ph 03 l_â ja ^ P-" 03 ?C l_. (o F - P-> 3 F-F- 3 N F -03 Pt rt •<! F" - -»
. O 3
2
3
3
4
H. hfl
S o X) 03 P-> 03
n> F« a o* (B F -3 F* Pt F ' 03 Pt
V i
O Ph
C 03 (T>
O Ph
3
3
3
4
SC 03 N 03 PI
cu o Ph
S 03 P t (0 p( p- 1
o 0Q 0Q F ' 3
0 9
2
2
3
4
> < 03 F -P-> 03 O* F -h-1
F ' rt "•< O Ph
Ph O O rt 3* O F " O .
3
4
4
5
33 F -3 CU <B P( 03 3 O
n> c vs < m OQ (B P t 03 rt F -O 3
n . a .
n . a .
n . a .
n . a .
po F -03
w o Ph
O
< (B p(
0 9 Pi 03 N F -3
0 9
n . a .
n . a .
n . a .
n . a .
Cu > Pi <! t - . 03 3 , F ' !C p* F - 03 3 O-
09 F -P-1
S F-03 Pt r t V! (B p| O
Ph
n . a .
n . a .
n . a .
n . a .
n
n
n
n
33 03 N 03 PI Cu
O Pti
Ph O p( (B 03 P t
Ph F -p( (B
• a .
• a .
• a .
• a .
33 03 N 03 P | Cu
O Ph
S F -3 Cu P h 03 p- 1
p->
n .a .
n . a .
n . a .
n . a .
Cu PO F» F« 01 03 (B ?r 03 co o (D Ph 03
0 (B 01 P t 01
03 3 Cu
2
3
4
5
n o > o o < 3 3 03 01 CU F ' Pt F - F* Pt Pt 01 C F - O* O O F ' Pt 3 P--F ' 01 F -O Pt 3 P h S -
O p< O
Ph •O O 3 Cu
n . a .
n . a .
n . a .
n . a .
-89-

Table 25b: L im i t s c l a s s e s fo r t h e f o r non c e r e a l
of l and
annua medium i n p u t r e q u i
Cfl c H« pr Bl cr H-I-1
H-rr "< n »-> ßi tn CO
1.1
1 .2
1 . 3
3
t-» 3 CU
JO c Bl (-• H" f t vi
Highly s u i t a b l e Modera te ly s u i t a b l e Ma rg ina l l y s u i t a b l e U n s u i t a b l e
> < Bi H« t-> V cr H-I—1
H-rr v$
O Hi
a O H ' CO pr C i l (0
1
2
3
4
t h e g r a d e s o f l and u t i l i z a t i o n type B
1 c r ops rement)
> < ai H ' H* ai cr H-I—1
H-rt v$ O Hl
3 C rf H H-m 3 pr 01
2
3
3
4
!» fB 01 H-co rr Bi 3 O (B
O i-h
IS M O 0) H-O 3
2
3
4
5
qua] Sma
a t i n t e r m e d i a t e CO
o CL H-O H-r t ^ • * * ^
» i—'
!*r BI H-» P -3 H-N SU rr H-O 3
IB ai N 01 H CL
o Hl
Si h-1
PT Bi h-> h1" 3 H-rr
Vi ***•.
2
3
3
4
H . >TJ
a o TS CO l-> CO (B H -
3 cr m H-3 H * rr H-cn pr
vî O Hl
C co (B
O Hi
2
2
3
4
se Bl N » i-t CL
O Hl
t Si rr (B i l i-1
O TO TO H-3 TO
2
2
3
4
i t i e s s e t f o r t h e s u i 11 s c a l e r a l e v e l
> < fll H« h-1
Ol o* K» I-" H-rr
V!
O Hl
Hl O O rr 3* O H» CL
3
4
4
5
i n fed t a b i l i t y
a r a b l e f a rming of management (
Ä H' 3 CL
rs H ai 3 n n> o* V!
<! n> TO fB rr Bi rr H-O 3
n . a .
n . a .
n . a .
n . a .
pa H ' CO ?T O Hl
O < rt> H TO H a> N H-3 TO
n . a .
n . a .
n . a .
n . a .
S > fa < rr ai m H-H h-1
ai a* H-H» H« rr
v j
O Hl
CL
rt H-3 PT H-3 TO
n . a .
n . a .
n . a .
n . a .
i . e . s ai N ai H CL
O Hl
Hi O H fB CO rr Hl H> H (D
n . a .
n . a .
n . a .
n . a .
a t 33 ai N 81 H • CL
O Hl
« H-3 CL Hl ai h-1
H*
n . a .
n . a .
n . a .
n . a .
Ou H-CD m ai 01 (D CO
2
3
4
5
PO H-CD 7** O Hl
T3 (0 CO rr CO
ai 3 CL
Hi
o rt •o o 3 CL
O o 3 co rr H e o rr H» O 3
n .
n .
n .
n .
> < ai H-1—' ai o* H->-» H-rr ^ 0 t-h
O O 3 CL H« PT H-O 3 co
a .
a .
a .
a .
Table 25c: Limits of the grades of land qualities set for the suitability classes for the land utilization type C: Medium scale rainfed arable farming for wheat/barley/oats at intermediate level of management (i.e. at medium input requirement).
w e H ' rr ai er H-h-1
H-rr "^ n (-" ai co co
1.1
1 .2
1 .3
3
tr4
ai 3 CL
O C ai h-1
H-rr
V!
Highly s u i t a b l e Modera te ly s u i t a b l e Ma rg ina l l y s u i t a b l e U n s u i t a b l e
> < Bl H« I-1
?! cr H* r-> H« rr *«: o Hi
a o H-Ol rr C H (B
1
2
3
4
> <! Bl H» i-1
ai <r H-h-> H-rr << O Hl
3 C rr H H ' fB 3 rr co
2
3
4
5
pa (B 01 H-co pr ai 3 n (B
o Hl
fB i-l O CO H ' O 3
2
3
4
5 Note : n . a . = no t a p p l i c a b l e
CO
o CL H-O H-pr •<! *- ai h-1
?r ai H-1
H ' 3 H-N ai rr H-O 3
ES Bl N ai i-t CL
O Hl
ai *-• pr ai H» H-3 H-pr ^ • ^ - ^
2
3
3
4
H' 3
' 3 H» fB
a n> 3 pr 01
^ O CO CO H-er H-t-> H-pr ^ O Hl
C co fB
O Hl
l
l
3
'4
EB Bl N Bl rt CL
o Hl
< ai pr fB rt \-* O TO TO H-3 TO
2
.2
3
4
> < ai p « H1
Bl cr H> h-1
H-pr vs O Hl
Hl O O pr 3 * O H» CL
3
4
4
5
s H-3 CL fB rt Bi 3 0 fB
cr V!
< fB TO fB pr Bl pr H-O 3
n . a .
n . a .
n . a .
n . a .
PO H-CO pr o Hl
O < ro rt TO rt ai N H ' 3 TO
n . a .
n . a .
n . a .
n . a .
« ai pr fB rt
n
n
n
n
> < 01 H ' H» ai cr H> f H-pr "^ O Hl
CL rt H-3 TT H-3 TO
• a .
. a .
. a .
. a .
s ai N ai rt CL
O Ml
H» O rt fft co pr
Hl H-rt fB
n . a .
n . a .
n . a .
n . a .
33 ai N Bl rt CL
o Hl
S! H-3 CL Hl Bl H" 1 — >
n . a .
n . a .
n . a .
n . a .
CL H-01 ro Bl co fB m
2
3
4
5
pa H« co pr
o Hi
T3 fB CO pr 01
Bl 3 CL
Hl O rt
• o o 3 Cu
n o 3 co pr rt e o pr H« O 3
n .
n .
n .
n .
> < Bl H-H» ai O* H-H* H« pr "^ O Hl
n o 3 CL H-pr H-o 3 01
a .
a .
a .
a .
-90-

Table 25d: Limits of the grades of land qualities set for the suitability classes for the land utilization type D: Small scale rainfed arable farming for fruit trees at intermediate level of management (i.e. at medium input requirement).
CO c F ' r t 03 cr F » F * F ' r r
<< O i - " 03 CO CO
1 .1
1 .2
1 . 3
3
f 03 3 a o e co h-1
F -f t
VJ
H i g h l y s u i t a b l e M o d e r a t e l y s u i t a b l e M a r g i n a l l y s u i t a b l e U n s u i t a b l e
> < » F -F 1
CO
cr F ' F * F -r t
" • <
O H i
3 o F -CO rr C " I <T>
1
2
3
4
> < Co F -I - 1
CO er F ' I - 1
F -r t
^ O H i
3 C r t i-l F -fB 3 r t CO
3
4
5
5
PO
m CO F -CO r t 03 3 O rt r t O
fD <1 O CO F ' O 3
2
3
4
5
CO
o CL F -
n F -r t
• ^
^^ 03 F *
?r u i - 1
F -3 F « N 03 r t F -O 3
2
3
3
4
BB co N co H. C L
O i-h
CO i - 1
** co F » F ' 3 F -r t
^ •^s .
H - >-d 3 O
T3 CO F " CD fD F -
3 o* fD F -3 r -r t F -CD r t
v j
0 i-h
C CO fB
O H l
n . a .
n . a .
n . a .
n . a .
BS 03 N co t l CL
O I-h
S Co r t fD F, F-1
O OQ OQ F -3
OQ
2
2
3
4
> < co F ' M co o* F ' I - 1
F -r t
^ O M l
i-h O O rt 3 * O F 1
O .
1
2
3
4
S F -3 O .
ra F .
co 3 O fD
O *
•*< < fB
OQ fB r t
m r t F « O 3
n . a .
n . a .
n . a .
n . a .
Pd F ' CD
** O i-h
O
< fD
n OQ 1 03 N F > 3
OQ
n . a .
n . a .
n . a .
n . a .
€ Co r t fD
«
n .
n .
n .
n .
> < CO F -h-1
03 er F ' F 1
F -r t
<<! O H l
Cu 11 H ' 3 9? H « S
OQ
a .
a .
a .
a .
32 fo N CO H.
a.
o i-h
H l O H fD CD r t
H l F -l-i fD
n . a .
n . a .
n . a .
n . a .
S3 03 N 03 M C L
O H l
s: F -3 CL H l 03 F " I—1
n . a .
n . a .
n . a .
n . a .
CL F -CO fB 03 CO fD
co
2
3
4
5
pa F -CD
?r
o H l
TD fD CO r t CO
s 3 CL
H l > O < <-t 03
F -ra H» O 03
3 er CL H .
F 1
O F -O r t
3 ^ CO r t O l-t H l
C o o r t O F - 3 O CL 3 F -
r t F -O 3 co
n . a .
n . a .
n . a .
n . a .
Table 25e: Limits of the grades of land qualities set for the suitability classes for the land utilization type E: Small scale grazing for cattle and sheep at intermediate level of management (i.e. at medium input requirement).
CO C P -r t CO
cr F -l-> H -rt
^ n H» 03 CO CO
1 .1
1 .2
1 . 3
3
f co 3 CL
O c 03 I - 1
F -r t
V !
H i g h l y s u i t a b l e Mode ra te l y s u i t a b l e M a r g i n a l l y s u i t a b l e U n s u i t a b l e
> < 03 F ' 1—' CO
cr F -H» F -r t
^ O H i
3 o F ' CO r t C i-l fD
1
2
3
4
> < CO F -1—' 03 cr F -I - 1
F -r t
V !
O H i
3 C r t F. F '
rs 3 r t co
3
4
5
5
?3 fD CO F « 02 r t 03 3 O fD
r t O
fD 1 O CO F -O 3
3
4
5
5 N o t e : n . a . = no t a p p l i c a b l e .
CD X O 03 CL N H « 03
n H H - CL r t
^ O • " ^ H l 03 (_i (B K H " co ? r (_1 QJ F - H-1
3 H ' H . 3 N F -03 r t r t * < H - * - » O 3
3
3
4
5
F -3
" 3 I-» fD 3 ro 3 r t co
3
3
4
5
T3 O CO CD H -O * H -H» H « r t
<< O H l
C co fD
O H l
S CD N 03 11 CL
O H l
« 03 r t fD H t - 1
O OQ 3Q H -3
OQ
2
3
4
5
> < 03 F ' F 1
03
o* F -F 1
F ' r t
*<! O H l
H l O
o r t 3 " O F " CL
n . a .
n . a .
n . a .
n . a .
HC F ' 3 CL fD l-t 03 3 n fD
o* ^ < ro
OQ fD r t Co r t F -O S
2
3
4
5
?a F -CO
** O H l
O
< m H
OQ i-i 03 N F -3
OQ
2
3
4
5
s! 03 r t fD i-l
2
3
4
5
> < CO F -F 1
03 O * F -F > F -r t
^ O H l
C L F. F ' 3 ?r F -3
OQ
53 Co N Co F. CL
O H l
H l O F, fD CD r t
H l F > F. fD
n . a .
n . a .
n . a .
n . a .
33 co N CO F. C L
O H l
« F -3 CL H l 03 F 1
F 1
n . a .
n . a .
n . a .
n . a .
CL F ' CD fD 03 CD
n co
2
3
4
5
PÖ F ' CD f C
O H l
• 3 fD CO rt CD
03 3 CL
H l > O < 1-1 03
F -X) F -O 03
3 cr CL F -
F l
r> n» O r t
3 ^ co r t O H H l
C n o r t O F - 3 O CL 3 F -
r t F ' O
3 n.a05.
n . a .
n . a .
n . a .
-91-

Table 25f: Limits of the grades of land qualities set for the suitability classes for land utilization type F: Tree production for firewDod and building poles (i.e. at medium input requirement).
Crt
c F -r t Oi
c F -F » F -r r
^ O F " Bi CO ca
1 .
1 .
1 .
1
2
3
3
t-< oi
s a. o c CU F » F -r t
»<
Highly su i t ab le Moderately s u i t ab l e Marg ina l ly s u i t ab l e Unsui table
a > o < F ' Dl CO F -r t F >
c a> »1 0 * CD F »
I - 1
F -r t
V !
O H i
2
3
4
4
3 C r t »1 F -fö
a r t CO
3
4
5
5
> < 01 F -F " Ol O * F ' F > F -r t
^ O M i
pa m CO F -CO r t 0 i 3 O (D
r t O
CO 11 O CO F > O 3
3
4
5
5
CO
o CL H « O F > r t
•<! *** 01 F " W* 0> t-> F -3 F -N 01
SC 0i N M
n ex o i-h
0>
(-* s*r 01 h-' F -3 F -r t
r t - ^ F > O 3
3
3
4
5
H- i f l
9 o X ) CO F " CO m F -S o* (D F -3 h-" r t H .
co r t
^ O H l
C CO
(0
o H i
n.a .
n .a .
n .a .
n .a .
SB M N 01 M. CL
o H l
« 01 pi
rn n F *
o CTO F « 3
0Q
2
3
4
5
M l O
o r t 3 * O F 1
CL
2
2
3
4
> < 01 F -F 1
?2. a* F -F " F -r t
v j
O M l
n
n
n
33 F -3 CL (0 11 pi 3 o m a* ^ < (T>
CTO rt> r t 0 i r t F > O 3
. a .
a .
a .
n.a .
Pd F -CD W
O M l
O
< tl) M
M H 01 N H » 3
CTO
n .a .
n .a .
n .a .
n .a .
« m r t (D M
n .
n .
n .
n .
> < 01 F ' 1—' 01 o* F ' F 1
F -r t •«S
O H l
CL H F -3
F ' 3
(TO
a .
a .
a .
a .
53 01 N 01 1 CL
O M i
M l O 1 ta co r t
M l F -1
m
2
3
4
5
P3 01 N 01 M CL
O H l
t F -3 CL l-t> 01
F 1
2
3
4
5
CL H« CO
m o> co (D CO
pa F « CO
!>r o H l
T> (D CO r t CO
S 3 CL
2
3
4
4
n o 3 en r t 1 C o r t F -O 3
n 5" H . < O 01 3 F -CO H "
21 M I cr O F -M l->
F -• d r t
o ^ 3 CL O
M l
o o 3 CL F ' 1
n.a
n .a
n .a
n .a
Table 25g: Limits of the grades of land qualities set for the suitability classes for the land utilization type G: Fish ponds for fish production (i.e. at medium input requirement).
CO
c H -r t 0 i r j * F -F * F ' r t
^ n F ' • 01 CO CO
1.1 Hi
f » 3 CL
O c 01 F > F -r t
^!
ghly
a > o < p . 01 CO F -r t F >
C 01 H a* a> F -
i - " F -r t
^ O M l
n . a .
3 > C < r t oi M F -H - F " (D 01 3 er r t F > CO M»
F -r t
^ 0 M l
n.a .
pa (0 co F -CO r t 01 3 O CD
r t O
(D H O CO H « O 3
n.a
CD 53 O 01 CL N H - 01 n H H - CL r t
v < O - ^ H l 01 h-, j a ? r f oi ?r (-> 01 H . h-" 3 H -H - S N H ' 01 r t r t >< H - • » • . O 3
. n .a .
M - ITJ S O
• a en H * co m H -
a o* m n-3 F » r t F -co r t
>< O H l
C CO
fl> O H>
n.a .
SB 01 N 01 11 CL
0 H l
S 01 r t
m H F 1
o (TO CTO F -3
CTO
n .a .
M l
o o r t 3 * O F > CL
n
> < » F -F "
9L cr F ' F * F « r t
• ^
o H l
. a .
se F ' 3 CL ni H 01 3 O (D
O *
"< < m
CTO (D r t 01 r t F « O
n.a3.
po F > CO ! T
O H l
O
< n F,
CTO F, 01 N F -3
CTO
n.a .
s: 01 r t (0 H
n .
> < 01 F ' F »
SL cr F -F 1
F -r t
^ O F l
a H F -3
F -3
ff.
se 01 N 01 H CL
O H l
H l O 1 m CD r t
H l F ' H
ro
n.a .
se 01 N 01 H CL
O H l
S F -3 CL M i 01 F * F »
n .a
CL F -CO
m 01 co (0 co
.
pa F > en ** O M l
X)
m en r t co
01 S CL
n .
o o 3 co r t H C o r t F > O 3
a .
r t > F - < O 01 3 F -CO F 1
SL M l O" O F -I l F "
F --o r t O •-< 3 CL O
M l
O
o 3 CL F -1
2 suitable
1.2 Moderately n.a. n.a. n.a. n.a. n.a. n.a. n.a. n.a. n.a. n.a. n.a. n.a. n.a. 3 suitable
1.3 Marginally suitable
3 Unsuitable n.a
n.a. n.a. n.a. n.a. n.a. n.a. n.a. n.a. n.a. n.a. n.a.
L. n.a. n.a. n.a. n.a. n.a. n.a. n.a. n.a. n.a. n.a.
n.a. n.a. 4
n.a. n.a. 5
Note: n.a. = not applicable
-92-

10. THE CURRENT LAND SUITABILITY
The current land suitability classes based on low and medium land
improvement have been established for a particular land utilization type by
considering the minimum land quality requirements which have been set in
Tables 25a to 25g. By comparing the land qualities of the land mapping units
with the limits that have been set for each land utilization type, the classes
are set. It is the most limiting land quality of the land mapping unit that
has been regarded to determine the land suitability class, taking into
consideration personal judgement as well. Only one limiting land quality has
been considered at a time since the present level of investigation which is at
scale 1:50,000 is less detailed and therefore does not justify subdivision
into many suitability classes. For more detailed investigation two or more
limiting land qualities could be used simultaneously to separate the
suitability classes. With regard to annual crops utilization types, the
moisture availability as a land quality has been considered only down to 100
cm depth of soil while it is considered down to 150 cm depth of soil for tree
crops and other trees. Furthermore, for the arable farming which is to be
practiced at low level of management, only the possibility of the use of hand
implements is taken into consideration. Table 26 gives the current land
suitability for the different land utilization types applicable in the study
area.
-93-

eu
e o
• H 4-1
3
• H >J 4-1
co T H
TJ
0) Si 4-1
u o fa • tu
r H
X> cd 4-1 • H
3 co c => , en • M
CU t -H
J3 cd
1-1 • H
3 co
^ i—i r-1 •
• • O
•• fa
.. Cd
U O
UH
co TJ
c o o.
X! co
i H
fa
1 O 3
TJ 0 u
C 0
v i 4-1
O 3
T )
O U o.
k i
o O . M_I
CU CU
a 01
i—1 cd o co
!-( t—1
eg S en
01 I-I cd o co
c 0 1-1 4-1
i j
O <4H
ff •rH N cd u Ml
co CU CU u 4-1
•o e «
Tl O
s Ol u
• H U-l
T J
c en eu
r H 4 J 4-1
Cil CJ
g 3
• H
CO
CU I—1 0 o.
ff • H
TJ i—1 • H
3 .a
4-1
cd
a eu eu
j = CO
1 eu 8f c CO
e
4-1
3
& • H
g 3
• H
TJ eu S
4-1 C eu S eu ff C çtt E
cd en C CN
•H jjo eu
cj xs 2 co
H eu co eu 3 co eu
• co • a -
C * co • • > co
•-* eu eu
•^ S
-Q eu co £
q-l 4-1 O CS - H CO
•H 3 CO CO 4-1 M C
>* eu
'S
eu eu Cd 4-1
>> U 4J u eu eu •<H T J co
•H S eu • û x i cd I u 4-1 • H N C 3 • eu
—I . « 4_| c eu eu « H J3 i J XI
cd co c eu
3 O
3 S co 3 > > H rH »H X! O M eo
i H BC «4-1
O I
CO - < eu
• u - < co
n m n M l S N C M N C N N C M - H N - ^ C S C M
c i c o n i * i p i c i n f n r i n n i * i i > i r i c < i c n c o
rtN—NrtN-trHrfCN-i'Hrt-HriNNNNnriMro en co en en en en en en en
CM CM - < C M r H C M - * r t _ . e N c \ | C M — H C M r t N f f l N N N N N r l r i n m eo CN • • • • • • • • • • • • • • • • • • • • • • a * • • • •
rM r H ^ —l ,—! i — t — ! • - - _ * , — ( , _ * » — ( — < r H ^ « — < - ^ . - H ^ r - ( , — 4 r H _ i e O C O , — 4 ^ r H ( ^ C l H f O - t H
" TJ P H U J) «
rH « 6 3 4-1 « 3 £• C 6 K u C m
en MH co - H E
N c o c N i c n N c n N N M c n N N N o j N c ^ p o f n c o c o f n c o c o c i en n
en m en en m e n
eu ^ r-H eu eo i n ü n CO Cd
X I
3 O* 4-1 C C
e 3
• H CO CO - H TJ CU 4-1 TJ aj s: co eu
S S o e
eu
S5
c
c o e o c v i e n c M C O c M C N c N e n c o c o e M e N c M e n c o c o e n c o e o c o c o
e n e o — < c o e o e o e n e n e n e o e o
co co
co
co a o id u
CO
e en
eu u eu i—i TJ o eo eu
3 (= C C o c
I eu CO C
3 4J G. C C eu
e n e n e v i e n e M e n e M e M c N e n e n e n e N e s c N e n e n e n e n e n e n e n e n
c o e n c o e n e n e n e n e n e n e n e o e co eo TH E
cd cd u eu
< r H
CO 4J
a 3 O Ou 4-1 P c c
u °-H U CU rH S <u O eo O M
3 rH CO e c c « « cd cd S
e o c o c n c n c n c n c n c n c n c n e n c n c n e o e n e o e n e n e n c n e n c n e n
O c
c n e n e n e n c n e n e n e n c o e n e n
cd * r ^ eu co
Ü * < w
O e en s
• — i e M r - e n O v o O r - . e n o — < - H o _ i i ^ , - « c n v o O œ CM o er a a o v ß i n c N O f f c j N v O
CC M N CC ( n e M N i n O O N - T C M - N CN CN <3" - H - *
v O c i r s \ c e n i P N H C 7 » cj\ o ~H ff- N rt en N CM
|*V r H —4 —H CN r H
M C M c n r i c M c n ^ t n ^ N c o c T i r H
u u b f n ^ . a ^ j s ^
a c x Q . C L O ' e i a c ^ a es. o. CT* »-H rH rH r* ^ — 4 r H r - 4 r H O, —4 N M < 1^ *û I M ffl H ,-4
X i X ï X > X > X i X > X i X > X i X i x i c O e f l e O e O c d e â t O c d e O c o e d e d f a ' C L a . ( ± . P 4 P - B 4 f L C L ( i . û . c L , f t . p . P j 0 4 a . S3 =) J J J J «
- 94 -

11. A PRELIMINARY ASSESSMENT OF THE POSSIBILITY OF IMPROVING THE DRAINAGE OF
THE IMPERFECTLY AND POORLY DRAINED SOILS AND THE POTENTIAL LAND
SUITABILITY
The major land constraint affecting substantial part of the study area is
imperfect soil drainage. Out of the 32,500 ha studied 22,450 ha are affected
in this respect. A preliminary assessment of the possibility of improving the
drainage of the imperfectly and poorly drained soils was therefore made by
carrying out an observational drainage experiment which run from 1976 to 1979.
The experiment was a straight block design comparing the following drainage
treatments: open ditch drain; ripping plus open ditch drain; camberbed plus
open ditch drain; camberbed; ridged camberbed; ridged flat and untreated
(control). The experiment was on solodic Planosol (Abtruptic Tropaqualf, fine
clayey, mixed- montorillonitic/illitic/kaolinitic, isothermic) on slight
slope. The ditch drained, ripped and control plots measured 30 m length and 20
m width while the camberbeds measured 20 m length and 1 0 m width. The ripping
was 60 cm apart and 60 cm deep. The hybrid maize variety 613C and peas
(Greenfeast variety) were the test plants with sampling done in triplicates
from sub-plots measuring 25 sq.m. Table 27 provides the results on percentage
crop establishment and yields as well as the monthly rainfall during the
period. The rain in 1978 was exceptionally wet. After planting on 4th April
there was never a reasonably dry period as it rained daily upto 16th April
with a daily rainfall ranging from 1.3 mm to 50.0 mm (average 12.7 mm). The
germination and establishment of both maize and peas were therefore extremely
poor and the growing of the crop was abandoned during the year.
Ripping plus open ditch drain is the most effective in terms of yield
followed by open ditch drain alone, camberbed plus open ditch drain and
camberbed alone. The ridging appears to worsen the condition of drainage. The
different drainage systems have different influence on the quickness with
which the land surface is dried and the depth to which the water table is
lowered. As can be seen from Table 28, camberbed keeps the water table deepest
followed by ripping plus open ditch drain.
Furthermore, as can be seen from Table 29, the land surface dries fastest
under camberbed followed by ripping plus ditch drain. The ripping considerably
improves the effect of the open ditch drain (see Tables 27 and 30).
-95-

Drainage
Treatment
1976 1977
Maize Maize Feas
1978
Maize Peas
1979
Feas
Table 27: Crop es tabl ishment and y i e lds as well as monthly r a i n f a l l during the dra inage t e s t period 1976 to
1979 i n c l u s i v e .
X CROP ESTABLISHMENT
1976 1977 1979
Maize Maize Maize Peas Peas
Dry Dry Grain Grain Dry
matter y ield y ield yield matter
y ield (kg) (kg) (kg) y ield
(kg) ( k g ) '
Ripping plus 92 97 68 0.21 0.03 26 53.57 51.56 9.12 12.86 0.61
open d i t c h
d r a i n
Open d i t c h 79 99 64 0 .03 0.05 19 42.33 38.07 7.30 7 .63 0.18
d ra in
Camberbed 89 94 62 0.26 0.07 11 22.14 29.81 5.96 9.05 0.37
plus open
d i t ch d r a i n
Camberbed 77 91 68 0.23 0.02 6 15.74 36.04 4.01 6.75 0.17
Ridged cam- nd 97 70 0.19 0.02 9 nd 33.11 3.67 4.09 0.04
berbed
Ridge f l a t nd 85 51 0 0 nd nd 28.23 4.07 1.41 nd
Untreated 62 87 56 0 0 8 9.94 27.50 4.37 2.14 0.02
Note: Ripping (60 cm wide, 60 cm deep) done i n February 1976. Sampled p lot s i z e » 25 sq .m.; * Aerial p a r t including pods and g r a i n s nd • no d a t a .
Table 27 continued RAINFALL (mm) DURING GROWING SEASONS
January February March April May June July August September October November December P lant ing date
1976 19.4 54.3 97.9
164.4 103.9 132.6 71.5 46.8 86.8 26.0
131.1 95.8
8/4/76
1977 181.7 82.4 89.0
495.6 195.2 86.3 76.2
121.2 37.8
183.8 278.4 223.0
5/4/77
1978 116.2 151.2 481.0 343.4 148.8 80.5 39.6 88.3
111.7 175.5 96.8
302.2 4/4/78
1979 163.0 235.1 133.0 269.9 362.2 143.5 62.0 52.0 60.0 30.5 74.0 33.0
22/3/79
- 96 -

Table 28: Depth to water table under various drainage treatment
Drainage treatment Depth (cm) to water table on 6/5/78 12/5/78
Camberbed Camberbed plus open ditch drain Ripping plus open ditch drain Open ditch drain Untreated (control)
38.3 34.5 21.5 5.5 5.0
61.0 55.0 41.7 32.5 29.0
Visual observation on crop growth showed that the effectiveness of the
open ditch drain alone extends to about 13 m (also see Table 3 0). Moreover the
open ditch, on the soil with a subsoil clay pan (Planosol), was obserbed to
the subject to continual collapse and widening. These two factors mean that
the ditch drain can only conveniently be applied to improve the drainage in
the study area if installed in the form of tile drains which empty into major
water courses and also they have to be closely spaced for effectiveness. This
entails very high initial cost which is beyond individual on-farm operation
and requires an overal regional plan. The same remarks may be made with regard
to the ripping which requires the use of crawler tractor and which for
effectiveness must be accompanied by a kind of ditch drain although the
spacing of the latter would be much wider.
The camberbed although not as effective as the ripping plus ditch drain
appears to be easily adaptable to individual on-farm application. The
camberbeds as were constructed of 10 m width for the experiment can easily be
made with a tractor disc plough. The water from the dead furrows however needs
to be emptied into the drainage system already existing in the study area (see
Fig. 7) but which has fallen into dis-service. A major programme of
rehabilitation of this regional network of drains to be used in conjunction
with camberbeds is required.
One problem that was observed with the camberbed was the variation in
yield within the bed. The middle part of the bed had a much better crop yield
than the sides (see Table 30). This may be attributed to the fact that the
water table and soil depth are respectively deeper and thicker in the middle
of the camberbed than at the sides thus providing a more favourable condition
for crop growth. The substantial improvement of yield when camberbed is used
over that of undrained land together with its simplicity of manipulation at
individual farm level however, merits its being considered as a potential
-97-

Table 29: The rate of drying of the land surface under various drainage
treatment determined by penetrometer (readings in pounds per square inch)
DRAINAGE TREATMENT
DAY DITCH DITCH DITCH CAMBERBED
DRAIN DRAIN + DRAIN +
RIPPING CAMBERBED
RIDGED UNTREATED RAINFALL
CAMBERBED CONTROL (mm)
1
2
3
4
5
6
7
8
9
10
11
12
13
14
15
16
17
18
19
20
21
22
Note
-
1.0
0.75
1.0
1.0
0.75
1.0
0.75
1.25
1.0
1.0
1.0
1.25
1.0
1.25
1.50
1.75
1.50
1.75
1.50
1.50
2.50
: Field
-
1.0
1.0
1.0
1.0
1.25
1.25
1.0
1.25
1.0
1.0
1.25
1.5
1.75
1.75
1.50
1.50
1.50
1.75
1.75
2.50
2.50
visual
-
1.0
1.0
1.0
1.0
1.25
1.0
2.0
1.75
2.0
1.0
1.50
2.0
1.75
2.0
1.50
1.75
1.50
2.50
2.50
2.0
2.0
observation
-
1.0
1.25
1.25
1.25
1.25
1.25
1.50
2.25
2.25
1.25
1.50
1.75
2.0
1.75
2.50
2.0
2.50
2.0
2.50
2.50
2.0
indicated
-
1.0
1.0
1.25
1.25
1.25
1.25
1.50
2.0
1.50
1.25
1.50
1.75
1.50
1.50
1.50
1.50
1.50
1.75
2.0
1.75
2.5
that th
-
0.75
0.75
1.25
1.0
1.0
1.0
1.0
1.0
0.75
1.0
1.25
1.0
1.0
1.25
1.50
1.50
1.50
1.75
1.50
1.0
1.50
e surface
27.0
0
30.0
25.0
0
0
0
0
0
14.0
0
0
0
0
8.0
0
0
0
0
3.0
0
0
was fa the penetrometer readings were 1.5 and above. If the figure 1.5 is regarded as indicative of a transition between wet and dry then it can be seen that it took 7 days for the surface soil of the ditch drain plus camberbed plot, camberbed plot and ridged camberbed plot to dry; it took 12 days for the ditch drain plus ripping plot to dry; and it took 15 days for both the ditch drained and control plots to dry. Camberbed therefore seems the most effective in drying the surface soil whereas ripping improves the effect of the open ditch drain.
-98-

Table 30a: Comparison of the effectiveness of the various drainage treatments and the distance from the open ditch drain; the yields from 1977 experiments are grams of peas from sub-plots of 25 sq.m.
Distance from ditch drain
10 m
20 m
30 m
Ditch drain
7625
5926
5223
Ripping plus ditch drain
12,861
11,074
10,793
Camberbed plus ditch drain
9,048
Camberbed
6749
Ridged Camberbed
4088
Untreated control
2138
Ridged control
1410
(b)Comparison of the yields (grams of peas) from the middle and the sides of camberbed. Yields are from sub-plots of 25 sq.m.
Camberbed Camberbed Ridged plus ditch camberbed drain
Side Middle Side
6412 12771 7960
6138 8317 5792
3339 5671 3253
means of improving the drainage in the study area. It is expected that when the camberbed are used the current suitability
of the imperfectly drained soils units UPap to BPp for arable farming (especially for wheat, barley and oats) in the area can be upgraded by a least one class.
-99-

PART 4
RESULTS, CONCLUSIONS AND NECESSARY FOLLOW-UP
12. RESULTS AND CONCLUSION
A number of constraints to the land use in the study area have been
identified. These constraints include low temperature, poor drainage and low
fertility of soils, lack of good marketing for most of the horticultural crops,
and poor on-farm roads. The constraints are briefly discussed below and some of
the means to alleviate them are suggested.
12.1 CONSTRAINT OF CLIMATE
The climatic variables that were found to exert profound influence on the
crop, grass and tree development in the study area are temperature and water
availability.
Temperature and Frost
The mean monthly temperatures in the study area lie between 10 C and 16 C
with a monthly maximum which does not exceed 26°C and a monthly minimum between
2.7 C and 9.4 C. Another feature connected with the temperature is the
occurrence of night frost in most of the months a a result of the cold air which
flows down the study area. The apparently rather cool temperatures and the
incidence of frost no doubt present substantial constraint to the crops and
trees that can be adopted for the Kinangop area. Since it is not physically
possible to alter the field temperature regime by any technological manipulation
the only choice open is to select and breed cool tolerant crops. However, as
seen from Table 5 and section 2.3 a wide range of crop varieties and plant
species which are adaptable to the temperature of the study area are already
available and can be expanded to include others. These adaptable crops
unfortunately exclude the rice which would have otherwise been ideal for the
imperfectly drained soils which are widespread in the study area had a suitable
cool tolerant rice variety been available. Furthermore the growing of crops like
potato, sunflower and maize which are very sensitive to frost will need to be
precisely timed during the frost-free period. This frost-free period was found
to occur only from late March to early June. It is for the reason of this rather
short frost-free period that it will be difficult to grow the currently
-100-

available late maturing maize varieties without the risk of frost damage.
One other effect of frost that is likely to be experienced is on the
quality of grass for grazing by livestock. As revealed by the data in Table 10
the percentage crude protein which is a measure of the nutritive value of grass
is rather low during December when the frost is severest and frequent. The
quantity of milk production and the liveweight of the animals may be expected to
go down during December to February. This calls for supplementary feeding of the
livestock especially the dairy cattle if the milk production is to be maintained
at a high level. It will not be possible to produce any fodder crops during the
period of December to February since it is also a dry period. Therefore the use
of concentrates as a supplementary feed would appear to be the only choice in
the absence of hay and sileage. The economics and logistics of the availability
of concentrates, hay of sileages will dictate which ones can be adapted as a
supplementary cattle feed.
Water Availability
Under rainfed agriculture and forestry, examination of the interaction
between rainfall, soil water storage and évapotranspiration is necessary in the
assessment of water availability to plant. In the absence of irrigation, there
should be ample source of water in the form of rainfall and the soil nust store
enough of it to meet the évapotranspiration requirement of the plant. During the
plant growing period there should ideally not be a period of moisture deficit to
satisfy the évapotranspiration demand. The length of the period when
évapotranspiration is fully met would determine the length of the growing
period.
The study area falls into three rainfall and évapotranspiration regimes as
presented in Table 19. The length of the period when the rainfall fully
satisfies the évapotranspiration demand then depends on the soil moisture
storage capacity as shown in Table 21a to 21c. The higher the soil moisture
storage capacity the more the évapotranspiration is catered for when enough
supply of rainfall is available. The length of the growing period according to
the results of this investigation is expected to be longest for the eastern part
of the study area and shorter for the western part. Thus depending on the water
holding capacity of the soil, the same soil will have a different water
availability potential and therefore a different length of the period it is
capable of supplying adequate water to the plant. For the study area, it was
generally found that a soil with less than 90 mm water storage capacity will
-101-

have the length of the period of moisture sufficiency (i.e. the growing period)
less than three months. A period less than three months would be too short a
growing period for most crops and can be considered unfavourable for arable
agriculture.
The results of the matching of the moisture availability and the length of
the growing period computed for the study area is found in sections of Annex 4.
Against this categorization, the moisture availability status of the soils of
the study area, examined to a depth of 100 cm and 150 cm, where soil depth
allowed, was graded as shown in Table 24. The availability of moisture in the
study area markedly varies. It ranges from very high to moderate for the well
drained soils but ranges from high to low for the imperfectly drained soils. A
large proportion of the latter soils have low availability of moisture largely
because of their shallow depth arising from the presence of the clay pan at
shallow depth. Although the availability of moisture can be improved through
supplementary irrigation, this will need careful study before its feasibility
can be ascertained. It should also be pointed out that the majority of the soils
that have low availability of moisture happen to be the soils which are at
present unsuitable for arable agriculture (see Table 26).
12.2 CONSTRAINT OF SOILS
This semi-detailed soil investigation at scale of 1:50,000 reveals thirty
four soil units over an area of 32,500 ha (see Table 22). These soils falls into
seventeen units according to the FA0/UNESC0 (1974) legend and twenty-six units
according to the United States Soil Survey Staff (197 5) soil families. The major
problems with these soils relate to the drainage, shallow depth due to presence
of clay pan at shallow depth and low soil fertility and pH as presented in Table
23.
Thirteen soil units fall under the category of imperfect drainage to poor
drainage due to an impermeable subsoil clay pan. These soils constitute a
substantial proportion of the study area since they occupy some 22,450 ha of the
studied area of 32,500 ha of seven settlement schemes. The schemes which are
mostly affected by the imperfect to poor drainage are Muruaki, Githioro, Karati
and Tulaga. It is worst in Githioro and Karati because of the undissected and
rather flat topography which occurs in these latter schemes. In section 10 of
this report the possibility of improving the drainage of the imperfectly drained
and poorly drained soils have been examined on a preliminary basis. It is
possible under the conditions of the study area to effect the improvement of the
-102-

drainage through a well planned system of camberbeds. This will however, require
an overall drainage plan whereby the camberbeds can empty into well laid shallow
fields drain which can in turn drain into natural drainage channels. During the
demarcation of settlement plots in the study area some of the drains were laid
down but these have now become unserviceable and need to be rehabilitated.
With regard to the shallow depths, it is found that this is due to the
presence of a compact and impermeable subsoil layer which may occur from 40 cm
but generally occurs within 75 cm. The preliminary experiment reported in
section 11 reveals that the compact layer can be broken by ripping but this
requires the use of crawler tractor which may not be easily available. These
soils with a clay pan may best be utilized for grazing or tree production for
building poles and firewood or pond construction for fish production. Section
2.3 shows some of the trees species which were found to be performing well and
which among others can be developed on these soils with a clay pan.
The low soil fertility is widespread and this involved mainly phosphorus,
nitrogen and the pH (see Table 23 and annex 3). The soil nutrient status must be
improved if satisfactory crop yields are to be obtained. Data from agronomic
experiments are meagre for the area and more agronomic trials will have to be
carried out in order that judicious and beneficial fertilizer recommendation can
be made.
In section 7.1 the seven land use alternatives identified for the study
area are presented. Table 26 further gives the present physical suitability of
the soil units for each of the seven land utilization types. It is evident that
the physical soil suitability varies with the kind of use to which the land is
to be put. This no doubt re-emphasizes one of the main principles of land
evaluation which stipulated that the assessment of land suitability only makes
sense when related to a specified land use. No doubt the same tract of land may
have the same suitability for various land utilization types. The use to which
the land is put then will depend on the contemporary socio-economic conditions.
Such a socio-economic analysis of the land suitability is outside the scope of
the present investigation although could easily be undertaken as a follow-up
project to the present study.
The 'physical suitability of land can potentially be improved when a major
operation is carried out to improve the land. In the study area such a major
operation will involve the improvement of drainage of the imperfectly drained
and poorly drained soils. When the drainage of these soils is improved it is
expected that suitability for the reported uses other than that for pond
-103-

construction can be upgraded by at least one class. The area requiring drainage
constitutes a very large proportion of the area of the seven schemes covered by
the study. It would therefore seem to merit the formulation of a drainage
project if the farmers occupying these imperfectly and poorly drained soils are
to be assisted to improve the productivity of their land and the farm income.
12.3 CONSTRAINT OF THE MARKET FOR THE PRODUCE
As explained in section 1.2.4, there is no proper arrangement for the
marketing of most of the horticultural crops but organized marketing exists for
milk, wool, carrots, green peas, wheat, barley, maize and pyrethrum. The milk,
pyrethrum and wool are respectively sold to the Kenya Co-operative Creameries,
the Pyrethrum Board and the Kenya Farmers Association through collection centres
organized by the Farmers Co-operative Union. Maize and wheat are sold to be
National Cereals and Produce Board through individual farmers arrangement while
barley is similarly sold to be Kenya Breweries. The Pan African Foods Ltd. buys
carrots and green peas through the Farmers Co-operative Union. For these, the
company provides organized transporation from the farms.
For the rest of the crops which are mainly horticultural crops the
marketing arrangement is quite unsatisfactory. Many farmers have neither the
means to transport the crops nor the storage facilities. They therefore strive
to sell their surplus produce as soon as they obtain it. This is done through
the middlemen who are usually in a stronger bargaining position and therefore
tend to control the prices. The operation of the Kinangop Farmers Co-operative
Union therefore needs to be strengthened to incorporate the marketing of a wide
range of produce especially the horticultural crops. In this endavour,
assistance to the farmers by the Ministry of Co-operative Development and
Horticultural Development Authority is very much required. Such assistance will
involve the streamlining of the operation of the Kinangop Co-operative Societies
to instil greater efficiency and effectiveness as well as the improvement of
collection, storage and transporation facilities. Feasibility for exporting
crops to potential markets outside Kenya could also be explored by the
Horticultural Development Authority and the Kenya External Trade Authority to
provide a larger market outlet for the horticultural crops.
12.4 CONSTRAINT OF ON-FARM ROADS
Information on the on-farm road situation is provided in section 1.2.3.
Some of the roads in the study area are now in very bad shape. The poor roads
are those classified as settlement access roads and are therefore those which do
-104-

not fall under the Ministry of Transport's classified roads. These settlement
access roads are however very important since they provide the main accessiblity
for the farmers and without being accessible during all seasons the farmers
operations would greatly be handicaped. A programme for the rehabilitation on
on-farm roads to all weather standard needs to be mounted as a priority and
adequate arrangements made for their maintenace thereafter. This exercise may be
carried out as part of a comphensive programme to revitilize the agricultural
production of Kinangop area.
12.5 CONSTRAINT OF IMPERFECT DRAINAGE
The present investigation at semi-detailed scale of 1:50,000 reveals that
imperfect drainage affects a large part of the study area. Imperfect drainage
affects soil units UPap to BPp (see the soil map - Fig. 7A). Some 22,450 ha are
involved out of the 32,500 ha covered in this study. The less dissected and
rather flat parts of the study area (see Fig. 7) are the worst affected by
imperfect drainage. This large area of imperfectly drained land is usually
virtually waterlogged during the six months of rainy season and it not even
ideal for grazing during this period. Moreover the area of imperfectly drained
soils carries nutritionally rather poor grass as shown in section 2.2.
Preliminary drainage experiments which is reported in section 11 of this
report indicates that it is possible to effect substantial improvement of the
drainage of the imperfectly drained soils by use of camberbeds. Such drainage
improvement will however require an overall drainage plan which lies beyond the
efforts of individual formers. At the time of the demarcation of the settlement
plots, ditch drains were laid to take care of flooding but these also now
require rehabilitation.
In order to effect drainage improvement more detailed physical
investigations that will be necessary are the following:
- detailed soil survey on scale 1:10,000
- study of the surface hydrology.
Contour maps on scale 1:50,000 (vertical interval 20 meter) and scale 1:10,000
(vertical interval 10 ft i.e. 3 meter) already exist at the Survey of Kenya but
could also be improved for the rather flat part of the study area.
When the drainage of the 22,450 ha of imperfectly drained soils is
improved, it sould be possible to grown on these soils at least fodder crops
like fodder-beet, oats, kale and mangold for the livestock to improve the
presently rather low milk yields of 1,200 to 1,500 kg. per cow per year.
-105-

13. NECESSARY FOLLOW-UP
13.1 Poor drainage is extensively encounterd in the study area and is the
main problem affecting land use. Arising out of the preliminary test on
drainage reported here, possibilities for improving the drainage through
camberbeds appear to exist but the improvements has to be approached on a
regional basis. A comprehensive field programme for the improvement of the
surface drainage and storage of the water is needed.
13.2 Due to the present low yields of the many farm products, benefits can be
attained from improved husbandry techniques. Soil fertility needs to be
maintained and increased. This cannot be done to appreciable level without an
increasing use of fertilizers. Husbandry investigations are also required for
intensive land use. It is especially essential to investigate appropriate
cultuvation and husbandry techniques for crops and livestock and to prepare
advisory materials for use by the field extension workers. The economics and
feasibility of the use of concentrates, hay and sileages as a supplementary
feed for especially the dairy cattle during the dry season needs to be
studied.
13.3 Advisory service to farmers needs to be intensified so that the farmers
can be better equiped on the technical and economic know-how of farming. For
this purpose it will be necessary to design a problem oriented extension work
aimed at specified development objectives and targets for the area. As a
prerequisite to this it will be essential to carry out a detailed farm survey
to identify the major socio/economic constraints of the development of the
farms and analyse the economic viability of the different farm enterprises.
13.4 The marketing arrangement for the majority of the horticultural crops is
poor. Many farmers have not got either the means to transport the crops or
facilities for storage. There will be need to institute a programme to
strenghten the operations of the Kinangop Co-operative Societies by improving
the collection, storage and transportation facilities for the produce. A
feasibility study on the possibility to establish expanded markerts for
horticultural crops outside Kenya may also be carried out with advantage.
Furthermore, investigation to improve on-farm storage of horticultural produce
like potatoes, even if only to improve the storage of produce for domestic
-106-

consumption, is required.
13.5 The on-fann roads are in poor condition. This greatly hampers
accessibility and theregore the effectiveness of the farming in the study
area. There is need for a project to rehabilitate the on-farm roads to all-
weather standard and also to make suitable arrangement for their maintenance
thereafter.
13.6 The results of the present study show that the study area has a large
potential for both livestock and crop production. But for this to be attained
there is need to undertake among others, the measures outlined above. It is
possible to mount for the area a comprehensive agricultural development
project which incorporates sub-programmes on all of above mentioned problems.
The formulation of such a comprehensive project will no-doubt be greatly
facilitated by the information from the present study.
-107-

REFERENCES
Abrahams, P.D., 1979. Kenya's land re-settlement story, 1st Ed., Challenge
publishers and Distributors, Nairobi.
Acland, J.D. , 1971. East African Crops. Longman, London 252 pp.
Bailey, L.H., 1958. Manual of cultivated plants. The MacMillan Company, New
York.
Beek, K.J., 1978. Land evaluation for Agricultural Development. International
Institute for Land Reclamation and Improvement (ILRI), Wageningen, The
Netherlands, 333 pp.
Beek, K.J. and Bennema, J., 1972. Land evaluation for Agricultural Land Use
Planning. An Ecological methodology. Agricultural University, Wageningen,
The Netherlands, 70 pp.
Braun, H.M.H.. Calculated data on Eo and Average Annual Temperature for all
Met. Stations in Kenya. Also Monthly rainfall means and calculated r/Eo.
Kenya Soil Survey, Nairobi, Kenya.
Brinkman, R. and Smyth, A.J. (ed.), 1973. Land Evaluation for Rural Purposes.
Summary of an expert consultation, The Netherlands, 6-12 October 1972.
Publication 17, International Institute for Land Reclamation and
Improvement (ILRI), Wageningen, The Netherlands, 119 pp.
Brown, L.H., 1963. A National Cash Crops Policy for Kenya. Government Printer,
Nairobi, Kenya.
Dagg, M., 1965. A rational approach to the selection of crops for area of
marginal rainfall in East Africa. E. Afr. For. J.30, 296 pp.
DANIDA, 1977. Horticultural Development, Kinangop Plateau, Kenya. Danish
International Development Agency Appraisal Mission Report. Department of
Settlement, Nairobi, Kenya.
Debele, B., 1980. The Physical Criteria and their rating proposed for land
evaluation in the highland regions of Ethiopia. Paper presented at the
meeting of the Easter African Sub-Committee for Soil Correlation and Land
Evaluation, Arusha, Tanzania 29 Oct.-4 Nov. 1980, FAO, Rome.
Department of Agriculture, South Kinangop 1981 Annual Report, Nairobi, Kenya.
Department of Settlement, 1976, Annual Report, Nairobi, Kenya.
Department of Settlement, Kinangop Complex, 1976. Annual Report, Nairobi,
Kenya.
-108-
Duckham, A.N. and Masefield, G.B., 1970. Fanning system of the world. Chatto
and Windus, London, 542 pp.
East African Meterological Department, 1970. Temperature data for stations
in East Africa, Part 1, Kenya. E.A. Community, Nairobi, Kenya.
East African Meterological Department, 1974. Summary of rainfall in Kenya
for the year 1972. E.A. Community, Nairobi, Kenya.
East African Meterological Department, 1975. Climatological statistics for
East Africa, Part 1, Kenya. E.A. Community, Nairobi, Kenya.
Economic and Statistical Division, 1961. Agricultural Census 1961. Government
Printers, Nairobi. Kenya.
FAO, 1972. Background document. Expert consultation on Land Evaluation for
Rural Purpose. AGL: LERP 72/1, oct. 1972, FAO, Rome, 110 pp.
FAO, 1973. A Framework for land evaluation. Draft edition, AGL/MISC/73/14,
FAO, Rome, 65 pp.
FAO,' 1974. Approaches to land evaluation. Soils Bulletin 22, FAO, Rome, 120
pp.
FAO, 1975. Report on the ad-hoc Expert Consultation on Land Evaluation, Rome
Italy, 6 - 8 Jan. 1975. World Soil Resources Report 45, FAO, Rome, 152 pp.
FAO, 1976. A framework for land evaluation. Soils Bulletin 32, FAO, Rome,
72 pp.
FAO, (Doorenbos, J. and Pruitt, W.D.), 1977. Crop Water requirements.
Irrigation and Drainage Paper No. 24 (revised) Rome.
FAO, 1978. Reports of Agro-Ecological Zones Project, World Soil Resources
Report No. 48, Rome.
FAO, (Doorenbos, J. and Kassam, A.H.) 1979. Yield response to water.
Irrigation and Drainage Paper No. 33. Rome.
Soil Survey Guidelines for Soil description, FAO, Rome.
FAO/UNESCO, 1974. Soil Map of the world, vol. 1 legend. UNESCOm Paris.
Gethin-Jones, G.H. and Scott, E.M., 1958. The Soils of Kenya. The Kenya Atlas,
Goverment printer, Nairobi, Kenya.
Jaetzold, R., 1976. Climatic situation of the Kinangop Area. Internal
publication of the Department of Settlement, Ministry of Lands and
Settlement, Nairobi, Kenya.
Janick, J., Schery, R.W., Woods, F.W. and Rattan, V.W., 1974. Plant Science:
An Introduction to World Crops. 2nd Ed. H.W. Freeman and company, San
Francisco.
-109-

MsCulloch, J.S.G., 1965. Tables for the rapid computation of the Penman
estimate of evaporation. E. Afr. Agric. for J. Vol. XXX, No. 3, p. 266.
Odingo, R.S.. The Kenya Highlands - Land Use and Agricultural development.
E.A. Publishing House, Nairobi, Kenya.
Okigbo, B.N., 1978. Cropping Systems and related research in Africa.
Occasional Publications Series - OT 1. Association for the Advancement
of Agricultural Science in Africa, Addis Abada, Ethopia. 81 pp.
Penman, H.L., 1956. Evaporation - An Introductory Survey. Neth. J. Agri.
Sei. 4_.
Purseglove, J.W., 1974. Tropical Crops: Dicotyledons 3rd Edition. Longman,
London, 719 pp.
Purseglove, J.W., 1975. Tropical Crops: Monocotyledons 2nd Edition. Longman,
London, 607 pp.
Rachilo, J.R., 1978. Soil Conditions in the Kinangop area - A Preliminary
investigation. Site Evaluation Report No. 34, Kenya Soil Survey, Nairobi,
Kenya.
Ruthenberg, H., 1976 (2nd ed.). Farming systems in the tropics, Oxford
Clarendon Press, 366 pp.
Shackleton, R.M., 1975. Geology of the Nyeri Area. Report No. 12, Government
Printer, Nairobi, Kenya.
Shah, M.M., 1978. Calorie Demand Projections Incorporating Urbanization and
Income Distribution. Food and Agricultural Programme, International
Institute for Applied Systems Analysis.
Siderius, W. and Van der Pouw, B.J.A., 1980. The application of the FAO/
UNESCO terminology of the soil map of the world legend for soil
classification in Kenya. Miscellaneous Soil Paper M15, Kenya Soil Survey,
Nairobi, Kenya.
Soil Survey Staff, 1951. Soil Survey Manual United States Dept. of Agriculture
handbook No. 18. Government Printer, U.S.A..
Soil Survey Staff, 1975. Soil Taxonomy. A basic System of Soil Classification
for making and interpreting Soil surveys. Agric. Handbook No. 436. Soil
Conservation Service. United States Dept. of Agric.
South Kinangop Divisional Agricultural Office, 1964-1975. Annual Reports,
Kinangop, Kenya.
Thompson, A.O., 1964. Geology of the Kijabe Area. Report No. 67 Government
Printer, Nairobi, Kenya.
-110-

Thompson, A.O. and Dodson, R.G., 1963. Geology of the Naivasha Area. Report
No. 55 Government Printer, Nairobi, Kenya.
Usher, G., 1974. A dictionary of plants used by man. Constable, London.
Van de Weg, R.F. and Braun, H.M.H., 1977. Proposals for rating of Land
Qualities. KSS Internal Communication No. 7, Kenya Soil Survey memio-
graphed report, Nairobi, Kenya.
Van de Weg, R.F. and Mbuvi, J.P. , 1975. Soils of the Kindaruma area
Reconnaissance Soil Survey Report no. Rl. Government Printer, Nairobi,
Kenya.
Woodhead, T., 1968. Studies of Potential Evaporation in Kenya. EAAFRO,
Nairobi, Kenya.
-Ill-

ANNEX 1. Land occupied between 1964 and 1975 by various crops during the long rain season in seven Kinangop Settlement Schemes
Table 3a. Area (hectares) under various crops in South Kinangop Scheme (6033ha) during long rains of 1964 to 1975
Year
1964
1965
1966
1967
1968
1969
1970
1971
1972
1973
1974
1975
Pyrethrum
418.0
392.4
489.6
526.3
530.4
529.2
2009.0
1381.0
1404.0
1404.0
1123.0
1123.0
Potato
342.5
272.8
59.2
95.9
51.6
40.8
270.0
229.0
48.0
368.0
388.0
309.0
Cabbage
0.0
0.0
56.7
55.0
142.1
10.1
280.0
96.0
85.0
693.0
439.0
319.0
Carrot
0.0
0.0
0.0
0.0
0.0
6.4
57.0
71.0
47.0
366.0
707.0
268.0
Onion
0.0
0.0
0.0
0.0
0.0
0.0
19.0
36.0
21.0
149.0
179.0
179.0
Peas
166.0
26.8
30.0
35.1
19.5
10.0
96.0
127.0
27.0
252.0
313.0
179.0
Leek
0.0
0.0
0.0
0.0
0.0
0.0
250.0
87.5
0.5
14.0
8.5
61.0
Maize
434.0
38.0
42.0
32.1
4.3
16.4
156.0
129.0
28.0
246.0
246.0
150.0
Wheat
0.1
0.0
0.0
0.0
0.0
6.8
12.S
0.0
0.0
0.0
0.0
0.0
Kale
0.0
0.0
0.0
0.0
0.0
2.0
25.0
10.0
11.0
32.0
75.0
88.0
Oat
0.0
0.0
0.0
0.0
0.0
11.0
21.0
29.0
38.0
254.0
361.0
181.0
Fodder Beetroot
0.0
0.0
14.4
16.0
21.5
0.6
8.0
1.0
4.0
24.0
42.0
32.0
Mangold
0.0
0.0
0.0
0.0
0.0
0.0
11.0
20.0
5.0
10.0
26.0
18.0
Bean
4.6
0.0
0.0
0.0
0.0
0.0
0.0
0.0
0.0
0.0
0.0
0.0
Cauliflower
0.0
0.0
0.0
0.0
0.0
1.0
20.0
0.0
0.0
0.0
0.0
0.0
Total
1,365.2
73o;o
691.9
760.4
769.4
624.3
3,234.5
2,216.5
1,718.5
3,812.0
3,907.5
2,907.0
Table 3b. Area (hectares) under various crops in Bamboo Scheme (1510ha) during long rains of 1964 to*1975
Year
1964
1965
1966
1967
1968
1969
1970
1971
1972
1973
1974
1975
Pyrethrum
132.0
222.4
267.2
419.2
380.0
560.0
764.0
694.0
570.0
460.6
370.0
383.0
Potato
191.5
114.8
128.8
221.9
253.6
288.0
500.0
50O.0
100.0
365.0
32.0
34.0
Cabba
ge
0.0
0.0
272.0
416.4
390.8
28.0
475.0
490.0
89.0
69.0
36.0
45.0
Carrot
0.0
0.0
0.0
0.0
0.0
84.0
150.0
86.0
28.0
19.0
8.0
23.0
Onion
0.0
0.0
0.0
0.0
0.0
0.0
5.8
2.5
20.0
0.5
1.0
1.0
Peas
26.9
27.6
41.6
121.8
164.8
84.0
212.0
109.0
86.0
28.0
10.0
15.0
Leek
0.0
0.0
0.0
0.0
0.0
0.0
30.0
60.0
5.0
30.0
30.0
4.0
Maize
50.7
28.0
52.0
102.0
102.0
0.0
220.0
100.0
48.0
19.0
12.0
14.0
Wheat
4.6
1.0
0.0
0.8
0.0
74.0
0.0
0.0
0.0
0.0
0.0
0.0
Kale
0.0
0.0
0.0
0.0
0.0
12.0
185.0
189.0
58.0
59.0
30.0
39.0
Oat
0.0
0.0
0.8
0.8
0.0
3.2
9.0
8.0
10.0
20.0
12.0
15.0
Fodder Beetroot
0.0
0.0
9.0
175.6
173.4
20.0
247.0
18.0
5.0
5.0
2.0
14.0
Mangold
0.0
0.0
0.0
0.0
0.0
16.0
14.0
14.0
5.0
5.0
4.0
6.0
Bean
0.8
0.0
0.0
0.0
0.0
0.0
0.0
0.0
0.0
0.0
0.0
0.0
Cauliflower
0.0
0.0
0.0
0.0
0.0
0.8
43.0
30.0
0.0
0.0
0.0
0.0
Total
406.5
393.8
771.4
1,458.5
1,464.6
1,170.0
--
1,024.0
1,080.1
547.0
583.0
-112-

Table 3c. Area (hectares) under various crops in Karati Scheme (5863ha) during long rains af 1964 to 1975
Year
1964
1965
1966
1967
1968
1969
1970
1971
1972
1973
1974
1975
Pyreth-rum
160.0
188.8
36O.0
620.00
632.0
302.0
306.3
700.0
365.0
378.0
410.0
360.0
Potato
74.4
139.2
100.0
100.0
140.0
112.0
18O.0
600.0
100.0
370.0
65.0
55.0
Cabbage
0.0
0.0
27.6
155.6
64.0
40.0
80.0
500.0
65.0
75.0
55.0
65.0
Carrot
0.0
0.0
0.0
0.0
0.0
16.0
8.0
270.0
2.0
1.5
3.0
2.0
Onion
0.0
0.0
0.0
0.0
0.0
0.0
1.0
0.0
23.0
0.0
0.0
0.0
Peas
31.6
42.0
40.0
104.0
153.6
72.0
160.0
140.0
40.0
35.0
25.0
45.0
Leek
0.0
0.0
0.0
0.0
0.0
0.0
1.0
17.5
16.0
0.0
0.3
O.O
Maize
44.8
37.6
36.0
44.0
36.0
0.0
95.0
97.0
70.0
90.0
85.0
127.0
Wheat
0.0
0.0
0.0
0.0
124.4
116.4
291.0
0.0
54.0
20.0
30.0
20.0
Kale
0.0
0.0
0.0
0.0
0.0
20.0
50.0
125.0
40.0
25.0
12.0
12.0
Oat
0.0
0.0
0.0
0.0
0.0
0.8
8.0
100.0
70.0
55.0
40.0
80.0
Fodder Beetroot
0.0
0.0
14.6
16.8
33.2
20.0
4.0
0.0
2.0
5.0
8.0
4.0
Mangold
0.0
0.0
0.0
0.0
0.0
0.0
2.5
37.0
10.0
13.0
12.0
6.0
Bean
0.0
0.0
0.0
0.0
0.0
0.0
0.0
0.0
0.0
0.0
0.0
0.0
Cauli- Total flower
0.0
0.0
0.0
0.0
0.0
0.2
0.0
2.0
0.0
0.0
0.0
0.0
310.8
407.6
578.2
1,040.4
1,183.2
699.4
1,186.8
2,588.5
857.0
1,067.5
745.3
776.0
Table 3d. Area (hectares) under various crops in Njabini Scheme (5301ha) during long rains of 1964 to 1975
Year
1964
1965
1966
1967
1968
1969
1970
1971
1972
1973
1974
1975
Pyrethrum
236.8
389.2
441.6
514.0
556.4
560.0
1700.0
700.0
955.0
955.0
955.0
791.0
Potato
136.0
157.2
157.2
200.0
123.6
288.0
1000.0
600.0
640.0
320.0
814.0
546.0
Cabbage
0.0
0.0
40.0
39.8
87.0
28.0
250.0
500.0
320.0
145.0
395.0
721.0
Carrot
0.0
0.0
0.0
0.0
0.0
84.0
250.0
270.0
36.0
65.0
170.0
66.5
Onion
0.0
0.0
0.0
0.0
0.0
0.0
0.0
0.0
0.0
16.0
0.25
1.0
Peas
47.5
88.0
90.8
10S.6
53.2
84.0
220.0
140.0
150.0
13O.0
250.0
131.0
Leek
0.0
0.0
0.0
0.0
0.0
0.0
17.5
17.5
0.0
0.0
150.0
53.5
Maize
61.5
44.8
51.6
38.8
0.0
0.0
60.0
97.0
90.0
95.0
250.0
122.0
Wheat
2.8
0.0
0.0
0.0
74.0
74.0
56.0
0.0
0.0
0.0
0.0
0.0
Kale
0.0
0.0
0.0
0.0
0.0
12.0
40.0
125.0
75.0
75.0
210.0
51.0
Oat
2.8
0.0
0.0
0.0
0.0
3.2
8.0
100.0
180.0
130.0
460.0
95.0
Fodder Beetroot
0.0
0.0
0.0
0.0
36.6
20.0
25.0
0.0
32.0
42.0
60.0
51.0
Mangold
0.0
0.0
0.0
0.0
0.0
16.0
35.0
37.0
32.0
64.5
166.0
19.0
Bean
2.8
0.0
0.0
0.0
0.0
0.0
0.0
0.0
0.0
0.0
0.0
0.0
Cauli- Total flower
0.0
0.0
0.0
0.0
0.0
0.8
90.0
2.0
0.0
0.0
0.0
0.0
490.2
679.2
781.2
898.2
930.8
1,170.0
3,751.5
2,588.5
2,510.0
2,037.5
3,880.3
2,648.0
•113-

Table 3e. Area (hectares) under various crops In Githioro Scheme (3641ha) during long rains of 1964 to 1975
Year
1964
1965
1966
1967
1968
1969
1970
1971
1972
1973
1974
1975
Pyre thrum
0.0
0.0
0.0
0.0
0.0
9.2
16.5
59.0
72.0
72.0
65.0
65.0
Potato
0.0
0.0
0.0
0.0
0.0
20.0
1.0
20.0
65.0
66.0
12.5
10.0
Cabbage
0.0
0.0
0.0
0.0
0.0
0.0
0.0
15.0
20.0
9.0
20.0
8.0
Carrot
0.0
0.0
0.0
0.0
0.0
20.0
0.0
0.0
0.0
3.0
0.3
0.3
Onion
0.0
0.0
0.0
0.0
0.0
0.0
0.0
0.0
0.0
0.0
0.0
0.0
Peas
0.0
0.0
0.0
0.0
0.0
0.0
0.0
5.0
16.0
5.0
4.0
5.0
Leek
0.0
0.0
0.0
0.0
0.0
0.0
0.0
0.0
0.0
0.0
7.0
7.0
Maize
0.0
0.0
0.0
0.0
0.0
0.0
3.0
3.0
0.0
2.5
2.5
2.5
Wheat
0.0
0.0
0.0
0.0
0.0
0.0
0.0
0.0
0.0
0.0 *100.0
150.0 150.0
Kale
0.0
0.0
0.0
0.0
0.0
1.0
l.O
0.3
2.0
0.0
5.0
0.0
Oat
0.0
0.0
0.0
0.0
0.0
0.8
19.5
18.5
12.0
16.0
7.0
2.5
Fodder Beetroot
0.0
0.0
0.0
0.0
0.0
3.0
1.0
0.0
0.0
0.0
0.3
0.0
Mangold
0.0
0.0
0.0
0.0
0.0
0.0
0.0
1.0
2.0
0.0
4.5
4.5
Bean
0.0
0.0
0.0
0.0
0.0
0.0
0.0
0.0
0.0
0.0
0.0
0.0
Cauliflower
0.0
0.0
0.0
0.0
0.0
0.0
0.0
0.0
0.0
0.0
0.0
0.0
Total
0.0
0.0
0.0
0.0
0.0 '
54.0
42.0
121.8
189.0
273.5
278.1
245.8
Barley
Table 3f. Area (hectares) under various crops in Muruaki Scheme (6832ha) during long rains of 1964 to 1975
ïear
1964
1965
1966
1967
1968
1969
1970
1971
1972
1973
1974
1975
Pyrethrum
74.0
192.8
406.0
628.8
718.4
306.0
1048.0
529.0
612.0
632.0
625.0
625.0
Potato
336.4
144.0
220.0
140.0
301.6
48.0
200.0
150.0
100.0
632.0
80.0
75.0
Cabba
ge
0.0
0.0
15.2
30.4
8.0
4.0
220.0
120.0
50.0
20.0
40.0
60.0
Carrot
0.0
0.0
0.0
0.0
0.0
8.0
15.0
25.0
15.0
65.0
45.0
45.0
Onion
0.0
0.0
0.0
0.0
0.0
0.0
1.5
0.0
65.0
0.0
0.0
7.0
Peas
269.2
104.0
50.0
64.0
98.0
16.0
70.0
22.0
41.0
35.0
40.0
40.0
Leek
0.0
0.0
0.0
0.0
0.0
0.0
25.0
25.0
15.0
15.0
20.0
20.0
Maize
178.4
80.0
82.0
46.0
0.0
0.0
15.0
0.0
105.0
0.0
40.0
0.0
Wheat
0.0
0.0
20.0
12.3
174.0
259.0
1270.0
121.0
976.0
56.0
79.0
173.0
Kale
0.0
0.0
0.0
0.0
0.0
8.0
85.0
108.0
109.0
22.0
55.0
80.0
Oat
0.0
0.0
0.0
0.0
0.0
3.0
54.0
18.0
5O.0
33.0
63.0
130.0
Fodder Beetroot
0.0
0.0
10.4
32.6
18.8
12.0
42.0
42.0
32.0
6.0
27.0
75.0
Mangold
0.0
0.0
0.0
0.0
0.0
0.0
30.0
30.0
41.0
11.0
30.0
75.0
Bean
3.6
0.0
0.0
O.O
0.0
0.0
0.0
0.0
0.0
0.0
0.0
0.0
Cauli- Total flower
0.0
0.0
0.0
0.0
0.0
0.0
30.0
0.0
0.0
0.0
0.0
0.0
861.6
520.8
803.6
954.1
1,318.8
664.0
3,105.5
1,190.0
2,211.0
2,037.0
1,144.0
1,405.0
•114-

Table 3g. Area (hectares) under various crops in Tulaga Scheme (4733ha) during long rains of 1964 to 1975
Year
1964
1965
1966
1967
1968
1969
1970
1971
1972
1973
1974
1975
Pyrethrum
119.8
255.4
391.2
514.0
514.0
484.8
490.0
490.0
427.0
645.0
525.0
560.0
Potato
130.4
144.4
216.0
232.0
212.8
223.2
520.0
590.0
410.0
599.0
220.0
450.0
Cabbage
0.0
0.0
15.6
34.0
49.9
6.4
52.0
170.0
200.0
38.0
150.0
300.0
Carrot
0.0
0.0
0.0
0.0
0.0
14.0
48.0
48.0
45.0
62.0
370.0
500.0
Onion
0.0
0.0
0.0
0.0
0.0
0.0
2.0
7.0
4.0
3.0
2.0
1.0
Peas
108.8
75,6
132.0
48.0
114.4
22.0
59.0
90.0
90.0
40.0
60.0
175.0
Leek
0.0
0.0
0.0
0.0
0.0
0.0
0.0
1.0
17.0
30.0
30.0
30.0
Maize
62.5
105.6
152.0
31.2
56.0
0.0
250.0
169.0
12.0
30.0
40.0
100.0
Wheat
0.0
0.0
0.0
O.O
178.0
139.2
140.8
46.0
60.0
40.0
16.0
30.0
Kale
0.0
0.0
0.0
0.0
0.0
4.4
14.0
14.0
16.0
24.0
30.0
45.0
Oat
0.0
0.0
0.0
0.0
0.0
9.2
25.0
27.0
30.0
200.0
300.0
240.0
Fodder Beetroot
0.0
0.0
13.0
21.6
33.2
8.0
6.5
2.0
8.0
30.0
11.0
56.0
Mangold
0.0
0.0
0.0
0.0
0.0
0.0
5.0
39.0
55.0
55.0
40.0
40.0
Bean
2.0
0.0
0.0
0.0
0.0
0.0
0.0
0.0
0.0
0.0
0.0
0.0
Cauliflower
0.0
0.0
0.0
0.0
0.0
1.0
1.5
0.0
0.0
0.0
0.0
0.0
Total
1,503.5
581.0
919.8
880.8
1,158.3-
912.2
1,613.8
1,693.0
1,374.0
1,796.0
1,794.0
2,527.0
-115-

ANNEX 2. Livestock numbers during 1967 to 1975 and the stocking rates in seven Kinangop Settlement Schemes
Table 8a. S. Kinangop Scheme; Area 6033ha
Yearly stocking rate at the period when the highest number of dairy cows were available
Year
1967
1968
1969
1970
1971
1972
1973
1974
1975
No
LU
No
LU
Mo
LU
No
LU
No
LU
No
LU
No
LU
No
LU
No
LU
D/Cow
648
648
715
715
933
933
1081
1081
1348
1348
1621
1621
1844
1844
2006
2006
2268
2268
Heifer
244
122
231
115.5
302
151
428
214
422
211
349
174.5
278
139
221
110. S
208
104
Steer
451
451
217
217
251
251
427
427
598
598
451
451
340
340
307
307
327
327
Bull
--
----
245
245
----------
Calf
98
24.5
245
61.25
223
55.75
328
82
354
88.5
239
59.75
251
62.75
389
97.25
--
Ewe
1218
174
1667
238.14
2060
294.29
1448
206.86
1705
243.86
1851
264.43
1881
268.71
1843
263.29
1877
268.14
Ram
240
34.29
361
51.57
463
66.14
366
52.29
487
69.57
518
74.0
503
71.86
832
118.86
694
99.14
Wether
254
36.29
288
41.14
343
49.0
359
51.29
188
26.86
233
33.29
232
33.14
234
33.43
239
34.14
Hogett
425
60.71
501
71.57
553
79.0
525
75.0
424
60.57
292
41.71
237
33.86
214
30.57
204
29.14
Lamb
251
8.96
182
6.50
449
16.04
228
8.14
147
5.25
162
5.79
236
8.43
177
6.32
240
8.57
Total L/Unit
1559.75
1517.67
1895.22
2442.58
^651.61
2725.47
2801.75
2973.22
3138.13
(ha) Area of pasture
5272.6
5263.6
5408.7
2798.5
3816.5
4314.5
2221.0
2125.5
3126.0
LU per ha
0.30
0.29
0.35
0.87
0.69
0.63
1.26
1.40
1.00
1 Livestock Unit (LU) » 1 cow or 1 steer or 1 bull or 2 heifers or 4 calves or 7 sheep or 28 lambs Wether is castrated male sheep; Hogett is mature female sheep which has not yet given birth
Table 8b. Bamboo Scheme; Area 1510ha
Yearly stocking rate at the period when the highest number of dairy cows were available
Year D/Cow Heifer Steer Bull Calf Ewe Ram Wether Hogett Lamb Total (ha) LU L/Unit Area of per ha
pasture
1967
1968
1969
1970
1971
1972
1973
1974
1975
No
LU
No
LU
No
LU
No
LU
No
LU
No
LU
No
LU
No
LU
No
LU
460
460
695
695
760
760
800
800
800
800
809
809
876
876
990
990
1154
1154
206
103
426
213
442
221
464
232
464
232
459
229.5
490
245
489
244.5
491
245.5
201
201
488
488
370
370
390
390
385
385
346
346
360
360
320
320
417
417
68
17
38
9.5
120
30
73
18.25
80
20
300
75
252
63
338
84.5
91
22.75
2050
292.86
2544
363.43
2700
385.71
2695
385.0
2695
385.0
2770
395.71
3100
442.86
3197
456.71
3267
466.71
355
50.71
332
47.43
160
22.86
436
62.29
430
61.43
520
74.29
605
86.43
730
104.29
760
108.57
180
25.71
448
64.0
385
55.0
566
80.86
--630
90.0
770
110.0
880
125.71
855
122.14
425 166
60.71 5.93 1216.92 51.5 23.63
230 166
32.86 5.93 1919.15 45.4 42.27
280 207
40.0 7.39 1891.96 340.0 5.56
408 93
58.29 3.32 2030.01
408 190
58.29 6.79 1948.51
659 290
94.14 10.36 2124.0 486.0 4.37
706 1000
100.86 35.71 2319.86 429.9 5.40
804 360
114.86 12.86 2453.43 963.0 2.55
861 125
123.0 17.86 2677.53 927.0 2.89
1 Livestock Unit (LU) = 1 cow or 1 steer or 1 bull or 2 heifers or 4 calves or 7 sheep or 28 lambs
Wether is castrated male sheep; Hogett is mature female sheep which has not yet given birth.
-116-

Table 8c. Karati Scheme; Area 5863 ha
Yearly stocking rate at the period when the highest number of dairy cows were available
D/Cow Heifer Steer Bull Calf Ram Wether Hogett Lamb Total (ha) LU L/Unit Area of per ha
pasture
1967
1968
1969
1970
1971
1972
1973
1974
1975
No
LU
No
LU
NO
LU
No
LU
No
LU
NO
LU
No
LU
NO
LU
No
LU
895
895
910
910
728
728
972
972
871
871
960
960
675
675
1267
1267
1325
1325
113
56.5
197
98.5
361
180.5
351
175.5
530
265
540
270
590
295
675
337.5
672
336
329
329
350
350
717
717
896
896
843
843
840
840
870
870
1320
1320
1100
1100
198
49.5
355
88.75
384
96.0
548
137.0
555
138.75
595
148.75
650
162.5
634
158.5
580
145.0
4862
694.57
3890
555.71
3865
552.14
4272
610.29
3288
469.71
3295
470.71
3585
512.14
3573
510.43
3495
499.29
190
27.14
460
65.71
705
100.71
759
108.43
650
92.86
750
107.14
565
80.71
596
85.14
610
87.14
670
23.93 2521.78 4822.6
869
712 2411
101.71 344.43
565 540
80.71 77.14 31.04 2257.56 4679.8
814 829 1056
116.29 118.43 37.71 2646.78 5155..6
1933 668 2106
276.14 95.43 75.21 3346.0 4676.2
554 1300 1161
79.14 185.71 41.46 2986.63 3274.5
755 415 950
107.86 59.29 33.93 2997.68 5O06.O
990 560 1045
141.43 80.0 37.32 2855.10 4795.5
1015 2107 1017
145.0 301.0 36.32 4160.89 5117.7
725 2050 615
103.57 292.86 21.96 3910.82 5087.0 0.77
0.52
0.48
0.51
0.72
0.91
0.60
0.60
0.81
1 Livestock Unit (LU) = 1 cow or 1 steer or 1 bull or 2
Wether is castrated male sheep; Hogett is mature female
heifers or 4 calves or 7 sheep or 28 lambs
sheep which has not yet given birth
Table 8d. Njabini Scheme; Area 5301ha
Yearly stocking rate at the period when the highest number of dairy cows were available
Year
1967
1968
1969
1970
1971
1972
1973
1974
1975
No
LU
No
LU
No
LU
No
LU
No
LU
No
LU
No
LU
No
LU
No
LU
D/Cow
938
938
1062
1062
960
960
2256
2256
1180
1180
1056
1056
1049
1049
1042
1042
1095
1095
Heifer
384
192
743
371.5
708
354
438
219
556
278
370
185
362
181
362
181
321
160.5
Steer
-
-100
100
172
172
135
135
325
325
380
380
361
361
355
355
279
279
Bull
-
-------6
6
1
1
------
Calf
598
149.5
43
10.75
90
22.5
148
37.0
387
96.75
482
120.5
229
57.25
247
61.75
346
86.5
Ewe
1145
163.57
1379
197.0
1185
169.29
2520
360.0
2197
313.86
1790
255.71
1818
259.71
1820
260.0
1067
152.43
Ram
116
16.57
108
15.43
198
28.29
270
38.57
340
48.57
285
40.71
231
33.0
214
30.57
124
17.71
Wether
215
30.71
310
44.29
780
111.43
360
51.43
399
57.0
371
53.0
428
61.14
428
61.14
440
62.86
Hogett
406
58.0
364
52.0
1130
161.43
362
51.71
357
51.0
399
57.0
375
53.57
375
53.57
436
62.29
Lamb Total L/Unit
684
24.43 1572.78
146
5.21 1859.18
280
10.0 1988.94
460
16.43 3165.14
415
14.82 2371.0
260
9.29 2158.21
429
15.32 2070.99
469
16.75 2061.78
685
24.46 1940.75
(ha) Area of pasture
4402.8
4370.2
4131.0
1549.5
2712.5
2791.0
3263.5
1420.7
2653.0
LU per ha
0.36
0.43
0.48
2.04
0.87
0.77
0.63
1.45
0.73
1 Livestock Unit (LU) = 1 cow or 1 steer or 1 bull or 2 heifers or 4 calves or 7 sheep or 28
Wether is castrated male sheep; Hogett is mature female sheep which has not yet given birth
lambs
-117-

Year
Table 8e. Githioro Scheme; Area 3641 ha
Yearly stocking rate at the period when the highest number of dairy cows were available
D/Cow Heifer Steer Bull Calf Ewe Ram Wether Rogett Lamb Total (ha) LU L/Unit Area of per ha
pasture
1967
1968
1969
1970
1971
1972
1973
1974
1975
LU
No
LU
No
LU
No
LU
No
LU
No
LU
No
LU
No
LU
No
LU
-nd
-107
107
269
269
285
285
320
320
431
431
443
443
215
215
-nd
-
172
86
43
21.5
98
49
88
44
301
150.5
282
141
51
25.5
-nd
-
30
30
21
21
75
75
100
100
168
168
224
224
65
65
nd
nd
nd
nd
nd
nd
nd
nd
nd
nd
nd
nd
nd
nd
nd
nd
29
7.25
40
10.0
93
23.25
61
15.25
124
31
150
37.5
21
5.25
463
66.14
551
78.71
960 137.14
1004
143.43
979
139.86
1260
180.0
1127
161.0
33
4.71
43
6.14
30 4.29
38
5.43
40
5.71
44
6.29
88
12.57
199
28.43
21
3.0
263 38.45
180
25.71
190
27.14
225
32.14
248
35.43
157
22.43
129
18.43
237 33.86
294
42.0
320
45.71
329
47.0
483
69.0
238
8.50
355
12.68
227 8.11
214
7.64
450
16.07
625
22.32
272
9.71
360
440
654
703
1014
1133
598
46
46
1
46
99
25
.46
3440.0
3440.0
3587.0
3599.0
3519.2
3452.0
3367.5
3362.9
3395.2
0.10
0.12
0.19
0.20
0.30
0.34
0.18
1 Livestock Unit (LU) • - cow or 1 steer or 1 bull or 2 heifers or 4 calves or 7 sheep or 28 lambs
Wether is castrated male sheep; Hogett is mature female sheep which has not yet given birth
Year
Table 8f. Muruaki Scheme; Area 6832ha
Yearly stocking rate at the period when the highest number of dairy cows were available
D/Cow Heifer Steer Bull Calf Ewe Ram Wether Hogett Lamb Total (ha) LU L/Unit Area of per ha
pasture
1967
1968
1969
1970
1971
1972
1973
1974
1975
No
LU
NO
LU
No
LU
No
LU
No
LU
No
LU
No
LU
NO
LU
No
LU
2500
2500
769
769
810
810
1269
1269
1439
1439
1460
1460
1169
1169
1185
1185
1185
1185
1500
750
637
318.5
380
190
825
412.5
725
362.5
750
375
945
472.5
948
474
984
492
300
300
32
32
15
15
852
852
842
842
857
857
820
820
811
811
811
811
-
-
-
-
-
-1
1
1
1
1
1
1
1
1
1
1
1
1200
300
404
101
580
145
239
59.75
499
124.75
370
217.5
1197
299.25
1254
313.5
1254
313.5
7000
1000
3991
570.14
4205
6O0.71
2864
409.14
3340
477.14
3497
499.57
3812
544.57
3816
545.14
3816
545.14
850
121.43
430
61.43
599
85.57
143
20.43
143
20.43
165
23.57
247
35.29
276
39.43
276
39.43
560
80.0
450
64.29
452
64.57
700
100
720
102.86
910
130.0
349
49.86
1361
194.43
1361
194.43
2000
285.71
1218
174.0
1212
173.14
1045
149.29
699
99.86
860
122.86
864
123.43
1505
215.0
1505
215.0
2150
76.79
29
1.04
321
11.46
272
9.71
582
20.79
732
26.14
1628
58.14
1650
58.93
1780
63.57
5413.93
2091.40
2095.45
3282.82
3490.33
3712.64
3573.04
3837.43
3860.07
5877.9
5513.2
6168.0
3726.5
5642.0
4621.0
4795.0
5688.0
5427.0
0.92
0.38
0.34
0.88
0.62
0.80
0.75
0.67
0.71
1 Livestock Unit (LU) = 1 cow or 1 steer or 1 bull or 2
Wether is castrated male sheep; Hogett is mature female
heifers or 4 calves or 7
sheep which has not yet
sheep or 28 lambs
given birth
•118-

Table 8g. Tulaga Scheme; Area 4731
Yearly stocking rate at the period when the highest number of dairy cows were available
D/Cow Heifer Steer Bull Calf Ewe Wether Hogett Lamb Total (ha) LU L/Unit Area of per ha
pasture
1967
1968
1969
1970
1971
1972
1973
1974
1975
No
LU
NO
LU
NO
LU
No
LU
No
LU
No
LU
No
LU
No
LU
No
LU
660
660
728
728
729
729
702
702
780
780
897
897
941
941
980
980
975
975
530
265
530
265
521
260.5
445
222.5
241
120.5
349
174.5
374
187
447
223.5
905
4S2.5
200
200
217
217
212
212
120
120
150
150
152
152
750
750
340
340
430
430
--
--------1
1
1
1
----
650
162.5
605
151.25
615
153.75
500
125.0
520
130.0
320
80.0
340
85.0
390
97.5
380
95.0
2500
357.14
2535
362.14
2400
342.86
2090
298.57
2260
322.86
2500
357.14
3190
455.71
3400
485.71
3530
504.29
345
49.29
334
47.71
285
40.71
176
25.14
130
18.57
160
22.86
219
31.29
200
28.57
215
30.71
225
32.14
249
35.57
239
34.14
150
21.43
126
18.00
246
35.14
350
50.00
379
54.14
315
45.00
750
107.14
849
121.29
848
121.14
120
17.14
212
30.29
324
46.29
433
61.86
489
69.86
505
72.14
1200
42.86
1220
43.57
1228
43.86
830
29.64
920
32.86
980
35.00
1120
40.00
1256
44.86
1350
48.21
1876.07
1971.53
1937.96
1561.42
1603.08
1800.93
2602.86
2324.14
2652.85
3850.2
3572.7
3818.8
3117.2
3038.0
3357.0
2935.0
2937.0
2204.0
0.49
0.55
0.51
0.50
0.53
0.54
0.89
0.79
1.20
1 Livestock Unit (LU) = 1 cow or 1 steer of 1 bull or 2 heifers or 4 calves or 7 sheep or 28
Wether is castrated male sheep; Hogett is mature female sheep which has not yet given birth
lambs
•119-

cN I CT» m —» m oo a o « . • • • r-s 3 o m m o O - * » I - I
CO -ff N O O ' û r t
t 1 I t I I I I I I I t I I I
i-t H r«. * H A 0 0 l . . . .
r*. s o m u-i o O I »T CO vO
sO « * m * * O CT» «a
CM p- H I-» 00 • * CM - * i-J n n i r t O i n O c o N H
CM m < r
© O m r - en en co w
CN ^-t co m -<r -3" o i n * ï n n n n E-*
3 I m e n oo | I I I I I
CT» CT* en r * \ 0 en
O O CT* H i n <** CM
N N N ( n O O N " * " 9 r t
( N CM f-4 H * vO
» en e n . - * H • * m
CM s r m O
T-t -<T oo en i*» en cû
r - t c s m \ e c n ' * ^ r - » o 1 - t es O M T I < r H H m « m - s r e n e n m e n e u »
H * J j a e
i N ^ f i n N - Ï N ^ O
O • * vO ( ^ • * " ^ ^ M al «
O N C O > A C O i r t > 3
CM -tf o en en
S
a -
: X en b o . ©
o
Q o o <H a
S ^ AJ se >É w »« M
CM O
CO I **
- _ n o- o» ' ! S ! C CM U o « - • S * 4 K M C 0 '
N-* u i co • • X
to oo ta o *-i u o. o S u z » 10
«M n a *•»
o • < , . o I o I I I I 4A • I O O '
' N O !
a i w o
o O u-i i
i O I I —* (
' Ó (
i o I - I '
o
00
o
00 w >
a i
• J SB Q u o z z o u o
« x ••
a) ai
§ <0 0) DH
en BO pa H
3 3
I ST X X G M t ) V i g i l U f " f »1
») a; ^ î>s *e -o s O m r ^ N N
•H u • • • . •
0 * H ~ 4 3 O [£< b Eb Ifa b [ t
H i / i u p s a a o . a a &[
1 00 o
- « O S
o 2 •• o -rf - 1 *-t «J W
: : ^ " N * - ^ CO
g S ° a. B • CJ. u w x a:
w U I N X op a x x s *i a. s w a u z
CO 1M -H ' rt O S
-» a
CM -O
m <o
g ? u
« J ) CM "
• B r* ^ en
3
O
u 3 . H
<B c CO
TJ c flj
c o •u
S ca O CU <H k> N O O U CD CS H 03 3 4J
f h Ol a . at ca
TJ H O C U
H «o cd o 00
a. -a--H U y ta QJ
TJ
41 H f t t*-i o L. (X
en
!*; t d Z Z
<<
ó c
4> H
U-i 0 Li 0 -
u 04
=> •u f t c
a
f-t ^ i > , bl o- s ^ >> CC 3 O . «4-1
Ä X • * *w 1 00 • • 3 CA
» Ä S T c H •o C 3 1 O C o « m - H •• cd
• H - * * . -U > , — (
o
bû C 1-t 4J CO
t H 3
TJ C 3 H
0 Z
u O CO * -
U • • - * ffl J= C ( - t u m o M e a a U C i - ) M «rt o o n « U-i iM • * M.! 00 >s •H C O J=
Q ^ O H h a W CO -H CO 4J «J CO U U U (U h
*-4 ** <a *4 a . oo y oo > oo o
o h o f H i i rt rt U H (J U •-4 o m o u > * o u . o ai o j =
n u o u >J > i
t b «w
a o * U 0 U tQ
g i 1 1
li-i U H 0) 41
«H -H • -* r-l eu tu
Q£ CC
C0 4-1
ca 3
t-t
to 3 CO CO CU I-t CL 3
O
• o <u u c CO
KH
a
c o
•H *J co 4J 0) co CU
>
.o • ^
CO tJ
•o c m
u 0) o
co 4->
8. W CU
> o o
i H x-i z
c 0
CA O Ja
b3
^-1
Z
CO (0 CU c
- 4 c 0 4-1 CO
CU o cd
U-I l-i 3
I f t
Z
M « — ÏK
w . . v4 4J <J C -^ cu *o
•H O T3 M CO ^ u >« 00 4J
CU c a . i-i o ^
I - I «J en co
» ai »*-t > , en a» ( N $ 4J ä ai <u ~^. «* y • cd ta -H <r i c a> at o
as M •* > ^-* e U CU -H co o
j a « c _ 3 4= -H > • co 3 tt-t
•U 00
l
^ Ê U ^ - 3 -H U
T 3 3 C O e n 0 ) ' D C A >
3 9 eu en cu co w
I co to >, e tt) CU C
i H h "
— S C B to CO eg 3 u to
«-i O w S s - O O
«Jtf V u • • • U B O
•W d) 4J * J >» c co C • * C
g «4-1 o
2 a c
*ö _ S u c *o s
eo e co . .
4J tU CO
» c >> cu
- J'S CM O» CA i-t - - C 4-1 m f t «. u
o S « - t O U M « U • H * I CL O . E *H - H U-i (O
&2 CU 4 J
> t « 4 4J OÄ u o u ? « S 0) u-. >
c c > 4) CU «H O
i > , 4J x ; 4 fct CO 3 O I "O 14 *-> : « a> s en T Ï »-t V ( ' s 0 * 1 3 1 en e co t )
O cfl
h £ O C f O O eo JO
W >V. CU o
_ O
CO o S
CU • • CO Li pu, a f t Q • • o p-
H O I H H J D
- a L« o <ü > , 3 L4
P- CO 4J Q.
o _ o
I f t Li
U 3 - u -
C «o
Lt y - \ Lt U-( CU J3 4J 3 01 .
J= f l U C «H
" §
a> o TJ H JO
• 4 1H m h
i - l «J 3 U U
p ta «-. • « C co u eu »s ce co c U c
• H a» f t ^ U H > >
j£ o u >^ > , 4-t O Li C O
f-t CU cq L I
> B ^
5 . - 4 j c O ^-v tO f | L» 4J 4->
-Û tO >* CO _ f t J<i O
£ 9 y y
co S O f t H > . t > CN £ C
Li ^ - ^ «I m U
. o 1 00 • U CM
>. a c S CS CO 5 co
V - '
to • •
% ° O 4-> O U C
0 eu f t C u
•H f | u-t eo
C
Q L. U S O) «H C -
"O U û ô > ! TJ •« 0 » S m C
1 B .r« 0 0 4-1 u to co H u n c «
f t • - 0 H > , 4J Q < B ^ U « Li g Ol 4J f l
H Q Lt Q) > U O . C O Li f t
co CU CL u u — ^ c w
^ S1 * § O eo 4J C 3 ej
1 s* o " en c 4-1 co <
f l L. -a- u-i tu 4)
O B H . . C O M >
u co ce eu A H
f t _ i . . o ej
1 Li *o -o eu eo 1 <**i c c s e
eo co O f i » • • co s 4) eu u >s I L C <u • • C
3 f i o •**> g W f i co tu S
41 • -ps: a ai
1 TJ c u < tu o v i Q Li g
i TJ - H 1 C TJ
ai C eu
en f i * O
v o n ^ 4-1 TJ
C O 00 f l O - t f
4» m Lt x : TJ U tfl tfl
ü P D m Lt m eo s cd • c o
TJ rv> to ta
B « A 3 o> Xi
•H - H C O
»A > . 3
CN t î U O 3
* i - l Li > » J 3 4J U CD
•O L« CO >s
m H ^ ^-v 3 O en 60 O
OS co J3 > * I U-i j a Li w 3 Q
O 01 C L. Lt ttJ
O CU - C O G
CA «H f l TJ U-t TJ C TJ tO TJ
L. C 4) t3 f t
O ai •H >* " - * 4J iTl 00
& ? •
00
> . T J Li C C 41 « es >
4J O «4-i 41 eo
s i s S O
j M i n - H » p 4-1
Q " P S » t i > , > . Lt 4J u m u
T3 w C X O 4J vO TJ U O ^ 0)
g i n ki eu co
eo «S J = 41 S - to C
TJ m . H eo C • * M co r » O C
U tU V < to 3 eo
.•»4 Li 3 c co i bo 41 O < c . n u . cd 3 I 3
JO O Ol 3 f t f « CO 4->
CO * ' B co co 3 H 41
f t CL U TJ O
CO M 4J M - O U 00 c 41 «H tfl C
4) M B «
1 3 - Ü f l 41 • W T J C I Cd 4) «H t TJ S f <
ta eu co Cd Li H O C
o. a - i
» cd T J —1 co , C TJ TJ
f t «1 H I > Lt S «
3 H
CU co C H
f t O
w J£ f i 4J >> C CU O Li TJ f t U 4) Lj U cd CU C 4) -C O
^ TJ B H > 3 Û.
U CO C C H - H O 41 > O > O
CO 4J e u o O 00 Li
U TJ TJ O C C Li ed cd
CU V 4-1 C CU f t «ï JS > 60 4J H C to u Ct] 4) u B 3 cd
- 1 2 0 -

«* ^ co co o ^ Os 00 » • * • " f - * J 00 tA <A O O -* oa os
CM ^ M o -4 en r-. • o O " * "H 1 I I I I t
» n > o o O o O en MS CM en -tf i I I I I 1
N à ® • O ' f t O >-< ! I • s  ^ \ N O O O > Û O N CM eN —, -tf »A
« N O M CM tA CJ
I I I I I I O
—i in o O o c* ON - t i . • • • - ^ i s g n m i n o H i l r s **• * r « * r CM <•*
O O » A O * A m i n
O CM 0 0 N M S f U
Os ifi IA C M T I ' j n
* ^ vo n -* ifl ^ o
•^ N »O
-3- K. en "* OS sO fa «n «^ n rt N M c
O »T 00 ~4 .-i CM OS | . . . -r^ »a os * * >A o CM i i
O O is Os <T •>* - *
I >-< M ^ CO N O CM O hj en •* O
i ( n i r t H H f l * o ~4 en m
so oo <r - 1 o r -
S3* U'S.
O* Os Os Os O O en o ® f""" *"* O *•*" CM ts. O i l m i n o " 0 » w ° ' * ' * r , 0 ' N ' N < f ' - * < O m <** * H C M V O r *
CO N O CM en >» !
t - t c M m O o a u " * u " i O o H ^ CM » A CM
* H CM - * < r 4 n i n H ^ . « .
O I S N 00 N <A >
m -* -a- en CM CM <
p^ CM - 4 CO
CM «n CM O en
i O »A en o O O en o
a *•* - s U s ^ O
l „ O ** 1 \ W X Ü W M M t C L t I W
CM CM
00 •""•
a ».c
v-\ ' S 1 »
J X CJ s? i
* w M i O O O B
1
a z
J3 tî M U
8.2
7.0
retr
eî
mm
S ES a - i n
a a a o C eg . • O » - • B O -H M M 00 — 1 u f-t O « » • S3 • u u u a »CM
«J (S «) IM « g) *J W X o a s
Bas
e B
ase
ESP
T
ext
Sand
a
S I o
• o o I a 1 eg s>
ir\ © at o o * *
. . o o o
a»
M •* £ u Ss u rt « K . * *H « U U H
§ | O
O I A
< - < O Q 1 T
« o o 3 • •
CM - H
« U W I 3 fa "O X C * 0) eg
•rt t n
s a a s a a
m O iA CM • -* O
°it O I A O m CM i -*
o o o t s t
s s s
M
1 « en
»-t ta u O
fr-
fr* M
U f - 4 • H
en
Ü *J - - . ca 00
s - ' >
9s S u • u M
» .. C « v u
-O 3
fa Ï N . * » ta
u
•H -H
S3 O
t* . a
o
CM
h . a .
en
CM
PM CL
»s
CM
Cfa a.
( S
en
t u a
~ 's
eu • O . X u ta CS »J
>%.-s
eo oo oo
§ 8 §
a a a
u z * :
ou -w >
o "5 •• o -< - > , - * y w
^ — to SS ° 5 . a - eg
i *ë.v
00 / -s o M O
O ** O — . ^ 0)
-~. e
w C O
X o o
2 U U
ß . Ü C 4) .
(-4 CB <a CD
• 0
4) 00 CL IS. > i N 4 i
„* iX c (A <0
•H . » (X a -»4
CO . Ü lA *H
CM J
• • . >a (A tU
• « sO <0 t-4 f H 2 (0
O a. U
rs u • tJ
<J\ c m v4
M £ 4 J
4Ji ï O *
t-t CO
t!iJ 0) o
•H U Q
< j et - H S *J h co <B (S
•O - H C U
•O «J O -H SS U S Ä > . 3 CLii-i
X • -1 O • •
*CI iA C 3 t 0
w r t T i s ^ W
flî en § C - M O o W * . «M
e - H o ^ en T4 to y * j y
- 4 <Q ^4 00 > 60 o u o
H I U H o « o <J -O <u td O u
**•* 3 u
>. X
M •a a ta
4) Q ,
5* M m
S o
u«-•H
§
M 01
> e o y
i? o
• Q O
1
§
00 C
P 4 o u
o w
(0 a. »M
a = ) tq M 00 o h. u tu o.
ta y 0
- J
>s X a. tQ u «â 0
• H CO
>. X a-
«M
o h U
I I
0)
tu oc
tu
3 4J CO CO O.
s * U <u
> o u
(0 to
« h 00
> s t - t J J
c es c
1 0
• f l
« M 0 -
X
13 xi AA t0
g^i »-4 C 0 . (0
u O -r4 j j co
3 5) •"•* 3
• a œ
3 «M m eu ta
•H eu i-t u
v a U 3 t U o ta "O ai «
fl ^ C eu to a *-»
J»S U o
to CU
> P H
U o
5 û.w-1 ta
. . tu o ta U 3 y _
•H ^ S B
(0 • ^H
o " ^
* S Q) 0
s -* 1 «
«4» tO tu ^
•H CU t - i 00 ai 0) se >
SS
ca to CU c
• H F H C •H O se *->
C V o o
•H «0 ta U J
0 u U 3 w cn
èSï o
B CU
-o ta u 00
CU a. o
•-4 V3
•z
S* u •.-t O
•o o ca
> N
—4
C
RJ C/i
*-t •H
z 00 e
•-t CB 01 co
ai u
« U-l
u 3
t/1
C O
•H • U
a - 4 U y ta CU
•o
CU
• •4 M-< O kl Cb
T3 CU C
T-t (0 u
•o
r - (
CU 3
ca ta ca
1-4
y
CU 00 CO c
1-1
(0 u Q
T l V c 1
a i h t C « * U 3 > • a e Ï K - H >» 3 i n H Q 4 < M a M t s
. 3 . » til / - s "O r». 00 >» « CL T l - 4 « CU
7 i v 3 C u 0 4 n | C Q C J W ( S ^ t A ^ ^ L i
( • H Q U > | I A <0
tu 3 œ « i n u s « g ^ m « 3 - H O > a - > 4 * « f l O«*- ( o r n n t ) S a « ^ u ~« . a G 3 « «•-* x • * g i s «
. .•sa S - Ä S S S ' s u a s x S T Î -H a a a ta > * x a> v -a ^ T f a i X C U ^ H X Ç U o c x o o g t - t o - t o a 8 r t a * J L . a e f l B 3
a. ai ta C ai co eu u tS ••* t a u e S . C <H Q * ^ s . T I s ^ »4 m - H X É S t f i ' H e —. w-i
I M H I 6 B M " U
a: • H O O O O a • > 4 C U L I U - H U 4 - I 4 J - H C U . A W * « * * J i - o o e
q) • • V 9 1) B fi M • h - « U £ Dl O i u
> » « > > « u o e - H C M U T> X L* C -H « ^ ^ >s
T) O S O O <-i • H c ^ t t
S 3 a y o • • m ai ^ - - ta a ad > S . - U f l J C O » « « ^ ^ >, c o y o - - «A eu
S <U v i fa t i o u « u Q f i f H X ^ - H - H U CMC« ?« y CL X b lA 0 > % T » s ^ a * J . « C U
. . - « U C 3 O > * T . r - .^. c u t a c o » 4 o t * C j | U 0 0 > « - o g T J 1
t j « c « u tu ta «i < H > H >> « fl B en —
C L Q T J C O * * " O S > , < w a c 4 c « c c < n t a
V B (D u O ( I *H e N i l o o w a od y 5 * s . • * e « a b > o m eu *-» g o to «A • • h u eu S eu y tu i «
X « î 3 » S H T J n > . u T I O O O O I - H
j : I A y c fa » u o, 0 «o • s eu co ' - w a
^ N l - £ X - S Œ *C fa^ O 0 < U C Q T ) C N T) *cn a c t f a C t u - s . t u > , u e u - H , 4 h m fa U > N - H > * - < X ; • - >
T ) J ^ « o o c o O > , o ö j£ U t a > . 3 - u i U ^ > 4 fa^OtOViOOOtaiA c a - ^ ^ ^ a t » - < o w 3 •
•O - T X C L > C L f a ^ T I r « .
a s u y
en os - * CM t 1 m
O CM
o. to
< <
u *o 0) O B C
e ai o 3 to <U fa fa . * ^4
X « ta T ) »s a o tu « tu ^
y c C S u U *4 <H -H
•H » *fa > * *J
fa S o eu co m I M fa fa e to eu 0 *H *
t>4 » > W U4 fa o. ta jat ta
v >, tu ^ •o fa e T> / s u g c o g c x co g ta a s ca o u
I A a» c
j i 3 ta eu m g x O -H B ^ S l ï
• H t ) O « * J fa çu *H <H en •»41 t M U > H >s#H
ai -H ta x » O fa fa • "4 co
fa fa o « o U -H a c « c u
• H B o t » tfa o g o ta eu ^s a a s - H fa .»
a s C o. ta v c o o o a •H u ai y fa 5 B o 3
x ^H x to a fa
TS • " s * - y ta -o fa es 3
eu «U c a • • " s fa fH i- co eu o en fa X O fa to CO CL ttt T ) 02
•H ta c c &H > . fa eu tu tg o * A j t j
• H ca ca fa CM o . » ifa 00 W -H «H ai c y to » x fa T i m eu e > , 3 C S ta crj fa fa fa ca C fa T I co y »a -H fa w 3 eu u MT 3 fa e «„ . - x ^ s oo fa <H x eo fa scr G ta u « o n «
>s > , tu O I os X J4 U (fa fa ta >< s y eu in a o > >s eu T) w
rH fa C e eu x >* tu -H « -o a
c > iw a* fa fa g r-* fa ta
<a a - s ta o «H ta G [ 3 >» u 3 - CU S T I M 00 fa fa a <S eo T I C eu O O fa 3 C ca 3 a y O O T I ce
e u
00 lA 1
es * r
3 ta
c « T Î ca
ca « eu ta »H L« CO o ta 3 a. u T )
y ta >v 0) fa c ta oo
I S -* O — * H
M O ] « u b
C O J) 9 0 S S tM • *
i a 5 «j u e «
•M e » * * . -^t
co -o
f e *ä b. Q C «S • & a œ
0
s u ä <fa to
fa •-T l O « c o * ta u c
•H eu tu > C B O
-H w4 fa l u tfa O
fa ££•* a> oi T Î > > c
to
& >* C B eo
1 si fa
*J ta > tu tu -H 2 fa «
B E. « eu
X eu ca S 2 Ê « « o
•H o 5 *J y X ta fa ca 3 w
»H tu to a < M ai
1 >* * « w tu . * ta eu s o
•o a» a «fa a s _ O fa X X a s • * * I A fa u
fa 00 CO | fa o 0 y B eu CM co 0 fa 3 -H t- tu a
fa fa O " CO M fa * O . * « T ) « « O H C A tu u B v Q e 3 >s 3 ta
^ > < < 4 a n ••> y co T Î c u * H >v o " - ' eu O y co CO PH U B * 4 0) 3
•H x w ta T I y tu T» CU C «
fa B C L. - 4 fa *«- eo O a) y 00
^ H m C • * fa 3 tu o ta — ta oo • * c y fa w
•H C *•> -H O -H o ta eu *fa g o ce) S | 3 0 h fa
X * *4 eu U < S C « J - H 5) c
o l A
1 m
<r en
o E
eu
- s co tu B _ B -H en £ ^ t l H B
eu 3 <*4 B t*. os co <a eu s-, v. y >, - o c lA ca >H fa CU C * 4
Q fa a) œ ta T Î - y « > eu - H
CN ta B tu B T I —l >\ «a B ca
- c a B oo < H to
ET*«* i S " 3 T» B B 5 >% V
3 to . » h ifa
ÇL-4- *H m TJ eu B ta ta
0 u
B O
•H
fa CD B ta
fa x u o
g to
s * . T ) > , ai Li > •" -a- eu ^ -H co ca
B u fa X * « C* -H ^ ( ß B > - - fa > 3 Q -H l A eu CO -H tu g > *—' C fa u - S O
^ • y 5 fa
5 to u fa
ö * « H fa ai O ^ fa 01 O U > fa
X B S O) T I ^ ta - 3 c
x <fa s c ta tu co to tu <H eu iw
•fa > * x t- « T I * - 3 0 O • « « T» eu *J C L ' - s -H tu > eu tu u fa "H tu eu N -H
• x a ta -H > «rf eu ca T Î L* ta - H fa u - H ta fa ta w Li aj o e y
T I fa L-i x O -H (0
E y
en 00 i
co l A
CM 3
CD
T I O »A I
en
-a-m
.—»
•H IM U 4
« • a > . u fi fa co eo CU -H
" i s 00 -H C B «*-t O tu
U-i t ta y ai >
• - —H > s X >v ca eo B
i 4 ^ d
u fa a u-
#-* • « tn fa 0) c co fa n)
•H 3 * -
9 w 3 S y y
^a* W >s s » « «J en to » H
y o i >s
>- ^ - I A y co • o o>
CM ifa 3 X
» >S *4 tU M CO >fa
T I f~* 3 • -
<r oo fa s . C M
o - * ta 3 B
eu r 4 a
s ta co
o
fa s
oc eu C > to eu iA fa JZ w « )
0 B U U
5 T I fa »4 fi t» X cQ es
x s a ta 3
•H -H T» O T ï T ) a
fa •H «0 s tO
fa fa
'S S « U >,
*^ j* eu u fa B *4 ta - H fa
T I U4 CO
a y
00 Os 1
en 00
u 0=
•H
.. > .. CO -H 0 • H fa fa y y > (O B ca o fa tO -H
»es i l s T» X eo c f u
3 fa u o ta fa eu x
•° _ u 3 T l O ta B Q
ta s eu ta S co O fa T I ta w c
eu ca . * . ca a C fa ai -H ca fa y Q '*~4 CL CO y
a> o . . ta 0 to fa fa - H
• -. * 0 « fa y fi y
•*-• B 3 *fa *H eu E u-. 3
V V . - » u B CO >H 01 > * T > fa fa NH 0 eu B
tn
3 en* 3
T ) O t u
1 S .. ca
B eu ca 5 6 B
1 1*4 > 5 o u £S . - CU fa ta > j d eu fa 3 T I o î c O. t u to
Ol O m 1
m
-a-en
o s
eu 1-4
a
i eo
• H u - H ta 3 y >fa *H »fa y T I ai fa B eo B L > , (J 1 M B C fl CQ u fa OQ *H 0 4) » 01 C X • y > fa > m ta tO
ta a H o O 00 •* >s G •* fa B o B T I v4 fa
O g ççt fa a -H tu »4 B co « H > C " C X T I *H •u ta ai • • fa t u r« CO T3 01 y
O 3 B B B to "N >» fa ca co o »Lt B ai fa ta o ffl V *4 S f a T I B « A 3 fa x o <*i i- »4 i
<0 ta O eo o en . . f a . f a > » o > x 3^-v
/ - N CU fa «J X - T w q u n x e u u e n t o o u B x fa ~ -•H S > . ça fa « o fa ^ s y • fi • - ai u • - o
s > <H . « / -^ -o B
-» <a x to ai c S O . . U O j N f l l D en »H « w -H -H
fa >% ç> eo fa o. pi « 3 H 4 y g P -H fa eu B tu c3 l A - H y f a B - H t B C O « ta 3 co 3 a s -
CM U M -H a -H — fa eu TI S
- co ta T» eu . - t a >N eu o B O ta <H U - H > * g f-< fa «0 -O fa ^ C 1 o v*
fa u B o CM 0 eu
•J- o o o e u c
<r x a o M v e
"-s O y O B ce; so L> y -4 *4 eu >* s ^ Q © v <fa B lA ^3- i-H • • *J -H w 3 •<-» eo >%TI
Ou 00 y 3 C U - H B > > B 3 e u O y C 3 I A C0 tfa - H > co O • B fa C(l fa CM e tu » eu 3
X s s 3 X t a f a t U 3 f i 3 v y <fa tu
X T ) T I U C tfa w eu <a y p o > *
- H f a B — t t X y f a w x j w y eo - O f a T I t o y c > c eu U fi co c O t 4 b C (9 w < H U . . >
*H CL t u *H X O j t fa y fa « J
fa ta c TJ TJ -o a o t O H H < H f i C C C U f a
T I T l t u eo «J « J T I ^
a y
Os 1—1
1 00 Os
00
03
- 1 2 1 -

I M | % F r i « <r oo CM o vo r-» I A
i i i t i i i i i i t i i i i
O — S \ * * — r » — O O M ^O f * ""* r * c j \ «q- ^ r -» « u g r i « ) r » » i CM t • • • • • •
« o s CM CM — ^ r * - r ^ 1 I t t l 1
CA CO «*> — —• *© - * O - H "Û - T - *
I i-N < f i n i i i i t i
0 0
m co CM
r* i A CO < M
O U i
0 0 CM
CQ
<
cx <
TM
r-1
• * I A
-* m 1
CM CM
CM
CM 1
O
M 3
M d
CM
» O
CM
t C
C M
t A
i n
m
O
O
i n en
O
I A
O
l A
C O
CM
en
en
I
t
o
** o
- 0 *
1 O CM
\o 1 CM
PM
O
co en CM
r-
o CM
O
1-4
CM
O
0 0 CM
O
en
o t A
o m
—
> X
CM
O
cn
O
tn
Os
0 \
CM
s O
O
sO
O
-* o
m
f S
I A
O CM
cn
CM
m co
cn
cn r—
sO cn
oo
»A cn C N
«ö — f S ,
s O
cn
0 0
en
-* cn
CM CM - * C-l
s£> -O
-» —
cn <n <r CM
P J
- J
• J O
CM lA CM
c M c n > o o > * û ^ p - < c n o CM lA CM
ffs 00 N co r^ F -cn
<• Ox f*> C*i - ï • * U VA en en CM CM M C
CU
i n M ff« « J H s a c
o> v r M3 CM ^ r — m -a- cn cn CM CM y
p-t X ca
»-* O O 00 vO r-si i n cn ^ — cO O — • • • • •
cO N N - I C O | I m n N 3 M J » N W p< > 1-1 CM so < T cn cn CM CM <
iA O
.
o c
& o M
01 u 0
X ca
• J
. P S
> * • « *
> m
C M • S . • •
a — Ü W
e w o o • H M X CMO
— U X U CL l O 0) - E
—Î
T cc O xi. a.
a y
o •i a
u u
/ - v M
U
M
z
Z
U
oo r»
Ä 33 au
o.ag • - — / - ^ * " S ^ . S t
OO OO O
o o a o O sv
— — ^ . ^ . ca op
ï» V U S M e s v ^ w ^ . u u o i ! Ctl w X e j O t u
I
ctl
z
I
CM o
00 r«-
X X ta a a . 6
5 « « J-l
« • y *-» s ctl
t u ta 0
y Q C0 5 CQ t
en GO
w B
<u a CM a S B
u o a e G L U S o O O • O O u i
CM • • O 1 m •> • • • a O l CM tn ^î — O
oo «* i I A o co a i i — 0 © O f H W © 0
X . . . y 3 . -CU «CM O O CM —
V 41 CU *•* W M N N U U * * t « 3 S 3
U T l 4J t s u u T l
a * x d < - * c o K x c ! c n y e o - p H y y c o • W f r - W W O S - H W •
§1 lA O CM —
o o 1 1
O ""> I A CM
o o t :
a a
l A
O
d i
o
o
M
"O
c CO CA
P H
<ö
0 H
M
4-1 P-t
V I
»4
, - v
y . . y * J
- • * . O 0 Q
w >
t^ S
•« *-« 01
c O o> »
t î 3 * J
s ^ co
« p-t
u co ê
o t b
a
o CM
E b CL
cn
CM
fe a
r—
CM
t b C L
r-
cn
E b C L
CM
<t
E b
CM
CO O
u e y 0 ) •
a -x i cn co ^
O
^c-° W S P-4 -p * y - -i - I CU
- w o e •M en >-* U 1 ni O «
a Eb w o 1?*
i C L
eu
P - >
- ïï 3 C w >
5s >
0 " 0 " o - * p-r - Ü ' W "*•* eo «J O a • CM
w j = X y i M
C X x X W c c j
fr^ P =
c / - v tU 00
s ° fct p- i OC
*--. o a> «-t s P. 2 w c t î
o <u ^ £ C CD w -H
H « S y y
>* o u « b l U H u u U
0 0 I - .
CM
' » * . CM
ê l A
en CM
en
m
S r>*
pN. CM W
4 J y
•»-t
h
(0
a m
2 CO
•o •O c •n! *
! £ - 3 1 • •
f - l s O
a CM « • oa tn
1 . . < f eu en c - * o N • •
C W o
CO -P4 y u
- H co 00 >
o u p"t 0 )
o cn y A Cd o
co Je y 0 M
y •P4 4-)
co « ]
r - t
y 0 M 5s
C M
C O
u
O «-t
p- l
«O y
00
o o 0)
o
co 4)
J = CD CO
y • H C CO U
P H
O
> Cfl
T »
c co
P S P - 4
J = a 0 . 2 CO U .
00 o u i-t
4 ) C L
p-*
«J U 0 - J
&s £
a C0
u 00
o • H CD
J i CO
u J B
•o e
•s u 0
•44
cO
e 00
J : -H M - 4
• H C0
£ co
e co 3
-<T U • C L C0
O >s 4> 1 «-t 00
tu m to eo S. • y -û o O 3 •£>
p^ w « to - o y
C "O _ » « f i t ) cd « c
p- l M CQ
3 4) al oo u y « ai CU -H N w B C -H
K « H * j a 4) t ) -H > en M C B 3 4) 0 -H r-l " 0 y - C
a m 3 3 -00 un to co e • to eu 0 O « w
<-t u co • C L
S O T S ' « t u n »
o c *J O 3 "9 co CM Q 4» >
B -M «P*. C u
00 4» CO p-t d PH P H S
«H o o. y u S to
P-4 . . CU
3 o tn •O 1- s c y
O > H " B
a B co
0 - P H
k i O ^ -
y ta B
§ g.2 1 1 u
"4-t H - CO 41 0 ) 4 J
- H < H 41 > , H H M J= û-
CU CU 41
ce Oä >
• H
z
ca w 4> C
• H P-t C • p * O Z 4J
ca
B 41 o y
-P* eo en n-t O U
-* s bJ Vi
»4 <—t
• u B y
• H T 3
«O U 0 0
eu a. o
P H
t n
P-4,
Z
>. 4 J • H y
•o 0 CD
5s
•*4
C
« en
«PH
Z
ï • H P H
«J 4) 91
eu y co
U-l 1 1 3
tn
• o eu B
cfl b
*o
y 3
co cn
« p-t
y
eu 00 co c ca u O
- t t tu g PH 5s O > S co - p ( * 4 9
" O j O B * W " O Q tu CO
CM U S S w • v « B 00 m p-t 0 c
S y o « M oo 1 ta >. c . . g PH O « y o m
T i S US T ) S . . . C « CB B tft - H
X eu 4 j a ta cu j= o ? c p o u
w -H u B y > w y <p< •p* 41 T I
— *o • " c * ^ u B O - H c n n m <u Q
• H P H «
0 V O . T 3 s c « c S •H "o « a
CN u - i C O • * v . eg a i a CM 5 s fi
De: 4 ) M H - . C0 > . > y 41 O * H > » - p * H « U U U
4 J CO 4» « r t - C0 > >
: - , M " D - P I
M a i C 5 s 4-t T ) - 3 « C O
« I « I " ^ v . «J i j
s r . . <P4 . . y a 0 co eu
a. co 5 4) en
£ ° - *- c © p-t C a «p* PH v a . 1 5 s j = T I
•a «i s «J c ai «H B m Cu y eu .H v ^ H i u m
. - j o ca
c ^ « » c o ta u <4H > h — t u O
Ä Q • -Ll S "> CO O
^ 41 V u U P - b U J * B " s 3 g
T3 en u O. • * y t »
5 s 0 £ S 4) u t - 5H C C O
B O
u Q.
- P 4
U
y
co eu
•o
y
t u O U
CU
4) O 4-t i * O > —« <a t u M
a y
CM CM 1
o
CL
<
u tu ta > en B w l ä ai % H —t eu o
- ^ y •»•* u « P-I B o 3 »u o o • JO a e u CL « o oo w 5
w -o c ß -u y —' 9) C S 4J O u ^ - co 3 y Q) h i u • * m 5s - H eu p-t u co
^ 0J T> (0 O. tfl - 4 1 CC U C 41 G S >y U 5 - o ^ B - p * t a o u Q O p-i i u m u t j a p - - a c - o v
ss o c 4> e eu • L L g f l | . > U g e
f s t o t u e O < 8 Ä ^
•O 3 y eo y oo >. e c o û t
( M B B - f - i o O W ß - * . t f l e o , t c > . H B «g m m i S y o u x
j s u ^ - H • - «
O 41 ^ i eo 0 u t u - » a » 4i w f-t jz 1 3 6 • - u 00 5s
• O f l C « 4 « . - — ( ) -/ s « TJ « * < * * £ / - N H y eo -C eu j O u u m >
l C - o o a S 0 y C c n y B - ^ * « o S h s - ^ q 4.» y to S B - t f . * « fi U t N U e n * - * « t o — to c " * - » y • * — « C H i M 0 coen 3 W
•p* — o . y J - y • o > u 5s PH « ! -u S
O B "O M a a >4 M -C - C y y 3 m C
p - > y e o > i u - o s s « y - x B w - ^ x
r-l lA — Ï S 5s * u 5 s y a B . • t u A ; C to oo M O B C M y « w x t p - i y « S S - H B O . P j a — t 0 Q s ; u 4 j O c n c n u
w > * y ( 0 • t 4 H N . U B
I A > ca co - * « co • - y S M P H —
o - e o * - i u 3 y c e : 3 Q . W S s B C O O - H C S - ö O
C - Q u O l l l ^ q c o 4 j a a B w 1 <a
- H CM to 3 y . o u - * . fi — T l C B 3 5s • H m O y TT 6 — J « ^ to u x : y « T3 0 u
c o : a s - u a - H e o g y y c - a s u u O w 4 ) B B c O -H W u — K J P * » g * ^ ( o f t )
1 u A a *u co y * x t î y co e y — a w u y * t S * W O S s S T 3 co o c u Q u y u o t a - o - H Q ' w e t u y c o y s o a . - > u to s w j « . * * - œ . »
y a y y s s c o ^ v B • o c a t o u w q y t - i c e u B ^ H O S O t O — CO— Ä t O J O p - t u C L B u T j i u a
a a y y
-3- — i A r s 1 1
CM < f
CM m
< ce
y B
• H
B
§ S y
0
a v
« U
( 0 u 0 O M
y B
— t u
5s U
V
> B
§ s O y
CO y u
a y en u CO O y
B y 0 —
y U . Q E ut cg
— ta — T l U — O ( u B u CO -
- s er y . - s cfl T j B U u 5 sO V B ta CM T l y
1 2 -e * *cn a » C0 ^ N .
y ^ . « T ) •H en a - t 4J « , 3 oj •H 0 JS > • p-*.
• * O - s U fi > , P H
y co u eo y w j -
— y oo 4-t CL * H y e — p^ y to .ps tn co Cfl * J
s - ^ tn . • — — y
Tl Ö 1 3 B u u tt) e n y
B - — S co o m u» to — u C U 0S tD
— — 5 - t > tn » A 6s O B -M *J to * O O u 5s O U u w —t
JA T ) X ) X
— w CM U eo o ~ ^ eo
o s s o tn ai oo
B
g ï 1 S y ss o
p-4 U • * X m CQ a y x 3 u o — O W T l a a y
y « B *H 5s - y C
T l U S cd * CO to
y u
ÏÏ •* 9 c — o • H P-t U t u 1
N 4> 5s u 6 W U -H y co t u > 3
X e r ? S S ** i i . co co
u , * O V co o » y w
w B o « y a. c
X - ^ 3 y t u
CD
X u O
g co
T l B co
u CQ y
y
CQ
CO u y B
•a y
c T>
c CD to
§ O CO
to y
y u 5s — f t [Q 1 -u o y « y > co
PH S B
a « o u >- c -o a
Tt m «
3 CO X - i B 3
S t i H S a
« t u
en y W
o a B 3
T 3
i
y to o
a s w a •o X s
B co — Q P* X T l g oû co y
O . . T ) y en T ) T t
pH y c « co w CO
co u •w y M y 0 c 1- C O — tB — Vi S T l *U
B u
Ov 1
f>N
3 SÛ
c . - 0 ca co y
u 5s u • -
j tf O m y CL —
— ta 4-1 s ^ tn s y
— B - • o —
u y s en a
— y
i &s c 12 oj e
JS O (8 3 u m
u
— > u u cd
u y y to
c — T l B C0
en eo B
— > O u O U
Ji
T l \0 CM 1
en
-a-cn
O B
y
— a i Cfl
Ö B O
— 4 J
CO B to U
u
S1 2 .. O > , t u î > , O
C d L V M U
C t j T Î - y . H CO — « > C — 4 j y o U • « ( 1 P S - H u g o y u o co * a . tu — S o u to
«-t en S 5s B M — 3 V* eo y >» g — y M
co ca e T Î > 4-t x ü B i — x
y y *-> y • * X B y o
5 8 ' i l S t u «p* V g 3 co
u p-t 5 a S to x y T Î y a ca oo c
t u H f | « B CO O u co —
. . t u t u y u u ^ v t î y ca *-> eo . * o x eu en E y CL u «-H
— o u ta y o — s y y S *-> u B S • -
y y — en CM u 3 t u T l »-t •s,, y u c « e n B u "O ca M
0 to B y pa o co eo B
m y j * y y a en y C >
» y o «H to y s , 6 — t u U C U eo J5 00 —
T l 00 5-. T l fi u u y —
sr co to y M 6 ' s . Q « H > — CQ
sr 3 — en t u 00 5s 1
CtS O E C N y 5 - co en J-t B tA C0 a U O
• y y tg en is . oo tn • * 3 V 4 L U ( J * • *
w co y en B eo o * y « 3 y e o O p-< B o O u co -o y tn i-i X •"• c x
4-t to a — y x f t tn B en B S y y •»-*
— — 3 - H u t u t » — u o T l 5 s T I CO Q . T I y — y ta C u x e — y co
ca CL cn M x y u y U O C T l to B CD U — B O - H
T l Q. t u cfl y t u
B U
CM
en
— 1
CÏN
CM
a
• * \
y M 3 CM i
en " s .
- T en
O
c y
a B CQ tn
5s y — C w -
— X « 5s t u oo y co — u
— ; * — O T l y U co CL B
y ta >* > -o y
T Î c tn y fi 0 co u E eo u c o co 5s O *u
• • u XI 3 oo co - H 3 y fi o . u y i u
• H «o cfl t u «—>. — B * , I U U 00 * * u \Q u B -u to y CM O — to y > ] B t-t - H u en
— o O • * - " -
y t u ta en CO B S — ^
— ta y S co X Tl x -H u •
y 3 T l y O s CL y B c
3 u B -f « B s — Q y T l ^ i X X i P H
y y CQ c y a. a o -H co c a
— u — co >, x <u m T3 tn ß e - i * - ' ta u • - — fi S eo y tu efl • •
— u tn en . » 3 3 * ^
- s GOu y ss eo « B y c w u C0 t« 3 — X y
•u u tu ca d o y 4 j x — B co en 5s o a
u u u CM CQ >> y CL y **-. o M > s-' e m y y —
o c <n T Î oc -a — o — — >» c x S y c iA co B > cfl w u o co ta
S ta y u B 3 — oo y 3 — S • - S O T Î 00 u y O b û e û ^ m
X B co S —
| — .. x o o x c i en Cfl c 3 y N w
— O tn x *-» O • a u 3 u o T Î u y co u y tn B y 3 u — — t r S
• • < M W S j * S en y — 13 S Tl to ë T) ta o c — o y
T l — tO CL tD B
S y
o m
i C N
en
to ca
- 122 -

Ï M l CT* » * * i** r * c*i <M • • • •
irt O CM —i f * e t CT*
I i / 1 - ï ^ c M . - t . - i c o r - . ^ c o ,-1 —* m * o
O O O - J • * ( S * * o
rtifl N fa . * -»• m f*">
»•* ~* m o o "•> m • * f» *-4 © \0 o P * CS | | • • . . . . . . . . .
t*» fai O • * «"* O - * I I 9« 90 - ï N H O 00 '
o <r O CT* oo - * O r-I N . *+ | . . . * f» u O 4 > n o N <# n o
O O n N • * N r -
N N PM <s » - T \ 0 O -tf f - -<r CT* > - J O
I I I I I I u.
CT* O f> -* r * 00 «
N ( O M ^ " < * ^ O \ 0 u*\ • * - ^ - * «tf H
I O ** O l I I I
O t / t CT* A v C M O v O « | . . . . O O CT* «o r- sD tr*.
I CM O r* CM o O ** ' _ i CM - ^ <n O
O « * ""» CT* f"* ""*
CT* CM *•"< r - CT* 00
00 -* r^ CT* o ""* O O n N ^ M ^
I I I I I I
r*. f * oo ^ © ""* m O O i-" 00 CT* en ~* O * 0 CT* CM CM CM ""•
1 I I 1 I 1 I I
«» © f » • d ' r - . r ^ p n w " *
O O ^ O « e —' -s « O O *H S
O -H U X M W d 1» O. I I
.3 â a aas
CM O
co r-
X X « O . O . g
» • ^-t *-s ^-»^** t 00 M « o o a
CM O
00 r-.
X X ; & a
a a
ä a ' tStSx u z u u U U
, . s
• B 9
« O. «CM I
ft. X C . m « < Id H W i
O .H > • y » O
I - I v I U H
O
ai CO o
3 O O I T I M
CM •-* O O O »
4J 73
v <o H e/S
*— > en x » 01 *-* y (0
C CU t l V h
K M b ^ ) 3 © f » r*» f - CM < ^ 3 * J a * J > , u j i « o N N N M - Ï u ^ « M - i . H , r
H w U H o a S " " " "
oo o
00 o
o. a. a. a o. a i
0 0 - H ~i
o -o » O -M — »-* o w
a eu o O. B • CM C L w J= X
w o i *e 0 - £ W O . Ü
»4
Z
ä « w C fa
O 0)
x.fl c 2 ï -g
1 „', >» u u 10 Ei] U H
o o u
S f
t O u H
en tu .e
u
u > u
•H CO h J E u u 05 O
Q
! • I r-
o i en m
~4 CÜ >
CL. ( M 3 H H U-. • * 0 -
• • 3 O 0 Z C H t l w O C • • «
• ^ >• (0 4-t O at) « ^ H 9 U 3
§ £ a n u
O . » fc -H T3 n a C O fa -- --
• U-l 00 >. O -<H ! O Ä fa O ^ v ) H h a u » c
« eo CU O I « y u u eu fa
o m u xi u O
.. a ao i i u 00 O i u «u q o *-* - H <u ai u
—t ca co « H —* ai O Ü > > H H 00 <u o -E a> ai <u o ja. K «>
•123-

CM <7»
I C A ^ O O ^ e n F - t i n O ^ O i n < * 0 , - 1 - 4 H N H CM .tf en —t ÇNJ i n
m m __ Os i f vO O CO O O i f l f l C 0 O > f l
-4 O O M •"-• —< u*t CO CM CM 0 - * ^ 0 •a-fi-* w en m en r-t in e_)
V * r - N i T l - * N O O O H -< *0 fM
I I I I I I > t I I I
*rt o CM -a* o ""> O i . . . . *•* in \o >n © -a-
O O 00 o O CM o
«a- m —i P O CM M oo •
^j M H i-< •
vu N M
es CM m O
1 I t 1 I I I I O
N UI < O N O
in N N o> vOiA
»O >J d n w
-3- «3 O O O O O en O* O* -4" in r» o -4 rt N N 3
_ t i n y O \ O o n i i m o o ^ e ^ ^ - ^ r ^ O f n ^ r r * r * « v O u n p u r t p i m i n N o o N co m N N SO t d CM f n c M r - i w i n ^ o N N - l u H f - i %o CM v O > ï n ^ m n
en t n \ O C T N ^ - < * O \ o O O O r ^ n - f n « - i 0 0 O CM • • • • • • • " • • • • • sO
\o < O n w - - M H» û -* o
N N " 1 U
CM CM m 1 l I l I O
N v O M P l M O
O —< i n i-t CM O p» »A <f -a" m en
<-4 CO * 0 * ö
i O O 1 i n i n O <
i a - * • — t u w o ' c w -5
S O - H B
-C CNCJ S ' - w • - 4 * J x &^ w M « i u o . i i w I O * S X « „ I S Û a a t d U
!£>
w Z u o o = s I
CM
» X
« u i
«J (A
<Ü
co
m
-, 4J 8
u
O CM • •
. a o 0 0 - H 1 i - t O
Q . « C M U
«0 3 j j ^
o. x c W 01 « CU H W
CM S
o s . o
O 1 1 CM
in O o o
o o
X * «
Ul >> .-4 <a T 4 -H en u
m
t - i
y
01 Ui
3
X O
fc-
• <
o en 3
0 )
w
3 4-1
X 4 )
H
S S
o
o
C N
*« T3 C
tfï
- S S S i n
m • • O
O 1 1 O
O m
- - o
= *
w >
•O *H fr< c « CO C 01
« U I > s A i » U H td « 4 - ^ O - H ^ 3 O E- en O oo 2 o.
o
Q .
en
ô l
a
p*.
CM
O .
en
a
CM
Q . . O
«J J 00 o
> N ^ O w a ^
i - I 01 • H O B
i-, i
a , tu w u s ^
00-^ r-o -o • • O i 4 - -- 4 O w
8.1
P- S Cd O. CJ
-->. O W 00 O
S Cl ix ,-4 01 00 •^ a o
CO Ui -H H « S y o I 1 >>
*e u u w _ w w - * SK O U O
^4 CM "O
5 TS
> -H 4-1
- S i B a »
O 3 *•* O Gd V
I -o >.
o c o .
ï-8 en O
•»4 Ui O
— i Ui co co
O i- l ï * Ui C
I 4 0) >>
o) a 4.» O C T3
Ä h-3 l w m
o* m
O N • •
^ O CS > H O * J
• r t BJ
00 > O Ui
O CO <J .£>
!ir o
c
*rt 4-1
e«
e o it-<
CO
o • H
Of o
- - I
o 0 )
' J
> T 3 0 0
e • • cfl >% > i « H U i
£ Q . U
o. a > CO U i • • • *
00 >. o O JZ u
»u o. o 4-1 CO CO
<U Ui S a w i
0 u - i f -< i-t a*
n » i *4 U > , H O X 01
- : Q - Cd
u
1 o m 0 )
e i
4-4
a> — i
o
<n 3
i - I
C O
—1 4 J
CO 4 J
« I J
>
au n 0) r-, CM c i
J S D . .
t t i
<n i f
e-i
I -H - >» i o u
0) c "O a
s O tu m
! - 8 " * S^S 0 w Ui . . 1
O -o t l W Q) 01 £ • Ui C CA
2 ° ? 0 * 4 M
ut v y u o
0) 0)
0 > s (0 «-I jtf »-*
•> j s o co •H Ui
U I 4-1 QJ CO CO C
•3 > ,1 CtQ rH C 4-* (U « X c 1 00<H
j a -H - o 3 ~4 -H
« -H Ui
tM CO >% C -H
Ut o>
"O - 4 «
S O 4J e o
I ä . - I T3
^- e i n M
C M Q>
2 5 '
XU 4-»
a J=
^ - ey C t a
-, g
fr" g
O *"*-* Q fM
u a 4 j ta o O *B Ui C «
« 1 Ui &s •H (tj Ut
. > . T 3 0) * 0
o 1 y <r
4 j e . «^a -ce O œ
•H 5 Ul »O
ta » i-t _
«J Ut c
• U CO U i
e «u u
§ c JZ - 4 4J
y >. e u « CO
• (U « > T ) 0) c M e «c
» S <0 l . . u iD S 3 . ^-s. y C y T3 ' 4J 3 * 4 «
, - i CO *-< «-• • * Ui I F < « 4 u (0 00
S s OJ 14 U „ u o ta > 0 . . - I
« H « r^ y U
Ul • « l u ' <U
> C C y Q « i r e
*J 3 g co O i-i "o y
S w
« s >, ai n o a a : j s S v (8 i n u
i C tu al I «I C !" • J= - 1 0) I 3 <u S
•- 1 « 3 ta v
. " C S , y ca o
2 r 4j y . »
| j i - H « i y y >4
! J 3 * 4 u
Ul u CO
I W » U 3 tu y
: o o i u v
O Q C C c •a a -H O ui B O *M
. 0> 0 )
, co S — «
8 •a ^H
i « en I-* - ^ - y
f T ) . - .
• to
e o e
y i-I en
9 * " ^
co co od
4 J CU Ut Ut
(t) 3 C L U
co y
oo >*< e u
f H Cfl
^ H >s
«O ^ 14-1 y
0 CO 1-4
•V A
C L Ut <0
>* O OC
o c
J O 1
rt y
tn c ca
s >> ca
e
3 0 )
U 4
4-1
?S C u e 0) co > w
g.. H H ( 0
r - l
> , ( 0 M Ut CU CU
> c
.-* co y v ^ C 0 •* Û . - C
•e t
y c » (Ç U i m
( 0
y co
CO - H O S
V N —i 4J y
• ï - t . y _
O C0 O « P-. r-4
i-I — I C
z <-* . * > H
*•* « z CM > .
w • • . . T-4 üC
4J u e C i 4 i"4 Ü C O H
1 4 O CO
•o « 01 cO - - . co Ui > .
S0 u t l i 4 y
y c ta a . «H u-i
1-4
3
en tn CO
1-4
y
Of CO
C i - t
W iH 4J O C %
j , -t ai T-t e e •-4 ^ . CL Q -H tO i
•i to u
ZD er 'J: o u
Ul 3 r-4 (0 3 Ul Ul
u: t/; c/; tn crt o &j
§ 3 f 4 w a
o J * c u ut ca
s ' i O ^ 3
• H - - . eo 44 fO
- • H y . i « cei « •
i a ? » -: co o cfl
U. ^ O • ; 4 j w y i
Ä C T ï ' 44 3 C O O co O Ui
E -a a e« 3 .
•Ü Ut 43 • C CO «
C <H > •
y >s c ^ o •s " * y ^-
3 y t0 sO v* '
•g o.
I J H M , f l B y co
C - 4 i 4
IS T3 c y CU
>-, y -H —t u
) 14-1 O) w t g
>> y
y • *
C co Ui i 4 o U4 * CL
> , m y C * c y O i 4 > a IM
" ET5 c -o 3 « O 00 c , v4 en e i 4 4 J ^ ^ CO 14-4 • H en co y "o -C cd ta C CO > Ul CO Ul ITI CO 4J •»-• o <y '
U C J : c -H 4J 3 T3 1*4 • o o c g £ « & " x § g.
TJ 01 - 4 c i4 -a oo to "O y c
•o a o - 4 y u to Ui 00 ui 3 Ci «
• 3 Jd O CO Ut Ul T3 fa a u c 0 0 T 3 CO CO
* »3 C MN <H
T3 * 4 I ty : s y
l B
4 O W / ^ 44 C 44 y CO 14 O ^
«4- Q ' * -
91 H C J - ^ •»4 C C - * O - H -H en S tut u_t ^
- 124 -

(M - i » » 0 N m - * n ^ N « 3 N
1 I I t I I O
ui m
£ » O H O O O 1 • * • • 00 3 >0 if> u"> O <"•
O O N C O n m n
- t f t N n *o <r o CM CM m cj N N «
r-t w3 m cO CM n g\
—4 \0 \0 ïN © —t QO -U tn <r •» . * <N f< c
o 4# -*r r» © er> O I • • • • CO < ^ ^ O N >» OS CM
f ï •>* f l O »Tl >£» - * O 9 9 40 < £ M O 3 c
i f t i A ^ W N ' ï M f t J H rs. oo '*' 00 - 1 O M n w Ö m <• -J tn rt <n «)
9 «*f ^e 9 o *-* < O O H 0 0 9 H H m ^ en o O *ß --t PM o 00
f> n m t_j m N *o n o u oo >
O > N ^ ^ n o. u
i O —i -a* <*"» O <""» © Q N O S
l A CO
Ss f v «
e w
<*4 «4 b Cu
£2
- f o X M I I
X X 00 0Û- -N 00 ( o. a o ö o o ö
o o o o : * - f t f o <-« m
*"•» *^. -x. *•-. ,-< •»««. c 00 00 QJ CL) ***• CU O
O Q B 8 <U H -H 1 O O w w 8 w 44
W K M J= Ä Ä JS v v Z U U U U U O «
r*- u S 4 )
X u t n
o. a o CM
• . . o M 0 0 S 1
v t O
• SC <H . 44 Q , (M fl V ca w b «
« 3 « H 'S ca & X e
(3 td H v i
! CM O o
d i
m o
©
« •H »4 en
i o
i «M O o
d X
>% « o
(0 00 ca
o <y b
3
X CU H
< O CA =3
O u 3
M V
t -
B B
O
1 O CN
•4 TJ e co
t n
S B
O 4T*
T o
a a
i n e s
O 1
O v n
O
I o
o 1
U") CN
O t
1 » r i
O
d 1 O < — l
o
*e TJ c CS CA
CS *4 O H
»-e
f t
•H
«
M
>* (S f l t j
o . . O 44
-». « 0 0 w >
Cd - * * .
CD > . 3
ffl « - 4 v t M
e et) dl CU u
S ' 2 44 JÉ co X f t «4
Sâfi
O *""> r . r * CN iH " H O
O N CM (M m < f U M n I
(fa b b b. fe b 0» O Q. 0> C< & Ck fi<{fa w
~-g
ao oo,-* Q o oo
5 o o f l 2 O
0) ÇU ^ B B cu
w w e fl 03
Ö S M
CU B ^
>, > 00 v l f >
o — ** - t CJ W
ü-°~ Q . ^ S X w U 1 K
o. £ u o . u
00 o
^ o a OD o
o ~» >> _H 0J Ot
- , a o at w .-4 S (d
O 0)
cla
y
carb
m
in
M U U «
Z U U O
£
ï
i » i J
•o . . tl
u z u
•H O - <
g "3
vt (B W «M
co «e •a ^ c o
•O fl o «H >» h
S A >» CU U-4
Ä - u 1 CNi . . s ta
JA u-i e H *o — " o c
35 3 «
W o) CO
• a « U OQ
• H ta C « cd u< a oo
* 4 O O- r-i
t l as C CU
«•3 § 5 ^ 00 *« JZ •9 C • * u
fl W O O as I « c o > - Ä » fl s
i t i e t )
cu 5 3 t u co £ >H
CD "O O > , i - t 3 0) - H U fl U fl u « 3
u co > -o •O fl fl
• • C »H > , U u g a C oa
• ^ CD iTl * 0
os a.
>* r; -ö E o
ca u
Z2, O 3
01 • • B « «J
3 e i W M fN C U IM O 3 * CU - ^ b 'O W f « CO fl ' « - ' » CO
> , O CO . * fl
•^ c S * u
O ^H O *J u O »M -H O _
J l > . « h u b O y e o C 3 B
3 X Ü • »
SS
i o o > ! -rt S.-H | 4J 4J
u -o
i e
Ba 1 3
S 1
i ca v i o
u ^^ - 3 y « > » - H CU CN M 13 co i n TJ çu
* - ^ ^ N . CU i -er m u \ n fl
> SH CU 0 « f l fl
» C I O I T3 B > CU CU » ^ 0 - —
v l cu O — *w . e u o to
J M-t „ rH TJ O « C O (0 CU — ça •* e «j
4) g) (U (4-4 " 4
CU fl > X fl
CU j ^ CU *J tl u
b fl B
>*TJ <D Cl)
eu T ;
5'S IM fl .
CQ <
h « H CU I
•s i.
SS eu eu
4) JJ C «£> 9 3 tl tH co o - ^ U 4) c
o ca
u n V * 4
TJ U O M-s
> fl l 3 ! t l h .„ „ _ | Uri fl y-v u fl
CD O * * * • •
t l ^ o o M 44 <U U
2 U " « O. k> « c
y «H o ÇU C > v t C O v l u
•H U « v4 «-» « c o
CU fl c T J ca co e <u *J M
c y w
fl CU CU 00 tD X e c c u
•H fl v l O
u-i e o CU S
' rH bs u E . ^ M W. O
5 &'
g - *- C B tu v i 3 * U U H "H
TJ « S CU v i C TJ - *
•H T J ^ . fl u <r
O TJ § vt T3 u O I N
>t*4H * 4 U N
eu eu C 44
. . . - § . vi a w vt o — U CD TJ S »
O -H CU S 41 . * U g B O -H
^ a ^ o « 44 44 C * 4 co w c ta . * >
vt fl eu S -s vt O D - Ä B eu -w
C 3 I O o tn -4 vi
t 4 - • * . 44 . * i •• «* fl X « « r*) S O. y C ** C fl
• tK z t i o , a s > o > b
a o h. -H TJ
, w o u •• » 4 N •• u- 00 >. O * i c o x: t- o i t-i o v« « a. ej w l f l v l f l 4 4 f l f l C U j g u u eu M s s 4 vt fl v l ex oo | t i oo > oo o «u iw
O u o i-t vt eu eu
t-i F - i C e u - H p - t e o y - ^ 4 0 4 E ( 0 4
44 C <U 00 44 « O U v t 44 v i fl eu c
eu en
eu u
fl
u eu TJ
eu ce eu « v l C - 4
• M O C O O U > « H H 40 i u-» a. vt >4-t
O w O --i b fl O ou en tn en en a cu
44 TJ <n <
9.8 vt X
m e s
• U TJ O X CU
c e i-H v ( CU a t » c a TJ vt fl eu K-É
eu fl 41 K 3 Ol - C CD 5 - t>0 3 « > . 4
, 0) O C CU b TJ i c ~4 « c i- eu vt » « w | « o > c ) oo si si a, a ) C TJ 3 3 3 <D
§ eu to eu eu
M u n «M eu ' «- >, i « o • • o ' O J i -rf (fi O / -s CA
fl 44 TJ 44 U C CD C fl
cû to TJ **-!
fl en C j i t - S 44 • v t - H -H U O O
4-1 TJ >*- -4 0 . 0 fl
V *4 Q) U CO O a C a a vt
eu o en TJ > ta c
— A >> 3 * C CU 44 M
I g I M O q S o eu
o ct.y-t ^f B vt
CU TJ i-H S CD C 1 CU M fl N
J= fl 44 ] 3 O 41 u i
U C a} i U vt 3 4 j u . tr M u eu -CD «M > , g u
1-t * eu o e ex. co > to ;
eu f TJ b 3 I '—• •* C o eu u fl ex. «M en CM i
*-i m < >* e — fl i i
j * 3 y » u. - t u - H eu eu **». j
v i T J M c >a- i 44 eu *«4 •*-« m i co a co a f i i
v c s -' 4 3 t l ) v t C 4 Î K T J -H
is i -î X> o &" , O 44 eu > U >
ex. eu
co B I 44 3 (N U
44 T J • co eu K
•H a m •
1 ï • 44 3 U 44 * * - 4
o en O f t
CM f i c eu vi en u 44 g TJ x> eu c
o fl b o b
» u- eu c B
i m c fl . • o o I f>4 "H f l
Z 44
fl i >4 (4 f l
h IM 3 44 TJ
44 eu c eu
j«: v t f t U 44 44 fl CU 44
>M44 a f i O U >s U O -
f i eu o ja > u
- 1 2 5 -

00 r-< vO ^ O V • * N I . . . . ~* OOvO sO UI © © '•û ti co
K CO i-< O P I CO N
O CT* en *-« © © tTi Cï* en 00 en en m u
I I I I I I I I 1 I I 1
r-. C O < T ^ O O 00 1-* f-* ^O en r - r -
I c O ~ * e n © © © % 3 ' - T e M u n C 0 - * 0 0 f j O C T » ^ 0 , * " ^ O 1 ^ i A C * l < N < " " ' ( 0 ~ * -iT N n
I I I I I 1
eo en I I A N « I i i i i i i
«O > * © -3- © en 00 > A < A O N N - J <r oo I • • • • • H 3 ^ o o m o w i i N O N ^ O O ^ - Ï I *o (ö en ^ ^ en •
en en u-i *ß CN —' O co
^ O \ O 0 0 B j r - ^ o C M % û m - a , t s * - * ' - t r . CM o> »û >^ o «
m m «a- oo o oo O H « n s û n ^ û c o ™ » r i * ^ *** 1 ^ WW W •—• f 1 !»• C l - * * uw <]> I • * • • • • • • • . . • M M C O ^ - f f O N I I l O H H O O O N O M r t - * O © O . J > » e M C 0 c 0 * t f e M v 0 c M n - 4 so i a H , - * - * — ' C M en -a- en O H N N m
< f \ C - * CO ^ O
-er ao o i oo o «-• en - * i-t - - -
irt m un o i n r-s CM
t l ( A - ï O - ^ O ^ e O N H . O - * f-* «-«
t o o t n o o * * CN en
00 CO t C >J3 - » CM \ 0 *H • eo
- ï c o c o j h U H r t ( n N - * a s O M o ^ n - ï co > <*i co N u H H un m >û <n e ^ r <n N <
CM CM m
o o o N CJ * i / l C l
X 00 • CL O
o
CM O
oo rs.
00
° S o <
e o
CM
» S * - s « o s D . O • O
• O I
s e s
••"'.! B m o 1 "
O c» * - • O O u i • • • • o o o
03 w >
>**3
CMFJ _ 1 Œ « '>— ** ** _
u z o G u y
• H H ^ c o S l i A O « ' ' ? ^ 0 . . - „ u • ^ O o O r t O O ^ f M ' - * ^ -H « e0 • * 32 <-< • • • U O *0
oo n u u w a CM © © C M ^ O O O B J e c u S U A « « « <u co v u —
u U o U h M K N h : ! s * = K N t l 3 o ^ N N M r • • • o ca 3 a ^ w •
£ £ £ CU CU j j t » W > , « "O « U X J É fflOMNNMC
3 «9 « -W X W X x _ O Cd W [d W W I
I Cfl <U Cfl *H <-t OJ ig 60 H o*l CO O H W
O -H »H 3 E- CO Ü EO
j b ft< b> h h b>
a * -v
w >
>N >
00 -H - * O TJ . . O -H - H
co o ^-v o o o o o
o ~* •• o *-. 5n
^ B O
f s ° O. g . CM U U O . W X ! 3= I I
w U I * « >S W CJ
ë K X „ W W
W H « ^
o - i
s s
•6
3 ' JZ . *
xi >o 3 1 W .-*
« »T eu en O
C H 0 ca - H U u ùO > 0 u
—( eu 0 CO U A
u o
Pu
« P O
U
w
o CU
o
tj-i 00 U-l 3 <0 O
H TJ 4J
^ a , FH
CO
00 >s o 0 X *-b a. u u CO C8 eu U g a. oo i
O U-4 H ^ eu eo w -H u >*<-« o r m ,J 0- PS
eu o CU
o U-l
§ u
0 J-l
u • H
B 1
<w eu
tt.
l - l
Cu
(U
TJ c ca
i*4
C
4-1
U
eu oc eu
>
• H
z
c o
en o 1-4
Ù J
• H
en en
c c 0 u en
u
en
2
U
*-> CJ C -H eu T) «4 0 •o « CO ~ -s .
* - >•»
eu c Q.-W O -«4
e« en
•a a w eu 00 v C
<t c > ~* *— CO *w m 1 >N
^ c -o K 3 « C J : >* en s ta u o o
T" I U c i • Ç «H 4) iH eo eu T3 S u-t
£ 0 1 T3
cru
s nd
m
whe
n ver
y r
an
ca <a o >% eu
u eu -H c *H CD C 4J ca o
f t "H to B g «w « . * S <-4 • C0
» Q. CO <H ^r eu eu ca ^ . e >, w u en -H t-i o eu
n-( *J a . c os x: -H >* >. oo s e
eu <-< —« cu • > » - B c
U eu » a "C <Q U U >rl
« en 3 c -a- »- -H 5 ca -a- "O S
0 oc: B c eo en >- eu eu eu ir\ . - £ M * 4
. S 3 O « r^ S a . i-i
| 0 CU > •O H H CJ -H eu J3 C *J
Oi > \ ttj T H U <w ce -H «M ca
r-i U a u **-» c *J 3 O U 0 ••> eu B eu
ca r* *<£> 1
" <r en
0 a
eu - H
a
i en
•*»«
co eu ca c as -* x « ca >- cj 3 u o o eu -e H • - eu a e *•*
( O H ^ o - eu x i « tM o
S * - 4 ccj C s b *J ^4 -H > , (0
X ) 4-1 kl <*4 u O <M W t )
vO S >. > c ^ • • fc. q tn r-s eu eu C
en w > g u as - N . 3 S w >• en u >, B V O U C O "H
Tg 2 1 u ° •O m * j . - — eu s _ * en • * eo »
•== ^ w • *i a B X u u a 3 5 J i 3 O U h o u o- eu o f-> o c c
A M v e - H . . J J £ 3 B u x: 3 T < ID m h T ) eu v . —i as o eu C g *o ^ «H g VJ
S •« 3 *-< T3 eu 00 eo c V4 •a- b c ca g C
-«* ta ^H e ta
"** 1 ^ i " ÇE CO 3 ^ u eu
un w o o u g | £ u g
- c CO 00 |a ce «J .-t eu eo
•o UH O eo M-i a) y i-I
<j <u *a • - u •s. c t ) e co -H ^ i-t c ca eu >
«4-1 «a I-t «t-t
>• c s . * 5 . u un o 3 o ta l B • * -^ eu
•O B "0 *-• C *•» <u O eu en •** u a* u B «M eu
! CU <PH
C t l > . O - i
O > w u - i-« eu "-- >*-u en ^H ' - ^ c
eu - ^ * * S w - * o O u O t o f l - r t c n g
u « S ai > —' B
* H eu >a eu o . i u o
T3 en — V-C co ea eu —
^ « H IU > " v* a , M o eo <U O 3 O •a s ^ a. eu E
• H C y-i ea - » *4 « a
^ s ta s • . • o u s - ^ - H i-t e
j r-~ ^H e u ^ ' Q eu CQ ^ m c u | >
1 I tW * 4 «4 I t«
c c '
c c - o -- H n i eu < ta c na i
u - O - H c 1 W I M ( t I
eu < O eu s*. >* i
•H a L ^
un t j eu u i
c »,>n ; § *-J eu eo
Xi -u I S eu « - : o j a i- u i u o <u en i
)M *C -H '
** i ' en ca d O
i en 3 i f-t eu
eu eu eu u c u eu T3 X!
| «w g "S < > ^ s . . ^ eu c c
en «
en u *> * eu
X i >< eo * J u c i 1) y g O
^H s o . u
en
w o —
§ : i ' " 8» O (U ^ - v H
i IM en as i e > i 3 co un : eu u
*j S eu *w u "--u-i u co X ! U • *
to O 3 * * d en
3 O w y S ' a y s c —
— «-» C - H H • j ä U-i U O
m u . O w -
(M U ^ 0 0
e u ^ s ^ H c c g ca
u O O O sO O B^—
_ _ - u -H H l . J l ^ > U W U —* «-» co o *W *-» o a . t - y B >% co nj
.* 2> x: eM 6 "H t s u
S H » U c « en X i co en
• s r c « i o
o ij U H e ai y -Û
S --N c N O h
H - 4 S u m
O W u u i
ey - a p i c c £ i
cet o >4 ca eu M -
« o w en u eu 4) -H C Ut -H o t) e a u
ca eu v x & C -H
—f * 0 T3 »w C -H :
<0 C
& U U M <
X! -H CO O
T3 10 en eu ,^-
c ce S o - a ^
* - i > . c eu u c - H c x g
*-> u C en —»
u eu ao eu
- H ca 3 i - u
L » « Ë C p C U y _ i i - ( u eu O O X i «-• i-H u M to < H eu eo
X û . . » - H en * -» ^ i (0 W T-t *-• cj eu u c * a « o c o co "O - H
—t —t o w eu o X I «4- u * J t - s
ca - c u u - u o eu es s eu
• O - H s c o o o - H 6 a u «w
eu eu • o u c ki ki eu - H co
ca u u T3 ce «-. ki ce co c »-t o i-t "O TJ CO CL CO
ki w < >> CO ki eu c CU <-» 3 > U O
kl C - - X 1 . o eo
§ - » x : . ca en
o u H y eu TJ
C T3
> O eu w '
c c c c œ O
8f 1
B 3 O ki < H •M 3 4J TJ -H C W •O T j eu 3 C eu eu x : eu - H u s 3 <*•» <*-
> «I C m c <g
N-/ flj I X i o o x >
C C 3 x : 3 co eo en o S „
•H kl B TJ X i **- 3 TJ O "H eu x : T J ki co en çû
M eu S M TJ 00 U TJ eo TJ
4J U O eu o 3 •* u
eo C eu eu eu u C
k i c a e u u e x : o * H
u "U b ai m ) a u
-126-

tn _ i •»» «-* o ~*
i i in • * ^4 sr i-t —« oo '
+ 1 o > o °° 9 N Q O C 0 4 '
CJN CM * » 00 - x y . . . . • *H
O f t i-t » I CO U . ^ • * <X en *•"< *J
r* o O r-< X
«n e n m p H . p - m i A . - t - t f ' l I I l l 1
m m
I I I I I I
-4 un o <* ~ c** o o o ^ o o o m o s + + f» | . . . . © ©
en pa m CM CM -< CM ^-* -4
00 00 i n X
CM . * en ^ n e i o I O
en oo eo -4 * * O O O •"-* Is* r** *n
.-4 CM CM - * U"\ « *
(*1 r » m CM N
• * irt •—• *-4 p - »** O 00 1 O
N ^ i r t - 4 \ 0 r i O O H > C C O N N - J
CM «s« en « —< -a- -a-
\Q i A (S) 00
N N H 00
.H CM r - 0 \ < t r*. . 1 / 1 - H . . . t r i . .
• flj p»» en »-• 00 sO en i
CM «c
S X 00 a c o
o • • * *—*"** ï
«0 00 u O O B © O w
»4 x x x w as e j o y y y
^ - w w « K w s u u u u u u
u u ï ,
Ed en I S !
Ut m o Q . O • O
• O 1 - O 1 «M
fi 1 m o •S o o o
3
S I S & H w « O
a a e _
o O trt m • • • •
" Ä T* 9 i-S ui o o U 3 . .
( S - -
b U K s 3 9
S X C > V « (B
H f- <n
e a »n CM
? O
m O t
E
§ 6
O
*1 O 1
i A
CM
d t
t
a 6
U I O
O 1
O
o s
f
M
t l
C CO co
1-4 tO 4-1
0
f-
K
u ^H.
CA
M
, - « , y o 00
>* J J
( 0
c 01 •w
X ^ «3
i-H O
3 09
Z co > »
K
0)
u 3 u CO
• H
1
o O CM
E b
a t b
a
en CM
Et*
a.
p«.
CM
Cb a
p«-
en Eb
ex
CM
-* b .
ca 4 J u 0)
O C
Û . J 3
co aj
>» * 4 r-4 •r4 J J
b ai
Cu&u
al J
^ S y
o m i
O
7 8-
B. «N O.X
w I 1
Ä s e a, S i
- * o w o o o
! « V O <0 W tx] f-4
> S U U U
s. o
o IM U
n y
•»-I
a >» 4 J
(U M 01
X
a
<X
o CM
n CM »
55 B 0)
- a 00 ~4
• *o a «
c « X 01
> c o
s* o o 1
-M — c t l « eo o y CO i-4 0)
h .M • u y
- 4 co o 0 - H t * a o
- H y X «8 -H S 3 u « h a
U ts 03 •O <-*
u - a c u • H i-i as O
u g >* b « 9 SE >% a j = a« «M S 1 — *M
•H 00 » 3 0 ) » B en C H "O e 0) 1 O o w m - »
c to
•H *^ - 4J Î K f - l u . . , * q r a. g « n a a s u C H b q
- H O o u l u M » >M 00
-^ C o a <H o ^H b 93 «J ^ t BJ 4-t « y u y eu
> N X
a at
u . H -H ( 0 * 4 n . 0Û y oo > M
0 U O ~4 H H CJ H <l) i-i O » O Ü
o y Ä eu o CO Ed O O J
o
»
^ 4
00
c
to
3 T3 ts 3
>s
C «J OO^H
0 4 J
fl) «w
0 U
u
• H
ss
o u y
» 3 r-4
0 ) 3 CD to 0) L4 O. 3
U
•o ot 4->
c to • H
& 0) (0 3
- 4 * 0
a
o 0 )
s s l
I M 01
> * - H
x: eu
y oâ
1 M-) 0)
•rt 0)
«:
C «0
<-4
C O
1-4
C0
y
oo y
>
u 00
C0 0)
o u to o eu
•o c ta
0) N
§
•O ~4
tu at *9 ' x i- <"
oo ta y c
* < H i H CN >> f « v Ü
.Ä!
ss • - ) A} • - ( y tg , I t x c »-<
•O Ä «8 iH Ü « 3 ' H I M
X os w y co y-t *o ^ «
2 a c -H 3 ••> eo i-I
y *H « t ) x y ^
* • tu a c o *-» S 3 «H O
Ol w lu H
i X 4">
(0 I M ^
.2 g
5 ? «
CM y • — C ' en -H
i oc
S '
M § ^
m m
".1 o e N
m -4
ta «-4 X
1 5
o . en to V 3
S 3 « 1-4 -O W "O O 00
1 e . . >. m C « 01
O - < -H
B u " 8»> U J4 - 1
• " C
t l u
10 ! * U U 0) V
O a «
>. u, tO Qj - " TJ
" 1
4J s
y y y
v a 43 o» — > i4 ^
o y < U fi. N
X ta
2 y
I -I > U
- « -4 U (A 03 ' y M U O 4J 1
y *-N ( .8.5 S:
- > C 3 B
2 oo B t n i
^4 i *
2^ u i C 3
u m u m M l*- | „ cg >i CM B
S -i in «s e
SS tW O M J
» CA
to l ?
i 4J y ta O >N»*- I * H i n - H
O T3 C ta ^ en ,-4
u-i > . to
oä ^
S u
^ >» I 4J
y ^4 &• to
O « B U B en y B -H
» 3 «H
B M " B y O
" o» B w <H 3 ta a o
O g) . M -H
•° g'
fl — ^ en
B tu
B O i-t >% ta
" to * i B O
1 M T t 4J T3
- * l x eu
o y 4 J M - 4 <
>» y a -S* y y a -y ta "" -" > B c 1-* CD as J ^
w »M w > - y
o ts
. 0) c c
»•§12 .
-H >«
» m
co no . * en co i -<r u en ^ * O " * - iA O -a-u en g
51 * to «o B "O >s . . ^ * H X
l e 13 .C
i * &.. o » o
•o -H s U O M » . . C
tO u o ai 4) —* u • * 0) C û . o *J
S - 1 « P 'S to t u " M en 4J C C
«! 1-4 JE «4-1 •* iw y x 4-* - I t j « • * >» u 6 O C U eo es O
-" ' S! a
> * y co O * i ß 4 j y co - H * o
u «4 >u e y to o co 3 U B >%
•D « u b •g C m U
>» o « > oi -< ä x ~4 X J J y ta . • y
X > v 4 l l u ••> o « H m U rH X > > . - l o . y «j u ta
•rt y J-i oo — w > y B E « - * B
• H O —-H •H ^4 • * co e u 4-1 y y U d M M y o a s o ß s t i u a < H
o y *o j * « H a y - H y w B c
x y y
i l
£^
tM O C ' "s -
J) B O w X
B w
M 3 X 00
g u
B
. . 1-1 oo . . a 4J O Ö M ^4
<-4 .-i B y T3 .
C tu oo w y oo y co -H C - 4
tfl <*- CL T 4 «4-1 - 4 ' O W O <-< W C0 O M 3 • - • C0 3 14 h
bJ t/1 t/ï t / i w O Qu
W > . a 3 rH 4J 4J g y x 3 3 OOiH h - H - a
^ • ç >MK < CO M M y 00 >
Ä * i .5 O « 1 ^
y y u B
• x *- <o s S. S t : y i n
• H y i u x 4-> to *J
U SN O ta M o o y s
eu y > ta
SA
M y "O «4-4 H 6
O tO
y y te
> C «
— « H ta y oo U -O B 3 e « U 4 S U •
e u -o S M '
4-> -H CO 00 **-. X
>> o b u X y to > B ^4
O t ) . • 1-4 - o
•H > » T ) * * • • « J E B «
• ^ «I U 9) U 4J b O ^4 to y »-4 y 4-1
•H B X ß m
2 ° . «* > B O b iw -H
to 4J -a- y ^4 >s y " * * to a b <a <r y oo y
c ß > « ce: ta ta y >* oo i . . y m B X u ta
• co 3 y B N B 0) } H
• * - f 4 ^ u n e -a <H G0 « Ä m s- o I in u
B X
y x
w b 3 »u u->
y y b y S y 3 B * ^ i « • H « oa y »u B S
) 2 >, e w 4 U b v
j 5 t - » j > , ta co ; j i ^ x i-t : ü B ta
> «H g B y
x « B
Ï w 4J B é «8 y • * i H S m v
3 y B 3 » C b —
; fl eu Q *0
i ta . E O.T4 y ta
B y « co •H T4 b lu u ta ••>
CO O /-v TS ta u y C H N ta a 3 1-1
tu CO y -o >+* s e B
•H «J • * -H • u C0
> > « s
b u o y -r* C U O > w ^
« g i OO 3 CM B » tri O U 13 -t- co y *K •U» * 4 B u i tO Q , - i
g B W O
g S B ta j (B y S 6 J O jÇ o o
^H 3 y «H J 4J 3 >. a « y 3 eO b « M *->.
• - • *4 y u y . D y (M b c oo a o o en
• * O O. y | ^ ß u en a o y B ^ * B • - y ß o -a*
4J . - t « H b en : eo X W-4 i - - -J S eO 4 S ^H u - a . - O b B B O
- « ß
X
(0
s
- 1 27 -

CM - * W - * CM —! - T en * J l . • • • ao fO o r» m o O <r en oo
O o : f ^ - s - f i ^ O c M C t e n O o e n
I l I I 1 I
f t QOoo • * O N - U en s I . . . . oo c Q N M n o o -3- CM *ô
! N N O N H N t O O O X N O C Û J ^ r-< ,—( t—t -H M> «—I ( O ^ N U
1 I 1 I I I O
in oo i en -* ^
oo u « N •* o -• t o o o
CO P» o * sC lO a
• —iinr-i co o ^ f l < " H N r< m ui «3" -va- en en
W O N Q M O O N W - Ï ^ N O o> o> oo CO CO
00 f < O r*. CM © «-t CM m © so "^ co oo r-M
p i ( n - * o r » i o O r * « . ' * » A f o *•* f t ~«
I A M n «n o> ^< vi
-« O O co O -a- u*i L t w c n i A - C f N - a - « * ' - ^ - J co - J N N r* E-if-* f* «ri m in sj ^ s j P I M
C0
w -3- m en »o- —t O i
;> co
i f l n O N N
> >
m
es
'S"-^ O •*— c *-^ N X ! CN
• M « x M O. 1
x o ea.
r-t KJ t*i 1
"B" u
o
•g s
X u a . u
K
CJ
/ - N »4
Z O
CM O
co r*.
X X M O. Q . O
• . ao o o **•» s 0)
a
o u
O
a «8 60 u z M:
£ O s s
£
t
ea SE
i
<D a 0
f t M CO U
iw 0
i t o
u
( N O V -
• • 2 g 00 r - « B
4» -X X w £ a. a. ft. o . m*ï . d
K H C C fil f t O
• • X *H " M 4J O. CM to a at « t» M u «
« 3 _ 01 «j M *o
« « w y « ca ro u H «
a a CM
O O
o w»
o o M
.H f t CA
1 O
1 CM O
o o M
>> CO
O
ca to 4
•-H y
« M 3 M X 0)
i o
^c - î Q 1
en o a • CM V tî ** 3 *J TJ X C
E-t en
i o m
d 1
O
e e
u-i CM
d i
o m
O
a a
o
*t o
1 i r t CM
O
a a
O
d i
o
o
B-a
•o c co CD
<0
O
** AJ f t .
CA
* e
*—\ 00
w >
>*^3 4-1
* f »< (0 C CU 0) M
•O 3
>*.* » (0
O
i-t -H
î â
o y •*-O en r^ N CM
O CM CM CM en -3-n 1 01 o f*, w (
* 0)
e o w >
>s > / - \ M 6 0 ^ - 4
O T» • • O - f f t - t y * ^
§ s o a w x x » • U 1 K
o- £ w a-cj
0 0 ©
o <-* o - • -
-^ a a
f c o > t . O
CO M f t ca y y i i
M U CJ C*J u
z o u
CO M f t
a o o 00 CM
m
f * {fi
2 C
-S . TJ
» eu
«a
ao c o
e o o m
t>0 C
e CO CO
a e <u O X
« a . *H CU CO iH
CO — J2
(3 (0
N C
u a . 03
^ c
IB 3 Z >%
•-t o >H u a .
0) 0) 00 o
u
frS o y-i > 3 O o y 4J
B
frf *J 0 «J « I f
- 4 -H y
a >% o •
Ä l - 0 a u «
s g g OO 1 1 0 <*•" *w
* t Q) « CO •** f -^ < H >-•
a . as « :
c
»- i CO
ta CO u t s
cu en 3
T3
CO
"*» ±J «J 4->
CU 00 01
>
3 to m eu u
1 O > . M -H
c *-• y c » - ^ •H C -H -H 0) *-
>, u • a
^ s ^ -JT
*^*^ >» ^-*-a pä ad o >* > 1-4 O i n j i
i i * •O C ctj eu 5 ^ H
• c P 3 . ca u oo c - « y JS i
CO JZ . - • H 3 *J 'O «i 00 "O
•^ a> S
iu5 ut T3
d e g < f -n
« - o oc ui e >« -H BJ O • « ~4 V
. 35 M -
•O CD -
a w CM C * - * O -H sO *4 1-t
os eu > , >> C U O 1-4 01 ^ i * 4 > 1
• o c « 01 O u
P - a ca
0 eu C y "O
o - § U '"^
.O *J . -co a
CO O O - t a - H
>. 0) CN • * i - " ^ tn 00<4- 0>
f - t
JÄ os *-» t-t >4 U
c o
ta o o • o n a
> v
c 1 ë o 1
O C *J
a e « a o co s i m y s i
O ~4 • * y - ^
« •» oi * en 3 co ~ -
c o o o> o c X u S ai
0> r-l y c o .
- * - H a u t u ca co ta ea > . ^ - ^
F H h a . eu • •
> O •D -u e ^ co c C
>N 1 « ^ J i 4J U . . . -H
i - ! (8 C0 « <U Ç ta u «
• U . JJ u 0) Cl £
•H ß U O -H O B «w O
B C C CD
£ 8 « a a c o « CU U
*H f-i •O * ea q m 4>
fi o* ^ t-. u y
- a . . ••> co eu ftt u h G O 3 -H O U U-t M y
C h c u eu -n CD > «H
>* y o
CD * CU
&2 •O *J
0
- a r . * ^
sO K — S- m O — os 1 ! "
T3 i f !
« • £ f -ta v_*
2 e y 3
. * u u J= to
c « •s eu
^H Ä
« •H h
»4-
OJ u 3 *J y 3 U u m
eu
1 5 . •H «H C - o W eu >% i u t ) en a u c tu —
eu - -^ " eg u » es B» X i eu o u O oo c > - a O £ B c m f t j i O w • g l «u c; « h o o a - t - n e g y a ^ - ^ s ^ f t eu s
O < * W CJÏ U_, C CO * o en o) •<•*
C0 —« > • ' O I M f l eu . . o c c U / - N • 00 co EQ &-. (0 o eu o c • * t-ft.NCooeucuu
• H u a c > o , cu to eu u <H s d «-t en c u.« C u
: x - H e a <u o x i j r f y o
•-t •d 0 0 j 3
i l i -CM « "^. CD t n
oc y
& c O -H I - I U
U
> * T 3 U
* i CM - ^ ^ "O
^ i g o O u
' S •o e eu - * ft, U4
e
£ S » a 2 i £ i y
„c * to <-*
•H U >S M Ol -H u 9 oo a
h ca
3 00
c (9
a 3 •H •o g
•o c CO
eu C
U-l
eu c
•H «M
>» 1-0)
> eu u ea h eu
TJ O B
• o a co aj oi o • -c a ^ - " - t a > y > . eo y M 4J
m . . - M > , . . - H CU | O . - U - i c to > C N u ^ m i-H -H
«M « e ca u > y K O < H V . . q 3
>*CM iH Q > CD U «O
*- ^ *-» a c oo c 01 -H . - o3 O > c o c n c j o i 4 j * c y
C C " - * u 3 eu > * o « 0 c n 3 y ' D y C f* U 4-i c • * e ä * j 4 j p e : y ^ g w a 01 > • 3 co O 3
u x : u i ui ^ u co • • O « « *-» y x i U 4-» C O r * CD 3 T3 o) o o j i en >» S y B * > * eo x
co > i ^ eu 3 c e w y a y s 9 O t t O u-» O
£ b C M 3 — 3 < t t c f l r M X t eu — e s
**^ I M m u - o u ^ r b eu . *
• ^ c a a . « h a 4J « p a i - t u o f * co H >4 g a» ea. ta ca eu X» o oo S i -
H [Q « ^ C g 01 a eu ' w n c 3 c
c • » eu - ^ - H
C 00 w 3 3 ï eu ta c o o v4 a eu
g 0 u T j y c > % B * x i e u f t c - H
M a u o T ) y TS V M CD S -H
M n e u ' o e a a e 4 - i c o - H c o c i H O t a t o x : u - < * o co o . u to
y 00 »r* i
- . s f en
0 c
eu i - *
a i co
0 u
c 0
•H U -H CO B co U u
! 3 •H C • g fH
B CO •w
o - c u
o i C - i
f < "O I M eu
a >. e o
§ " eu
• c
U IM CO
*H g»
S (O a
CM
^? » CU C i - l >H M O u . - • o
- s
^'-^ u -a-- o ^->
< r CN •*». cri «x» > -
m
B w o c C o
u C X I 3 O J= u ca
X i - H •D
x : TJ ta eu
•H 1-
>, ai AJ u y oo e
^ 4-1 u to
« - TJ * 0
y y •<H U u 3 ça 4-1 eu S y c CD 3 fH
• f & y., M 4J o . ta T j
e eu > N co CD ^ p y eu eo O c O f t - f U X I IM
•O w > , C CO M eo i-t eu
3 > a oo 3 C > , •H CO C •O ça
i S ë
00 IM M c eu O T3 3 u c M eo e co eu
« x : . * C 3 a - H <g <M u O f 4
U tfl > i v ta « > i_i
CD
1 t ^ « y J* Ï
u
s y o T3 - - M O . C 01 M o c te eu y - H c
»M * i - l y u *M
• H > . ta
3 T3 eu g c ea oo > S «a U u-i
• o | op c y >»*-4 C o, c
^ ^ 2 -e -* ^3- M 3 IM 3 en 4J
o , -t ta ai >> —1 tM M to • • - Xi eu
0 > . ea >
1- f t M > , eu eu y « M c
" -a .. •. a . - B <-* M tO tg 4J 01 • " y to to > en W - « - " H y O O . * t ) û . . . a tu i-t
0 u « y u ~4 s C to - ^ M 0) M c en y M co o 3 y o f t ea w f t
•H O ca co 3 co f y d > . c
I H o .y -1 ea - J ^ - H y oo
C TJ — o c to u ta (U M
f i CD > , 4-» Ü i j o y O 4J v4 S M
4J CD S-N M CM (0 -
. a M K to to
•H K M O > - C B U*l -H
. -H C
^ « £ IM 3
J£ y co e co x ; u
r t t l <H X I O . I M
M >s y js - M M O 4J
CD T ) »H y x : x» s M M en eu o o "*•*• *^ •*•• ca. g en ta
S f t — a co CO 3 4J 3 > oo eu
f l TJ o d 3 t î d ^ co i j d w d s a y
4J > , 3 £ c a y f t 3 O 3 M - o B M oo eu y e x i s - f o a ^ M y M t } (D
— ca d ta • > , T 3 ca . - t
CD M o , y f t > , o W > u d - o 0 * t ffl-H C CL U > IM ca
y d
T3 f t
d CD co
co M O O M
TJ CO y
Ti
CO r-4
y
> ca u 00
• o y
TJ d 3 O u
i 3 CO
S a o CD
CO
« M O ea.
S 3
TJ y a d
i B o y
y 00 i A
i
-3-en
ô d
y w ta.
l CD
CO
CO M U d
B
y
> 0 ja <o V
JÜ f t
ta y 3 C
•H 4J C 0 y
TJ c CO
TJ y u y Bp
«
y - o •H 0 TJ CD
w > , 00 U
•H y c a f t o ^
i-i ca en en
f t en y CA
y y to
M
en
co <H y
y OC
d
et) u Q
y tn d)
y
f i <M O M BU
- 1 28 -

oo —* <•* * * en " O O O *•"• co * * CM
- i O H ^ r t O N » I
r** CM • * CO CO 00 I . • . • U O f * «O o o aa »n
m ^ O H - «
O O O **"• co CM o
« N < f flO^Ofl
s r«3 , m-t f c>ao -» , 00 i - i co CM o oo co * o
• • • • • • (0 - * U* CM O ^ 00 4-1 ^ CO fO CO CO CM C
CO CO
aó CM oo I I I I I I
v0 r*. m co as ao o < N < • i . . . , O 0 0 1 « u i - » O ~* « U H
O t n vu N • * N * ƒ
I i - * O c O » - H O » - * « 4 0 t J O , u i - t _4 —• i n >c H N i A N W
Q O - H Û . 1 m - Ï O ' H O O n ^ f l H O ^ v O ^ O C O C M C M - O
< © ,-4 . ^ _ | l f l \ C C M U - I C M M J
C M ^ ^ C O U ^ ^ ^ O O ^ I
•u m CM
cg^-icO^CO-tfCOCO,-! —t m co
\0 -* >J O fl O 3 r* N in <n N irt >y co co co co (M V
r-. «£t <t • * CM 00 -H • ffl M oo vo n n » > iTl CO f l CO CM *-< < ;
CM CM <o m «x> o .
co r-> o * e O I i n N i
(U Ui 0) vO o ca c o B « « w e y O O >, e u o ^ H W N u
B 3
fr 9 -
s s O «H
cd o
U w O W O «"* B - e N Ü s <-*><-'« " x « ^ w *•*
CM O
00 f ^
X X 00 o . a o
o » » f *
V * «*-»"^ 2 S 00 00 «
o o a o O w *-< <—i
x : CJ ü o U W X s i ÇJ U «
«0 X
£
CU CU
CM O h • . u S
00 N 0> H h
X X O.u-1 m a Q. o C CM • • O - - » S O
•H * * * < 00 -H. 1 4-1 iH O eg • • x y w u Q. • CM
<fl (0 <U it4 co g ) u h K O eg 3
eu ai « * o S « 05 CU M C ™ co si W v eg
« aa « ti3 t - w
1 CM O O
o 1
i n O
©
M
u r-t •u.
«
a a
o 1 CD
CM n O eg O f H
• CJ O
V X u
3 >*. 4J « M
t - l V U fr-
e i e
o O ""»
-C - 4 O Q 1 1 W O O 3 • •
CM —• V U 4< ï 3 U t a X C * « <a
H W
S § a a
u i O CM •-•
O O 1 1
o ^ m CM
O O
: i
t :
a e
m O
O 1 * <
o — ^-t * a • c
O co co
i •H CO
ï u O H
« u •H •H w
»4
^ y ••
- -» CO 00
w > • — .
>» a 4-1 •H M 09 C 0) « U
• a 3 u
SsJr. to co
•H U iê
O
b a .
O
(M
bu a .
CO
CM
Ct. a
r«.
CM
b . eu
r*»
co
b û .
CM
-<r
[E.
Os m
CA O u B u
« a . o B) C0 «-s a J M
o
^c-o u a ^ •H CJ » ^ 1-4 Ct) • H O B 4 j r o " w b 1 CD O «
o . ç» , w w 2*
Ë. a
•—' OH
o O
CD
a
>* ^ N U 00 *H
O "O O *4 »4 u
"ïr * eu
a • w X i o
B K S u
•^ a.*o oo o c
o h m
T * O - »
d IS1
c j O
3
• y
.-« y pu -^
uB •H CD
rf o
S3
(0 - H 3 U
3 Z >v j r eu u
M - - ^ . . M U O «
**-. .. ^ > 0J CO c ~< o M • •
r-4 O CO -H y 4-1
•vi (Ö 00 > o u
.-< CD o to y Ä
u o
4-1
O
m y
• H oc o
—t o
o
>» « flj X ! F H ^ O . 0 M bu
v* . . • • 00 >> O O Si i* u a y u n i CD U S a . oo I
o **-< H M 11 ta co - H U 5 N ^
^J eu cd
V* 3
•H "O B C
01
o - ^ CD C
§ ^ IM C0 CD 4-1
-H M 0j (U a : >
f H
S£ «H X
ï 4 • • a o x 0Ï V c
•H c o 4-) 00
CD y C9
<4-i 3
4J • • f-t 4J y a v4 4) -O
*-t O • a (0 C8 •**. V* > * ao u
V c a . f 4 O ^H
• o CD C
<H ni M
' O
>s
w Ü CD
«u IM
W CD • H a . X B
>-i
00 • • C os
•H CO -H (fl CO - 4 V y CO
a) CD 00 y eu a c
U-l ••-( u ca
U 3 0 co < • • * 13 4J Q- CD B
y --4 ps « (M 3 CD y P O - * . y^. ki C O .-4 fv. ^ 4J <H . * ^a >»
S O I M I« 4J JB" OS CO ^4 - r - t ^ î >" >N >* « > , T 4 O O K i h M U (0 H *-4 >> y CD CD 13 J3 1 O 0 > c
•O —4 ^H -H CN CO U
X : CD N H r t ta e h u-i CD u 3
S 3 5 - 5 55 S £ y ( - 3 4 J - o O B c ö X I 00 CD - H _< . . C 3 c 1 / ^ CD u £ d co "O - * 03 m oa c co CD * - - u
•H « H s « Ä -a- rt g * 0 3 x : ÇD n O
4» T î O «J w > -CM M o y te 00 y m T j ^ a - < oo • e .a- j£ u . . i . » r>. «
U *o tO « -" 4J - w tf <D c m u v n a > " t » ( 8 ^ 4 0 * * -H C 3 O D . O t*1 Q 5 -»H
U c t J U ÇU
bs - r t I M co C O - ^ U 4-1 <H ä *tf ^ »
• 0 » * >sl4-t M CD •H O i CD os co c
^ ^ * 4 h a o ux
s w > S y * as <P4 > , ao - c eu 5 - - q M . e ^ s ^ - r t e O aj 4) 4-» o h w « i ^ S > c o B > * ' Q c a i M 1 T J S 0 —
• O C C D 0 0 4 J c M , O > * CD O 4.» B y **« Vi
a . a « C N a u w a w e . . . o 3 >
O gi 0 g i 4 AS - 1
bro
wn
t),
c ; m
od
ra w
h pore
ans it
d
-10Y
n
med
tr
on
g
( l B < H t l M ( | Q l 0 x: •* S i - c 4-t o- S
• 4 B H O i u £ O w > , u u > , Ü CD CM . « 3t 0 <U 01 b N g) U V O 14 » 4J 0 0 » * CD <-*«-" B 00*«« CO
H >Q co u k< J i QC 4J t0 > , ^ tO «I i - t a - u ' H k . - o k i ' i - t T )
c o
a
u y co CD
•o
4)
«H «4-1 O
c O O Q M V C c O Q O • O ^ B « - i > f l J t ) B a
B B U y
\0 m co H i l m
O —
00
O 3
y 00 -H
u * ai u i g
CO CD "O O • *• X j * k* 4) 15 CO
T3 x ; 4> 2 P c
B C > N - H
J ^ IM
co co
o o M T3
J- 13
V C * 4 Of h «-4
a o .
- t .H C « — û.*t> -H O 4)
S T3 W k*
•H 3
i S CQ
l£ $ I U-l I » i •*> CD u CD «4-t
4) i-t
tfl I H y O M-i • 4-* > B O « H . » ^ -O * j y-% C u U y 4-> 4) CD
k* 3 O 01 a u *
t» O 00 ' O) to CO >»U-I
r-l ^« . kl 3 u - ta ce) ao - « • O 1 - 0 0 u Ü
73 | t0 >* , -4 «H -O
. C - * o c
4-t 3 t*-i y
â « * H - H y i s to ö CO * * * C3 O C <H
U 4-1 < f g w <D C 03
t CO
O CO O r* <
I «-4 U I U H • < . -
CU O iH «4-1 ! c e |
IU « I
i S Q . I I 4» B
«4- cQ
O
e-T CD CM
• - C OC 4) to > - a
H « O CO - H - 4 00 ki & e « a - o c x >, u
•H (fi U U a w o
y c 3 co u u 4-t 3
co y
>. >. jt co y * H o u
<-i Xi c
• H
03 O 1-4
3 3 00 4> B tu
« 3 3 8-e > , - H 4) O kt 13 t u , - i
C o -
13 ÇD w 13
!S .. t u U O
13 > N B
Q CO 1-4 W t u
m ß 3 o co u -4
U « U i 4 H <H S a» o>
B x: 3
U û —4 (Q 3 U u en en en en o pu
O u S«, B u »« y U co
- > OJ kt > 4J >%
s e x :
s I o i l
»H w 41 4) CO iH B B C k l O «J 3 U CO ki O O
c u u S O • • X i u ca x i - « *
O B « S U - H aj O
XJ »u f-4 lu O . t -1
U ki 13 13 _ - _ ta 41 o B u u en i 3 > «j m
u M co O O l * N i O Ö co cO 4 u S 13
CO OS 4 41 > , >^ I B 13 kt O i
•H B CD i-t l *U <0 > N_r I
y - , ^ r - H
4> «H CO CO »U —4 00 • "
3 I PS CD
?» « *-* £ b ki u - ^ O 3 > >»co y
- f t ! 09 3 . U u v o o t j n u ^ ß O to CO >% a o» - » . ^
^*»-4 co «y ai k> a . o B oj g as —*
• H > a > . x» t u n o
— W , U H T3 C0 * - ' CO C H •• H cfl ca O B 3
ki u 3 oo v y 4) V O B B H B c e k> co
•H 4J " 4 H O X* -IM t» «u B —i g
«a u j = 3 > . H S*, 4) -H CQ »4 U a M B 00 -H 13 OJ " " - -> 13
4) 3 u
.«S §1 !"" B I "D CD
' S *
4) -H B 3 0) 0» •»•*• > 13 « O S
•U U f-4 î C * J H U CD te 41 B
i - S o M c y o B « - H > to co i s t u
«u
> U
> 3 4)
t u
% B
^ y
•H
m co
a
& 01
> en
ca
4> B
e 4) B
f-4
B CO en
4) B to
4)
» 1
"-. -* ro F - i
a oc
E C0
JZ u
CD ki O B
>. co B 0)
13
^ ( H
09
-129-

\o oo *r -T ~* *r\ (•^ (sj i . . . . - ^ u m «e m o o « a a s o
O o ""* r** oo ejx ff»
ao ao oo t o f t *-t ao < CM <M —t N i
• O 1 r— I I 1 I I I I I I I I I I I I I I
U t * * < H N I - . ~-l I . . . . _ t y i f t \ 0 iO O O
O O f » 00 ^o r^ oo
( N es) •— CM C7* 0">
O ^ W < f r > i s ffl M
r i co r% "^ < • * u m «a* <t -» - r • * C
<r m • * <-i o © o o » » N - * O > r - | . . . . —t y m %o m © f » I N i f l ' O ^ O o » * * i i f i b l M f < f t U"l * 0
cn ( n < o o o - * H i f i o w O N v T * i** Q O C M . . * . * • • . . • . • ^ a i m m o ^ H 0 " * * r i P * e N O » - 4 0 i n c f * o o O \ 0 • < O - « . - I H N 00 - I
4 - 4 P t CM - »
-H u-i CM
C C*"t C*l •—I O «Ä C t -^ c*"> f » e n <sj C M u
ON H F 4 N CO O «4 fl o «*J O f*- o * » > I T I < • * n n N < !
<-t >û i r t N 00 " 1 - t f O f »
a ai u> *J o f t
i r - O O m c M O O ^ O
e
Er
> m s
, O H I : CSIÇJ i
W o
00 r~
* S 5 a ao
o
«o v o i e o %-*
\ « ep «l V S O X « Z B '
?»? J= ' v ü ü t l ! : E
U u K > z O o w
I O I i i i n i o o
» r * i o
j »4 M
; a X . ta <D i U H I
O
ca
u
f t
S CU
H
en
=> u
X
H
O
CN
*« TJ
e w
O C M < i m . • * O « i O 1
X ° ' O m i
s i o i
w >
* s u f t M Cfl S 01
00 f l ,
o TJ
2 «: M » * TJ 3 O P 1 N N N H CU
« 4J - H O S
» H fl H ^ u 1 ) . M f t 3 o C » . f o S d D u C i . t n OJ O « 0 0
- ui u IB i a a a a a o - b . v u £
I f t a * - i O - 4
« H f t
S i CU S W
I 9*8 M U t_J SB W [ d i au z u o '
O (0 n to
Z 4J
B
- i
* J o » o i-t u
S 3 fi f t >» CO 4J 3 f t
&5
§5 O
O) o
- 5 g CU U-4 Cfl u> O "O TJ
•O O. E C oo u m ra
• c ffl 4» •H Xï Ö S * i—( f i E (0 ,_( . - <w f t O» cd « ^ y * f t
f l n >» o 3 U >>
. . 4J 0» W • * 81 U > Jl M
. - O 3 > ~» V M ^ ca a • " e £ * w
od ^ ttj
o o c
U CO M f t 3 S h « -
.O IM Ut E f t
U CO X ) T J f t w
«M & q S
D J : O — > -H
i ?
Q ä CS
sO g
<u o
>-- S
0 -
u f i b 4-) 3 CU
c o
ca y
•w *M •H 03 CO «J
i - t y
r - t
O ui
e u 0» J= 4J
o ca 1-4
TJ f t S 3
J=
i» 3
W
V
c o N
» M
tfl
u —4 00
o t - l
o y Cd
ca ca TJ ^H c y ta o
>* »-Z >v
&-sO « 00 C 1 O
<-t f i ^ - u
S § F-' t -
O . . IM
c O .-H f t ca J-* y « f t
> w u o 01 f t ai O
43 o> O O
<4-( f t
3 E-
C • • f t > i ca
J : f *
o. o, ca t-i . . 00 ^ O Ä
u a •u ca CU h
o. oo o f i f t
<a « o >, O JZ
^ Cu
f t
z
o Ui
y •H
S
o ta
Si e i
I M
CU i - t
Ol a :
u >s C
f t ca u c C f i
a) e 00 o
o o 4J . .
01 4-) aa ca 3
. H f . TJ
e « Cfl 0 ^ u - ^ y c ca o a f t i «
tut cQ O ) <u>
f i 01 f t 00 0> OJ
B£ >
00
c f t N ca Ut
00
z
c o CD O Ui
tü
r - t
z
en co 0) e
• H
c o 4-1 Cfl
01 y CO
<4-l Ui 3
cx
OJ
•o
•o f i » H B - H
Z
»*! " t n > , 4J
• • f t ui O C f t 01 * o -H o • o en ca — Ui >> 00 4-1
• H 01 c O. f t O i-t
f t CO en co
• o j s -H cfl O
>> f i e f t >v 4J 01 CM y u - - . oi c o < r
U>4 u> j ^ ca
- H O » W >-f t o . c
z s o M f t • • 4-1 00 «. Q. c m - H
f t Cfl M —f co y u n n oi y « CO TJ
0) 0) 00 OJ y « - f ca c -H
w co o 3 Ui U I
t/ï o a -
ca o • o f t
S y
CO CM 1
O
00 a
<
•a £ - s -a o w « —
H O U » V j 3 W S « B
Ui C O TJ « U) 0) ft.fl
r-t OJ . g B 3 f t 3 g CO &0 3 ™ CO c 9P u ri et) C f t TJ • *
co 4-1 eu co eu t tf) S 0) ta j a to f t u. 3 f t B 4 j ca co a o f i o S > y eu "O S f i -
C B O * i T» f t ta y y v C f t . _ «8 t Ä ^ ° « s C y t- -3 at f t 3 o •
v4 > u «l 3 TJ CO f t Xi 0> 0 0 U a c - - u
o 4-1 M ca oo u co eu eu C 4-. f t u O C0 Q O TJ u s a c co u B OJ
m c u o eu j ; - H y
, w i-» s w-i eu co _ CO
ai M B > , B
ca T j f t ço u o w-. B oi
«s « S f j » o o O O S U S) S 4 - > ^
TJ B «
• - " - 2 ffl
B Ut B S 4J i te n s o o a j 3 o o
r-t co 3 y M
ou x i «
o co
1 § u TJ 3 0) 0) f t S
J= TJ co y c 3 B tu
S - o - S .
C co 3 U O TJ
; f i ^ > , i > X I CO
i f t \ C f t i ' 4-t co y ^
>» = 3 . ca eu co o
f < B r-t y f t eu ta
c *" o —
B Ut f t T J eu 4J CM c s
q o J : CO 4J
eu &s o a M •» o
•H y ca g
O p f t f t co S Q >> °> O S TJ f t
- • § •
N . ^ U j : o f t u
ca w n en
- 1 " 8 eu J= • S N 4J C
f i w E -CO flj CM
ai «J ^** E »H en
cQ t 0 M 00
- « i M B f t TJ « t f i wt •
^ 3 -H co e eu >
f t M f i -rt y - H 4J
« t > . y M 3
^ . . . « TJ
3 » x t t e >i c u
" i ü 00 3 f t C ca ca O ^ CU ^ u £ n 01 0)
O 3
>% 3
-4 E *M y f t
T3 . * — E «
O « 3
u oj c aj M 01 S 3 J3 C 4-1 3
H O S
01 f t a S CO co
u f t
4-1 y
TJ
o y
o s
M
c
s f l Ut
TJ 01
J=
ca eu
01
ca . E u
Ol
u o s to
f l
>> 4-»
CO C 0>
TJ
^ f l
i y O t J ^ r t >»
. 4J eu > E t u 3 y y
i S TJ O B « H C
» i n C i i ca eu > N O H
i » tu 9
» -H 3 • O 4->
a y 3
• u. C M
o ^ C u
oi y f t
co 3
- £r2 . . TJ Cfl 4-1 J
O M (0 ( B en eu -M ,
- - . TJ Q ' tu m ô g CuOC c
§ >* • * eu
o > , x : • co f i ca 3
W | f l TJ y S
•> eu C
O 3 co eu • H O Ui u u> . - 3 CO 4-1 y E . * to 3 <0 W f t u Ui CO O 4-t 4-1 TJ B CO
TJ Xi m eu * f ta w
. . O C N Cfl f » - »y ,
' *J U W i O -H
i O ca ex : u c 5H I eq o
eu M _ j
I «4-t > , C » > 3 i TJ CO O i B 3 U
a i u B ta o
E Cfl tu CU u o > U f t - ^
B co . , tu u .
s J*: T J
t - f - H X «n o f t
• f t co 3 r*. X ) O
M f t • M co ca
> * « o»
91 ï
cfl cfl > M - t U
i» j i a T J M y >> u o TJ J :
TJ B£ >£> > -ao O I —I
S £r!
ui > , f t ai to j«: w to f i y 0t 3 f > > . C 00 4J UÉ ca E to ai oo ca >
y o» 4-i «y j£ 3 B B « H co y tu o f t co U ^ t u y IM c
CU • * to OS CO 4-1 f l
M eu co «a 3
cu oä
a o
i >v 3 >^ Ui W M tu X * eu
TJ O» f l TJ U TJ eu x : f t E eu E
~ t o
f* y .- _ 01 f t
§ TJ j s B B 3
i u y B o u i x i B f t - H 4J X» I 3 U T
^ f t 10 -r M TJ CO C «J CU f t 0
TJ B a Q
Cfl C E 01 TJ V f t OÛ c jz e C8 cfl 3 4-t 01 en B S B
3 C f i f t f l f t TJ cfl TJ «M f<
f t a» ß 4-1 B • * ca •H 5s « C * j&
* 4 t l U t l A S O S «J
O f t f t O \ Û u U4 x ta co
U 4t Xt an oo
f t 3 CO «4-1 O
f t O Ui X Ut J= H a 4-t
- 130 -

00 o ö o
I A m o ^
O " ^ CJ\ *-« «A 00 f )
I I I 1 1 I
00 co
CO CM O
CO ON co o < » O o ^ 4 (*» ( * ) . • • • . —! « o i i r t i f l o * 0 *
su < O
tA f - O* <*1 00 Is* r »
1 1 I I t I I I I I I I I >
N H i n r * * o M n > j
i - t - - < O ^ O O O u - i u * i O !
U *—' o : ^ -S \ O - * S i x _ C M Ü a i *-» as ^ : - w . a i T
: P ' S . o . w
r "N^- \ » 4 M S ^ N ^
" SR
Z
u
K~S S S 90
o.ag « * ~4 t I
^ • s > - ^ * V . 00 «
o a o ^ »4 •
S O S tt a
W » » ' • X
O u O i :
o o w
s I
• • u e CO px> <u a CM s
*- o a X X 0 . *"« O
IA a a o . o C CM * • O 1 « O - • • S O | CM OB
• ^ i M M c o - H I m o ca 4J i-4 O O O r-4 ca . . x • . . o U u u o* * tN © O
t l * CD ID U kl «K M » * u o « 3 3
01 41 u " 0 U > , U 9 Q Q O ) V O } ^ H I U
t m a n u H U U U H
e g § s s " B tA O
O N -o «A • •
< P- o T i o i T o ui w O O I A CM s . • . .
<N t-« O O
U *< s i : 3 4J "O M C s s s
SÄ
OQ w >
Cfl ^ M « X »
« * w
C u n « c v *•* " • CO V CÜ U -ft B -
K K W T 3 3 O CA r » r*. CM iH y •H 3 4_) 1-4 O < O * J x u j i t a o c M c M C M c n - * i j f O > 4J fH CO X ^ «H t-l I 0 m <H 41 3 o b b b h b i t b « D O
H co c j H po S a a a . a a a b * w i
I oo i o
o
00 -H .
a ai o . a • o . ^ x :
^H « a
n K I »4 3-*
W W H
« 00 « X « o
h -S Cfl u un
co o 9 M M < H
-H Q > O U 3 10 « « * r t S» 3 k l ^
eu U ta o 1-H « « U O «Ö ^H - ^ .
e « a U <Q «0 O S
nH -H > . k l -H Cfi a B z PN > TJ
3 3 a. 3 C x; x — --t « t 0> « f H H
» x %o c < a C 3 1 0 o O W ~* "H • • 4J
•H ^ . 4J > , 4-1 4-t " <r « x o co ai m e o. pa. o c —« C ce • * O O u •• «4-1 N « «M 00 >> •H c o -C B H O H 1- B-C0 (0 «H « 41 (Q CO U U U « Li
H <H a <H O. 00 CJ Où > 00 o
O h O H - H «-• 1-* a> *•* «s «
i e • M CCI at 3
w* ta
V >N oc: - i
•u >•> c
tt « at e O -H
o> S O T3
(M 0) a h o o. y
. . it o u U 3 u
1-4. TJ a c
fl * <-( o ^ * en 3
15 1 *J
«M Cfl 01 4J
-H 4) •H o « o y >%.H so o y xi v o x ;
co u o u <J a. 0) 01 on >
01 kl o. 3
CJ
•o CD 4-1 c «J
f 4 a
o Cfl
r-t a
• o a» e
*4 cO
>* •H b 0
8. o 4-t
•o a* c •H ca k> •o
s^
u y 0)
<4-t b v , a . a S ®
* -H
•5 'S * • ^v o u o m N H u fl
^ ^ rf» > - * en « b x « - t
« os <« c g* S V H ffl fi O S 3 B « _- . oo co i r t . C — * - "
73 v - es *J Ol 1 a> »
xi e fi S o OS 5 3 u 3 S co C C u. ai c u X» a» jz o
co s ^ . » ^ U u w h « u -H ( 0 CE) o " • , CO •n -a u « c o m <o
y c - H 4 j H c a a ^ -^ x ; n « B ^ u
0) 3 0 0 OS <#4 T4 CQ Q P T3 T3 S O 0) >N «
s y "O - ^ «-rt c
^ i u CI U Q
w e u C «*-< " ( O
fM « " «
u-l « «H O . O « O
CM u b a •» 4> t a
tf e t e u £ o 5 a» o m s s x: o l S » u
•A 5 •« ot y a « «
w - o Ja H / - \ r t CQ l u
>> U -H 0) (0 > . b C b -r-t « y-t o M O H g
S y — g — j i 0) 0 « h CM — b U C f i « ^ * C0 3 M3
•O CM 41 4J • | • - I y tn ^H
M ^ u 3 4) ^ b > . w ki w < r « O O u O "
[ > - i a w a . ^ 4
O « - . ^ ^ B »
c i . * O » ^ ^ y • - «
>v<n o w U H 4J c •o g£ x . s O
n m u c u N . s ^ Q t ) «4 <r M x ta
c 3 3 c os 5 00 cfl >* o c y u O U CO " ^ 4J - 4 X 1 « 1 X <0 X
•o x s n 4-1 4) « CO ^ O
X i-I O- Q
<o *o a a 3 "O 3 "O C0 C 4* T 4 C g h t ) « I T )
— Ji e >^ eo
n « c o u u -H *t3 C - ^ Cfl O CO 4J eu S 4-1 C0 i-H
y 4» o • * c c: * - s . - r t ^ 4J . . 4 U i w (H g]
CO v i u PS ^4 • o o P T3 4* S O w» e b
. 4) <H C r-. C W-. 41 C
-y - . >* 3 S
&* >, a» B S •o c > C y
Cfl - H en a 4« w- o m O cd O X
4J kl *-> 3 C* p£ 4i o>
V 1 13 -•O B « co 4) O . . M u
eu y > , b o w « < u 0
* f H bi . e ^ y —
5 u 41 4) o « «- i-i e fc* -H CO 3 i-I
X O 0> 4J M-i S H u
. M *-» 3 Ps kl CM 4J £ J-« "*-* O 4-> 41
•O CM a Cfl >
M? 1
-a-m
O
s O kl
*o 41 U C0 ki 3
•o B
4) -Ü
Cfl -ai
^ o
^ (0 1-1 kl 0> 4-1
i 4)
M
I J ^ y o k*
c *o 41
41 ki 41
O . X
i C0
4J CO 41 3
r4 W fi 4» •O H O «O • 0) 4)
C O» 0 0 4 J 41 0 0 4 I C o y - H y to i-H
i - 4 ( 0 4 > C C Q C - H k CD U-l C «H «4-1 1-t U4 O h O H b i t ' ki 3 H CO 3 ki
•131-

ANNEX 4: Proposal for grading of land qualities (partly after Van de Weg and Braun, 1977).
1. Availability of water Grade
1 . 2 . 3 . 4 .
v e r y h i g h h i gh mode ra t e low
2 . Chemica l s o i l
c l a s s R l
1
2
3
4 5
I m.e%
CEC o r sum
c a t i o n s above
16 12-16
6-12
2 -6 0-2
No. of m o i s t u r e
f e r t i l i t y
R a t i n g T2
1
2
3
--
c o n t i n u o u s s u f f i c i e n c y
months above 10
6 3
be
Hp m.e%
0 - t r
t r -0 . 5
above 0 . 5
--
- 10 - 6
low 3
Exch . K m.e/o
above 0 .6 0 . 2 -0 . 6 0 -
0 . 2 --
Req u i s i t e a v a i l a b l e m o i s t u r e c a r r y i n g
I I A v a i l . P ppm
above 60 2 0 -60
below 20 --
c a p a c i t y (mm) above 200
125-200 90 -125
below 90
P s o r b -
t i o n %
below 25 2 5 -50
above 50 --
o » /
above 2 . 5 1.5 2 . 5 0 -
1.5 --
Ill 25% Extractable nutrients
Rating
2 3
Class R2. 1 2 3
Ca m.e% above
75 25 -75 0 -25
Sum T2 0 -5
6-10 11-15
Mg m.e% above
40 10-40 0 -10
C l a s s R3
1 2 3
K m.e% above
25 5-25 0 -5
Sum
h 0-4 5-8
9-12
P ppm
above 500
250-500 0 -250
Final grading is combination of classes, R, , R2 and R-, as follows:
Grade of fertility Combination 1 111 211 very high fertility
112 212 2 113 213 high
121 211 122
3 123 222 311 321 moderate 131 223 312 313
4 132 231 323 332 412 432 low 133 322 331 411 413 422
5 232 333 432 511 513 522 531 533 very low 233 423 433 512 521 523 532
-132-

3. Presence/hazard of alkallnlty/sodicity/alkalinization
ESP 30-100 cm less than 15 15-30 30-50 more than 50 more than 50
Determined by the sum of classes of slope class, climate, slope length and erodability.
Grade 1 2 3 4 5
Resis tance t o sheet
ESP 0-30 cm l e s s than 6
6-15 15-30 30-50 more than 50
e ros ion
Grade
1. very high resistance 2. high resistance 3. moderate resistance 4. slight resistance 5. very slight resistance
Sum of classes of slope, climate, slope length and erodability
3- 5 6- 8 9-11
12-14 15-17
5. Possibility to use mechanical implements cultivation by hand only
possibility
1. very high 2. high 3. moderate 4. low 5. very low
Lowest class allowed for slope 1 2 3 4 5
stoniness 2 3 4 5 5
workability 2 3 4 5 5
Cultivation with mechanical implements
Grade of possibility to use mechanical slope
Lowest class allowed for
implements 1. 2 . 3 . 4 . 5 .
very high high moderate low very low
oxen 1 2 3 --
o t r 1 1 2 3 4
ters 1 2 3 4 5
worka b i l i t y 3 4 5 5 5
s lope l ength 1 2 3 3 5
width of f i e l d 1 2 3 3 5
6. Presence/hazard of waterlogging Grade Drainage class
1. none good to excessive drainage
2. slight
3. moderate
4. high
5. very high
moderate drainage
imperfect drainage
poor drainage
very poor drainage
Colour and mottling no distinct mottling within 90 cm and/or reduced colours within 120 cm no distinct mottling within 50 cm and/or reduced colours within 120 cm no reduced colours or distinct mottles within 50 cm partly reduced colours and distinct mottles within 50 cm predominantly reduced colours
133-

7. Hinderance by vegetation Grade
1. none to very slight
2. slight
3. moderate
4. high
5. very high
Physiognomic type grassland, bushed wooded grassland and wooded grassland bushed grassland, and wooded bushed grassland bushland, wooded bushland, bushed woodland and woodland dense bushland, dense wooded bushland, dense bushed woodland and dense woodland bushland thicket and wooded bushland thicket
8. Risk of overgrazing Grading based on visual observations and estimates in the field. Grade
1. none to very slight
2. slight 3. moderate 4. strong 5. very strong
Index actual biomass production is 80% to 100% of potential one
actual biomass production is 60% to 80% of potential one actual biomass production is 40% to 60% of potential one actual biomass production is 20% to 40% of potential one actual biomass production is zero to 20% of potential one
Conditions for germination Grade Topsoil structure
1. very high single grain, crumby granular 2. high medium sub-angular blocky 3. moderate coarse sub-angular blocky 4. low massive 5. very low platy
Erodabili ty based on sum of classes of organic matter, f locculation index, s i l t /
clay r a t i o and bulk density 4-5 6-7 8-9
10-11 12
10. Availability of foothold for roots Grade Depth to bedrock or a pan
1. very high more than 150 cm 2. high 80-150 cm 3. moderate 50- 80 cm 4. low 25- 50 cm 5. very low less than 25 cm
11. Availability of drinking water Grade 1 very high 2 high 3 moderate 4 low 5 very low
12. Presence of forest fire hazard Grade 1 2 3 4 5
very low low moderate high very high
-134-

13. Presence of windfall hazard
14.
15.
Grade 1 2 3 4 5
Risk of Grade 1 2 3 4 5
peric
Availability Grade 1 2 3 4 5
di<
of
:ally
very low low moderate high very high
occurring pests and diseases
conditi
very low low moderate high very high
ons for pond construction
very high high moderate low very low
-135-

ANNEX 5: The current land suitability for small scale rainfed arable fanning for non-cereal annual crops at low level of management (i.e. assuming low input)
Suitability class soil unit Uprl UPr2 UPr3 UPbl UPb2 UPb3 UPb4 UPb5 UPb6 UPb7 UPb8 UPb9 UPblO UPbll UPbl 2 UPbl3 UPM4 UPbl5 UPbl6 UPW7 UPbl8 UPap LPal LPa2 LPa3p LPa4p LPa5p LPa6p LPa7p LPa8p LPa9p LPalOp LPallp BPp
1.1 highly
suitable
1.2 moderately
suitable
1.3 marginally
suitable X X X X X X X X X X X X X X X X X X X X X X X
3 unsuitable
X X X X X X X X X X X
-136-

ANNEX 5B: The current land suitability for small scale rainfed arable for non-cereal annual crops at intermediate level of management (i.e. assuming medium input).
Suitability class soil unit UPrl UPr2 UPr3 UPbl UPb2 UPb3 UPb4 UPb5 UPb6 UPb7 UPb8p UPb9p UPblOp UPbllp UPbl2p UPbl3p UPbl4p UPbl5p UPbl6p UPbl7p UPbl8p UPap LPal LPa2 LPa3p LPa4p LPa5p LPa6p LPa7p LPa8p LPa9p LPalOp LPallp BPp
1.1 highly
suitable
1.2 moderately
suitable
X
X
X X X
X X X
1.3 marginally
suitable X X
X
X
X X X
X X X X X X X X
3 unsuitable
X X X X X X X X X X X
-137-

ANNEX 5C: The current land suitability for medium scale rainfed arable farming for wheat/barley/oats at intermediate level of management (i.e. assuming medium input).
Suitability class soil unit UPrl UPr2 UPr3 UPbl UPb2 UPb3 UPb4 UPb5 UPb6 UPb7 UPb8p UPb9p UPblOp UPbllp UPbl2p UPbl3p UPbl4p UPbl5p UPbl6p UPbl7p UPbl8p UPap LPal LPa2 LPa3p LPa4p LPa5p LPa6p LPa7p LPa8p LPa9p LPalOp LPallp BPp
1.1 highly
suitable
1.2 moderately
suitable
X
X
X X X
X X X
1.3 marginally
suitable X X
X
X
X X X
X X X X X X X X
X
3 unsuitable
X X
X X X X X X X X
-138-
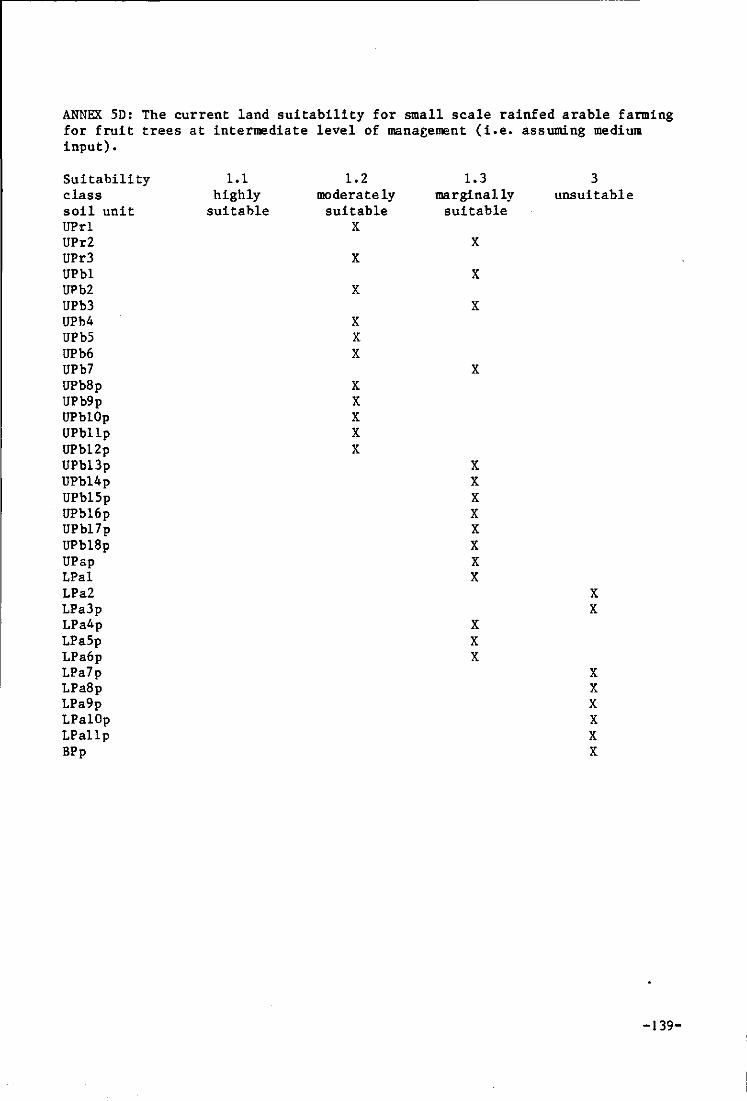
ANNEX 5D: The current land suitability for small scale rainfed arable farming for fruit trees at intermediate level of management (i.e. assuming medium input).
Suitability class soil unit UPrl UPr2 UPr3 UPbl UPb2 UPb3 UPb4 UPb5 UPb6 UPb7 UPb8p UPb9p UPblOp UPbllp UPbl2p UPbl3p UPbl4p UPbl5p UPblóp UPbl7p UPbl8p UPap LPal LPa2 LPa3p LPa4p LPa5p LPa6p LPa7p LPa8p LPa9p LPalOp LPallp BPp
1.1 highly
suitable
1.2 moderately
suitable X
X
X
X X X
X X X X X
1.3 marginally
suitable
X
X
X
X
X X X X X X X X
X X X
3 unsuitable
X X
X X X X X X
-139-

ANNEX 5E: The current land suitability for small scale grazing for cattle and sheep at intermediate level of management (i.e. assuming medium input)
Suitability class soil unit UPrl UPr2 UPr3 UPbl UPb2 UPb3 UPb4 UPb5 UPb6 UPb7 UPb8p UPb9p UPblOp UPbllp UPbl2p UPbl3p UPbl4p UPbl5p UPbl6p UPbl7p UPbl8p UPap LPal LPa2 LPa3p LPa4p LPa5p LPa6p LPa7p LPa8p LPa9p LPalOp LPallp BPp
1.1 highly
suitable
X
X
X X X
X
X
1.2 moderately
suitable X X
X
X
X X X
X
X
X X X X X
1.3 marginally
suitable
X
X
X X X
X
X
3 unsuitable
X X
X X
X
X
•140-

ANNEX 5F: The current land suitability for tree production for firewood and building poles (i.e. assuming medium input).
Suitability class soil unit UPrl UPr2 UPr3 UPbl UPb2 UPb3 UPb4 UPb5 UPb6 UPb7 UPb8p UPb9p UPblOp UPbllp UP12p UPbl3p UPbl4p UPbl5p UPblóp UPbl7p UPbl8p UPap LPal LPa2 LPa3p LPa4p LPa5p LPa6p LPa7p LPa8p LPa9p LPalOp LPallp BPp
1.1 highly
suitable X
X
X
X X X
X X X X X
1.2 moderately
suitable
X
X
X
X
X X X x.
1.3 marginally
suitable
X X X X
X X X X X X X
X X
3 unsuitable
X
X
-141-
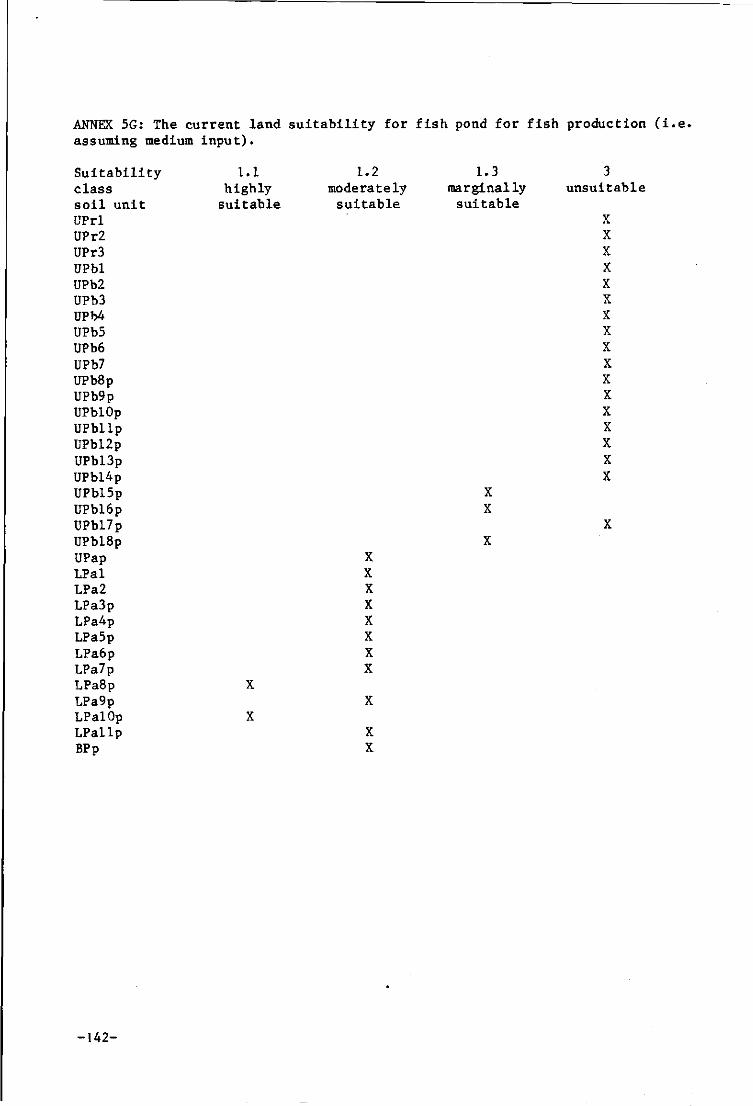
ANNEX 5G: The current land suitability for fish pond for fish production (i.e. assuming medium input).
Suitability class soil unit UPrl UPr2 UPr3 UPbl UPb2 UPb3 UPb4 UPb5 UPb6 UPb7 UPb8p UPb9p UPblOp UPbllp UPbl2p UPbl3p UPbl4p UPbl5p UPbl6p UPbl7p UPbl8p UPap LPal LPa2 LPa3p LPa4p LPa5p LPa6p LPa7p LPa8p LPa9p LPalOp LPallp BPp
1.1 highly
suitable
X
X
1.2 moderately
suitable
X X X X X X X X
X
X X
1.3 marginally
suitable
X X
X
3 unsuitable
X X X X X X X X X X X X X X X X X
X
-142-

ANNEX 6: Scientific names
Common name
Apples
Bananas
Barley
Beans
Beet/Mangold
Cabbages
Carrots
Cassava
Cauliflower
Coffee
Kale
Leek
Linseed
Maize
Mangold/Beet
Oats
Onion
Pawpaw
Peaches
Pears
Peas
Plums
Potatoes
Pyrethrum
Rice
Sorghum
Sunflower
Sweet potatoes
Wheat
of the crops mentioned in the report.
Scientific name
Malus pumila
Musa spp.
Hordeum spp.
Phaeseolus vulgaris
Beta vulgaris
Brassica oleraaea {Capitata group)
Dauaus sativa
Manihot spp.
Brassica oleraaea (Botrytis group)
Coffea
Brassica oleraaea (Acephala group)
Allium porrum
Linum usitatissimum
Zea mays
Beta vulgaris
Avena sativa
Allium cepa
Carca papaya
Prunus persiaa
Pyrus communis
Pisum sativum
Prunus dome8tica
Solanum tuberosum
Crysanthemum cinerarias'folium
Oryza sativa
Sorghum vulgare
Helianthus annuus
Ipomea batatus
Triticum spp.
-143-

N.N. Nyandat
CLIMATE AND SOILS OF THE SOUTH KINANGOP PLATEAD OF KENÏA Their limitations on land use
Thesis Submitted for the degree of doctor of agricultural science of the Agricultural University at Wageningen

CURRICULUM VITAE
The author was born on Kenya on 16 june 1937. He obtained his Cambridge
School Certificate in Kenya at the C.M.S. Maseno School in 1958 before
proceeding to Makerere University College in Uganda where he obtained a B.Sc.
degree of the University of London in 1963. In 1965 he went to the University
of Reading in England where, in 1967, he obtained a M. Agric. Sc. degree with
specialization in Soil Science.
From 1964 to 1980 the author was employed as Agricultural Research
Officer in the Ministry of Agriculture and carried out a number of soil
surveys as well as laboratory soil investigations. He rose to the position of
the Head of Soil Survey in 1972 before becoming the Director of the National
Agricultural Laboratories in 1978. In 1981 he transferred to the Kenya
Ministry of Environment and National Resources to be the Deputy Director of
the National Environment Secretariat. For a period of three years, from 1982
to 1984, he was on secondment to Egerton College in Kenya where he was a
Principal Lecturer in Soil Science.