climate and human-related drivers of biodiversity decline...
TRANSCRIPT
UNU-IAS Policy Report
Climate and Human-Related Drivers of Biodiversity Decline in Southeast Asia

The United Nations University Institute of Advanced Studies (UNU-IAS) is a global think tank whose mission is "to advance knowledge and promote learning for policy-making to meet the challenges of sustainable development". UNU-IAS undertakes research and postgraduate education to identify and address strategic issues of concern for all humankind, for governments, decision-makers, and particularly, for developing countries.
Established in 1996, the Institute convenes expertise from disciplines such as economics, law, social and natural sciences to better understand and contribute creative solutions to pressing global concerns, with research and programmatic activities related to current debates on sustainable development:
• BiodiplomacyInitiative• EcosystemServicesAssessment• SatoyamaInitiative• SustainableDevelopmentGovernance• EducationforSustainableDevelopment• MarineGovernance• TraditionalKnowledgeInitiative• ScienceandTechnologyforSustainableSocieties• SustainableUrbanFutures
UNU-IAS, based in Yokohama, Japan, has two International Operating Units: the Operating Unit Ishikawa/Kanazawa(OUIK)inJapan,andtheTraditionalKnowledgeInitiative(TKI)inAustralia.
The Global Land Project (GLP) is the foremost global environmental change project promoting land change science for environmental sustainability. Land change science is an interdisciplinary field that seeks to understand the dynamics of land use and land cover as a coupled human–environment system. It addresses theories, concepts, models, and applications relevant to environmental and societal problems, including the intersection of the two subsystems.GLPwas established as a joint coreproject of the InternationalGeosphere-Biosphere Programme(IGBP) and the InternationalHumanDimensions Programme (IHDP) andhas offices inCopenhagen, Sapporo,AberdeenandBeijing.

UNU-IAS Policy Report
Climate and Human-Related Drivers of Biodiversity Decline in Southeast Asia
Ademola K. Braimoh
Suneetha M. Subramanian
Wendy S. Elliott
Alexandros Gasparatos
Copyright©UnitedNationsUniversity,2010
The views and opinions presented in this publication are those of the authors and do not necessarily reflect in any way those of the organisations that they represent. While reasonable efforts have been made to ensure that the contents of the publication are factually correct and properly referenced, UNU-IAS does not accept responsibility for the accuracy or completeness of the contents, and shall not be liable for any loss or damage that may be occasioned directly or indirectly through the use of, or reliance on, the contents of this publication. The designations employed and the presentation of material in this publication do not imply the expression of any opinion whatsoever on the part of UNU-IAS and its management concerning the legal status of any country, territory or city or its authorities, or concerning the delimitation of its frontiers or boundaries.
United Nations University Institute of Advanced Studies6F,InternationalOrganizationsCenterPacifico-Yokohama1-1-1MinatoMiraiNishi-ku,Yokohama,220-8502JapanTel:+81-45-221-2300Fax:+81-45-221-2302Email: [email protected] http://www.ias.unu.edu/
ISBN978-92-808-4520-4(pb)ISBN978-92-808-4521-1(eb)UNU-IAS/2010/No.2
CoverPhotoCredit:©iStockphoto.com/Matteodelt,WomanonaboatinVietnamDesignandLayout:XpressPrintPteLtdPrintedbyXpressPrintPteLtdinSingapore
PrintedonForestStewardshipCouncil(FSC)certifiedpaperusingsoy-basedink

3
Abbreviations ................................................................................................................4
List of Tables, Figures and Boxes ..................................................................................5
Message from the Director ...........................................................................................6
Acknowledgements ......................................................................................................7
Executive Summary .......................................................................................................8
1. Introduction ..............................................................................................................9
1.1Background ...........................................................................................................9
1.2ClimatePatternsandVariability............................................................................11
1.3FutureClimateofSoutheastAsia .........................................................................13
2. Biodiversity in Southeast Asia: State and Drivers of Decline ................................14
2.1GlobalTrends .......................................................................................................14
2.2StateofBiodiversityandBiodiversityHotspots ......................................................14
2.3DriversofBiodiversityLoss ...................................................................................16
3. Human Related Drivers of Biodiversity Loss ..........................................................20
3.1Agriculture ..........................................................................................................20
3.1.1AgricultureExpansion .................................................................................20
3.1.2LandManagementandTenureSystems ......................................................22
3.1.3AgricultureasaDriverofClimateChange ..................................................24
3.2BiofuelExpansion ................................................................................................24
3.3Trade ..................................................................................................................27
3.4Urbanization ........................................................................................................30
4. Climatic Impacts and Biodiversity Loss ...................................................................32
4.1ClimateChangeandFires ....................................................................................32
4.2ClimateChangeandSpeciesDistribution .............................................................33
5. Policy Responses and Conclusion ...........................................................................35
References ..................................................................................................................39
Contents
4
Abbreviations
ASEAN Association of Southeast Asian NationsBOD BiochemicaloxygendemandCBD ConventiononBiologicalDiversityCI ConservationInternationalCITES ConventiononInternationalTradeinEndangeredSpeciesofWildFauna
andFloraENSO El Niño/La Niña-Southern OscillationFAO FoodandAgricultureOrganizationoftheUnitedNationsFAOSTAT Food and Agriculture Organization of the United Nations Statistical
DatabaseGBO GlobalBiodiversityOutlookGDP GrossDomesticProductGHG GreenhouseGasIPCC IntergovernmentalPanelonClimateChangeITCZ TheIntertropicalConvergenceZoneLCA LifeCycleAssessmentMA MillenniumEcosystemAssessmentMha MillionHectaresPOME PalmOilMillEffluentS. E. Asia Southeast AsiaUNEP UnitedNationsEnvironmentProgrammeUNFCCC UnitedNationsFrameworkConventiononClimateChangeUN-REDD UnitedNationsCollaborativeProgrammeonReducingEmissionsfrom
DeforestationandForestDegradationinDevelopingCountriesVOCs VolatileOrganicCompoundsWRI World Resources Institute
5
Table 1: Land area and population of Southeast Asia
Table2:MajorcharacteristicsofthethreerainfallregimesofSoutheastAsiaincomparisonto the northern hemisphere seasons
Table3: Linear trends (degreesC / decade) inmaximumandminimum temperatures inVietnam,ThailandandMalaysia
Table 4: Projected changes in surface temperature andprecipitation for SoutheastAsia,(IPCC,2007)
Table5:Impactofalargechangeineachdriveronthebiodiversityofselectedworldbiomesby2100
Table6:Classificationoflandtenuresystemsbasedonlandallocationandtenuresecurity
Table7:ThemaindriversofbiofuelproductioninS.E.Asia
Table8:BiofuelsandfeedstocksforthemainS.E.Asiaproducingnations
Table9:Distancefromprotectedareas(km)tothenearestcitywith50,000inhabitantsormoreinAsia(AdaptedfromMcDonaldetal.,2008)
Figure1:PhysiographicmapofSoutheastAsia
Figure2:TotalnumberofspeciesandendemisminSoutheastAsia
Figure3:DrivingforcesandprocessesofbiodiversitylossinSoutheastAsia
Figure4:AgriculturallanduseinS.E.Asia
Figure5:OilpalmexpansioninIndonesiaandMalaysia
Figure6:Effectsoftradeonbiodiversity
Box1:BiodiversityofmontaneecosystemsinThailand
Box2:Linking,forestry,agriculture,andminingwithdeforestationinthePhilippines
Box3:ExamplesofillegalwildlifetradeinS.E.Asia
List of Tables, Figures and Boxes

Message from the Director
6
The world is on the brink of a confounding crisis, which is brought about by a cumulating cascade of factors such as rapid changes in our natural climatic conditions, environmental degradation brought about by unsustainable production and consumption practices, depletion of environmental and biological resources, and a sharp decline in various indicators of well-being. While noting that it is our actions and, often times, inactions thathaveprecipitatedtheseimpendingcrises,itisimperativethatwethecitizensofourplanet should quickly come up with effective measures to mitigate the consequences and adapt to the changes in our natural ecosystems. This would require us to pay more attention to the enhancement and maintenance of natural resources and processes as well-functioning ecosystems with the diversity of resources contained therein so as to enable sustainable production, consumption, and related livelihood activities. Obviously, this would require inputs from various scientific, technological, and allied academic fields in terms of innovations and radically new ideas; from business communities by fostering best practices in the use and disposal of resources and transactions with others in the supply chain; from civil society in fostering responsible stewardship of natural resources and social concerns; and, from governments in terms of development and implementation of appropriate policies that are sensitive to the needs of the diverse sections of the society they govern. And the implications of actions by the various stakeholders need to be analysed in a timely, and, often, anticipatory manner, in order to draw attention to benefits and concerns related to decisions made at different levels.
In this context, I am pleased to state that the United Nations University Institute of Advanced Studies(UNU-IAS)hasbeenactivelycontributingtoadvancingawarenessofvariousconcernsrelated to biodiversity and ecosystems among a variety of stakeholders. Our research has straddled areas in the interface between the natural world, human aspirations, and well-being consequences. We have focused especially on the notion of fostering equitable transactions between different stakeholders over the years.
This year, we are launching several new publications that are of particular relevance to the Conference of Parties (COP) to the Convention on Biological Diversity (CBD). Thepublications examine a diverse set of topics that include, among others, the effectiveness of implementation of national biodiversity strategies by different countries; the governance and management of bio-cultural landscapes such as satoyama and satoumi; the status of biodiversity in the South East Asian region; the impact of emerging biofuel technologies to the provision of ecosystems services; scoping the role of urban centres in green development; and underscoring the need for bridging epistemological divides between modern and traditional world views in securing development goals and conservation priorities – all of whicharetopicsthatareofkeenimporttotheCBD’sobjectivesaswellastothebroadersustainable development agenda. I expect each of these publications will provide a basis to inform discussions and facilitate designing of implementable policies in their related areas.
I would like to take this opportunity to thank our partners and collaborators for their support in our research and capacity development activities. There are several expectations from the outcomesof thisCOP, andwehope to continueourwork in the future informingandproviding relevant inputs to policy-makers, academics, and practitioners alike.
GovindanParayil,Director,UNU-IASandVice-Rector,UNUOctober2010
Message from the Director

Acknowledgements
7
Acknowledgements
TheauthorswishtothanktheAsiaPacificNetworkforGlobalChangeResearch(APN)fortheGrantAwardfortheprojectEcosystemServicesManagementinAsia(ECOSMAG)andtheMinistryofEducationofJapan(MEXT)fortheSpecialCoordinationFundsforPromotingScienceandTechnology.WealsogratefullyacknowledgeIdowuOladele,LinZhenandPeileiFanforveryhelpfulcommentsonanearlierdraftofthereport.
Executive Summary
8
Southeast Asia hosts diverse biological resources and cultural milieus that are under different degrees of stress from various factors. This report highlights the key underlying economic, political and natural factors that contribute to biodiversity decline in the region, and provides specific policy directions that could help address the decline.
The report documents the salient biophysical characteristics of Southeast Asia, the current state of biodiversity and the attendant climatic and anthropogenic drivers of biodiversity decline in the region. Specifically, the role of international trade and the expanding oil palm plantationstomeetincreasingbiofueldemands,aswellasimpactofurbanizationandlandtenure management systems and changing climatic patterns on biodiversity are clarified.
Policyresponsesrequiredtoaugmentandmaintainarichbiodiversitystatusintheregionare highlighted in the last section. There is a need for periodic assessments, monitoring and appropriate regulation mechanisms as well as the use of innovative financial mechanisms to enhance adaptive capacity. Investments in collaborative research and information sharing and educational initiatives to raise awareness and foster better ties between science and policy networks are a priority.
Executive Summary
Section 1 Introduction
9
1. Introduction
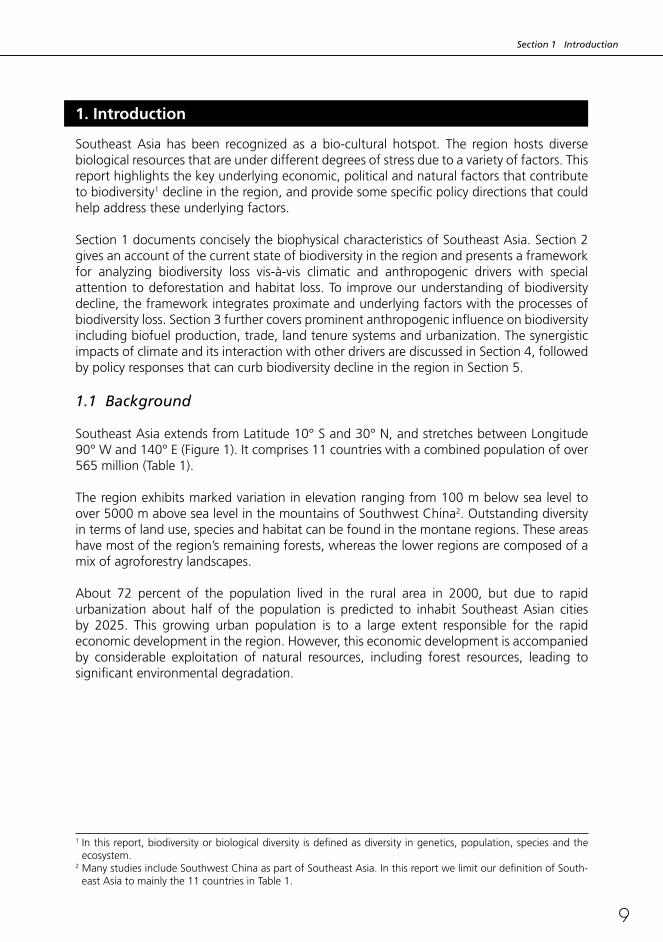
SoutheastAsia has been recognized as a bio-cultural hotspot. The region hosts diversebiological resources that are under different degrees of stress due to a variety of factors. This report highlights the key underlying economic, political and natural factors that contribute to biodiversity1 decline in the region, and provide some specific policy directions that could help address these underlying factors.
Section1documentsconciselythebiophysicalcharacteristicsofSoutheastAsia.Section2gives an account of the current state of biodiversity in the region and presents a framework for analyzing biodiversity loss vis-à-vis climatic and anthropogenic drivers with specialattention to deforestation and habitat loss. To improve our understanding of biodiversity decline, the framework integrates proximate and underlying factors with the processes of biodiversityloss.Section3furthercoversprominentanthropogenicinfluenceonbiodiversityincludingbiofuelproduction,trade,landtenuresystemsandurbanization.ThesynergisticimpactsofclimateanditsinteractionwithotherdriversarediscussedinSection4,followedbypolicyresponsesthatcancurbbiodiversitydeclineintheregioninSection5.
1.1 Background
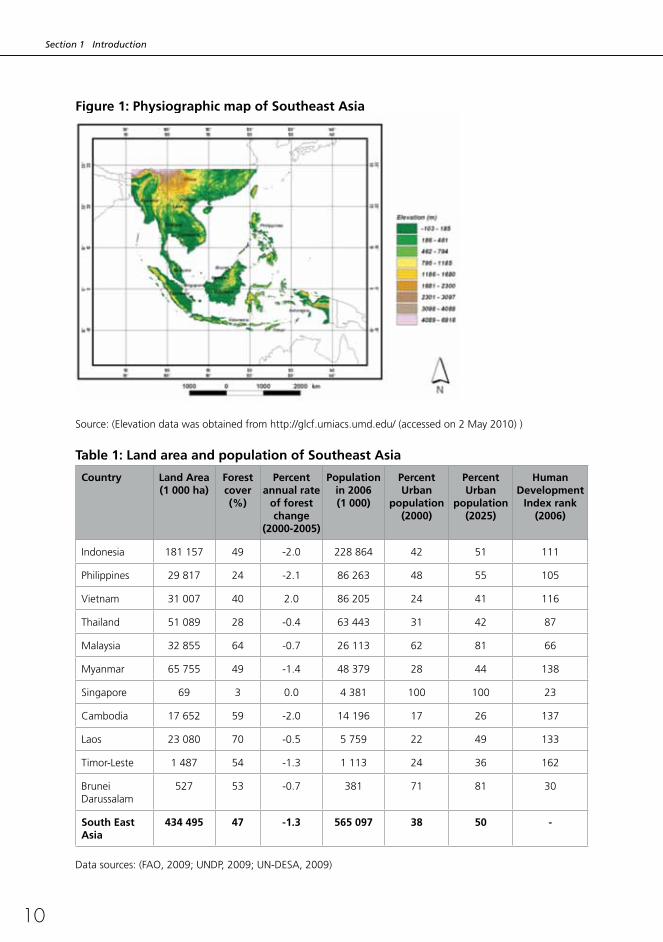
SoutheastAsiaextendsfromLatitude10°Sand30°N,andstretchesbetweenLongitude90°Wand140°E(Figure1).Itcomprises11countrieswithacombinedpopulationofover565million(Table1).
Theregionexhibitsmarkedvariationinelevationrangingfrom100mbelowsealeveltoover5000mabovesealevelinthemountainsofSouthwestChina2. Outstanding diversity in terms of land use, species and habitat can be found in the montane regions. These areas havemostoftheregion’sremainingforests,whereasthelowerregionsarecomposedofamix of agroforestry landscapes.
About 72 percent of the population lived in the rural area in 2000, but due to rapidurbanization about half of the population is predicted to inhabit SoutheastAsian citiesby 2025. This growing urban population is to a large extent responsible for the rapideconomicdevelopmentintheregion.However,thiseconomicdevelopmentisaccompaniedby considerable exploitation of natural resources, including forest resources, leading to significant environmental degradation.
1 In this report, biodiversity or biological diversity is defined as diversity in genetics, population, species and the ecosystem.
2ManystudiesincludeSouthwestChinaaspartofSoutheastAsia.InthisreportwelimitourdefinitionofSouth-east Asia to mainly the 11 countries in Table 1.
Section 1 Introduction
10
Figure 1: Physiographic map of Southeast Asia
Source:(Elevationdatawasobtainedfromhttp://glcf.umiacs.umd.edu/(accessedon2May2010))
Table 1: Land area and population of Southeast Asia
Country Land Area(1 000 ha)
Forest cover (%)
Percent annual rate
of forest change
(2000-2005)
Population in 2006(1 000)
Percent Urban
population (2000)
Percent Urban
population (2025)
Human Development
Index rank (2006)
Indonesia 181157 49 -2.0 228864 42 51 111
Philippines 29817 24 -2.1 86263 48 55 105
Vietnam 31007 40 2.0 86205 24 41 116
Thailand 51089 28 -0.4 63443 31 42 87
Malaysia 32855 64 -0.7 26113 62 81 66
Myanmar 65755 49 -1.4 48379 28 44 138
Singapore 69 3 0.0 4381 100 100 23
Cambodia 17652 59 -2.0 14196 17 26 137
Laos 23080 70 -0.5 5759 22 49 133
Timor-Leste 1487 54 -1.3 1113 24 36 162
BruneiDarussalam
527 53 -0.7 381 71 81 30
South East Asia
434 495 47 -1.3 565 097 38 50 -
Datasources:(FAO,2009;UNDP,2009;UN-DESA,2009)

Section 1 Introduction
11
1.2 Climate Patterns and Variability
The high mountains and the complex land-sea configuration of Southeast Asia have a strong influenceonweatherandclimate.ThreedistinctrainfallregimescanbeidentifiedacrosstheSoutheastAsianregion(KripalaniandKulkarni,1998;Table2).Asubstantialproportionofthe annual precipitation over most of the region is received during the summer period of the northern hemisphere.
Table 2: Major characteristics of the three rainfall regimes of Southeast Asia in comparison to the northern hemisphere seasons
Rainfall regime Description Major characteristics Countries/Areas
AsianMonsoonRegion
Continentalitywithhigh mountains is the contributor to enhancement of summer monsoon
Highprecipitation(maximumof1150mminJuly)onthewesternslopesandalongMyanmar-Thailand frontier as a result of orography and the Southwest monsoon laden with moisture fromtheBayofBengal.Inareas20–25degreesN,appreciablerainfall(300–500mm)isobserved during summer monsoon months due to the Inter-TropicalConvergenceZone(ITCZ).
Intheautumn,theVietnamcoast receives maximum rainfall of550mminOctoberduetowinter atmospheric circulation, whereas there is a marked decrease in rainfall from July to October over the Arakan coast.
Myanmar,Thailand,Vietnam,Laos,Cambodia
Equatorial MonsoonRegion
This region is influencedbytheNorth Australian-Indonesian monsoon regime. The continent ocean-heat contrast makes it the strongest component of the southern hemisphere circulation.
AreasaroundMalaysia,Bruneiand Sulawesi receive more rain during northern winter, while for areas between Latitude 110°–120°E,thenorthwestwinds during the southern summer monsoon bring more rainfall(500–700mm).Theregion lying between the EquatortoLongitude5°Sbetween Sulawesi and New Guineareceivesrelativelyhigh precipitation during the northern summer monsoon period in July. The movement of theITCZintheequatorialzonealso causes rain to fall in spring (April)andautumn(October).
Singapore, Malaysia,Indonesia, Sumatra, Timor-Leste, BorneoandBrunei

Section 1 Introduction
12
Rainfall regime Description Major characteristics Countries/Areas
PacificMonsoonRegion
This region is subject to the influenceofWestern North PacificMonsoonregime with less significant continentality.
The maximum rainfall on the northwest coast is attained during the moisture-laden southwest monsoon in July, whereas the maximum rainfall of the east coast is attained during the northeast monsoon blowingfromthePacific.
Philippines
Source:(SynthesizedfromKripalaniandKulkarni,1998)
The primary source of inter-annual variability in climate in Southeast Asia is the El Nino-SouthernOscillation(ENSO)phenomenon.ENSOresultsfromtheinteractionbetweenlarge-scaleoceanandatmosphericcirculationprocessesintheequatorialPacificOcean.ThereisacorrelationbetweenENSOandprecipitationanomalies inSoutheastAsia.PrecipitationassociatedwithwarmENSOevents(ElNino)tendtobebelownormalwithalargerrangeofvariation,whereasthatassociatedwithcoldevents(LaNina)tendtobeabovenormalwithasmallervariationrange(Xuet al.,2004;KripalaniandKulkarni,1997).
Recentstudiesindicatethatbetween1955and2007,annualmean,maximumandminimumtemperatures increased by 0.17 degreesC per decade and 0.24 degreesC per decaderespectivelyovertheAsiaPacificregion(Choietal.,2009).Theseincreasessurpassedthewarming rate of globalmean surface temperature (0.13±0.03degreesCper decade)between1956and2005(IPCC,2007).Therateof increaseinminimumtemperatures isgenerallygreaterthanthatofmaximumtemperatures(Table3)
Table 3: Linear trends (degrees C per decade) in maximum and minimum temperatures in Vietnam, Thailand and Malaysia
Countries Maximum temperature Minimum Temperature
Winter Summer Annual Winter Summer Annual
Vietnam 0.250 0.187 0.242 0.273 0.178 0.206
Thailand 0.161 0.203 0.164 0.559 0.261 0.361
Malaysia 0.192 0.162 0.157 0.236 0.255 0.230
Allthetrendsaresignificantatthe95%level(Choietal.,2009)
Significant changes in annual, seasonal maximum and minimum temperature means are associatedwith changes in frequencyof extreme temperatureevents in theAsia PacificRegion (Choi et al., 2009). Between 1955 and 2007, average frequency of cool nightsdecreasedby6.4days/decade,whereasthatofcooldaysdecreasedby3.3daysperdecade.On the other hand, the frequency of warm nights increased by 5.4 days per decadewhereasthatofwarmdaysincreasedby3.9daysperdecadeoverthesameperiod.FurtheranalysisbyChoiet al. (2009)indicatethattherateofchangeofthefrequencyofwarmandcooldaysandwarmnightshasacceleratedconsiderablysincethelate1980s,whereas
Section 1 Introduction
13
thefrequencyofcoolnightshasdecreasedmoreorlesslinearlysincethemid-1950s.ThestrongestchangesinextremesareobservedinnortherntropicalregionsincludingMalaysiaand Thailand, where the maximum decrease rate in annual frequency of cool nights amounts to-22daysperdecade,andthemaximumincreaserateofannualfrequencyofwarmnightsrisesto25daysperdecade.
Unlike temperature, seasonal and annual precipitation inAsia Pacific does notmanifestspatially coherent trends. Whereas there are linear trends in annual and seasonal total precipitation between 1955 and 2007, these trends are not statistically significant. Theincrease in seasonal total precipitation is largely due to increases in intensity of rainfall events (Choi et al., 2009). Summarily, the seasonal shifts inweather have exposed theregiontoannualfloodsanddroughts.
1.3 Future Climate of Southeast Asia
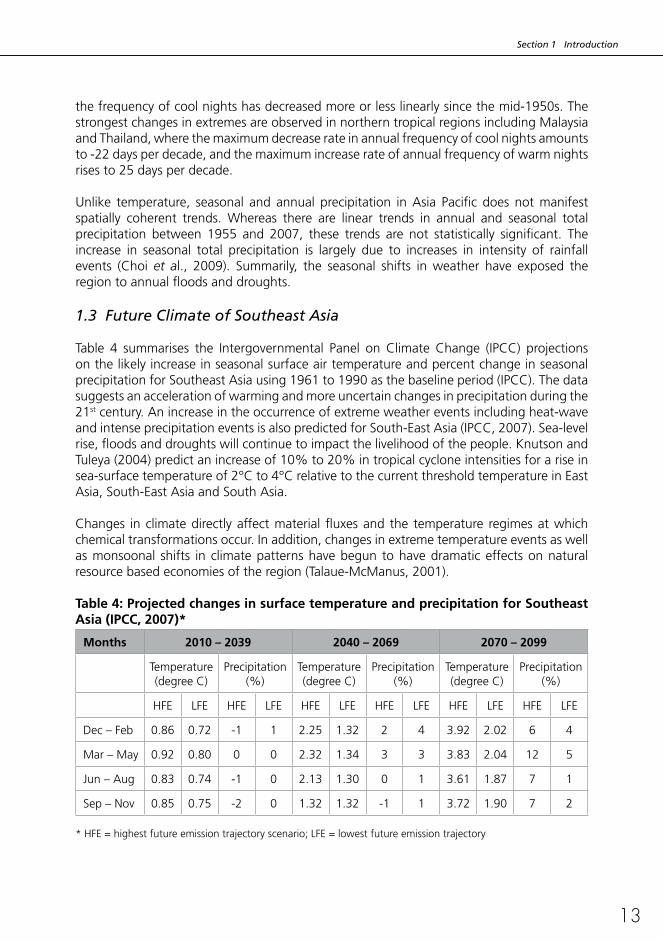
Table 4 summarises the Intergovernmental Panel on Climate Change (IPCC) projectionson the likely increase in seasonal surface air temperature and percent change in seasonal precipitationforSoutheastAsiausing1961to1990asthebaselineperiod(IPCC).Thedatasuggests an acceleration of warming and more uncertain changes in precipitation during the 21st century. An increase in the occurrence of extreme weather events including heat-wave andintenseprecipitationeventsisalsopredictedforSouth-EastAsia(IPCC,2007).Sea-levelrise,floodsanddroughtswillcontinuetoimpactthelivelihoodofthepeople.KnutsonandTuleya(2004)predictanincreaseof10%to20%intropicalcycloneintensitiesforariseinsea-surfacetemperatureof2°Cto4°CrelativetothecurrentthresholdtemperatureinEastAsia, South-East Asia and South Asia.
Changes inclimatedirectlyaffectmaterialfluxesand the temperature regimesatwhichchemical transformations occur. In addition, changes in extreme temperature events as well as monsoonal shifts in climate patterns have begun to have dramatic effects on natural resourcebasedeconomiesoftheregion(Talaue-McManus,2001).
Table 4: Projected changes in surface temperature and precipitation for Southeast Asia (IPCC, 2007)*
Months 2010 – 2039 2040 – 2069 2070 – 2099
Temperature (degreeC)
Precipitation(%)
Temperature (degreeC)
Precipitation(%)
Temperature (degreeC)
Precipitation(%)
HFE LFE HFE LFE HFE LFE HFE LFE HFE LFE HFE LFE
Dec–Feb 0.86 0.72 -1 1 2.25 1.32 2 4 3.92 2.02 6 4
Mar–May 0.92 0.80 0 0 2.32 1.34 3 3 3.83 2.04 12 5
Jun – Aug 0.83 0.74 -1 0 2.13 1.30 0 1 3.61 1.87 7 1
Sep – Nov 0.85 0.75 -2 0 1.32 1.32 -1 1 3.72 1.90 7 2
*HFE=highestfutureemissiontrajectoryscenario;LFE=lowestfutureemissiontrajectory

Section 2 Biodiversity in Southeast Asia: State and Drivers of Decline
14
2.1 Global Trends
Currently,globalbiodiversityischangingatanunprecedentedrateandscaleinresponseto human-induced perturbation of the Earth System. Fossil records indicate that thebackgroundextinctionrate(thatisPre-Industrialvalue)formostspeciesis0.1–1extinctionsper million species per year. Over the past years however, the species extinction rate has increasedtomorethan100extinctionspermillionspeciesperyear(MA,2005a).Thereisastrong linkage between biodiversity loss and human-driven ecosystem processes from local to regional scales.
In spite of the commitment of Governments in 2002 to curtail the rate of biodiversitylossby2010,virtuallyallregionsoftheworldarecurrentlyexperiencingalarmingratesofbiodiversitydecline(GBO,20103).Notwithstandingsomepolicyandmanagementresponsesuccesses, there have been severe declines in population trends of vertebrates, habitat specialist birds, shorebird populations, and extent of forest and mangroves as pressures on biodiversityincreaseacrossworldregions(Butchartet al.,2010).
2.2 State of Biodiversity and Biodiversity Hotspots
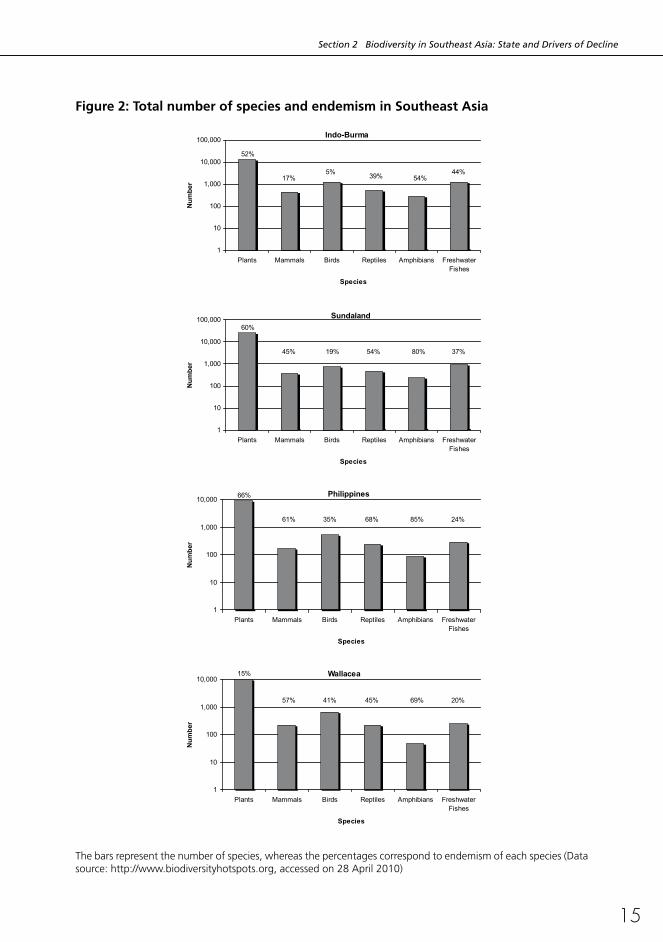
Southeast Asia is one of the most biodiverse regions of the planet. Even though the region occupiesjust3percentoftheworld’ssurface,itaccommodatesabout20%ofallplant,animalandmarinespecies.SoutheastAsiaincludes3megadiversecountries(Indonesia,MalaysiaandPhilippines)andcontains4oftheworld’s25biodiversityhotspots4 as designated by ConservationInternational(CI)(Figure2).MostofthecountriesintheregionfallwithintheIndomalaysia/Melanesialandmass,categorizedasoneofthethreecoreareasofbioculturaldiversity(Maffi,2007).Assuch,communitiesholdarichgermplasmoflandracesofvariouscrops.Forexample,anon-farm/communitydiversityofcropssurveyfoundthatricerichnessinVietnamvariedfrom9to74varietiespercommunity(Jarviset al.,2008).
Endemicityofplantsinthesebiodiversityhotspotsvariesfrom15%forWallaceato66%forPhilippines.Forexample,inthePhilippinesthereare9,250vascularplantspecieswith65.8%endemism,1000speciesoforchidsand165speciesofmammals(102endemicand47threatened)asreportedbytheASEANCentreforBiodiversity.
3SecretariatoftheConventiononBiologicalDiversity,2010,GlobalBiodiversityOutlook3,Montreal.4Abiodiversityhotspotisabiogeographicalregionrichinbiodiversitybutunderanthropogenicthreat.Biodiversity
hotspot designation is developed to assess global conservation priority. It is based on the criteria that the region mustcontainatleast1500speciesofendemicvascularplantsand70%ofitsoriginalhabitatmusthavebeenlost(Myerset al.,2000).
2. Biodiversity in Southeast Asia: State and Drivers of Decline
Section 2 Biodiversity in Southeast Asia: State and Drivers of Decline
15
Figure 2: Total number of species and endemism in Southeast Asia
1
10
100
1,000
10,000
100,000
Plants Mammals Birds Reptiles Amphibians FreshwaterFishes
Species
Num
ber
52%
17%5% 39% 54%
44%
Indo-Burma
1
10
100
1,000
10,000
100,000
Plants Mammals Birds Reptiles Amphibians FreshwaterFishes
Species
Num
ber
60%
45% 19% 54% 80% 37%
Sundaland
1
10
100
1,000
10,000
Plants Mammals Birds Reptiles Amphibians FreshwaterFishes
Species
Num
ber
66%
61% 35% 68% 85% 24%
Philippines
1
10
100
1,000
10,000
Plants Mammals Birds Reptiles Amphibians FreshwaterFishes
Species
Num
ber
15%
57% 41% 45% 69% 20%
Wallacea
Thebarsrepresentthenumberofspecies,whereasthepercentagescorrespondtoendemismofeachspecies(Datasource: http://www.biodiversityhotspots.org,accessedon28April2010)
Section 2 Biodiversity in Southeast Asia: State and Drivers of Decline
16
The aforementioned biodiversity hotspots are not the only areas in the region that harbor highbiodiversityandhighnumbersofendangeredspecies.Montaneecosystemsthroughouttheregionareparticularlynotedforthediversityofspeciesthattheyaccommodate(refertoBox1).
Box 1: Biodiversity of montane ecosystems in Thailand
Several of the upper and lower montane forest habitats in Thailand receive protection as national parks and sanctuaries where subalpine vegetation and varying dominant tree species and forest structure between the eastern and northeastern and southern peninsular regions can be found. Protectedareascoverabout20%oflandarea.However,theecologicalservicesareasfacepressuresfromruralpovertyandpopulationmigrationtomountains,deforestationtocropland,overgrazinganddegradation(Thailand3rdNationalReportontheImplementationoftheCBD,2006).Overall,in Southeast Asia habitat loss has been characterized as particularly severe (Sodhi and Brook,2006).
Thailandhas302 speciesofmammalsofwhich116are considered threatened. Thereare35endangered species including theAsian tapir (Tapirus indicus) foundonly in thewestern andsouthernmountainsofThailandandthetiger(Panthera tigrus)ofwhichonly75arefoundinthemountain regions. There are also at least 66 endangered bird species including the Rufous-necked hornbill(Aceros nipalnesis)whosehabitatintheevergreenforestsisbeingdestroyed.Therearealsoabout1,424threatenedplantspecieswith94endangeredwildspeciesofforestplantsseveralofwhicharecollectedforsaleandillegaltrade(wildanimalsarealsoillegallytraded)andalsofacehabitatdestruction(ThailandThirdNationalReportontheImplementationoftheConventiononBiologicalDiversity,2006).
Even though a small number of species has actually become extinct from the region, the relatively recent deforestation history and the associated fragmentation of natural habitats isexpectedtoacceleratebiodiversitydeclineinthecomingyears(Sodhietal.,2004).Severalspecies native to the area are currently considered as vulnerable (VU), endangered (EN)orcriticallyendangeredbytheInternationalUnionfortheConservationofNature(IUCN,2010).
2.3 Drivers of Biodiversity Loss
Sala et al.,(2000)recognizefivemajordriversofbiodiversityloss,namelylanduse,climate,nitrogen deposition, biotic exchange and atmospheric carbon dioxide. The importance of these drivers varies from one ecosystem to the other. Land-use change (especiallydeforestation) and climate change generally have the greatest impact for terrestrialecosystems,whereasbioticexchangeismoreimportantforfreshwaterecosystems(Salaet al.,2000;Table5).

Section 2 Biodiversity in Southeast Asia: State and Drivers of Decline
17
Table 5: Impact of a large change in each driver on the biodiversity of selected world biomes by 2100
DriverBoreal Forest
Grassland Savanna Southern Temperate
Forests
Tropical Forests
Land Use 5.0 5.0 5.0 5.0 5.0
Climate 3.5 3.0 3.0 2.0 3.0
Nitrogen deposition 3.0 2.0 2.0 3.0 1.0
BioticExchange 1.0 2.0 2.0 3.0 1.5
AtmosphericCarbonDioxide 1.0 3.0 3.0 1.5 1.0
Note:Unitchangeofthedriverwasdefinedforlanduseasconversionof50%oflandareatoagriculture,forclimateasa4°Cchangeor30%changeinprecipitation,fornitrogendepositionas20kgha–1 year–1, for biotic exchangeasthearrivalof200newplantoranimalspeciesby2100,andforCO
2asa2.5-foldincreaseinelevated
CO2asprojectedby2100,Estimatesvaryfromlow(1)tohigh(5)impactbasedonscenariomodelingandexpert
knowledge(Salaetal.,2000).
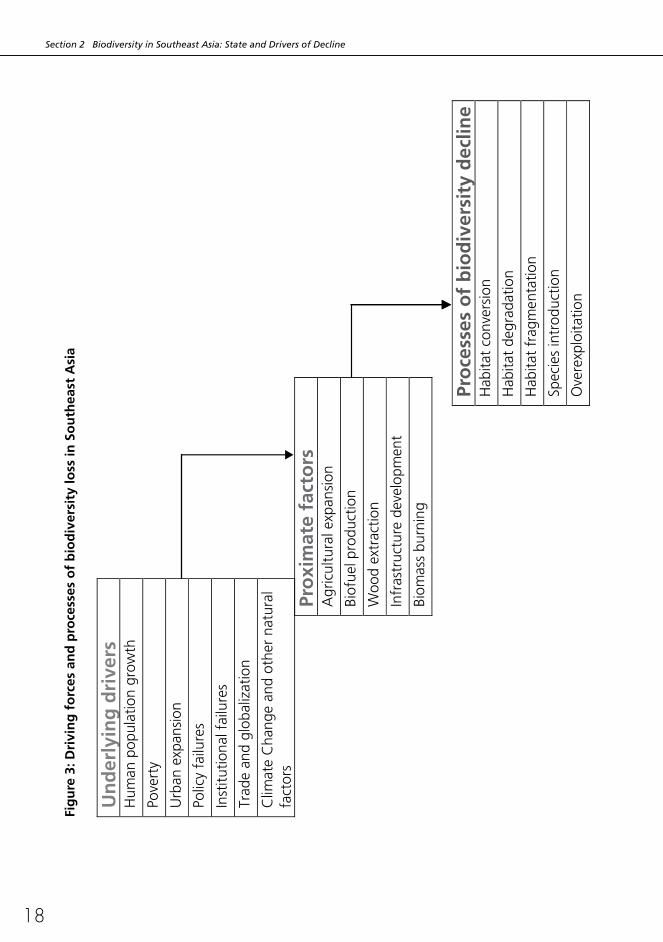
A suitable framework for assessing biodiversity decline in Southeast Asia is presented in Figure3.Theframeworkrecognizesthattheprocessesofbiodiversitylossaredrivenbyacombinationofproximatefactorsandunderlyingdrivers.Proximatecausesarenearfinalorfinalhumanactivities(e.g.agriculturalexpansion)thatdirectlyaffecttheenvironment,whereastheunderlyingforces(e.g.populationgrowth)aretherootcausesorfundamentalfactors behind the proximate sources. Proximate factors operate more at local scales,whereasunderlyingforcescanoperateatscalesrangingfromnationaltoglobal(Turneretal.,1993).Attentionismoreoftenfocusedonproximatecausesofbiodiversity loss(e.g.Sodhi et al.,2004),butconservationactionsthatconsideroraddressonlyproximatecausesor single drivers of biodiversity loss are unlikely to be effective because most often drivers act synergistically in threatening biodiversity.
Of the various processes leading to biodiversity loss, the most notorious is habitat destruction (PrimmandRaven,2000), anenvironmentalprocess that rendershabitatsunsuitable tosupportspecies.Consideringthattropicalforestsarethekeyhabitats,habitatlossduetodeforestationisamajordriverofbiodiversitylossintheregion.However,beforediscussingthekeydrivingfactorsvis-à-vistheirimpactsonbiodiversityinSoutheastAsia(Sections3and4),wefirsthighlighttheinextricablelinkagebetweendeforestationandhabitatloss.
Currently,theproportionoflandareaoccupiedbyforestsintheregionvariesfrom3percentforSingapore to70percent forLaos,but theannual regional rateofdeforestation (1.3percent)isamongthehighestintheworld(Table1).InmostSoutheastAsiancountries,forestarea change has been negative despite implementation of afforestation and reforestation projects.Forexample,Thailand’sforestresourcesincludingevergreenmontanerainforestsweremarkedlyreducedbetweenthe1960sand1980sbyconversiontoagriculture,landresettlement, and dam and road construction. Indonesia also experienced high rate of deforestationbetween1990and2005. Infact,afterBrazil, Indonesiasufferedthenextlargestannual forest lossbetween2000and2005ata rateof -1871 thousandha/year(FAO,2010a).Thisgivessomesupport topredictionsthat intheabsenceofappropriateinterveningpolicies,by2100,aquarterofbiodiversityinSoutheastAsiamaybewipedoutbydeforestation(SodhiandBrook,2006).
Section 2 Biodiversity in Southeast Asia: State and Drivers of Decline
18
Fig
ure
3: D
rivi
ng
fo
rces
an
d p
roce
sses
of
bio
div
ersi
ty lo
ss in
So
uth
east
Asi
a
U
nd
erly
ing
dri
vers
H
um
an p
opul
atio
n gr
owth
Pove
rty
Urb
an e
xpan
sion
Polic
y fa
ilure
s
Inst
itutio
nal f
ailu
res
Trad
e an
d gl
obal
izat
ion
Clim
ate
Cha
nge
and
othe
r na
tura
l fa
ctor
s
Pro
xim
ate
fact
ors
A
gric
ultu
ral e
xpan
sion
Biof
uel p
rodu
ctio
n
Woo
d ex
trac
tion
Infr
astr
uctu
re d
evel
opm
ent
Biom
ass
burn
ing
Pro
cess
es o
f b
iod
iver
sity
dec
line
Hab
itat
conv
ersi
on
Hab
itat
degr
adat
ion
Hab
itat
frag
men
tatio
n
Spec
ies
intr
oduc
tion
Ove
rexp
loita
tion
Section 2 Biodiversity in Southeast Asia: State and Drivers of Decline
19
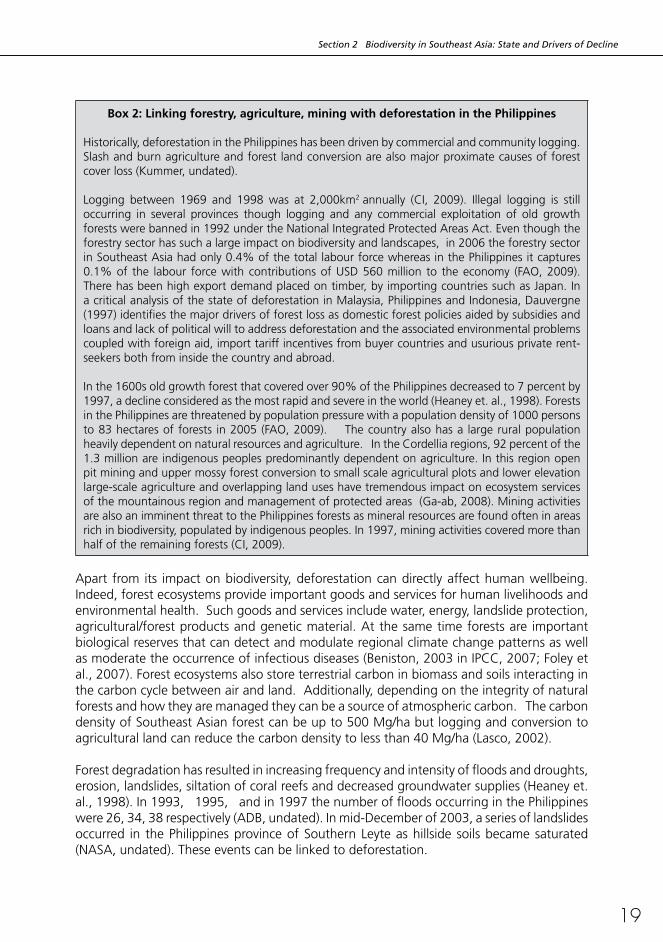
Box 2: Linking forestry, agriculture, mining with deforestation in the Philippines
Historically,deforestationinthePhilippineshasbeendrivenbycommercialandcommunitylogging.Slash and burn agriculture and forest land conversion are also major proximate causes of forest coverloss(Kummer,undated).
Logging between 1969 and 1998was at 2,000km2annually (CI, 2009). Illegal logging is stilloccurring in several provinces though logging and any commercial exploitation of old growth forestswerebannedin1992undertheNationalIntegratedProtectedAreasAct.Eventhoughtheforestrysectorhassuchalargeimpactonbiodiversityandlandscapes,in2006theforestrysectorinSoutheastAsiahadonly0.4%ofthetotallabourforcewhereasinthePhilippinesitcaptures0.1%of the labour forcewithcontributionsofUSD560million to theeconomy (FAO,2009).There has been high export demand placed on timber, by importing countries such as Japan. In acriticalanalysisofthestateofdeforestationinMalaysia,PhilippinesandIndonesia,Dauvergne(1997)identifiesthemajordriversofforestlossasdomesticforestpoliciesaidedbysubsidiesandloans and lack of political will to address deforestation and the associated environmental problems coupled with foreign aid, import tariff incentives from buyer countries and usurious private rent-seekers both from inside the country and abroad.
Inthe1600soldgrowthforestthatcoveredover90%ofthePhilippinesdecreasedto7percentby1997,adeclineconsideredasthemostrapidandsevereintheworld(Heaneyet.al.,1998).ForestsinthePhilippinesarethreatenedbypopulationpressurewithapopulationdensityof1000personsto83hectaresofforests in2005(FAO,2009). Thecountryalsohasa largeruralpopulationheavilydependentonnaturalresourcesandagriculture.IntheCordelliaregions,92percentofthe1.3millionareindigenouspeoplespredominantlydependentonagriculture.Inthisregionopenpit mining and upper mossy forest conversion to small scale agricultural plots and lower elevation large-scale agriculture and overlapping land uses have tremendous impact on ecosystem services ofthemountainousregionandmanagementofprotectedareas(Ga-ab,2008).MiningactivitiesarealsoanimminentthreattothePhilippinesforestsasmineralresourcesarefoundofteninareasrichinbiodiversity,populatedbyindigenouspeoples.In1997,miningactivitiescoveredmorethanhalfoftheremainingforests(CI,2009).
Apart from its impact on biodiversity, deforestation can directly affect human wellbeing. Indeed, forest ecosystems provide important goods and services for human livelihoods and environmental health. Such goods and services include water, energy, landslide protection, agricultural/forest products and genetic material. At the same time forests are important biological reserves that can detect and modulate regional climate change patterns as well asmoderatetheoccurrenceofinfectiousdiseases(Beniston,2003inIPCC,2007;Foleyetal., 2007).Forestecosystemsalsostoreterrestrialcarboninbiomassandsoilsinteractinginthe carbon cycle between air and land. Additionally, depending on the integrity of natural forests and how they are managed they can be a source of atmospheric carbon. The carbon densityofSoutheastAsianforestcanbeupto500Mg/habutloggingandconversiontoagriculturallandcanreducethecarbondensitytolessthan40Mg/ha(Lasco,2002).
Forestdegradationhasresultedinincreasingfrequencyandintensityoffloodsanddroughts,erosion,landslides,siltationofcoralreefsanddecreasedgroundwatersupplies(Heaneyet.al.,1998).In1993,1995,andin1997thenumberoffloodsoccurringinthePhilippineswere26,34,38respectively(ADB,undated).Inmid-Decemberof2003,aseriesoflandslidesoccurred in thePhilippinesprovinceofSouthernLeyteashillsidesoilsbecamesaturated(NASA,undated).Theseeventscanbelinkedtodeforestation.

Section 3 Human Related Drivers of Biodiversity Decline
20
3.1 Agriculture
3.1.1 Agricultural Expansion
AgriculturecontributessignificantlytotheGDPofmostcountriesintheregion,forexample33%ofGDP inCambodiaand11.4%inThailand (FAO,2006). Agricultural labourhasbeen decreasing simultaneously with a decrease in rural populations in the region, for example,inMalaysiaitdecreasedfrom41%in1979to16%in2004(FAO,2006).Evenso,severalcountriesstillhavelargeruralpopulationslargelydependentonagriculture(Zhaiand Zhuang, 2009). Cambodia’s rural population remained relatively highmoving from88%in1979to81%oftotalpopulationin2004(FAO,2006).
At the same time the production and trade of agricultural commodities has increased significantlythroughouttheregionsincethe1960s.WiththeexceptionofCambodiaandthePhilippines,allothercountrieshavemorethandoubledtheircultivatedarea(seeFigure4).Thisagriculturalexpansionismainlyattheexpenseofnaturalecosystemsandparticularlyprimary forests.
Figure 4: Agricultural land use in S.E. Asia
0.0
10.0
20.0
30.0
40.0
1961
1964
1967
1970
1973
1976
1979
1982
1985
1988
1991
1994
1997
2000
2003
2006
Agricutural area (m
illion ha
)
Cambodia
Indonesia
Laos
Malaysia
Myanmar
Philippines
Thailand
Vietnam
Source: (FAO, 2010b) Source:(FAO,2010b)
3. Human Related Drivers of Biodiversity Decline

Section 3 Human Related Drivers of Biodiversity Decline
21
Even though this agricultural expansion is to be expected in a region that faces some of the highest incidences of malnutrition globally, it is interesting to note that the expansion happened simultaneouslywithan increase in the tradeof agricultural commodities (seesection3.4).An interestingexample is the caseofoil palmcultivation in IndonesiaandMalaysia5. Estimates indicate that both countries have increased their cultivated land area by 113.1%and189.2%respectivelybetween1961and2007(FAO,2010b)withasignificantfractionofthisagriculturalexpansionbeingtheresultofoilpalmexpansion(refertoFig.5).In2008,oilpalmplantations,constituted13.9%and60.2%ofthetotalagriculturallandinIndonesiaandMalaysiarespectively.Asaresult,IndonesiaandMalaysiahavebecomethemajoroilpalmexporterscapturingmorethan90%oftheglobalmarket.Infact,Malaysiaappearstohaveshifteditsfocusfromrubbertopalmoilexportsinordertocapitalizeonthemultipledemandofoilpalmforfoodandenergy(biofuel).However,thisagriculturalexpansion did not come without any adverse environmental effects.
Agriculture, extensive monoculture in particular, is a significant driver of biodiversity decline (MA,2005b).Sodhiet al.(2004)suggestthatconversionofprimaryforestforagriculturaluses has a particularly detrimental impact on biodiversity given the combined effects of habitat loss/fragmentation and the subsequent depletion of nutrients from the soils. Oil palm plantations are particularly hostile to biodiversity and are major agents of deforestation andotherdriversofbiodiversityloss(seeSection3.2formoredetails).
Figure 5: Oil palm expansion in Indonesia and Malaysia
Source:(FAO,2010b)
5Palmoilisthemostproducedandtradedvegetableoilglobally(FAO,2010).Asaresultithastraditionallybeenanimportantpartofthedietinseveralareasoftheworld.However,significantamountofpalmoilisnowusedfortheproductionoftransportfuel(i.e.biodiesel),refertoSection3.3.
Section 3 Human Related Drivers of Biodiversity Decline
22
3.1.2 Land Management and Tenure Systems
Disturbed lands broadly refer to any land that includes secondary, fragmented andselectively logged forests. Swidden lands canalsobe categorizedasdisturbed landsasswidden agriculture involves “cutting living vegetation in the dry season, letting it dry, burning it late in the dry season and then planting a crop in the ashes early in the wet season”(FoxandVolger,2005).SwiddencultivationhasbeenthepredominantmethodofcultivationinSoutheastAsiaforcenturies.Althoughitstillcomprises25-33%oflandusein the region, swidden cultivation has progressively decreased, giving way to settled and commercial cultivation of crops such as paddy, tree crops and oil palm, rubber and timber plantations. Swidden lands also go through a cyclical process of cultivation, fallow and secondary growth. Secondary growth in these tropical regions has been observed to be speciesdiverseandusefultosequestercarbon(Padochet al., 2007).
Swiddeners consciously cultivate a diverse set of landraces and varieties of a crop adapted tolocalconditions,whichareincreasinglylostduringtheprocessofcommercialization.Forexample,inVietnam,currentlyonlyfivegeneticallyengineeredvarietiesofricearecultivatedonalargescaleversus20traditionalvarietiescommonlycultivatedearlier(Cassellini,2001).Similar reports from Thailand indicate that there has been a decrease in the number of rice germplasm collections in the country, as farmers have taken to planting new varieties, and paddy fields are giving way to urban development. This is the case of several indigenous varieties, which have been lost due to loss of natural habitats (Thailand Third NationalReportontheImplementationoftheConventiononBiodiversity,2006).Thereductioninswidden cultivation is also a result of government policies to promote nature preserves, other development projects and encourage commercial cultivation of cash crops and plantations.
While some researchers call for a revisit of policies towards swidden farming, it is also noteworthy that the extent of this practice has not been properly documented and such landuseisusuallyclassifiedas‘other’typesofforest/degradedforests/secondarygrowth,therebyobstructingeffortstomonitorbenefitsfromsuchlandusepractices.Community-led environmental governance is being increasingly recognized and mainstreamed intoforestconservationpoliciessuchasCommunityForestPrograms.Suchinitiativeshaveledtoasignificantincreaseinforestregenerationandanimprovementindiversity(Ravindranathet al., 2006).Mostrecentlythedirectimpactofruralpeoplesontropicalforestsappearstohavestabilizedandcouldevenbediminishinginsomeareas(ButlerandLaurence,2008).
Othercultivationpracticesharmfultobiodiversityincludedrainage,fertilizerrun-offfromtheplantationsandtheuseofagrochemicals(refertoSection4.2).Forexample,approximately25different pesticides are deployed in oil palmplantations in Indonesia,which are notmonitored as they are not controlled or documented (Down to Earth, 2005)Owing togovernmentsubsidiesonpesticidesandfarmchemicalsinVietnam,pesticideapplicationsby farmersonfieldcropsandorchardsexceededthepermissible limitsby2–45 times,leading to increased pest resistance along with other ecological impacts.

Section 3 Human Related Drivers of Biodiversity Decline
23
Land Tenure
Land tenure is highly diversified in Southeast Asia. A recent study of land tenure systems in the region indicates that neither state nor private/customary land allocation guarantees tenuresecurity(Table6).Landtenureproblemsintheregionrelatetofragmentedpolicyframeworks that result in multiple laws and regulations that weaken the negotiating positions of landholders, increase land disputes, complicate co-ordination between different government departments concerned with land administration, and hinder adequate land financing opportunities (Guo, 2007). In countries such as Vietnam where liberalizationallowed a free market whilst the state retained formal ownership, there has been a sharp increase inrural landlessnessamongstthepoorandthenon-poor (RavallionandvandeWalle,2008).Theimpactofthelandlessor“shiftedcultivators”onbiodiversityhaslongbeenrecognizedintheliterature(e.g.Myers,1985).Duetolackofalternatives,thelandlessshift to available unoccupied public land – usually forests. The lack of tenure security in the new found land also implies lack of incentive to invest in environment-conserving technology.Clearly, these are challenges that need tobeovercome,within thepoliticalrealities of a country, to ensure better land management and developing pragmatic land tenure systems is seen as an essential driver to this effect, whether they be in terms of clear title deeds, or clear terms of usufructory rights between different stakeholders.
In recent times, most governments in Southeast Asia have reworked tenure systems in forest areas and have reclassified previously community-held and managed lands as nature preserves belonging to the State. It is noteworthy that the degree of removal of non-wood forestproductsisverylowincountrieswherestateownershipiscomplete.Conversely,inVietnam,wherestatecontrolismixedwithprivateandotherformsofcontroloverforests,the forests continue to be accessed for non-wood requirements including food, medicine andculturalpurposes(FAO,2005a).Relocationofpeoplefromtheirnativeareastonewlocations has triggered degradation in the new areas as they were observed to be less caring oftheirnewenvironmentsthantheirculturallylinkedlands(Cassellini,2001),apartfromthepopulationpressureonlimitedspacesinthenewareas(FoxandVolger,2005).
Table 6: Classification of land tenure systems based on land allocation and tenure security
Greater role of private or customary allocation
Greater role of state land
allocation
Greater security of
tenure
Less security of tenure
Thailand √ √Vietnam √ √Laos √ √Cambodia √ √Philippines √ √Indonesia √ √
Source:(ModifiedfromGuo,2007)
Section 3 Human Related Drivers of Biodiversity Decline
24
It is understandable that different countries have different approaches to secure land tenure systems for different stakeholders. It is imperative that the policies are pragmatic within the socio-politicalcontexts,toallowconflictfreeuseandmanagementoflandsfordifferentproduction purposes. While in some cases, clear title deeds have been found effective, in some other cases as in Thailand, use of customary allocation of land and resources have been found effective. In either case, the terms of ownership and use are clear that allows decision making with minimal externalities.
3.1.3 Agriculture as a driver of climate change
Agricultural activities are significant emitters of global greenhousegases (GHGs) andassuch agricultural activity is a major driver of anthropogenic climate change. Emissions from agriculturalsourceswas14%ofglobalGHGemissionsin2000withdevelopingcountriesaccountingforthreequartersofagricultureemissionsinthecaseofrice(WRI,2006;Stern,2007).Climatechangehasbeenidentifiedasapotentiallysignificantthreattobiodiversityintheregion(refertoSection4).
As forests are cleared in the region for agricultural purposes, crop residues are burnt, agricultureisintensified(e.g.throughmechanizationandincreasedfertilizer/agrochemicaluse) and livestock are raised, large quantities of GHGs such as CO
2, CH
4 and N
2O are
emitted. Rice paddies, which have been increasing in productivity across Southeast Asia, areimportantemittersofCH
4(IPCC,2000).Apartfromthoseprimaryagriculturalactivities,
theassociatedland-usechangealsocontributessignificantlytoCO2emissions(IPCC,2007).
This additional contribution from land-use conversion seems to further unbalance the annualnetflowofCO
2 between agricultural lands and the atmosphere. Not only are these
emissions contributing to enhanced greenhouse effect, they also represent a loss of useful carbon and nitrogen which are potential energy sources for crop and plant production.
3.2 Biofuel Expansion
Firstgenerationbiofuels6 currently constitute one of the most controversial energy sources. Despiteinitiallybeingheraldedasenvironmentallyfriendlyenergyoptionsthereiscurrentlysignificantevidenceabouttheirnegativeimpactontheenvironment(e.g.SCOPE,2009),biodiversity(Fitzherbertet al.,2008)andtheclimate(Fargioneet al.,2008). Several countries in Southeast Asia are currently increasing their biofuel production capacity. The main factors behind this boost in biofuel production include energy security, climate mitigation and socioeconomic issues such as rural development, poverty alleviation, increased employment andforeignexchangesavings(YanandLin,2009).
ThemajorbiofuelproducersintheregionareIndonesia,Malaysia,Thailand,thePhilippinesandChina. According to Zhou and Thomson (2009), the adoption and proliferation ofbiofuel policies in the region are a result of energy security concerns and other socioeconomic issues(refertoTable7).Ontheotherhand,environmentalconsiderationsdonotseemtohaveinfluencedsignificantlytheproductionofbiofuelsgiventhatthesecountriesarenotrequired to reduce theirGHGemissionsunder theprevailingUnitedNationsFrameworkConventiononClimateChange(UNFCCC)agreements.
6e.g.bioethanolfromfoodcrops(sugarcane,corn,cassavaetc)andbiodieselfromoilseeds(e.g.fromoilpalm,soybeansetc).

Section 3 Human Related Drivers of Biodiversity Decline
25
Currentlybothbiodieselandbioethanolarepursuedasalternativetransportfueloptionsin the region but the availability of biofuel feedstocks is the main limiting factor for their production(refertoTable8).
Table 7: The main determinants of biofuel production in Southeast AsiaSecurity Economy Social Environment
Energy security
Trade balance
Priceofpetroleum
Economic development
Increase agricultural employment
Rural development
Climatechange
Air pollution
China √ √ √ √ √Malaysia √ √ √ √Indonesia √ √ √ √Philippines √ √ √ √Thailand √ √ √ √ √
Source:(ZhouandThomson,2009)
Table 8: Biofuels and feedstocks for the main Southeast. Asia producing nationsMain option Feedstock Secondary
optionFeedstock Comments
China Bioethanol Corn(mainly)and wheat (secondarily)
Biodiesel Animal fats and waste vegetable oil
Cassavaandsweet sorghum are used for bioethanol in an experimental basis. Assess the potential of rapeseed, Jatropha, sunflowerseeds,sesame seeds and several types of beans and nuts for biodiesel production.
Malaysia Biodiesel Palmoil
Indonesia Biodiesel Palmoil(mainly),Jatropha (secondarily)
Bioethanol Cassavaand sugarcane

Section 3 Human Related Drivers of Biodiversity Decline
26
Main option Feedstock Secondary option
Feedstock Comments
Philippines Bioethanolandbiodiesel
Sugarcane(forbioethanol)andcoconutoil(forbiodiesel)
Research and development is conducted in order to assess the feasibility of using Jatropha for biodiesel and cassava for bioethanol
Thailand Bioethanol Sugarcane and cassava
Biodiesel Palmoil and Jatropha
Source:(ZhouandThomson,2009)
Oilpalmisthemajorfeedstockcultivatedintheregion,particularlyinMalaysiaandIndonesia,forbiofuelproductionpurposes.Currentlythesetwocountriesaccountformorethan90%ofworldproductionwhilebothcountriesaresignificantexportersofthiscommodity(FAO,2010b)7. Concurrently, these twocountries containa significantportionof theplanet’sremaining tropical forests, which harbor several endangered species - indeed, Sundaland andWallacea,twooftheworld’stwenty-fivebiodiversityhotspots (Figure2). It is fearedthat the oil palm expansion spurred by biofuel production within the two countries and for feedstock exports can have significant impacts on biodiversity. In fact large scale oil palm cultivationcan influencedirectlyand indirectly threekeydrivers/processesofbiodiversityloss, namely habitat destruction, pollution and climate change.
KohandWilcove(2008)suggestthatpalmoilplantationsinMalaysiaandIndonesiahavereplaced to a great extent primary and secondary tropical forests and to a lesser extent pre-existingcropland.Accordingtotheircalculations,55-59%ofoilpalmexpansioninMalaysiaandat least56%in Indonesiaoccurredattheexpenseofprimaryforests.Fitzherbertet al., (2008) estimate thatbetween1990and2005,oil palmexpansion resulted inanetlossof1millionhectaresand1.7to3millionhectaresofforestinMalaysiaandIndonesiarespectively. The overall impact on biodiversity could be quite substantial.
Oil palm plantations harbor fewer species of birds (Peh et al., 2005) and butterflies(Hammer et al., 2003;Dumbrell andHill, 2005) than primary forest, logged forest andrubberplantations(Fitzherbertet al.,2008;Danielsenet al.,2009).Infact,inmostcasesthe majority of forest species was lost after the conversion to oil palm plantations and was replaced by smaller numbers of non-forest species, mainly generalist species of low conservationvalue(Danielsenet al.,2009).Thelossofbiodiversityinoilpalmplantations
7Noteherethatenergysecurityandenvironmentalconcerns(i.e.climatechangemitigation) indevelopingna-tions might be responsible for the phenomenal oil palm cultivation expansion in Southeast Asia. Indeed the EU is a major importer of palm oil from the S.E. Asia with an increasing quantity of this palm oil used for biodiesel productionpurposes.BothenergysecurityandclimatechangeconcernsarehighintheagendaoftheEuropeanCommissionwithsignificantpoliciesbeingadopted(mostnotablyDirective2009/28/EC).

Section 3 Human Related Drivers of Biodiversity Decline
27
is due to the fact that such habitats are structurally less complex than primary forests, have ashorterlifetimeandaremajorlandscapefragmentationfactors(Fitzherbertet al.,2008;Danielsenet al.,2009).
Oilpalms,likeallotherplants,emitVolatileOrganicCompounds(VOCs).ThereareconcernsthatoilpalmexpansionmightresultingreaterVOCemissions(RoyalSociety,2008;Hewittetal.,2009).Infact,Hewittetal.(2009)haveshownthatVOCandnitrogenoxides(NOx)emissions8 are greater from oil palm plantations than from surrounding primary rainforest. Additionally, land that is appropriated for oil palm cultivation is sometimes cleared through theuseoffire(e.g.vanderWerfetal.,2008),alsorefertoSection4.1.Biomassburninghas been identified as a major source of atmospheric pollution affecting significantly biogeochemicalcycles(Bytnerowiczet al.,2008;CrutzenandAndreae,1990).
ThepalmoilindustryhasbeeninthepastamajorsourceofpollutioninMalaysia(Muyibi,et al.,2008).Palmoilmilleffluent (POME) ischaracterizedbyhigh levelsofBiochemicalOxygenDemand (BOD).At the same timepalmplantations consume large amounts offertilizers–thelargestamountoffertilizersthananyothercropinMalaysia(FAO,2004;FIAM,2009),while theyare the thirdhighest consumerof fertilizers in Indonesia (FAO,2005b).HighBODandnutrientrunofffromfertilizerapplicationhavebeenassociatedwithsevere environmental problems such as eutrophication and hypoxia and as a result can significantly affect aquatic biodiversity.
LifeCycleAssessment(LCA)studieshaveshownthatbiodieselfrompalmoilhasgenerallylower GHG emissions than conventional fossil fuels (e.g. Zah et al., 2007; RFA, 2008).HoweverinsomecasesthesestudiesdonottakeintoconsiderationtheGHGemittedasa result of direct and indirect land-use change. Oil palm plantations are expected to be net carbon sinks only if they are established in crop/grassland and not on forested areas (Danielsenet al.,2009).Dependingontheforestclearingmethodused,itwouldtake75-93years9 for an oil palm plantation to compensate the carbon lost during the loss of the initialforestand692yearsifthathappensonpeatland.Ontheotherhand,iftheoilpalmiscultivatedongrasslanditwouldtakejust10yearstocompensateforthecarbonlostduringland-usechange.Similarfindingshavebeenreportedintheliterature(e.g.Fargioneet al., 2008;GermerandSauerborn,2008;Gibbset al.,2008),leadingtotheconclusionthatoilpalmbiodieselmight in factproducegreateramountsofGHGs thanconventional fossilfuels if direct and indirect land use impacts are considered.
3.3 Trade
Trade in agricultural commodities and endangered species have been two major underlying and interlinked drivers of biodiversity loss in S.E. Asia (Schipper et al., 2008). In factagricultural activities constitute one of the most important causes of biodiversity loss globally (e.g.MA,2005b)giventhatagricultureisamajordriverofhabitatlossandfragmentation
8VOCsandNOxaretroposphericozoneprecursors(O3)whichisbothapotentGHGandcanaffectanimalsand
plants. 9 The higher estimate corresponds to when fire use as a land clearing method.

Section 3 Human Related Drivers of Biodiversity Decline
28
as discussed in the previous sections. On the other hand trade can be directly linked with other direct drivers of biodiversity loss such as species overexploitation and introduction of species.
Despitethealmostuniversalunderstandingthatincreasedconsumptionandtradeactivitiescan negatively affect biodiversity, the mechanisms through which this happens are difficult todelineate.AccordingtoConway(1998)tradecanhaveindirect,policyandindependenteffectsonbiodiversityassummarized inFigure6.The independenteffectsare themoststraightforward to assess and have therefore received the greatest attention from academics and practitioners.
Figure 6: Effects of trade on biodiversity
Source:(RedrawnfromConway,1998)
Section 3 Human Related Drivers of Biodiversity Decline
29
Conway(1998)suggeststhatthereissignificantevidenceindicatingthattradeliberalizationin Indonesia has affected biodiversity through:
producteffects(e.g.rattan,wildlifetrade);structuraleffects(e.g.fisheries,mining);intensifiedextractionofnaturalresourcesforexport(e.g.shrimps,frogs);intensificationofmonoculture(e.g.oilpalm);policiesencouragingtradedevelopmentintradeintensivesectors(e.g.forestproducts,agriculturalproducts,oilandgas).
It is no wonder that there are different multi-lateral institutions and programmes to understand and regulate the trade of agricultural commodities and endangered species forthebenefitofbiodiversity.Forexample,between2005and2009,theUnitedNationsEnvironmentProgramme(UNEP)establishedanInitiativeonIntegratedAssessmentofTrade-RelatedPoliciesandBiologicalDiversityintheAgricultureSector.Theprimarygoaloftheinitiative is to enhance capacity in developing countries to develop and implement policies thatsafeguardbiologicaldiversitywhilstmaximizingsustainabledevelopmentgainsfromtradeliberalizationintheagriculturesector10.Perhapsthefirstmajorprogrammeconcernedwith the linkagebetweenbiodiversity loss and trade is theConventionon InternationalTrade in Endangered Species ofWild Fauna and Flora (CITES)11 that regulates the trade of threatened and endangered animals in order to assure their conservation. Currentlythereareapproximately900speciesincludedinAppendixI(mostthreatenedbytrade)andabout33,000species inAppendix II (notnecessarily threatenedwithextinctionbut thatmaybecomesoiftradeisnotcontrolledproperly).Populationsofalargenumberofthesespecies are found in or are endemic to Southeast Asia.
In fact, wildlife trade is a booming business in the region conducted both through formal andinformalnetworks(CITES,2010).Manyrecentstudieshaveshownthatthepresenceof the main wild traded species has declined in their natural habitats. This indicates the loss ofcommerciallyvaluablebiodiversityintheregionduetotradeandoverexploitation(WorldBank,2008).TheWildlifeTradeMonitoringNetwork(TRAFFIC)hasconductedstudiesonthe trade of endangered species. Its reports have suggested that wildlife trade in Southeast Asiaindeedposesathreattoregionalbiodiversity(refertoBox3).
10 http://www.unep.ch/etb/areas/biodivAgriSector.php 11 http://www.cites.org/
Section 3 Human Related Drivers of Biodiversity Decline
30
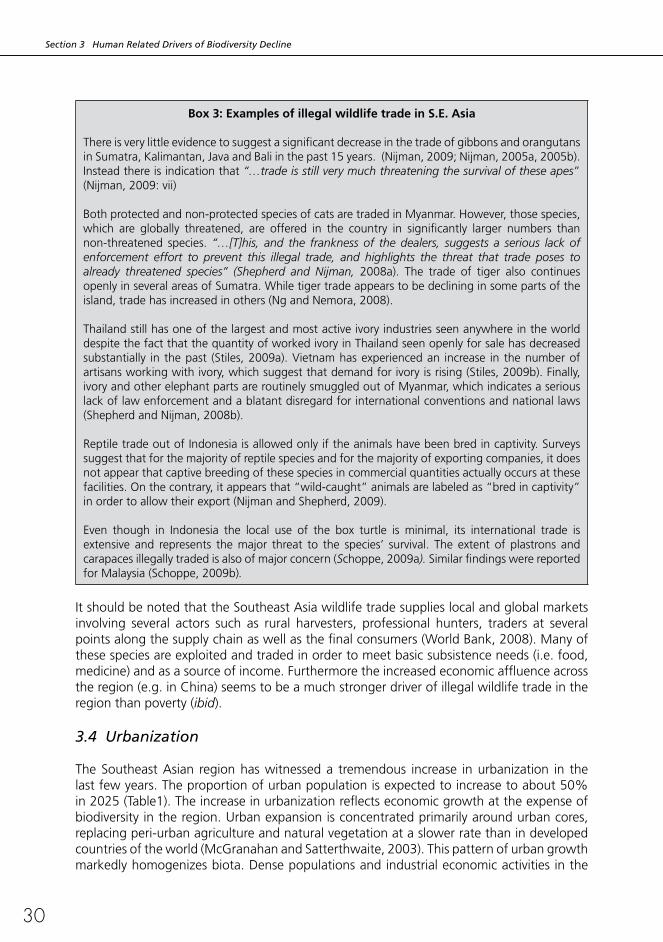
Box 3: Examples of illegal wildlife trade in S.E. Asia
There is very little evidence to suggest a significant decrease in the trade of gibbons and orangutans inSumatra,Kalimantan,JavaandBaliinthepast15years.(Nijman,2009;Nijman,2005a,2005b).Instead there is indication that “…trade is still very much threatening the survival of these apes” (Nijman,2009:vii)
Bothprotectedandnon-protectedspeciesofcatsaretradedinMyanmar.However,thosespecies,which are globally threatened, are offered in the country in significantly larger numbers than non-threatened species. “…[T]his, and the frankness of the dealers, suggests a serious lack of enforcement effort to prevent this illegal trade, and highlights the threat that trade poses to already threatened species” (Shepherd and Nijman, 2008a). The trade of tiger also continuesopenly in several areas of Sumatra. While tiger trade appears to be declining in some parts of the island,tradehasincreasedinothers(NgandNemora,2008).
Thailand still has one of the largest and most active ivory industries seen anywhere in the world despite the fact that the quantity of worked ivory in Thailand seen openly for sale has decreased substantially in thepast (Stiles,2009a).Vietnamhasexperiencedan increase in thenumberofartisansworkingwithivory,whichsuggestthatdemandforivoryisrising(Stiles,2009b).Finally,ivoryandotherelephantpartsareroutinelysmuggledoutofMyanmar,whichindicatesaseriouslack of law enforcement and a blatant disregard for international conventions and national laws (ShepherdandNijman,2008b).
Reptile trade out of Indonesia is allowed only if the animals have been bred in captivity. Surveys suggest that for the majority of reptile species and for the majority of exporting companies, it does not appear that captive breeding of these species in commercial quantities actually occurs at these facilities. On the contrary, it appears that “wild-caught” animals are labeled as “bred in captivity” inordertoallowtheirexport(NijmanandShepherd,2009).
Even though in Indonesia the local use of the box turtle is minimal, its international trade is extensive and represents themajor threat to the species’ survival. The extent of plastrons andcarapacesillegallytradedisalsoofmajorconcern(Schoppe,2009a). Similar findings were reported forMalaysia (Schoppe,2009b).
It should be noted that the Southeast Asia wildlife trade supplies local and global markets involving several actors such as rural harvesters, professional hunters, traders at several pointsalongthesupplychainaswellasthefinalconsumers(WorldBank,2008).Manyofthesespeciesareexploitedandtradedinordertomeetbasicsubsistenceneeds(i.e.food,medicine)andasasourceofincome.Furthermoretheincreasedeconomicaffluenceacrosstheregion(e.g.inChina)seemstobeamuchstrongerdriverofillegalwildlifetradeintheregionthanpoverty(ibid).
3.4 Urbanization
TheSoutheastAsian regionhaswitnesseda tremendous increase inurbanization in thelastfewyears.Theproportionofurbanpopulationisexpectedtoincreasetoabout50%in2025(Table1).Theincreaseinurbanizationreflectseconomicgrowthattheexpenseofbiodiversity in the region. Urban expansion is concentrated primarily around urban cores, replacing peri-urban agriculture and natural vegetation at a slower rate than in developed countriesoftheworld(McGranahanandSatterthwaite,2003).Thispatternofurbangrowthmarkedlyhomogenizesbiota.Densepopulationsandindustrialeconomicactivitiesinthe
Section 3 Human Related Drivers of Biodiversity Decline
31
urban centers places tremendous pressure on natural habitats. A recent study indicates that 29oftheworld’s825ecoregions12haveoverone-thirdoftheirareaurbanized,andthese29ecoregionsaretheonlyhomeof213endemicterrestrialvertebratespecies(McDonaldet al.,2008).Thesameauthorshaveshownthatseveralimportantandhighlybiodiverseeco-regionsinSoutheastAsiawerehighlyurbanizedin1995,e.g.WesternJavarainforests(22.7%urbanized),easternJava-Balirainforests(18.2%urbanized),Indochinamangroves(15.3%urbanized),WesternJavamontanerainforests (10.2%)andpeninsularMalaysiarainforests(10.1%urbanized)withurbanizationtrendsexpectedtoincreasedramaticallyinthecomingdecades.Singaporewith100%urbanizationisanotherexampleofthenegativeimpact of urbanization on biodiversity. In the process of urbanization, the country lostbetween34-87%ofbutterflies,fish,birdandmammalsforever(Sodhiet al.,2004).
Urban production and consumption activities are key urban processes that have been identifiedasparticularlydamaging tobiodiversity (PuppimdeOliveiraet al., 2010). Thelatter can be linked to the increase of transport and the global circulation of commodities. A tellingexampleintheregionisthecaseofVietnamwheretoxiceffluents,transport-relatedairpollution,heavymetalsandhazardouswasteenterthesewagesystemoraredumpedinlandfills,degradingfreshwater,marineandsoilsystems(Casselini,2001).
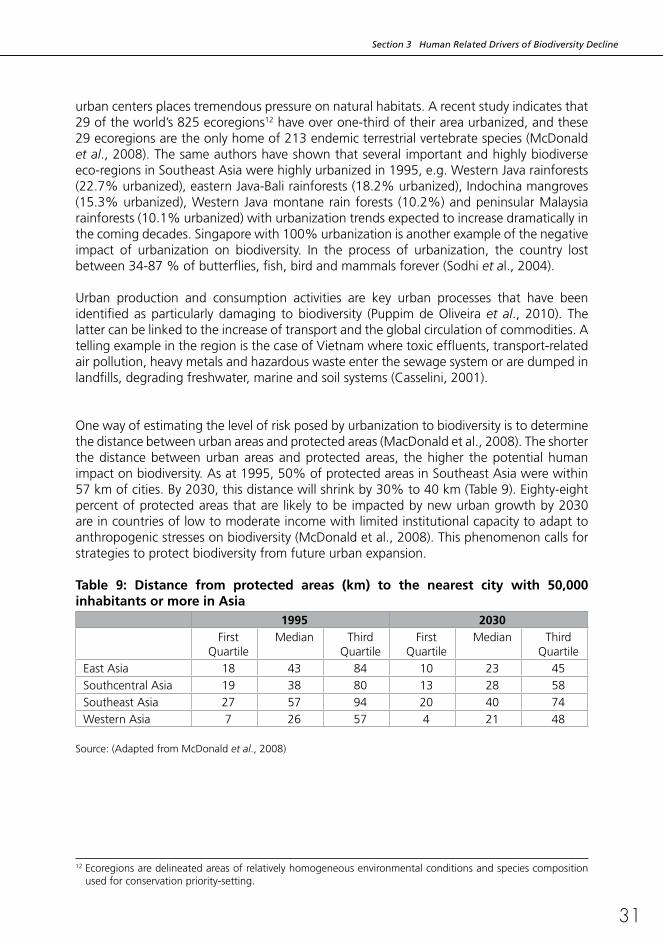
Onewayofestimatingthelevelofriskposedbyurbanizationtobiodiversityistodeterminethedistancebetweenurbanareasandprotectedareas(MacDonaldetal.,2008).Theshorterthe distance between urban areas and protected areas, the higher the potential human impactonbiodiversity.Asat1995,50%ofprotectedareasinSoutheastAsiawerewithin57kmofcities.By2030,thisdistancewillshrinkby30%to40km(Table9).Eighty-eightpercentofprotectedareasthatarelikelytobeimpactedbynewurbangrowthby2030are in countries of low to moderate income with limited institutional capacity to adapt to anthropogenicstressesonbiodiversity(McDonaldetal.,2008).Thisphenomenoncallsforstrategies to protect biodiversity from future urban expansion. Table 9: Distance from protected areas (km) to the nearest city with 50,000 inhabitants or more in Asia
1995 2030First
QuartileMedian Third
QuartileFirst
QuartileMedian Third
Quartile
East Asia 18 43 84 10 23 45
Southcentral Asia 19 38 80 13 28 58
Southeast Asia 27 57 94 20 40 74
Western Asia 7 26 57 4 21 48
Source:(AdaptedfromMcDonaldet al.,2008)
12 Ecoregions are delineated areas of relatively homogeneous environmental conditions and species composition used for conservation priority-setting.
Section 4 Climatic Impacts and Biodiversity Loss
32
Climatechangehasdirectandindirectimpactsonbiodiversity.Thedirecteffectsarethroughchanges in temperature and precipitation that affect individual organisms, populations, speciesdistribution,andecosystemcompositionsandfunctions.Globalwarmingisprojectedto increase the risk of extinction for already vulnerable species with limited climatic ranges andrestrictedhabitats(IPCC,2002)13. The indirect effects of climate change are through climatealteringtheintensityandfrequencyofperturbationssuchasforestfires.Changesin the frequency and intensity of perturbations affect whether, how and at what rates existingecosystemswillbereplacedbynewspecies(IPCC,2002).Climaticfactorstypicallyamplify the effects of anthropogenically-driven processes mentioned in the previous section in accentuating biodiversity loss. 4.1 Climate Change and Fires
Forestfiresareemergingasoneofthekeythreatstotropicalforests.Forestfiresrelease20-25%ofannualglobalcarbondioxideemissions(MoutinhoandSchwartzman,2005).The El Nino effect has been identified as a key factor that combined with other land managementpracticesto increasethedevastationofthefires in Indonesia (Sodhiet al., 2006).Theexperienceofthe1997/98ENSOparticularlydemonstrateshowtheeffectsofclimatechangeandlandusecansynergizetothreatenbiodiversityandecosystemservices.Drought conditions triggered by ENSO across Southeast Asia markedly increased treemortalityandflammability(Gullisonet al.,2007).Secondaryforestswerethemostaffectedin the1997-1998fires in SoutheastAsia (Murdiyarsoet al., 2002)withup to5millionhectaresand4.6%ofcanopytreesinIndonesiaaffected(Sodhiet al.,2006;Schweithelm,1998).Otherestimatesindicatethatin1997-1998,2002and2005,firesinSoutheastAsiadestroyedmorethanthreeoutofthe24millionhectaresofpeatlands(representing60%oftheworld’stropicalpeatlands).Inadditiontolossofhabitats,itisestimatedthat1000orangutans in Indonesia (2.5%of thepopulation)died fromthe1997-1998firesand itispredictedthatfuturefiresmaykillupto3.5%oftheorangutanpopulationperevent(Singletonet al.,2004;andSuhudandSaleh,2007).
Foreststhathaveexperiencedwidespreadoredgefiresbecomemoresusceptibletofurtherfires and adaptive species as their edges are drier and become more fragmented by previous fireoccurrence (Nepstadet al., 2001). Increasing frequencyand intensityofdryperiodssynergizewithforestdegradationandlandclearingandamplifiesthedevastatingeffectsofforestfires(Corlett,2003).
Forestincinerationreleasescarbondioxideintotheatmospherejoiningthefeedbackloopbetweenforestsandatmosphericcarbon(Strandetal.,2007).TheSoutheastAsianforestfiresof1997-1988releasedupto1.2billiontonsofcarbon.14TheregionalsmokehazecausedbytheforestfiresinsoutheastAsiain1980sand1990sreceivedmuchattention
13 Itshouldbenotedthatclimatechangemightnotbeasignificantdriverofbiodiversitylossinthetropics(Sodhiet al.,2004).However,thepoorunderstandingofthelinksbetweenclimatechangeandbiodiversitylossinSouth-east Asia as well the high uncertainties associated with its assessment have been highlighted in the academic literature(Sodhiet al.,2004).Neverthelessthereisevidencetosuggestthatverybiodiverseecosystemsinthetropics,particularlymontaneareascanbeseverelyaffectedbyclimatechange(Salaet al.,2000).
14InformationonASEANSecreatariatWebpage[http://www.aseansec.org].FurtherinformationonASEANhazecanbefoundat[http://haze.asean.org/].
4. Climatic Impacts and Biodiversity Loss

Section 4 Climatic Impacts and Biodiversity Loss
33
due to their impact on regional climate change and regional air pollution and the effects onecosystems,species,humanhealthandtheeconomy. BruneiDarussalam, Indonesia,Malaysia, and Singapore were seriously affected for several months by the forest firesof1997-1998. Thegovernmentsof the regionbegana jointeffort tomonitor,preventandmitigatesuchhazardsbyestablishingtheASEANAgreementonTransboundaryHazePollution(orASEANHazeAgreement)inNovember2003.PotentialhotspotsareregularlyidentifiedforeachcountryandcompiledandpublishedthroughtheASEANHazeWatch.Not only are there concerns for air quality as it pertains to human health but studies have also lookedattheimpactsonrainwateracidityandeffectsonecosystems.However,ananalysisofrainwaterinBruneiDarussalamduringseverehazeepisodesinBorneoin1994,1997,and1998failedtorevealanysignificantimpactsonrainwateracidityorwetdepositionofhydrogenions(Radojevic andTan,2000).
4.2 Climate Change and Species Distribution
Currentglobalchangesinclimatehavearousedinterestinassessingthesensitivityofnativespecies to climate change and the implication for biodiversity conservation. In addition to its interactions with existing fire regimes and air pollution, changes in climate affect ecosystems by shifting species ranges, composition and migration patterns; altering wildlife habitat, landscapes and succession patterns; and interacting with insect pests and pathogens (Blateet al.,2009;IPCC,2000).TheIPCC(2007)reportsthatupto30%ofspeciesareatincreasingriskofextinctionandapproximately15%-40%ofecosystemsarebeingaffectedbyclimatechange.InSoutheastAsiatherehasbeenageneralincreaseof0.1degreeCto0.3degreeCincreaseintemperaturebetween1951and2000withageneraldeclineinthenumberofrainydays,whereasinthePhilippinetheannualmeanrainfallhasincreasedsince the 1980s. There is some variability in rainfall patternswithin countries, such asIndonesia with increased rainfall in the northern regions and a decreasing rainfall in the southernregion(IPCC,2007).Globalwarmingpotentiallycausesspeciestomovetohigherelevations in search of more suitable habitat. In an analysis of the elevational distribution ofSoutheastAsianbirdsfrom1971-1999,Peh(2007)observedanupwardshiftoflowerandupperboundariesfor94commonresidentspeciesinresponsetoglobalwarming.Theupward shift occurred irrespective of habitat specificity, implying that climate change is an additional factor to anthropogenically-induced habitat destruction and biodiversity decline in Southeast Asia.
TheorangutanhabitatinIndonesiahasbeeninfluencedbythesynergyofclimate,rainfallandotherfactors.TheElNinoeventof1997-1998withincreasedhot,dryanddroughtweatheraffectedthephenologyincludingpollenpatternsoftreesinareassuchastheKayanMetarangNationalPark.Thisledtoadecreaseinthefoodsupplyasfruitproductivityfellduring1998-1999-2000resultinginthemigrationoforangutanstootherareas.Thefallinfruitproductivityalsoaffectedotheranimals.Itispredictedthatclimatechange(inconcertwith other factors of human induced habitat loss, hunting and trades)will continue tochallengeorangutanconservationinIndonesia(SuhudandSaleh,2007).
Species extinction as a result of climate change is also a possibility as local factors such as land-use change, increased atmospheric carbon dioxide, and invasive species interact with globalwarming(PoundsandPuschendorf,2004).Thomasetal.,(2004)inasampleof1,103landplantsandanimalsinterrestrialregionsfromMexicotoAustraliasuggestthat15-37%ofspecieswouldbecomeextinctby2050becauseofclimatechange,whereasotherstudies

Section 4 Climatic Impacts and Biodiversity Loss
34
suggestanarrowerrangeofspeciesextinctionof20-30%ifthereisgreaterthan1.5-2.5°Cintheglobalaveragetemperature(IPCC,2007).Kitayama(1996)reportedthatwaterstressoccasionedbytheElNinoof1991-1992resultedinmorphologicaladaptationsinplantsinmontane environments.
Pine forests in Southeast Asia are affected by fuelwood collection; unsustainable resintapping and deforestation has also decreased their area. In concert with these factors, the additional climate change threatens their growth and distribution. In a study of the impact ofclimatechangeonthedistributionoftwopinespecies(Pinus kesiya and P. merkusui),vanZonneveldet al.,(2009)foundthatonlyfewareasinmainlandSoutheastAsiawillbesuitableforthespeciesby2050.IntheMalayArchipelago,climatechangemayfavourP. mekusiiplantations.However,temperaturesintheforestsineasternThailandandnorthernCambodiaareexpectedtoincreasebeyondthetolerancerangeofthesespeciesthereforethreatening these species in combination with other factors such as diseases and insect pests whose virulence may also be triggered by climatic factors. A combination of the human induced stresses – forest burning, fragmentation and degradation – and other climate-driven factors such as outbreaks of insects and pests, drought and heat may lead to forest dieback.Allen(2009)inaglobalreviewlistsseveralexamplesofdroughtrelatedmortalitiesincludingDipterocarpaceaeintropicalmoistforestsinBorneo,Malaysia(Allen,2009).
Section 5 Policy Responses and Conclusion
35
Clearly,severalofthestressfactorsaffectingbiodiversitylossareanthropogenicinnature.These pressures relate directly to policy directions undertaken at the national level. The policies,whileservingtofulfillafewobjectives,suchas increaseinGDPorconservationof forests, have had undesirable impacts on the biodiversity and welfare of the people immediately dependent on such resources for their livelihoods. Of greater importance is the fact that while the vulnerability of the several countries in the region due to climate change is high, their adaptive capacities, as can be evidenced from socio-economic factors, technologicalandinfrastructuraldevelopmentarenotatpar(YusufandFrancisco,2009).Broadly,policyresponseshavebeendesignedonthefollowingcategories:
Monitoring and regulation
Lossofbiological resources through tradeandotherflows fromthe regionshasbeenwell acknowledged. The trade of wildlife has been targeted by important multi-lateral environmentalagreementssuchasCITES.Howeverthemulti-facetednatureoftheissueand the number of stakeholders involved both from the supply and the demand sides of thetradechainmaketheenforcementofsuchmechanismsdifficult.ForS.E.Asiathereisageneral lack of knowledge concerning the nature, causality and interlinkages of the trade ofendangeredspecies(WorldBank,2008).TheWorldBankandTRAFFIChaveidentifiedkeyareasandlaiddownanumberofdifferentinterventionsinordertominimizeillegaltrade of endangered species and as a result the risk it poses on biodiversity in the region. These range from improved monitoring mechanisms, inclusion of wildlife trade concerns in planning of infrastructure development, targeting interventions towards powerful groups in the trade chain, building multi-agency and cross jurisdictional law enforcement capacity and multi-lateral enforcement in the region, and have a balanced mix between positiveincentives(forprevention)andpenalties(WorldBank,2008:68-74).
Similarly, periodic assessments of the impacts of climate change mitigation on biodiversity arenecessary.Thereisaneedtodevelopstrategiesforoptimizingbiodiversityconservationand ecosystem servicesmanagement. The IPCC has proven effective at providing theleading scientific review of climate change through corporative global efforts. Likewise theproposed IntergovernmentalScience-PolicyPlatformonBiodiversityandEcosystemServices can provide the international science-policy interface that is needed for biodiversity15. That could enable a scientific framework for tackling changes to biodiversity and aligning conservation priorities with ecosystem services.
Land use strategies
The foregoing arguments in the report do imply the need for encouraging resilient and sustainable landuse strategies in the region.Conversionof the tropical forests foroilpalm plantations to meet growing biofuel demand has resulted in several natural and socio-political complications. Some suggestions to mitigate the impact while still making use of the opportunity arising from global demand include: shifting the production of biofuel crops to degraded/abandoned agricultural lands; adoption of improved and ecosystem friendly management practices; development of certification schemes with
15IPBES[http://www.ipbes.net/]
5. Policy Responses and Conclusion

Section 5 Policy Responses and Conclusion
36
the involvementofmultiple stakeholders (suchasbeingdevelopedby theRoundtableonSustainablePalmOil(RSPO);16 and the creation of appropriate financial incentives to ensuresustainableproduction(Stromberget al.,2010).
Another area of concern is the increasing urbanization in the region. While this isconsidered a normal pattern in the cycle of development, it is important that some factors be considered in urban planning that aim to enhance ecosystem resilience. Such policy responses should include in addition to appropriate housing and transportation measures, innovative landscapes that integrate green spaces, urban agriculture and other functional habitats(PuppimdeOliveiraet al.,2010).
Mitigation and adaptation responses
Several innovative mechanisms are being considered to enhance adaptive capacities of different countries in the region in addition to reducing their vulnerability. These include:
i. financial incentives: throughmechanisms such as UN-REDD, carbonmarkets, debtinstruments and biodiversity compensation or offset schemes, payments for ecosystem services and funding for adoption of various measures related to reducing deforestation and degradation of natural ecosystems and/or to undertake additional measures to mitigateclimatechange(suchasthroughCleanDevelopmentmechanisms);
ii. livelihood enhancement: schemes that ensure income diversity and security to local communities and primary producers.
AsnotedbytheWorldBank(2010),theuseofprotectedareastoconserveecosystemsand species is not sufficient, as species range have the potential to shift beyond the protected areas. Therefore there is need to complement protected areas with innovative land management strategies such as creation of ecoagricultural landscapes. An ecoagricultural landscape is one in which farmers or land managers create mosaics of farmland and natural habitats to sustain food production, secure rural livelihoods and conservebiodiversityandecosystemservices(McNeelyandScherr,2003).Thelandscapeperspective links farm or forest level actions to the broader ecosystem and also integrates ecosystem thinking with related stakeholder processes.
The recent co-operation between Norway and Indonesia on activities to address greenhouse gas emissions from deforestation, degradation and peatland conversion should help in building adaptation substantially in the Indonesia. The project places an emphasis on participatory planning and livelihood guarantees in the process of achieving the objectives (PurnomoandSaloh,2010)17.
Policymakersneedtorealizethatbiodiversityconservationisnotanautomaticco-benefitofREDD.IfREDDmechanismsonlyemphasizereducingdeforestationrates,thenmarketforces will most likely focus on areas that are cheapest to protect with the implication that biodiversityhotspotareaswillnotbecost-competitive(Graingeretal.,2009).Secondly,
16Formoreinformationrefer(www.rspo.org)17Purnomo,AgusandYaniSaloh,2010.NewapproachcouldbeelixirforIndonesia’sdeforestationmalaise,JakartaGlobe,June32010,from(http://www.thejakartaglobe.com/opinion/new-approach-could-be-elixir-for-indonesias-deforestation-malaise/378593)Accessed18June,2010.
Section 5 Policy Responses and Conclusion
37
REDDemphasizesforestswithhighcarbondensity.Thoughthereisconsiderableoverlapof global carbon storage and biodiversity in terrestrial ecosystems, the synergies between carbon stocks and species richness are unevenly distributed (Strassburg et al., 2010).Besides,notallbiodiversityhotspotsareforests.Thismeansthatsomehigh-biodiversityregions, would not benefit from carbon-focused conservation, and could become under increased pressure if REDD is implemented (Myers et al., 2000). Thirdly, deforestationprocessesthatarenoteffectivelyhaltedbyREDDmaybedisplacedtootherareaswithinoroutsideacountry(GanandMcCarl,2007).NeverthelessinalllikelihoodREDDpluswill deliver some biodiversity benefits with measures to further incorporate rules to conservebiodiversityinallREDDprojects,whilstprivateconservationfundingthatwouldnototherwisebeeligibleforREDDfundingcouldberedirectedandfocusedonforestsof high biodiversity value. Appropriate monitoring and reporting of sub-national and transnational leakages should be a top priority. As highlighted elsewhere, livelihoods and practices of several indigenous and local communities are dependent on these biodiversity rich ecosystems, requiring careful analysis of the implications of such projects to their wellbeing.
Research and Information, Education
Addressing the impacts of climate change in this region requires both mitigation and adaptation responses with strong links between scientists and natural resources managers (Blateet al.,2009).Impactadaptationmayincludelivelihoodsdiversification(decreaseddependenceonagricultureandforestresources)orchangeinmanagementtechniques(Rubio,2007;Kaufmann,1998).Blateet al.(2009),alsolistseveraladaptationoptionsfor US forests some of which may be applicable to Southeast Asia. There is still a paucity of scientific information in Southeast Asia on the adaptive capacity of specific ecosystems toadapttoclimatechange.However,giventhevalueoftheseecosystemsandagriculturalsystems to human development in Southeast Asia and the global significance of Southeast Asian forests it is important that policy makers and scientist accelerate both country and regional efforts to understand and adapt to the potential effects of climate change and anthropogeniclandchanges.Forconservationeffortstobesuccessfulthereistheneedto build public support through awareness campaigns on the magnitude of biodiversity decline and the implications for social and environmental sustainability.
Collaborativeresearchandresponsesbetweenregionalscientists,planners,policymakersand the private sector looking at simulating climate change with different scenarios, informationsharingandmitigationandadaptationmeasuresareessential(Tuan,2009).There is also need for additional research on the links between climate change, biodiversity andeconomicdevelopment intheSEAregion(ASEANCentreforBiodiversity,2010)18. Universities in Asia are increasingly sharing their successes and challenges in community empowerment and climate change adaptation research in an effort to strengthen the role of higher education in transferring and applying new knowledge to the challenges of societyand local communities.Universities inKoreaand Indonesia for examplearefurther exploring programmes on climate change adaptation to increase the adaptive capacity of communities and practical education addressing the vulnerability of natural ecosystem(Tumiran,2009).TheUniversityNetworkforClimateandEcosystemsChangeAdaptationResearch(UN-CECAR)isapromisinginitiativethatcannarrowthedisparities
18ASEANCentreforBiodiversity[http://www.aseanbiodiversity.org]
Section 5 Policy Responses and Conclusion
38
between higher education institutions and academics across the region with respect to climate change adaptation research.
Several issues related to climate change are symptomatic of a greater malaise affecting ecosystems and resources that help regulate nutrient cycling processes. Recent literature, as seen in the foregoing, points to increasing concern and measures being taken to address the problem of biodiversity decline, especially in the hotspot regions of Southeast Asia. It is hoped that the momentum being generated would result in appropriate policy and economic measures based on appropriate scientific evidence and ground scenarios.

References
39
ADB, undated. ADB environmental statistics table: RETA 5555 – Environmental Statistics Philippines.Availableat<www.adb.org/Statistics/Environment/Ctry.asp>[Accessed30April2009].
Allen,C.D.,2009.Climate-inducedforestdieback:anescalatingglobalphenomenon?Unasylva,60,43-49.
ASEANCentreforBiodiversity,2010.Availableat<http://www.aseanbiodiversity.org/>[Accessed18June2010].
Blate,G.M., Joyce, J., Littell, J.S.,McNulty, S.G.,Millar, C.I.,Moser, S.C.,Neilson, R.P.,O’Halloran, K.,Peterson,D.L.,2009.AdaptingtoclimatechangeinUnitedStatesnationalforests.Unasylva,60,57-62.
Butchart,S.H.M.,Walpole,M.,Collen,B.,vanStrien,A.,JörnP.W.Scharlemann,J.P.W.,Almond,R.E.A.,Baillie, J.E.M., Bomhard,B., Brown, B., Bruno, J., Carpenter, K.E., Carr, G.M., Chanson,J., AnnaM.Chenery,A.M.,Csirke,J.,Davidson,N.C.,Dentener,F.,Foster,M.,Galli,A.,Galloway,J.N.,Genovesi,P.,Gregory,R.D.,Hockings,M.,Kapos,V.,Lamarque,J-F.,Leverington,F.,Loh,J.,McGeoch,M.A.,McRae,L.,Minasyan,A.,Morcillo,M.H.,Oldfield,T.E.E.,Pauly,D.,Quader,S.,Revenga,C.,Sauer,J.R.,Skolnik,B.,Spear,D.,Stanwell-Smith,D.,Stuart,S.N.,Symes,A.,Tierney,M.,Tyrrell,T.D.,Vié,J-C.,Watson,R.,2010.GlobalBiodiversity:IndicatorsofRecentDeclines.Science,328,1164-1168.
Butler,R.A.,Laurence,W.F.,2008.NewStrategiesforConservingTropicalForests.TrendsinEcologyandEvolution,23,469-472
Bytnerowicz, A., Arbaugh,M., Riebau,A., Andersen,C., (Eds.), 2009.Wildland fires and air pollution.DevelopmentinEnvironmentalSciences8,Elsevier,Amsterdam.
Casellini, N.,Minh, N.C., Phong, T.L., 2001. The integration of economicmeasures into the NationalBiodiversityStrategiesandActionPlansofVietnamandSoutheastAsia.IUCN,Gland.Availableat
<http://www.unep.org/bpsp/Economics/SE%20Asia%20(Economics).PDF>
Choi,G.,Collins,D.,Ren,G.,Trewin,B.,Baldi,M.,Fukuda,Y.,Afzaal,M.,Pianmana,T.,Gomboluudev,P.,Huong,P.T.T.,Lias,N.,KownW.T.,Boo,K.,Cha,Y.,Zhou,Y.2009.ChangesinmeansandextremeeventsoftemperatureandprecipitationintheAsia-PacificNetworkregion,1955–2007.InternationalJournalofClimatology,29,1906-1925.
CITES,2010.CITEStradedatabase.ConventionfortheInternationalTradeinEndangeredSpeciesofWildFaunaandFlora(CITES).Availableat<http://www.unep-wcmc.org/citestrade/novice.cfm?CFID=41018415&CFTOKEN=78630545>[Accessed20June2010]
ConservationInternational,2009.Availableat<www.conservation.org>[Accessed21April2009].
Conway,T.,1998.Aframeworkforassessingtherelationshipsbetweentradeliberalizationandbiodiversityconservation.InternationalInstituteforSustainableDevelopment(IISD)andUnitedNationsEnvironmentProgramme(UNEP).Availableat<http://www.iisd.org/pdf/tradelib_biodiv.pdf>[Accessed20June2010]
Corlett, R., 2003.Climate change andbiodiversity in tropical EastAsian forest. Paper presented at theGlobal ClimateChange and Biodiversity Conference, University of East Anglia, Norwich. Available at<http://www.unep-wcmc.org/resources/publications/GCCB2003.pdf>[Accessed5March2010].
Crutzen,P.J.,Andreae,M.O.,1990.BiomassBurningintheTropics:ImpactonatmosphericchemistryandbiogeochemicalCycles.Science,250,1669-1678.
Danielsen,F.,Beukema,H.,Burgess,N.D.,Parish,F.,Bruhl,C.A.,Donald,P.F.,Murdiyarso,D.,Phalan,B.,Reijnders,L.,Struebig,M.,Fitzherbert,E.B.,2009.Biofuelplantationsonforestedlands:doublejeopardyforbiodiversityandclimate.ConservationBiology,23,348–358.
Dauvergne,P.,1997.Shadowsintheforest:JapanandthepoliticsoftimberinSoutheastAsia.MITPress,Boston.
DowntoEarth,2005.NewsletterNo66.Availableat<http://dte.gn.apc.org/66.pdf>[Accessedon15July2010].
Dumbrell,A.J.,Hill,J.K.,2005.Impactofselectiveloggingoncanopyandgroundassemblagesoftropicalforestbutterflies:implicationsforsampling.BiologicalConservation,125,123-131.
References

References
40
FAO,2004.FertiliserusebycropinMalaysia.FoodandAgriculturalOrganisation,Rome.Availableat<ftp://ftp.fao.org/agl/agll/docs/fertusemalaysia.pdf>[Accessed20May2010]
FAO,2005a.GlobalForestResourcesAssessment2005.FoodandAgriculturalOrganisation(FAO),Rome.Availableat<http://www.fao.org/docrep/008/a0400e/a0400e00.htm>[Accessed13March2010]
FAO,2005b. Fertiliserusebycrop in Indonesia. FoodandAgriculturalOrganisation,Rome.Availableat<ftp://ftp.fao.org/agl/agll/docs/fertuseindonesia.pdf>[Accessed20May2010]
FAO,2006.FAOStatisticalYearbook,2005-2006.FoodandAgriculturalOrganisation(FAO),Rome.
FAO,2009.StateoftheWorld’sForests2009.FoodandAgriculturalOrganisation(FAO),Rome.Availableat<http://www.fao.org/docrep/011/i0350e/i0350e00.htm>[Accessed20March2010]
FAO, 2010a. Change in extent of forest and other wooded land 1990-2005. . Food and AgriculturalOrganisation (FAO), Rome. Available at <http://www.fao.org/forestry/32033/en/> [Accessed 18 June2010]
FAO,2010b.FAOSTATdatabases.FoodandAgriculturalOrganisation (FAO),Rome.Availableat<http://faostat.fao.org/>[Accessed3August2010]
Fargione,J.,Hill,J.,Tilman,D.,Polasky,S.,Hawthorne,P.,2008.Landclearingandthebiofuelcarbondebt.Science,319,1235-1238.
FIAM,2009.EvolutionoffertilizerusebycropsinMalaysia:Recenttrendsandprospect.FertilizerIndustryAssociation of Malaysia (FIAM), Sham Alam. Available at < http://www.fertilizer.org/ifa/Home-Page/LIBRARY/Conference-papers/Crossroads-Asia-Pacific-Conferences/2009-Crossroads-Asia-Pacific>[Accessed20May2010]
Fitzherbert,E.B.,Struebig,M.J.,Morel,A.,Danielsen,F.,Bruhl,C.A.,Donald,P.F.,Phalan,B.,2008.Howwilloilpalmexpansionaffectbiodiversity?TrendsinEcologyandEvolution,23,538-545.
Foley,J.A.,Asner,G.P.,Costa,M.H.,Coe,M.T.,DeFries,R.,Gibbs,H.K.,Howard,E.A.,Olson,S.,Patz,J.,Ramankutty,N.,Snyder,P.,2007.Amazoniarevealed:ForestdegradationandlossofecosystemgoodsandservicesintheAmazonBasin.FrontiersinEcologyandtheEnvironment,5,25-32.
Fox, J., Volger, J. B., 2005. Land-use and land-cover change in montane mainland Southeast Asia.EnvironmentalManagement,36,394-403.
Ga-ab,M.,2008.StatusandchallengesofprotectedareasinCordilleraregion,Philippines:Localgovernmentperspective.PaperpresentedattheEquityandLivelihoodssessionofthe2008Asia-Pacificforestryweek,Hanoi. Available at <http://www.recoftc.org/site/fileadmin/docs/Events/Asia_Pacific_Forestry_Week/3_PA_in_Cordillera.pdf>[Accessed20January2010]
Gan,J.,McCarl,B.,2007.Measuringtransnationalleakageofforestconservation.EcologicalEcononmics,64,423–432.
Grainger,A.,BoucherD.H.,Frumhoff,P.C.,Laurance,W.F.,Lovejoy,T.,McNeely,J.,Niekisch7,M.,Raven,P.,Sodhi,N.S.,Venter,O.,Pimm,S.L.2009.BiodiversityandREDDatCopenhagen.CurrentBiology,19,974-976
Germer,J.,Sauerborn,J.,2008.Estimationoftheimpactofoilpalmplantationgasbalance.Environment,DevelopmentandSustainability,10,697-716.
Gibbs,H.,Johnston,M.,Foley,J.A.,Holloway,T.,Monfreda,C.,Ramankutty,N.,Zaks,D.,2008.Carbonpayback times for crop-based biofuel expansion in the tropics: the effects of changing yield and technology.EnvironmentalResearchLetters,3,034001doi:10.1088/1748-9326/3/3/034001.
Gullison,R.E.,Frumhoff,P.C.,Canadell,J.G.,Field,C.B.,Nepstad,D.C.,Hayhoe,K.,Avissar,R.,Curran,L.M.,Friedlingstein,P.,Jones,C.D.,Nobre,C.,2007.TropicalForestsandClimatePolicy.Science,316,985–986.
Guo, L. 2007. East Asia: Land Programs, Regional Challenges, and Ways for moving forward.World Bank, Washington DC. Available at <http://siteresources.worldbank.org/INTARD/Resources/335807-1194987153844/EAPPPTLiGuo.ppt>[Accessed20January2010]
References
41
Hamer,K.C.,Hill, J.K.,Benedick,S.,Mustaffa,N.,Sherratt,T.N.,Maryati,M.,Chey,V.K.,2003.Ecologyofbutterflies innatural and selectively logged forestsofnorthernBorneo: the importanceofhabitatheterogeneity.JournalofAppliedEcology,40,152-160.
Hewitt,C.N.,MacKenzie,A.R.,DiCarlo,P.,DiMarco,C.F.,Dorsey,J.R.,Evans,M.,Fowler,D.,Gallagher,M.W.,Hopkins,J.R.,Jones,C.E.,Langford,B.,Lee,J.D.,Lewis,A.C.,Lim,S.F.McQuaid,J.,Misztal,P.,Moller,S.J.,Monks,P.S.,Nemitz,E.,Oram,D.E.,Owen,S.M., Phillips,G.J.,Pugh,T.A.M., Pyle, J.A.,Reeves,C.E.,Ryder,J., Siong,J.,Skiba,U.,Stewart,D.J.,2009.Nitrogenmanagement isessential toprevent tropical oil palm plantations from causing ground-level ozone pollution. Proceedings of theNationalAcademyofSciences,106,18447-18451.
IPCC,2000.EmissionsScenarios.CambridgeUniversityPress,Cambridge.Availableat<http://www.ipcc.ch/ipccreports/sres/emission/index.php?idp=0>
IPCC,2002.ClimatechangeandbiodiversityIPCCWorkingGroupII,Availableat<http://www.ipcc.ch/pdf/technical-papers/climate-changes-biodiversity-en.pdf>
IPCC,2007.ClimateChange2007:Impacts,adaptationandvulnerability.ContributionofWorkGroupIItotheFourthAssessmentReportoftheIntergovernmentalPanelonClimate.CambridgePress,Cambridge.CambridgeUniversityPress,Cambridge.Availableat<http://www.ipcc.ch/ipccreports/ar4-wg2.htm>
IUCN2010.IUCNRedListofThreatenedSpecies.Version2010.3.IUCN,Gland.Availableat<http://www.iucnredlist.org/>[Accessed20January2010]
Jarvis,D.I.,Brown,A.H.D.,Cuong,P.H.,Collado-Panduro,L.,Latournerie-Moreno,L.,Gyawali,S.,Tanto,T.,Sawadogo,M.,Mar,I.,Sadiki,M.,Thi-NgocHue,N.,Arias-Reyes,L.,Balma,D.,Bajracharya,J.,Castillo,F.,Rijal,D.,Belqadi,L.,Rana,R.,Saidi,S.,Ouedraogo,J.,Zangre,R.,Rhrib,K.,Chavez,J.L.,Schoen,D.,Sthapit,B.,DeSantis,P.,Fadda,C.,Hodgkin.2008.Aglobalperspectiveoftherichnessandevennessof traditional crop-variety diversitymaintained by farming communities. Proceedings of the NationalAcademyofSciences,105,5326-5331.
Kaufmann,R.K.,1998.TheimpactofclimatechangeonUSagriculture:AresponsetoMendelssohnetal.1994.EcologicalEconomics,26,113-119.
Kitayama,K.,1996.ClimateofthesummitregionofMountKinabalu(Borneo)in1992,anElNinoyear.MountainResearchandDevelopment,16,65-75.
Knutson,T.R.,Tuleya,R.E.,2004. ImpactofCO2-inducedwarmingonsimulatedhurricane intensityandprecipitation: Sensitivity to the choice of climatemodel and convective parameterization. Journal ofClimate,17,3477–3495.
Koh,L.P.,Wilcove,D.S.,2008.Isoilpalmagriculturereallydestroyingtropicalbiodiversity?ConservationLetters,1,60-64.
Kripalani, R.H., Kulkarni, A.S., 1997. Rainfall variability over Southeast Asia- connections with IndianmonsoonandENSOextremes:newperspectives.InternationalJournalofClimatology,17,1155-1168.
Kripalani,R.H.,Kulkarni,A.S.,1998.Therelationshipbetweensomelarge-scaleatmosphericparametersandrainfalloverSoutheastAsia:AcomparisonwithfeaturesoverIndia.TheoreticalandAppliedClimatology,59,1-11.
Kummer,D.,undated.SocioeconomicrootcausesofbiodiversitylossinthePhilippinessummary.Availableat<assets.panda.org/downloads/phil.pdf>[Accessed28April2009]
Lasco,R.D.,2002.ForestcarbonbudgetsinSoutheastAsiafollowingharvestingandlandcoverchange.ScienceinChina(SeriesC),45.55-64.
MA, 2005a. Ecosystems and Human Well-Being: Biodiversity Synthesis. Island Press, Washington, DC.Availableat<http://www.millenniumassessment.org/en/Article.aspx?id=61>
MA, 2005b. Ecosystems and human wellbeing: Current state and trends assessment. Island Press,WashingtonDC.Availableat<http://www.millenniumassessment.org/en/Condition.aspx>
Maffi,L.2007.Bioculturaldiversityandsustainability,in:Pretty,Jules,AndyBall,TedBenton,JuliaGuivant,DavidLee,DavidOrr,MaxPfeffer,HughWard(eds.),TheSAGEHandbookofEnvironmentandSociety,pp.267-277.

References
42
Mcdonald,R.I.,Kareiva,P.,Forman,R.T.T.,2008.Theimplicationsofcurrentandfutureurbanizationforglobalprotectedareasandbiodiversityconservation.BiologicalConservation,141,1695–1703.
McGranahan,G.,Satterthwaite,D.,2003.Urbancenters:anassessmentofsustainability.AnnualReviewofEnvironmentandResources,28,243–274.
Moutinho, P., Schwartzman, S. (Eds.), 2005. Tropical deforestation and climate change. AmazonInstitute of Environmental Research, Brasilia. Available at <http://www.edf.org/documents/4930_TropicalDeforestation_and_ClimateChange.pdf>[Accessed20August2010]
Murdiyarso,D.,Widodo,M.,Suyamto,D.,2002.FirerisksinforestcarbonprojectsinIndonesia.ScienceinChina(SeriesC),45,65-74.
Muyibi, S.A., Ambali, A.R., Eissa, G.S., 2008. Development-inducedwater pollution inMalaysia: Policyimplicationsfromaneconometricanalysis.WaterPolicy,10,193-206.
Myers,N.1985.Tropicaldeforestationandspeciesextinctions-Thelatestnews.Futures,17,451–463.
Myers, N., Mittermeier, R., Mittermeier, C., da Fonseca, G., Kent, J., 2000. Biodiversity hotspots forconservationpriorities.Nature,403,853–858.
NASA,(undated).LandslidesinthePhilippines.NationalAeronauticsandSpaceAdministration,WashingtonDC.Availableat<http://earthobservatory.nasa.gov/IOTD/view.php?id=4079>[Accessed21April2009]
Nepstad,D.,Carvalho,G.,Barros,A.C.,Alencar,A.,Capobianco,P.J.,Bishop,J.,Moutinho,P.,Lefebvre,P.,LopesSilva,U.,Prins,E.2001.Roadpaving,fireregimefeedbacks,andthefutureofAmazonforests.ForestEcologyandManagement,154,395-407.
Ng,J.,Nemora,2008.TheTigerTradeRevisitedinSumatra,Indonesia.TRAFFICSoutheastAsia,PetalingJay.Availableat<http://www.traffic.org/mammals/>[Accessed21July2010]
Nijman, V., 2005a. Hanging in the balance: An assessment of trade in orang-utans and gibbons onKalimantan, Indonesia. TRAFFIC Southeast Asia, Petaling Jaya. Available at <http://www.traffic.org/mammals/>[Accessed21July2010]
Nijman,V.,2005b. Infullswing:Anasssessmentoftrade inorang-utansandgibbonsonJavaandBali,Indonesia. TRAFFIC Southeast Asia, Petaling Jaya. Available at <http://www.traffic.org/mammals/>[Accessed21July2010]
Nijman, V., 2009. An assessment of trade in gibbons and orang-utans in Sumatra, Indonesia. TRAFFICSoutheastAsia,PetalingJaya.Availableat<http://www.traffic.org/mammals/>[Accessed21July2010]
Nijman,V.,Shepherd,C.R.,2009. Wildlife trade from ASEAN to the EU: Issues with the trade in captive-bredreptilesfromIndonesia.TRAFFICSoutheastAsia, PetalingJaya.Availableat<http://www.traffic.org/reptiles-amphibians/>[Accessed21July2010]
Padoch,C.,Coffey,K.,Mertz,O.,Leisz,S.J.,Fox,J.,Wadley,R.L.,2007.ThedemiseofswiddeninSoutheastAsia?Localrealitiesandregionalambiguities.DanishJournalofGeography,107,29-41.
Peh,K.S.H.,deJong,J.,Sodhi,N.S.,Lim,S.L.H.,Yap,C.A.M.,2005.Lowlandrainforestavifaunaandhumandisturbance: persistence of primary forest birds in selectively logged forests and mixed-rural habitats of southernPeninsularMalaysia.BiologicalConservation,123,489-505.
PuppimdeOliveira,J.A.,Balaban,O.,Doll,C.,Gasparatos,A.,Iossifova,D.,Moreno-Penaranda,R.,Suwa,A.,2010.Governance,citiesandbiodiversity:PerspectivesandchallengesoftheimplementationoftheCBDatthecitylevel.UNU-IAS,Yokohama.
Purnomo,A.Saloh,Y.,2010.NewapproachcouldbeelixirforIndonesia’sdeforestationmalaise,JakartaGlobe, June 3 2010. Available at <http://www.thejakartaglobe.com/opinion/new-approach-could-be-elixir-for-indonesias-deforestation-malaise/378593>[Accessed18June2010.
Radojevic,M.,Tan,K.S.,2000.ImpactsofbiomassburningandregionalhazeonthepHofrainwaterinBruneiDarussalam.AtmosphericEnvironment,34,2739-2744.

References
43
Ravallion,M.,vandeWalle,2008.DoesrisinglandlessnesssignalsuccessorfailureforVietnam’sagrariantransition?JournalofDevelopmentEconomics,87,191-209.
Ravindranath,N.H,Murali,K.S.,Sudha,P.,2006.CommunityforestryinitiativesinSoutheastAsia:AReviewofEcologicalImpacts.InternationalJournalofEnvironmentandSustainableDevelopment,59,1-11.
RFA,2008.TheGallagherReviewoftheindirecteffectsofbiofuelsproduction.RenewableFuelsAgency(RFA), London. Available at <http://www.renewablefuelsagency.gov.uk/sites/renewablefuelsagency.gov.uk/files/_documents/Report_of_the_Gallagher_review.pdf>
Rockström,J.,Steffen,W.,Noone,K.,Persson,A.,ChapinIII,F.S.,Lambin,E.F.,Lenton,T.M.,Scheffer,M.,Folke,C.,Schellnhuber,H.J.,Nykvist,B.,deWit,C.A.,Hughes,T.,vanderLeeuw,S.,Rodhe,H.,Sörlin,S.,Snyder,P.K.,Costanza,R.,Svedin,U.,Falkenmark,M.,Karlberg,L.,Corell,R.W.,Fabry,V.J.,Hansen,J.,Walker, B., Liverman,D., Richardson,K.,Crutzen P., Foley, J.A., 2009.A safe operating space forhumanity.Nature,46,472-475.
Rubio,E.T.,2007.ClimatechangeimpactsandadaptationinPeru:Thecaseofpunoandpiura,UnitedNations Development Programme, New York. Available at <http://hdr.undp.org/en/reports/global/hdr2007-2008/papers/trigoso%20rubio_erika.pdf>[Accessed25August2010]
Sala,O.E.,ChapinIII,F.S.,Armesto,J.J.,Berlow,E.,Bloomfield,J.,Dirzo,R.,Huber-Sannwald,E.,Huennecke,L.F.,Jackson,R.B.,Kinzig,A.,Leemans,R.,Lodge,D.M.,Mooney,H.A.,Oesterheld,M.,Poff,N.L.,Sykes,M.T.,Walker,B.,Walker,M.,Wall,D.H.,2000.Globalbiodiversityscenariosfortheyear2100.Science,287,1770–1774.
Schipper,J.,Chanson,J.S.,Chiozza,F.etal.,2008.Thestatusoftheworld’sanimal’s:diversity,threatandknowledge.Science,322,225-230.
Schoppe,S.,2009a.ScienceinCITES:ThebiologyandecologyoftheSoutheastAsianboxturtleanditsusesandtradeinMalaysia.TRAFFICSoutheastAsia,PetalingJaya.Availableat<http://www.traffic.org/reptiles-amphibians/>[Accessed21July2010]
Schoppe,S.,2009b.Status,tradedynamicsandmanagementoftheSoutheastAsianboxturtleinIndonesia.TRAFFIC Southeast Asia, Petaling Jaya. Available at <http://www.traffic.org/reptiles-amphibians/>[Accessed21July2010]
Schweithelm,J.,1998.Thefirethistime:anoverviewofIndonesia’sforestfiresin1997.WWFIndonesia,Jakarta.
SCOPE,2009.Biofuels:Environmentalconsequencesandinteractionswithchanginglanduses.ProceedingsoftheScientificCommitteeonProblemsoftheEnvironment(SCOPE)InternationalBiofuelsProjectRapidAssessment. Available at <http://cip.cornell.edu/DPubS?service=UI&version=1.0&verb=Display&page=current&handle=scope>
Shepherd,C.R.,Nijman,V.,2008a.ThewildcattradeinMyanmar.TRAFFICSoutheastAsia,PetalingJaya.Availableat<http://www.traffic.org/mammals/>[Accessed21July2010]
Shepherd,C.R.,Nijman,V.,2008b.ElephantandivorytradeinMyanmar.TRAFFICSoutheastAsia,PetalingJaya.Availableat<http://www.traffic.org/mammals/>[Accessed21July2010]
Singleton,I.,Wich,S.,Husson,S.,Stephens,S.,UtamiAtmoko,S.,Leighton,M.,Rosen,N.,Traylor-Holzer,K.,(Eds.),2004.Orangutanpopulationandhabitatviabilityassessment:FinalReport.IUCN/SSCConservationBreeding Specialist Group, Apple Valley. Available at <http://www.cbsg.org/cbsg/workshopreports/23/orangutanphva04_final_report.pdf>[Accessed12August2010]
Sodhi,N.S.,Brook,B.W.,2006.SoutheastAsianbiodiversityincrisis.CambridgeUniversityPress,Cambridge,UK.
Sodhi,N.S.,Koh,L.P.,Brook,B.W,NgP.K.L.,2004.SoutheastAsianbiodiversity:animpendingdisaster.TrendsinEcologyandEvolution,19,654-660.
Stern, N., 2007. The Economics of Climate Change The Stern Review. Cambridge University Press,Cambridge. Available at <http://webarchive.nationalarchives.gov.uk/+/http://www.hm-treasury.gov.uk/stern_review_report.htm>
References
44
Stiles,D.,2009a.TheelephantandivorytradeinThailand.TRAFFICSoutheastAsia,PetalingJaya.Availableat<http://www.traffic.org/mammals/>[Accessed21July2010]
Stiles,D.,2009b.AnassessmentoftheillegalivorytradeinVietNam.TRAFFIC,SoutheastAsia,PetalingJaya.Availableat<http://www.traffic.org/mammals/>[Accessed21July2010]
Strand,H.,Hoft,R., Strittholt, J.,Miles,Horning,N., Fosnight, E., Turner,W., (Eds)., 2007. Sourcebookon remote sensing and biodiversity indicators. Secretariat of theConvention on Biological Diversity,Montreal.Availableat<www.cbd.int/doc/publications/cbd-ts-32.pdf>[Accessed12February2010]
Strassburg,B.B.N.,Kelly,A.,Balmford,A.,Davies,R.G.,Gibbs,H.K.,Lovett,A.,Miles,L.,Orme,C.D.L.,,Price,J.,Turner,R.K.,Rodrigues,A.S.L.,2010.Globalcongruenceofcarbonstorageandbiodiversityinterrestrialecosystems.ConservationLetters,3,98-105
Stromberg,P.,Gasparatos,A.,Lee,J.S.H.,Garcia-Ulloa,J.,Koh,L.P.,Takeuchi,K.,2010.Impactsofbiofuelon ecosystem services and biodiversity. UNU-IAS, Yokohama.
Suhud, M., Saleh, C., 2007. Climate change impact on orangutan habitat. WWF-Indonesia, Jakarta.Availableat<http://assets.wwfid.panda.org/downloads/orangutan_impact_en_lores.pdf>
Talaue-McManus,L.,2001.Globalchangeinthecoastalzone:thecaseofSoutheastAsia.,in:Steffen,W.,Jager,J.,Carson,D.J.andBradshaw,C.(eds.),Challengesofachangingearth.ProceedingsoftheGlobalChangeOpenScienceConference,Amsterdam,Springer,Berlin,pp.101-105.
Thomas,C.D.,Cameron,A.,Green,R.E.,Bakkenes,M.,Beaumont,L.J.,Collingham,Y.C.,Erasmus,B.F.N.,deSiqueira,M.F.,Grainger,A.,Hannah,L.,Hughes,L.,Huntley,B.,vanJaarsveld,A.S.,Midgley,G.F.,Miles,L.,Ortega-Huerta,M.A.,TownsendPeterson,A.,Phillips,O.L.,Williams,S.E.,2004.Extinctionriskfrom climate change. Nature,427,145–148.
Tuan,L.A..,2009.ClimatechangeimpactonriceproductionintheMekongriverDelta,Vietnam.HigherEducation for Climate and Ecosystems Change Adaptation Asia. Proceedings of the InternationalWorkshopheldinHaLongBay,pp.27-34.
Tumiran, 2009. Best practice and challenges of integrating education, research, and communityempowerment for strengtheninghigher education’s role in climate changeadaptation- case studyofIndonesia. Highereducation for climateandecosystemschangeadaptationAsia.Proceedingsof theinternationalworkshopheldinHaLongBay.
Turner,B.L.,R.H.Moss,Skole,D.L.(Eds.),1993.Relatinglanduseandgloballand-coverchange:AproposalforanIGBP-HDPcoreproject.ReportfromtheIGBP-HDPWorkingGrouponland-use/land-coverchange.Royal Swedish Academy of Sciences, Stockholm.
UN-DESA, 2009.Worldurbanizationprospects.Departmentof Economic and SocialAffairs (UN-DESA),UnitedNations,NewYork.Availableat<http://esa.un.org/unpd/wup/index.htm>[Accessedon15August2010]
UNDP, 2009. Human Development Report 2009. United Nations Development Programme, New York.Available at <http://hdr.undp.org/en/media/HDR_2009_EN_Complete.pdf > [Accessed on 15 August2010]
vanderWerf,G.R.,Dempewolf, J., Trigg,S.N.,Randerson, J.T.,Kasibhatla,P.S.,Giglio,L.,,Murdiyarso,D.,Peters,W.,Morton,D.C.,Collatz,G.J.,Dolman,A.J.,DeFries,R.S.,2008.ClimateregulationoffireemissionsanddeforestationinequatorialAsia.ProceedingsoftheNationalAcademyofSciences,105,20350-20355.
vanZonneveld.M.,Koskela,J.,Vincenti,B.,Jarvis,A.,2009.ImpactofclimatechangeonthedistributionoftropicalpinesinSoutheastAsia.Unasylva,60,24-29.
WorldBank,2008.What’sdrivingthewildlifetrade?Areviewofexpertopiniononeconomicandsocialdriversof thewildlife tradeandtradecontrolefforts inCambodia, Indonesia,LaoPDR,andVietnam.World Bank, Washington DC. Available at: <http://siteresources.worldbank.org/INTEASTASIAPACIFIC/Resources/226262-1223319129600/wildlife_fullreport.pdf>[Accessed12February2010]
WorldBank,2010.WorldDevelopmentReport.WorldBank,WashingtonDC,USA.
References
45
WRI.,2006.ClimateAnalysisIndicatorsTool(CAIT)on-linedatabaseversion3.0.WorldResourcesInstitute,WashingtonDC.Availableat<www.cait.wri.org>[Accessed15March2009]
Xu, Z.X., Takeuchi,K. Ishidara,H., 2004.CorrelationbetweenElNino SouthernOscillation (ENSO) andprecipitationinSoutheastAsiaandthePacificregion.HydrologicalProcesses,18,107-123.
Yan,J.,Lin,T.,2009.BiofuelsinAsia.AppliedEnergy,86(Supplement),S1-S10.
Yusuf,A.A.,Francisco,H.A.,2009.ClimatechangevulnerabilitymappingforSoutheastAsia.EconomyandEnvironmentProgramforSoutheastAsia(EEPSA),Singapore.Availableat<http://www.idrc.ca/uploads/user-S/12324196651Mapping_Report.pdf>
Zah,R.,Böni,H.,Gauch,M.,Hischier,R.,Lehmann,M.,Wäger,P.,2008.Lifecycleassessmentofenergyproducts:EnvironmentalImpactAssessmentofBiofuels.ETH-EMPA,St.Gallen.Availableat<www.bfe.admin.ch/php/modules/publikationen/stream.php?extlang=en&name=en_667574407.pdf>
Zhai,F.,Zhuang,J.,2009.Agriculturalimpactofclimatechange:ageneralequilibriumanalysiswithspecialreference to Southeast Asia. ADB I Working Paper 131. Asian Development Bank Institute , Tokyo.Availableat<http:www.adbi.org/working-paper/2009/02/23/2887.agricultural.impact.climate.change/>
Zhou,A.,Thoson,E.,2009.ThedevelopmentofbiofuelsinAsia.AppliedEnergy,86(Supplement),S11-S20

46
The United Nations University System
47
The United Nations University System
TheUnitedNationsUniversity (UNU)comprises researchand training institutesandprogrammes located in12countries around the world. The UN University system is led and administered by headquarters based in Tokyo, withoutpostsinBonn,KualaLumpur,NewYork,andParis.TheacademicworkoftheUNUiscarriedoutbyaglobal system of research and training institutes and programmes.
UNU Research and Training Centres or Programmes (RTC/Ps)
UNU-BIOLAC – The UNU Programme for Biotechnology in Latin America and the Caribbean (Caracas,Venezuela)URL http://www.biolac.unu.edu/
UNU-CRIS – The UNU Institute on Comparative Regional Integration Studies(Bruges,Belgium)URL http://www.cris.unu.edu/
UNU-EHS – The UNU Institute for Environment and Human Security (Bonn,Germany)URL http://www.ehs.unu.edu/
UNU-FNP – The UNU Food and Nutrition Programme for Human and Social Development(Ithaca,NewYork,USA)URL http://www.fnp.unu.edu/
UNU-FTP – The UNU Fisheries Training Programme(Reykjavik,Iceland)URL http://www.unuftp.is/
UNU-GTP – The UNU Geothermal Training Programme(Reykjavik,Iceland)URL http://www.unugtp.is/
UNU-IAS – The UNU Institute of Advanced Studies (Yokohama,Japan)URL http://www.ias.unu.edu/
UNU-IIGH – The UNU International Institute for Global Health (KualaLumpur,Malaysia)URL http://www.iigh.unu.edu/
UNU-IIST – The UNU International Institute for Software Technology(Macao,China)URL http://www.iist.unu.edu/
UNU-INRA – The UNU Institute for Natural Resources in Africa(Accra,Ghana)URL http://www.inra.unu.edu/
UNU-INWEH – The UNU Institute for Water, Environment and Health(Hamilton,Ontario,Canada)URL http://www.inweh.unu.edu/
UNU-ISP – The UNU Institute for Sustainability and Peace(Tokyo,Japan)URL http://www.isp.unu.edu/
UNU-MERIT – The UNU Maastricht Economic and Social Research Training Centre on Innovation and Technology(Maastricht,Netherlands)URL http://www.merit.unu.edu/
UNU-WIDER – The UNU World Institute for Development Economics Research(Helsinki,Finland)URL http://www.wider.unu.edu/
UNU Administrative and Academic Service Units
UNU Centre – Tokyo (Japan)URL http://www.unu.edu
UNU Centre – Kuala Lumpur(Malaysia)
The UNU Vice-Rectorate in Europe(UNU-ViE;Bonn,Germany)URL http://www.vie.unu.edu/
The UNU Office at the United Nations(NewYork,USA)URL http://www.ony.unu.edu/
The UNU Office at UNESCO(Paris,France)URL http://op.unu.edu/
United Nations University Institute of Advanced Studies 6F, International Organizations Center Pacifico-Yokohama, 1-1-1 Minato Mirai Nishi-ku, Yokohama 220-8502, Japan
Tel +81 45 221 2300 Fax +81 45 221 2302 Email [email protected] URL http://www.ias.unu.edu
printed on Forest Stewardship Council (FSC)
certified paper using soy-based ink
UNU-IAS Policy Report
Climate and Human-Related Drivers of Biodiversity Decline in
Southeast Asia
Ademola K. Braimoh, Suneetha M. Subramanian, Wendy S. Elliott and Alexandros Gasparatos
Southeast Asia hosts diverse biological resources and cultural milieus that are under different degrees of stress from various factors. This report highlights the key underlying economic, political, and natural factors that contribute to biodiversity decline in the region, and provides specific policy directions that could help address the decline.
ISBN978-92-808-4521-1