climate and global change notes 18-1 urban changes & climate urban heat island urbanization...
TRANSCRIPT

Climate and Global Change Notes
18-1
Urban Changes & Climate
Urban Heat Island
UrbanizationEffects
Mitigation Strategies
Science Concepts
Surface TypesSurface Energy Budget - CitiesOzone - Temperature
Relationship

Climate and Global Change Notes
18-2
Urban Heat Island
How has urban growth changed the climate systemover cities?
• Landsat 7 images from the 1970s, 1980s and 1990s show trends in urbanization
- Note changes in green, i.e., forested area
- For example, Atlanta, GA gobbled up 380,000 acres of trees between 1973 and 1992 - averages about 55 acres of trees per day
1974 1985
1996
Atlanta

Climate and Global Change Notes
18-3
Urban Heat Island
Madison County Growth
2000 – 30% Developed1984 – 13% Developed
LEGENDDeveloped Land
Undeveloped Land
2020 – 50% Developed1990 – 21% Developed
Change: 1984 – 1990 Change: 1990 - 2000

Climate and Global Change Notes
18-4
Urban Heat Island
What happens to the Sun’s energy at the Earth’s surface over a city?
• An acre of forest or cropland receives as much sunlight as an acre of buildings
• Green space will be cooler because of transpiration and shading of the ground
• Urban surfaces get much hotter than
vegetated surfaces during the day.
• They release this energy at night, creating a dome of warmer air at night

Climate and Global Change Notes
18-5
Urban Heat Island
What is “Urban Heat Island”?
• Urban areas are warmer, like an “island” of heat surrounded by cooler rural areas
• Large horizontal temperature gradient exist at the urban/rural boundary, could be as large as 4C/km
• Urban areas appear like a “plateau” with weaker increasing gradient. This
pattern is influenced by distinct intra-urban land uses: open areas, parks,
lakes (cool), dense buildings, commercial areas or industrial areas (warm)
• Intensity of the UHI depends on the urban-rural temperature difference

Climate and Global Change Notes
18-6
Urban Heat Island
Atlanta Urban Heat Island
• Atlanta metro region 9/28/2000 Landsat-7 image
• True-color image (top)
- Urban areas are gray - Wooded suburbs and open fields
are green
• Surface temperature (bottom)
- Yellow areas are relatively cool- Red areas are hot
• Note correlation between hot areas and roads, etc.
QuickTime™ and aTIFF (Uncompressed) decompressor
are needed to see this picture.
http://earthobservatory.nasa.gov/Study/UrbanRain/urbanrain2.html

Climate and Global Change Notes
18-7
Urban Heat Island
Atlanta Urban Heat Island (Con’t)
• Atlanta Central Business District (CBD)
- May 1997
CBD
MidtownResidential
Climate and Global Change Notes
18-8
Urban Heat Island
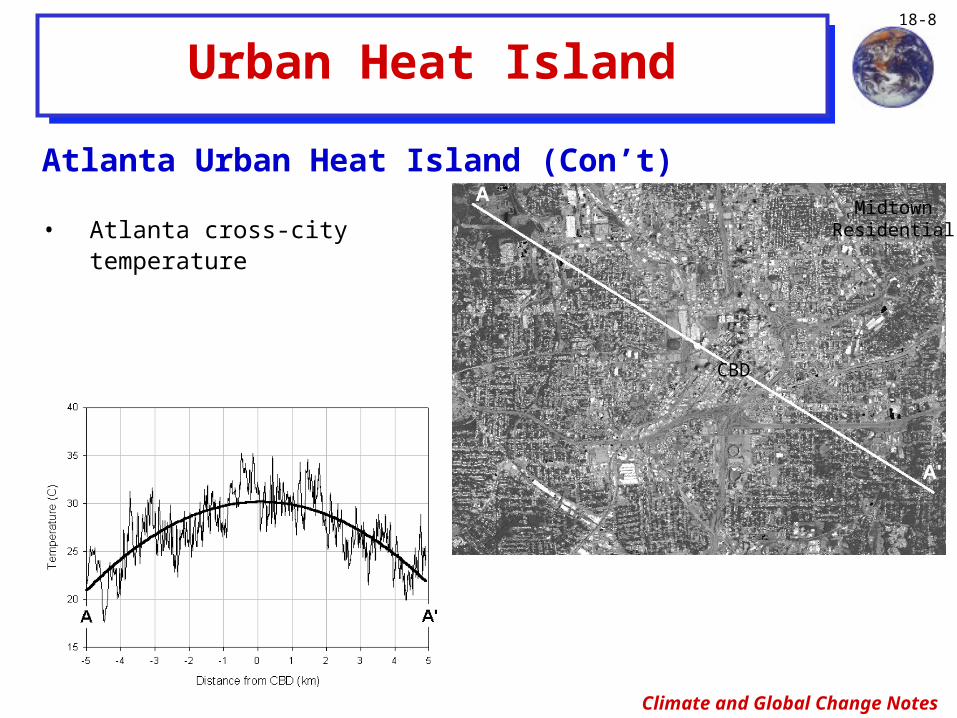
Atlanta Urban Heat Island (Con’t)
• Atlanta cross-citytemperature
CBD
MidtownResidential

Climate and Global Change Notes
18-9
Urban Heat Island Intensity
• Factors below contribute to UHI, relative roles are not certain
• Factors combine to make the urban area store sensible heat during the day,
and inhibit this excess heat from dissipating rapidly at night.
Climate Elements
Altered energy budget terms Features of urbanization underlying energy budget change
Increased absorption of short wave radiation
Canyon geometry - increased surface area and multiple reflection, dark materials (e.g., asphalt
Increased long wave radiation for sky
Air pollution - greater absorption and emission
Decreased long wave radiation loss
Canyon geometry -- reduction of sky view factor
Anthropogenic heat source Waste heat from city buildings and traffic
Increased sensible heat storage Construction materials - increased thermal admittance
Decreased evaporative cooling Construction materials - increased water-proofing, less vegetation, shrubs, and other plants
Decreased total turbulent heat transport
Canyon geometry - reduction of wind speed

Climate and Global Change Notes
18-10
Urban Heat Island
Urban Heat Island Effects• UHI has several direct and indirect
effects; including biological, economic
and meteorological effects
- Increases demand for cooling
energy
- Increases electricity generation
which leads to higher emissions
of SO2, CO, NO, PM, CO2,
accelerates the formation of
harmful smog, higher O3
- Increases chemical weathering
of building materials

Climate and Global Change Notes
18-11
Urban Heat Island Effects (Con’t)
• UHI has several direct and indirect effects; including biological, economic and meteorological effects (Con’t)
- Temperature affects ozone amount
> Increases the thermal destruction of some hydrocarbon-nitratemolecules (peroxyacetyl-nitrate or PANs) that free NO2
> Increases the vegetative emission of VOCs and evaporation of VOCs
Urban Heat Island

Climate and Global Change Notes
18-12
Urban Heat Island
Urban Heat Island Effects (Con’t)
- Induces convergence over city
- Initiates convective activity downwind of city
- Precipitation and cloud cover enhancement occur downwind of city
- Trends of global warming are higher in urban areas; most weatherstations are located near urban areas, which could bias the trends of global warming.

Climate and Global Change Notes
18-13
Urban Heat Island
What can be done to mitigate the effects of urbanization?
• NASA has been flying aircraft over nine cities to determine their thermal characteristics that drive the development of the urban heat island
• Working with city officials, urban planners, architects, schools and other groups to educate and affect change
- Color of roofs- More trees- Better community planning

Climate and Global Change Notes
18-14
Urban Heat Island
Urban Heat Island Summary
• Urban areas are usually warmer than rural areas, especially at night. Under ideal conditions, UHI generates its own circulation, radially inward flow at street level, radially outward flow above.
• First noticed ~170 years ago. Even with numerous studies since the 1960’s,it is still not well-understood.
• Formation of UHI and its magnitude results from urban and geographical characteristics, city size (population, height-to-width ratio), meteorological conditions (wind speed, cloud cover).
• UHI has distinct seasonal behavior, usually greatest in the summer, weakest in the winter.
• UHI not only affects temperature, it affects cloudiness, precipitation and air quality. It also impacts global warming.